Embed Size (px)
Citation preview

OTSEGO DRINKING WATER
SYSTEM MASTER PLAN
February 2020

PROFESSIONAL CERTIFICATION
DRINKING WATER SYSTEM MASTER PLAN
FOR
I hereby certify that this report was prepared by me or under my direct
supervision and that I am a duly Registered Professional Engineer under the laws
of the State of Minnesota.
Name: ________________________
Date: _________________________________________ Registration Number: ________________________
Prepared By:
Advanced Engineering and Environmental Services, Inc.
Water Tower Place Business Center
6901 East Fish Lake Road, Suite 184
Maple Grove, MN 55369
February 24, 2020 48660
Scott Schaefer, PE

Table of ContentsCity of Otsego, MN P05409-2015-007
Table of Contents
Otsego Drinking Water System Master Plan
Acronym List
Executive Summary: Otsego Drinking Water System Master Plan
Water Demand Technical Memorandum
Well Capacity Technical Memorandum
Water Storage: Technical Memorandum
Regulatory Review: Technical Memorandum
Reasonable Alternatives Screening - Treatment: Technical Memorandum
Treatment Alternative Development: Technical Memorandum
Water Improvements Phasing: Technical Memorandum
Existing Equipment Rehabilitation & Replacement Analysis: Technical Memorandum
Appendix
Appendix A: Maps
Appendix B: Water Treatment Plant Figures

Acronym ListCity of Otsego, MN P05409-2015-007
Acronym List
Otsego Drinking Water System Master Plan
AACE Association for Advancement of Cost Engineering InternationalADF Average Daily FlowAMCL Alternative Maximum Contaminant LevelAWWA American Water Works AssociationCIP Capital Improvement Plan -or- Clean In Place (membrane)CWS Community Water SystemD/DBPR Disinfectants-Disinfection By-Products RuleDBP Disinfection By-ProductDNR Department of Natural Resourcesft² Square FootGPAD Gallons per Acre per DayGPCD Gallons per capita per dayGPD Gallons per daygpm Gallons per minuteGSR Ground Storage ReservoirGWR Ground Water RuleHAA5 Five (5) Haloacetic AcidsHGL Hydraulic Grade LineHMO Hydrous Manganese OxideIDSE Initial Distribution System EvaluationIOC Inorganic ChemicalLCR Lead and Copper RuleLRAA Locational Running Annual AverageMCL Maximum Containment LevelMCLG Maximum Containment Level GoalMDH Minnesota Department of Healthmrem milliremMG Million GallonsMGD Million Gallons per Daymg/L Milligram per Literμg/L micro grams per LiterMMM Multimedia MitigationMRDL Maximum Residual Disinfectant LevelMRDLG Maximum Residual Disinfectant Level Goal

Acronym ListCity of Otsego, MN P05409-2015-007
Acronym List
Otsego Drinking Water System Master Planning
NPDWR National Primary Drinking Water RegulationNPW Net Present WorthO&M Operations and MaintenanceOM&R Operations, Maintenance, and RepairOSHA Occupational Safety and Health AdministrationpCi/L pico Curies per LiterPE Population EquivalentpH Negative Logarithm of the Hydronium Ion (Acidity)PH Peak Hourppb parts per billionPRV Pressure Reducing ValvePWS Public Water SystemR&R Rehabilitation and ReplacementRAA Running Annual AverageRECs Residential Equivalent ConnectionsRTCR Revised Total Coliform RuleSCADA Supervisory Control And Data AcquisitionSDWA Safe Drinking Water ActSMCL Secondary Maximum Contamination LevelSOC Synthetic Organic ChemicalTDS Total Dissolved Solid(s)TCR Total Coliform RuleTHM TrihalomethaneTM Technical MemorandumTT Treatment TechniquesTTHM Total Trihalomethane(s)TON Threshold Odor NumberUFRV Unit Filter Run VolumeUS EPA United States Environmental Protection AgencyVOC Volatile Organic ChemicalWHO World Health OrganizationWTP Water Treatment PlantWWTF Wastewater Treatment Facility


Executive Summary
City of Otsego, MN P05409-2015-007
Executive Summary: Otsego Drinking Water System Master
Planning
1 SUMMARY OF RECOMMENDATIONS
AE2S performed an evaluation of the City of Otsego’s Water System, including short-term and long-term projections of future needs, projects, and costs for water supply, storage, treatment, and distribution infrastructure to meet demands and regulatory requirements.
1.1 LONG-TERM PLANNING AND PROJECTIONS
AE2S prepared a Basis of Design for the drinking water system based on available data, land use and population projections, and typical well water characteristics. These values were used as the basis for the long-term projections for future demands and regulatory projections and phasing needs of the water supply, storage, treatment and distribution systems. Details on the preparation of these values is included in the Basis of Design Technical Memorandum (TM). Population and demand projections are summarized in Table ES1.1.
Table ES1.1 Existing and Projected Demands Summary
Current Population Served 11,511
Current Peak Day Demand, MGD 4.9
2080 Population Served ~60,000
2080 Peak Day Demand, MGD ~22.3
A screening of reasonable treatment alternatives was performed, and several alternatives selected for further, in-depth analysis based on the results. The pre-screened alternatives were evaluated based on cost (capital, operations & maintenance, and net present worth) and non-cost criteria through a Kepner-Tregoe analysis to provide weighted scoring. The results of the Kepner-Tregoe analysis aligned with the cost analysis for recommended alternatives. The total cost summaries are presented in Figure ES1.1. Additional details for each alternative and the respective evaluation are located in their respective TMs.
AE2S recommends the City plan for a combination of a dispersed treatment system that will use their existing pump houses and wells, combined with the addition of a centrally located WTP and new wellfield.

Executive Summary
City of Otsego, MN P05409-2015-007
The corresponding TM regarding phasing contains additional details. Additionally, AE2S recommends performing a well siting study to evaluate future wells in a central wellfield.
Figure ES1.1 Alternative Cost Summary ($millions)
1.2 SHORT-TERM PLANNING AND PROJECTIONS (2019-2040)
A phasing plan was developed for the selected alternative. Complete phasing plans and details of the improvements are included in the respective TMs. The addition of wells, towers, WTPs and resulting trunk watermains will be dependent on population growth and resulting water demands.
$93.5
$77.8 $77.2
$25.3
$26.5 $25.7
$118.8
$104.3 $102.8
$0.0
$20.0
$40.0
$60.0
$80.0
$100.0
$120.0
$140.0
Alt. 1 - Gravity
Filtration-2 Larger WTPs
Alt. 2 - Pressure
Filtration- Dispersed
WTP system
Alt. 3 - Combination of
Dispersed & Collector
WTPs
Alternative Costs ($millions)
Capital Cost O&M NPW

Executive Summary
City of Otsego, MN P05409-2015-007
A phasing plan of the key infrastructure projects that are anticipate in the next 20 years is provided in Figures ES1.2, ES1.3 and ES1.4.
Figure ES1.2 Well Phasing: 2019-2040
0.0
2.0
4.0
6.0
8.0
10.0
12.0
14.0
16.0
18.0
2019 2024 2029 2034 2039
-
5,000
10,000
15,000
20,000
25,000
30,000
De
ma
nd
(M
GD
)
Year
Po
pu
lati
on
Otsego Well Capacity and Water Demand
Population Served Maximum Day DemandAverage Daily Demand Well Firm Capacity

Executive Summary
City of Otsego, MN P05409-2015-007
Figure ES1.3 Water Storage Timing: 2019-2040

Executive Summary
City of Otsego, MN P05409-2015-007
Figure ES1.4 Phase Initiation and Operational Triggers: 2019-2040
3000
4000
5000
6000
7000
8000
9000
10000
2019 2024 2029 2034 2039
RECs
Year
Water System - Phase Initiation and Operational Triggers (2019-2040)
Initiate Tower No. 4 (1.5 MG) West System & Connect East & West Systems =
4393 RECS
100
150
200
300
Connect East &
West Systems
Tower No. 4 (1.5 MG) Online = 4675

Executive Summary
City of Otsego, MN P05409-2015-007
Table ES1.2 and Figure ES1.5 detail the projected phases and improvements to occur within the 20-year planning horizon based on population growth projections, as well as projected project dates and costs.
Table ES1.2 Opinion of Probable Project Capital Costs: 2020-2040
Groupings Capital Improvement Project
Projected Project
Initiation Year
Projected Project
On-Line Year
Total Projected Cost
(2019$)
Near Term Improvements
New Well 9 (or 1A) to Replace Well 1 2019 2020 $800,000
Tower No. 4 (1.5 MG) West System 2020 2021 $6,325,000
Connect East & West Systems (Minimum) 2020 2023 $5,482,500
Additional East & West Trunk Watermain (Development driven)
2025 2032 $2,220,000
New Well 10 at Pump House 4 2021 2023 $1,500,000
Satellite WTPs;
Implement over 2 to 3
years
Rehab Pump House 2 (Treatment) 2025 2026 $9,000,000
Rehab Pump House 4 (Treatment) 2025 2026 $3,000,000
Rehab Pump House 3 (Treatment) 2026 2027 $3,000,000
Rehab Pump House 1 (Treatment) 2026 2027 $9,000,000
Large WTP Package
New Well 11 (New Central Wellfield) & Raw Watermain
2029 2031 $1,500,000
New Well 12 (New Central Wellfield) & Raw Watermain
2029 2031 $1,500,000
New Well 13 (New Central Wellfield) & Raw Watermain
2034 2036 $1,500,000
New Well 14 (New Central Wellfield) & Raw Watermain
2038 2040 $1,500,000
WTP 1 & 1 MG Clearwell (Phase 1) 2029 2032 $26,400,000
Trunk Watermain Improvements (Minimum) 2033 2040 $4,620,000
Longer Term Distribution
Improvements
Additional Trunk Watermain Improvements (Development Driven)
2033 2040 $2,355,000
Tower No. 5 (1.5 MG) (Upper Zone) 2034 2035 $6,325,000

Executive Summary
City of Otsego, MN P05409-2015-007
Figure ES1.5 Water Utility CIP – 2020-2040
AE2S also evaluated existing equipment in the City’s water distribution system based on existing equipment age, condition, and projected life. Based on the analysis and discussions with City Staff, AE2S projected the following short-term improvements to be completed to maintain satisfactory operation of each facility (Tables ES1.3 and ES1.4). The following notes apply to these short-term, rehabilitation and replacement (R&R) projections:
• The analysis and projections apply only to the existing wells and towers. No street, fleet, or other facilities or equipment were included.
• Additional notes and assumptions for the short-term R&R projections are included in the respective TM.
$0
$5
$10
$15
$20
$252
02
0
20
21
20
22
20
23
20
24
20
25
20
26
20
27
20
28
20
29
20
30
20
31
20
32
20
33
20
34
20
35
20
36
20
37
20
38
20
39
20
40
An
nu
al E
ncu
mb
era
nce
, $M
M
Otsego Water Utility CIP

Executive Summary
City of Otsego, MN P05409-2015-007
Table ES1.3 Well Rehabilitation Summary (2019$)
Table ES1.4 Storage Rehabilitation Summary (2019$)
Structure
Name Type of Storage
Structure Year
Constructed Year to be
Rehabilitated Estimated
Rehabilitation Cost
Tower 1 Elevated storage 1999 Not scheduled N/A
Tower 2 Elevated storage 2004 2020 $950,000
Tower 3 Elevated storage 2008 Inspection 2027
Reconditioning 2028 $27,000
$1,750,000
Well Year
Installed
Status of
Operatio
n Rehabilitation Schedule*
Estimated
Rehabilitatio
n Cost
Well #1 1994 Emergency
Only To be retired N/A
Well #1
(new) 2020 New 2030 $80,000
Well #2 1998 Emergency
Only 2022 $60,000
Well #3 2001 Active Redeveloped 2007, motor replaced 2014, 2021 $120,000
Well #4 2003 Active Pump and pipe replaced 2019, Inspect 2031 $70,000
Well #5 2003 Active Pump, motor, and pipe replaced 2017, 2027 $70,000
Well #6 2004 Active Pump inspection in 2009, Some pipe and seals replaced 2016, 2027
$70,000
Well #7 2005 Active Pump, motor, and pipe replaced 2017, 2028 $70,000
Well #8 2007 Active Pump replaced 2017, VFD replaced 2018, 2025
$120,000


Basis of Planning-Water Demand
City of Otsego, MN P05409-2015-007
Technical Memorandum: Basis of Planning – Water Demand
Otsego Drinking Water System Master Plan
To: Kurt Neidermeier
Utility Manager
City of Otsego
From: Nancy Zeigler, PE
Scott Schaefer, PE
AE2S
Date: June 18, 2019
Project No: P05409-2015-007
1 SUMMARY
The basis of planning technical memorandum (TM) is used to establish current and projected water
demand for the City of Otsego. Historical data and projections were provided by the city in their
2016 Minnesota Department of Natural Resources (DNR) Water Supply Plan. Future population
data was provided through a land use and planning study completed by the City Engineer and City
Planner. Where data was not available or in need of update, industry standard equations and typical
values were used in conjunction with City input to provide a reasonable determination of existing
and projected water demand.
A detailed list of the existing and projected water demand for the City of Otsego is provided in
Table 1.1. (Attached)

Basis of Planning-Water Demand
City of Otsego, MN P05409-2015-007
2 WATER DEMAND
2.1 HISTORICAL WATER USE
Historical water use is presented in Table 2.1.
Some key water demand factors to note:
Average Daily Demand: The average daily demand (total annual demand divided by 365) has
remained in the 1.0 – 1.1 range since 2007 even with increased population, with a 5-year average
of 1.1 MGD.
Maximum Daily Demand: Maximum daily demand over the past decade does not appear to be
exhibiting an upward or downward trend and has a 5-year average of 3.4 MGD. Maximum day
demand generally occurs during a summer month when precipitation is at its lowest amount and
irrigation is at its highest amount.
Peaking Factor: The water demand peaking factor is the ratio of the average maximum day to the
average day. The DNR has set a goal of reducing the peaking factor to less than 2.6. Otsego had
an average peaking factor of 3.25 for 2010-2015.
Residential Per Capita Water Demand: The DNR has set a goal of reducing the residential per
capita water demand to less than 75 gallons per capita per day (GPCD). The City’s 2010-2015
average was 128 GPCD. However, for the above data set, the population served was calculated as
the number of connections multiplied by 2.8 people/house. This 2.8 conversion is from a Wright
County Population study. In the above table, it was assumed that the Riverbend Mobile Home Park
was one connection. However, there are approximately 400 people living in Riverbend. If the
population served is increased by 400 people, the average residential per capita demand for 2010-
2015 decreases to 120 GPCD. Therefore, 120 GPCD will be used for the current, 2019, demand
and as a base point for future projections.
Total Per Capita Water Demand: The average total per capita water demand presented in the 2016
plan is 145 GPCD. However, data from 2013-2017 shows a decline in average total per capita
demand to 134 GPCD.
Unaccounted (Non-revenue) Loss: Unaccounted for water use is the volume of water withdrawn
from all source water minus the volume of water delivered. The value represents water “lost” by
miscalculated water use due to inaccurate meters, water lost through leaks or water that is used but
unmetered or otherwise undocumented. The DNR has set a goal of reducing unaccounted for water
to less than 10%. Otsego achieves this goal and has an average unaccounted water of 5%.

Basis of Planning-Water Demand
City of Otsego, MN P05409-2015-007
Table 2.1 Historical Water Use (Ref: City of Otsego 2016 DNR Water Supply Plan)
Year Pop.
Served
Total
Conne-
ctions
Residential
Water
Delivered
(MG)
C/I/I
Water
Delivered
(MG)
Water
used for
Non-
essential
Whole-
sale
Deliveries
(MG)
Total
Water
Delivered
(MG)
Total
Water
Pumped
(MG)
Water
Supplier
Services
%
Unmetered/
Unaccounted
Average
Daily
Demand
(MGD)
Max.
Daily
Demand
(MGD)
Date of
Max.
Demand
Residential
Per Capita
Demand
(GPCD)
Total
per
capita
Demand
(GPCD)
2005 3830 1368 N/A 0 201
MG 5 MG
0.6
MGD
2.0
MGD 7/22/2005 144 GPCD
144
GPCD
2006 4967 1774 249 MG 27 MG N/A 0 276 MG 299
MG 5 MG 7.5%
0.8
MGD
3.4
MGD ?/?/2006 137 GPCD
165
GPCD
2007 5681 2029 318 MG 35 MG N/A 0 355 MG 358
MG 5 MG 0.0 %
1.0
MGD
3.1
MGD 7/31/2007 153 GPCD
173
GPCD
2008 5967 2131 293 MG 40 MG N/A 0 339 MG 355
MG 5 MG 3.4%
1.0
MGD
3.0
MGD 6/25/2008 135 GPCD
163
GPCD
2009 6222 2222 306 MG 43 MG N/A 0 349 MG 359
MG 4 MG 2.8%
1.0
MGD
3.7
MGD 6/4/2009 135 GPCD
158
GPCD
2010 6499 2321 305 MG 43 MG N/A 0 348 MG 362
MG 4 MG 2.2%
1.0
MGD
3.1
MGD 7/16/2010 129 GPCD
153
GPCD
2011 6661 2379 310 MG 44 MG N/A 0 354 MG 353
MG 3 MG 0.0%
1.0
MGD
3.3
MGD 9/10/2011 128 GPCD
145
GPCD
2012 7048 2517 396 MG 34 MG N/A 0 429 MG 431
MG 3 MG 0.5%
1.2
MGD
3.2
MGD 7/02/2012 154 GPCD
168
GPCD
2013 7498 2678 360 MG 50 MG N/A 0 409 MG 404
MG 3 MG 0.0%
1.1
MGD
4.0
MGD 8/26/2013 132 GPCD
148
GPCD
2014 7921 2829 326 MG 47 MG N/A 0 375 MG 376
MG 3 MG 0.3%
1.0
MGD
3.6
MGD 8/16/2014 113 GPCD
130
GPCD
2015 8464 3023 343 MG 46 MG N/A 0 392 MG 389
MG 3 MG 0.0%
1.1
MGD
3.2
MGD 8/02/2015 111 GPCD
126
GPCD
Avg.
2010-
2015
7349 2625 340 MG 44 MG N/A 0 385 MG 386
MG 0.5%
1.1
MGD
3.4
MGD 128 GPCD
145
GPCD

Basis of Planning-Water Demand
City of Otsego, MN P05409-2015-007
Through this planning process the City determined a more accurate way of calculating population
served. Instead of using service connections as a basis, the City determines the number of
residential equivalents (REC’s) on City water and multiplies by 2.9 people by household. This
method will more accurately account for multi- family connections such as townhomes and
apartment The 2019 per capita demand using the new method results in a demand of 81 gpcd,
which is closer to the DNR goal of 75 gpcd.
Large Volume Water Users: The ten largest water users are shown in Table 2.2. These customers
account for approximately 9.8% of the annual consumption of water. Most of the demand on the
Otsego drinking water system is residential; six of the top ten water consumers were residential
users. This primarily consists of houses and apartments for drinking, washing, and irrigation needs.
Table 2.2 Top 10 water users (Ref: City of Otsego 2016 DNR Water Supply Plan)
2.2 LAND USE AND POPULATION PROJECTIONS
Water demand projections are dependent on the future land use and resulting future population of
the City of Otsego. The future land use map associated with the full buildout of Otsego was
completed by Hakanson Anderson Associates, Inc. (HAA) and is presented in Figure 2.1
(attached). Projected service populations were determined based on this land use planning effort.
The land use and population planning were determined to occur over an extended time and full
buildout is expected around 2080 with a total population of 61,400 people.
Population projections are included in Table 1.1 (attached). Populations from 2005 through 2018
were based on the City’s data used in the DNR Water Supply Plan adjusted to include additional
Rank Customer Use Category Amount Used
(gal/yr)
Percent of
Total Annual
Water
Delivered
1 Riverbend Mobile Home Park RESIDENTIAL 10,462,000 <3%
2 Holiday Inn & Water Park COMMERCIAL 6,749,000 <2%
3 Knife River Corp. COMMERCIAL 4,966,000 <2%
4 Holiday Gas Station COMMERCIAL 3,468,600 <1%
5 Associa Minnesota RESIDENTIAL 2,235,800 <1%
6 Associa Minnesota RESIDENTIAL 2,197,090 <1%
7 Wildflower Meadows RESIDENTIAL 2,190,100 <1%
8 City of Otsego East WWTF MUNICIPAL 2,065,500 <1%
9 The Pointe Courts RESIDENTIAL 2,059,000 <1%
10 Windsong TH @ Kittredge Crossing RESIDENTIAL 2,050,700 <1%

Basis of Planning-Water Demand
City of Otsego, MN P05409-2015-007
populations for the mobile home park. Population projections between 2019 and 2080 were
interpolated assuming a steady rate of growth.
Current acres for each land use category were based on the Wastewater Master Plan and 2080
acres were based on the land use map. Acres between 2019 and 2080 were interpolated assuming
a steady growth rate.
2.3 FUTURE WATER DEMAND
Future water demands are based on historical water demands, population, and land use projections.
A detailed list of water demand projections from 2020 to 2080 are include in Table 1.1 (attached).
A summary is provided in provided in Table 2.3 and a discussion of key parameters are provided
in the sections that follow.
Table 2.3 Summary of Future Water Demand
2.3.1 Future Residential Water Demand
The projected average day residential demand is equal to the residential per capita per day
multiplied by the projected population. The current adjusted average per capita demand is 120
GPCD. The DNR has recommended that their goals related to residential usage (75 GPCD and a
peaking factor of 2.6) be attained by 2040. The City has set a goal of attaining these, as
recommended. Therefore, the per capita demand used for calculating future water demand is
reduced from 120 GPCD in 2019 to 75 GPCD in 2040 and for planning purposes remains at 75
GPCD beyond 2040.
There is a portion of the City’s population that has private wells and are not served by the City’s
water supply. It was assumed that some of these residents would continue to operate off their
private wells, while others would connect to the City’s water. It was assumed that 0.8 RECs/acre
would connect to the system; this is the same assumption made for the 2018 Wastewater Master
Plan.
Year Pop.
Served
Residential
Per Capita
Demand
(GPCD)
Total per
capita
Demand
(GPCD)
Average
Daily
Demand
(MGD)
Peaking
Factor
Max. Daily
Demand
(MGD)
2019 11511 120 133 1.5 3.2 4.9
2030 20198 96 149 3.0 3.0 9.0
2040 28095 75 157 4.4 2.6 11.5
2060 43890 75 148 6.5 2.6 16.8
2080 60000 75 143 8.6 2.6 22.3

Basis of Planning-Water Demand
City of Otsego, MN P05409-2015-007
2.3.2 Future Non-residential Water Demand
Non-residential water demand consists of commercial, office, industrial and public land use
sectors. Based on 2005-2015 data, the non-residential demand was 70 GPCD. This is lower than
the current industry standard but is reasonable as many of the City of Otsego’s industrial users are
warehouses that exert a small water demand.
To determine future non-residential water demand, projected annual acres for each land use
category were multiplied by a corresponding average gallon per acre per day value for each type
of land use. Acreage water demand values were based on estimated current demands adjusted over
time, if appropriate based on industry standard values and discussions with City staff.
The water demand increases over time for commercial, office, and industrial uses. The City
currently has a relatively low demand of 70 GPCD for its non-residential usage. For planning
purposes, it is anticipated that the City will attract industries that will exert a higher water demand
upon the system.
2.3.3 Max Daily Demand
Peak, or max day, demand is determined by multiplying the average demand by a peaking factor.
The current peaking factor of 3.2 was used for 2019 and then the DNR goal of 2.6 was used for
2040 and beyond.

City of Otsego Drinking Water System Master Planning
Existing and Projected Water Demand
GPCD GPD Acres GPAD GPD Acres GPAD GPD Acres GPAD GPD Acres GPAD GPD MGD MGD MGD GPCD MGD
2005 9,980 3,830 0.6 3.3 2.0
2006 10,698 4,967 0.8 4.3 3.4
2007 11,416 5,681 1.0 3.1 3.1
2008 12,135 5,967 1.0 3.0 3.0
2009 12,853 6,222 1.0 3.7 3.7
2010 13,571 6,499 1.0 3.1 3.1
2011 13,967 6,661 1.0 3.3 3.3
2012 14,363 7,048 1.2 2.7 3.2
2013 14,759 7,498 1.1 3.6 4.0
2014 15,155 7,921 1.0 3.6 3.6
2015 15,551 8,864 1.1 2.9 3.2
2016 16,144 9,457 870 285 1,197 246 1.1 3.1 3.4
2017 16,755 10,068 872 287 1,212 249 1.3 3.2 4.2
2018 17,408 10,721 875 290 1,227 252 1.5 3.6 5.4
2019 18,198 11,511 120 1,381,263 877 50 43,854 292 50 14,608 1,241 70 86,891 255 20 5,095 1.5 133 3.2 4.9
2020 18,987 12,300 118 1,476,032 880 62 54,451 295 57 16,838 1,256 88 110,648 258 20 5,153 1.7 135 3.2 5.3
2025 22,936 16,249 106 1,949,872 892 121 108,340 307 93 28,517 1,330 179 237,411 272 20 5,442 2.3 143 3.1 7.2
2030 26,885 20,198 96 2,423,713 905 181 163,731 320 129 41,085 1,403 269 377,474 287 20 5,731 3.0 149 3.0 9.0
2040 34,782 28,095 75 3,371,394 930 300 279,019 344 200 68,888 1,550 450 697,500 315 20 6,309 4.4 157 2.6 11.5
2050 42,679 35,992 75 4,319,075 955 300 286,589 369 200 73,866 1,697 450 763,650 344 20 6,887 5.5 151 2.6 14.2
2060 50,577 43,890 75 5,266,757 981 300 294,159 394 200 78,844 1,844 450 829,800 373 20 7,464 6.5 148 2.6 16.8
2070 58,474 51,787 75 6,214,438 1,006 300 301,730 419 200 83,822 1,991 450 895,950 402 20 8,042 7.5 145 2.6 19.5
2080 66,687 60,000 75 7,200,000 1,031 300 309,300 444 200 88,800 2,138 450 962,100 431 20 8,620 8.6 143 2.6 22.3
*The GPAD for Commercial/Office/Industrial/Public was previously a single item that has been split into individual items for future projections.
Residential Commercial Office Industrial Public
Land
area Year
Total
population
Population
Served
Projected
per capita
usage
Projected
Daily UseLand area
Projected
per acreage
usage
Projected
Daily Use
Land
area
Projected
per acreage
usage
Projected
Daily Use
Land
area
Projected
per acreage
usage
Projected
Daily Use
Projected
Peaking
Factor
Projected
Maximum
Day
Demand
Projected
Total per
capita
demand
Projected Data
Projected
per acreage
usage
Projected
Daily Use
Avg. Daily
Demand
Peaking
Factor
Maximum
Day
Demand
Projected
Avg.
Daily
Demand
City of Otsego Data

#I#I
#I
#I
"
"
"
"
&%
&%
&%
&%&%
&%
&%
&%
]̂UT
]̂UT
]̂UT
ISTH 94
95th St NE
MNTH 101
60th St NE
70th St NE
CSAH 37
Kadle
r Ave
NE
River Rd
Jason Ave NE
80th St NE Odea
n Ave
NELa
Bea
ux Av
e
CSAH 36
70th St
Page
Ave
65th St
Nash
ua Av
e NE
83rd St NE
Jagle
r Ave
M-20
Parri
sh Av
e NE
96th St NE
Maso
n Ave
NE
Mc A
llister
Ave N
E
78th St NEQuady Ave
77th St NE
96th St
Oakw
ood A
ve
6119
Pack
ard Av
e NE
90th St NE
Ohlan
d Ave
NE
6111
91st St NE
Ocho
a Ave
Ogren
Ave N
E
MSAS 118
O Br
ian Av
e NE
88th St NE
Need
ham
Ave
59th St
Service Rd
Jandel Ave NE
Quale AveM-234
Oakw
ood A
ve N
E
Kahle
r Ave
NE
92nd St NE
James Ave NE
89th St NE
72nd St NE
94th St NE93rd Cir
Nada
lla Av
e NE
Naso
n Ave
NE
77th St NE
70th St NE
MNTH
101
Pack
ard Av
e NE 85th St NE
96th St NE
Pump House #4
Pump House #3
Pump House #2
Pump House #1
Well #8
Well #7
Well #6
Well #5Well #4
Well #3
Well #2Well #1
Water Tower #2
Water Tower #3
Water Tower #1
¯
Newtown TankOverflow = 4100 ft
City ofOtsegoWater
DistributionSystemExisting System
ProposedGravity Sewer
UpsizeExistingGravity Sewer
UpsizeExistingGravity Sewer
Water Facilities]̂UT Water Tower]̂UT Tower Not In Use&% Existing Well" Pump House#I Pressure Reducing Valve
City LimitsWater Distribution Main
16" Water Main12" Water Main10" Water Main8" Water Main6" Water Main4" Water Main3" Water Main
Raw Water Pipe16" Raw Water Pipe12" Raw Water Pipe10" Raw Water Pipe8" Raw Water Pipe6" Raw Water Pipe
Test #22-12 psi
Test #23-24 psi
Future Land UseCommercialIndustrialLD ResidentialLD Residential (Large Lot)LD/MD ResidentialMD/HD ResidentialOfficePublic/Quasi PublicRight-of-WayRuralRural Residential
Advanced Engineering and Environmental Services, Inc.


Basis of Design - WellsCity of Otsego, MN P05409-2015-007
Technical Memorandum: Basis of Planning – Well Capacity
Otsego Drinking Water System Master Plan
To: Kurt NeidermeierUtility ManagerCity of Otsego
From: Nancy Zeigler, PEScott Schaefer, PEAE2S
Date: June 10, 2019
Project No: P05409-2015-007
1 SUMMARY
The basis of design technical memorandum (TM) is used to establish current and projected well capacity for the City of Otsego

Basis of Design - WellsCity of Otsego, MN P05409-2015-007
2 EXISTING SYSTEM
Otsego’s water system consists of 6 active wells at 4 pump houses, 3 elevated water towers, and distribution components including pump stations, pressure reducing valve stations, pipes, valves, and hydrants. The water system consists of a west side and an east side that are currently not joined. For planning purposes, a trunk water main joining the two systems is planned to be in place by 2030.
A map of the water system is shown in Figure 2.1.
2.1 WATER SUPPLY
The City’s 8 wells ranging from 172 to 494 feet deep draw drinking water from the Tunnel City-Wonewoc and Mt. Simon groundwater aquifers (See Table 2.1 and Figure 2.1).
Table 2.1 Water Supply Wells
Well No.
Unique Well No.
Year Installed
Capacity (gpm)
Well Depth (Feet)
Geologic Unit Status
1 554501 1994 400 201 Tunnel City-Wonewoc Emergency Only
2 622715 1998 400 172 Tunnel City-Wonewoc Emergency Only
3 657343 2001 600 370 Tunnel City-Wonewoc Active
4 696888 2003 1000 494 Mt. Simon Active
5 696889 2004 1000 490 Mt. Simon Active
6 709269 2004 1000 343 Mt. Simon Active
7 721663 2005 1000 429 Mt. Simon Active
8 752116 2007 1200 437 Mt. Simon Active
Otsego’s wells are connected to pump houses where chorine is added for disinfection, fluoride is added for dental health and polyphosphate is added for holding iron and manganese in solution. A regulatory review and treatment alternatives will be discussed in future technical memorandums.
The adequacy of a City’s well supply is evaluated based on its firm capacity, which assumes the largest well out of service. To meet the needs of the system, firm capacity should equal or exceed the maximum day demand in accordance with AWWA (American Water Works Association) recommendations. The firm capacity of Otsego’s wells needs to be quantified in terms of an East and West capacity until the two sides are joined by trunk watermain. Well capacities with their corresponding pumping facilities is summarized below.

Basis of Design - WellsCity of Otsego, MN P05409-2015-007
Table 2.2 Well Capacity by Pump House
Capacity Notes
East GPM MGD Pump House No. 1
Well 1 400 0.6Emergency only due to radium; Plan to rehabilitate well in Mt. Simon aquifer
Well 2 400 0.6 Emergency only due to radium
Well 6 1,000 1.4 Well total 1,000 1.4
Pump House No. 2 Well 3 600 0.9 Limited to 600 gpm to avoid pumping sand
Well 8 1,200 1.7
Must be <45% of East System Water Use. Based on agreement with MDH due to
water quality (radium). Well total 1,800 2.6 Total East Capacity 2,800 4.0 Firm East Capacity 1,600 2.3
West Pump House No. 3
Well 4 1,000 1.4 Well 5 1,000 1.4 Well total 2,000 2.9
Pump House No. 4 Well 7 1,000 1.4 Redeveloped in 2018
Total West Capacity 3,000 4.3 Firm West Capacity 2,000 2.9 Total Capacity 5,800 8.4 Total Firm Capacity 3,600 5.2
The total capacity of Otsego’s active wells on the east side is 2,800 gpm (4.0 MGD). The firm capacity of the east side, which assumes the largest well out of service, is 1,600 gpm (2.3 MGD). The total capacity of Otsego’s active wells on the west side is 3,000 gpm (4.3 MGD). The firm capacity of the west side, which assumes the largest well out of service, is 2,000 gpm (2.9 MGD). The resulting total capacity of the City’s entire system is 5,800 gpm (8.4 MGD), with a firm capacity of 3,600 gpm (5.2 MGD).
Basis of Design - WellsCity of Otsego, MN P05409-2015-007
2.2 FUTURE WATER SUPPLY
The City’s future water supply will need to meet future maximum day water demands. Projected future water demands are summarized below.
Table 2.3 Future Water Demand
Year Pop. Served
Average Daily
Demand (MGD)
Peaking Factor
Max. Daily
Demand (MGD)
2019 11,511 1.5 3.2 4.9
2030 20,198 3.0 3.0 9.0
2040 28,095 4.4 2.6 11.5
2060 43,890 6.5 2.6 16.8
2080 60,000 8.6 2.6 22.3
Future water supply will need to come from additional wells or surface water from the adjacent rivers.
2.3 MINNESOTA DEPARTMENT OF NATURAL RESOURCES (DNR) GUIDANCE
A meeting was held with Scott Pearson and James Bedell of the DNR on March 22, 2019 to receive their input on the viability of constructing sufficient wells in the Mt. Simon Aquifer to meet future demands. The DNR provided a general confidence that the City will be able to remain on groundwater through buildout and not be forced to surface water. The DNR requested that the City strive to attain the DNR residential per capita demand goal of 75 GPCD by 2030.
The DNR mentioned that well siting studies should address possible well interference and the impact of fault lines that run through Otsego. They also noted that well interference appears low for wells in the Mt. Simon aquifer, but is possible.
2.4 FUTURE WELLS
A projection of potential future wells to meet the future water demand is provided in Table 2.4. Since the East and West water distribution systems are currently not connected, firm capacity includes 2 wells out of service. The largest well from each side out of service. The East and West water distribution systems are assumed to be connected by 2030 and firm capacity of the connected system includes 1 well out of service after the connection is in place.
The capacity of future wells has been assumed to be approximately 1,000 gpm, resulting in an additional 11 new wells between now and buildout. One of the new wells will be the one currently planned to replace Well 1.

#I#I
#I
#I
"
"
"
"
&%
&%
&%
&%&%
&%
&%
&%
]̂UT
]̂UT
]̂UT
ISTH 94
95th St NE
MNTH 101
60th St NE
70th St NE
CSAH 37
Kadle
r Ave
NE
River Rd
Jason Ave NE
80th St NE Odea
n Ave
NELa
Bea
ux Av
e
CSAH 36
70th St
Page
Ave
65th St
Nash
ua Av
e NE
83rd St NE
Jagle
r Ave
M-20
Parri
sh Av
e NE
96th St NE
Maso
n Ave
NE
Mc A
llister
Ave N
E
78th St NEQuady Ave
77th St NE
96th St
Oakw
ood A
ve
6119
Pack
ard Av
e NE
90th St NE
Ohlan
d Ave
NE
6111
91st St NE
Ocho
a Ave
Ogren
Ave N
E
MSAS 118
O Br
ian Av
e NE
88th St NE
Need
ham
Ave
59th St
Service Rd
Jandel Ave NE
Quale AveM-234
Oakw
ood A
ve N
E
Kahle
r Ave
NE
92nd St NE
James Ave NE
89th St NE
72nd St NE
94th St NE93rd Cir
Nada
lla Av
e NE
Naso
n Ave
NE
77th St NE
70th St NE
MNTH
101
Pack
ard Av
e NE 85th St NE
96th St NE
Pump House #4
Pump House #3
Pump House #2
Pump House #1
Well #8
Well #7
Well #6
Well #5Well #4
Well #3
Well #2Well #1
Water Tower #2
Water Tower #3
Water Tower #1
¯
Newtown TankOverflow = 4100 ft
City ofOtsegoWater
DistributionSystemExisting System
ProposedGravity Sewer
UpsizeExistingGravity Sewer
UpsizeExistingGravity Sewer
Water Facilities]̂UT Water Tower]̂UT Tower Not In Use&% Existing Well" Pump House#I Pressure Reducing Valve
City LimitsWater Distribution Main
16" Water Main12" Water Main10" Water Main8" Water Main6" Water Main4" Water Main3" Water Main
Raw Water Pipe16" Raw Water Pipe12" Raw Water Pipe10" Raw Water Pipe8" Raw Water Pipe6" Raw Water Pipe
Test #22-12 psi
Test #23-24 psi
Future Land UseCommercialIndustrialLD ResidentialLD Residential (Large Lot)LD/MD ResidentialMD/HD ResidentialOfficePublic/Quasi PublicRight-of-WayRuralRural Residential
Advanced Engineering and Environmental Services, Inc.

Table 2.4
City of Otsego Drinking Water System Master Planning
Potential Well Addition
Current
Well Firm
Capacity
New Well to
replace #1
Additional
1000 GPM
Well
Connected
System Firm
Capacity
Additional
1000 GPM
Well
Additional
1000 GPM
Well
Additional
1000 GPM
Well
Additional
1000 GPM
Well
Additional
1000 GPM
Well
Additional
1000 GPM
Well
Additional
1000 GPM
Well
Additional
1000 GPM
Well
Additional
1000 GPM
Well
MGD MGD GPM GPM1000 GPM
WellGPM
2005 9,980 3,830
2006 10,698 4,967
2007 11,416 5,681
2008 12,135 5,967
2009 12,853 6,222
2010 13,571 6,499
2011 13,967 6,661
2012 14,363 7,048
2013 14,759 7,498
2014 15,155 7,921
2015 15,551 8,464
2016 16,144 9,457
2017 16,755 10,068
2018 17,408 10,721
2019 18,198 11,511 1.5 3.2 4.9 3,404 3,600
2020 18,987 12,300 1.7 3.2 5.3 3,696 4,600
2025 22,936 16,249 2.3 3.1 7.2 5,015 5,600
2030 26,885 20,198 3.0 3.0 9.0 6,274 6,600 7,600
2040 34,782 28,095 4.4 2.6 11.5 7,986 8,600 9,600 10,600
2050 42,679 35,992 5.5 2.6 14.2 9,840 11,600
2060 50,577 43,890 6.5 2.6 16.8 11,695 12,600 13,600
2070 58,474 51,787 7.5 2.6 19.5 13,549 14,600 15,600
2080 61,400 60,000 8.6 2.6 22.3 15,471
Notes:
The East and West water distribution systems are currently not connected and firm capacity includes 2 wells out of service. (The largest well from each side out of service.)
The East and West water distribution systems are assumed to be connected by 2030 and firm capacity of the connected system includes 1 well out of service.
Future wells capacity is assumed to be approximately 1,000 gpm.
Unconnected East and West Systems Connected East and West SystemsProjected
Maximum
Day Demand
Projected
Peaking
Factor
Projected
Maximum
Day
DemandYear
Total population
Projected
Avg. Daily
Demand
Pop. Served


Water Storage
City of Otsego, MN P05409-2015-007
Technical Memorandum: – Water Storage
Otsego Drinking Water System Master Plan
To: Kurt Neidermeier
Utility Manager
City of Otsego
From: Jake Puffe, PE
Nancy Zeigler, PE
Scott Schaefer, PE
AE2S
Date: September 26, 2019
Project No: P05409-2015-007
1 SUMMARY
The City of Otsego recognizes that as the population of their service area grows, they will need to
add more water storage facilities in order to accommodate the increase in water demand. As part
of a drinking water system master plan, AE2S has analyzed Otsego’s water distribution system
with regard to the necessary increases in water storage volume. This technical memorandum
discusses the general function of storage facilities and details the design parameters for proposed
future facilities for Otsego.

Water Storage
City of Otsego, MN P05409-2015-007
2 WATER STORAGE VOLUME CONSIDERATIONS
Storage facilities are typically sized to provide: 1) Equalization Storage – to meet hourly system
water demands exceeding supply pumping capacity, 2) Fire Protection Storage – to meet the
demands of firefighting, and 3) Emergency Storage – to provide water reserves for contingencies
such as system failures, power outages, and other emergencies.
2.1 EQUALIZATION STORAGE
A primary function of storage facilities within the distribution system is equalization. Water
demand in most utilities varies significantly throughout the course of the day, and treatment plants
and pumping stations tend to operate most efficiently at a constant rate. In order to meet these
variations in demand, the water utility can vary the source and treatment production, vary the
pumping rate, or provide equalization through the process of filling and draining storage reservoirs
within the distribution system. Equalization storage enables the source, treatment, and pumping
facilities to operate at a predetermined rate, depending on the utility’s preference. Additionally,
equalization storage is generally less expensive than increased capacities of treatment and high
service pumps beyond that required to meet the maximum day demand (MDD). Consequently, it
is desirable to size the source, treatment, and pumping facilities to serve the water needs up to the
MDD and provide equalization storage for meeting peak instantaneous water demands (such as
the peak hour or peak two hour demands). The amount of equalization storage required is a
function of the source, treatment, and pumping capacity, distribution piping capacity, and system
demand characteristics.
The volume of required equalization storage can be determined to equalize the demand variations
with the pumping sequence that occurs during the MDD. Based on experience with water
distribution systems similar to Otsego, volume of equalization storage was assumed to be 15
percent of the MDD. Additionally, equalization storage should be provided within the top 50
percent of the storage tanks/reservoirs, enabling operators to have an operating range that
maintains adequate system pressures and adequate fire and emergency storage within the
distribution system.
The fraction of water production that must be stored during a maximum day as equalization storage
depends on the individual utility, and utility’s operational pumping practices. Options for
operational pumping modes include the following: (1) operate at a constant rate to simplify
operation and reduce demand charges; (2) adjust flow to roughly match demand and minimize use
of storage; (3) pump during off peak hours to take advantage of reduced energy costs; and (4)
operate with a reasonable number of starts per unit time. Table 2.1 provides typical values for the
amount of equalization storage needed as a fraction of the maximum daily demand for the various
operational pumping modes. The values range from a low of zero for variable speed pumping, to
a high of 0.50 for off-peak pumping. The upper range of values are typical for those systems with
higher peak demands, while the lower values are typical for those systems with a flatter daily
demand curve. Since Otsego has multiple source locations with the ability to increase pumping
capacity to respond to high demands, Otsego’s type of operation was determined to be “Follow
Demand (Constant).”

Water Storage
City of Otsego, MN P05409-2015-007
Table 2.1 Typical Equalization Volume Fractions for Various Operational Pumping Modes
Type of Operation Equalization volume needed as a
fraction of maximum daily demand
Constant Pumping 0.10 - 0.25
Follow Demand (Constant) 0.05 - 0.15
Off Peak Pumping 0.25 - 0.50
Variable Speed Pumping 0
2.2 FIRE STORAGE
An important component in providing adequate fire protection is retaining sufficient fire storage
volume within the distribution system. Fire flow requirements for the study area are based on the
ability of the systems to provide adequate fire flow for a specific duration while maintaining
minimum pressures throughout the system. The fire storage volume required for the system is
determined by multiplying the fire demand by the required flow duration of the fire event. Due to
the potential for a number of large buildings in the future, the design fire demand and flow duration
were increased from the currently used 3,000 gallons per minute (gpm) for 3 hours to 4,000 gpm
for 4 hours.
2.3 EMERGENCY STORAGE
Emergency storage provides water for domestic consumption during events such as transmission
or distribution main failures, raw water contamination events, extended power outages, failure of
raw water transmission facilities, failure of WTP facilities (including high service pumps), or a
natural disaster. There are no formulas that exist for determining the amount of emergency storage
required by a utility. Rather, the amount of emergency storage is a policy decision based on an
assessment of the perceived vulnerability of the utility’s water supply, risk of failures, and the
desired degree of system reliability. If a utility has redundant sources and treatment facilities with
auxiliary power, or power supplied from multiple sources, the need for emergency storage may be
relatively small. However, enough emergency storage should be available to handle a catastrophic
pipe break that cannot be isolated easily. If a utility has a single source without auxiliary power
and a relatively unreliable distribution system, a significant volume of emergency storage may be
prudent.
2.4 WATER STORAGE VOLUME CRITERIA
The total volume of required storage is based on a combination of equalization, fire, and
emergency storage. Some engineers use the sum of the three types of storage, while others base
designs on the sum of equalization storage and the larger of either the fire protection storage or
emergency storage. The logic in such cases is that the fire is not likely to occur at the same time
as a critical pipe break or power outage. For the purposes of this analysis, it was assumed that the
total storage needed would be equalization plus the greater of either fire flow storage or emergency
storage. A preliminary assessment of storage volumes required is shown in Table 2.2 and is based
on an initial water demand and fire flow assessment of the water system for this growth area.

Water Storage
City of Otsego, MN P05409-2015-007
2.5 ELEVATED STORAGE VERSUS GROUND STORAGE AND PUMPING
Water storage “floating-on-the-system” is defined as storage volumes located at elevations so that
the hydraulic grade line (HGL) outside the tank is virtually the same as the water level (or hydraulic
grade line for pressure tanks) in the tank. In this type of storage, water can flow freely into and out
of the tank. The converse of this is pumped storage, which refers to water that is stored below the
hydraulic grade line in ground-level or buried tanks so that the water can leave the tank only by
being pumped.
2.5.1 Pumping into a System with an Elevated Storage Tank
A storage tank is considered to be “floating on the system” if the hydraulic grade line in the tank
is generally the same as the hydraulic grade line in the system. Pumping into a system with a
storage tank that floats on the system, whether that tank is an elevated tank or a ground tank on a
hill, usually represents very efficient operation.
A pump discharging into a closed system (meaning there is no storage) must respond
instantaneously to changes in flow because there is no equalization storage. This immediate
response is not necessary when pumping into a zone with a storage tank that floats on the system.
In such cases, a more efficient and less costly constant-speed pump can be used. The pump can be
selected to operate at its most efficient flow and pressure, thus eliminating the inefficiencies
associated with variable-speed drives. Furthermore, if there is sufficient storage floating on the
system, the pressure zone can respond to power outages without the need for a costly generator
and transfer switch.
2.5.2 Pumping into a Closed System with Pump Storage
With pumped storage, the distribution storage has a head lower than the hydraulic grade line
required by the system, so water must be pumped out of the tank to be used. An example would
be a ground-level tank in flat terrain. Such tanks may be attractive in certain instances because
they have a lower capital cost and less visual impact than elevated tanks. At times, this type of

Water Storage
City of Otsego, MN P05409-2015-007
arrangement may be the only way of incorporating an existing tank into a larger system after
annexation or regionalization. In these cases, pumping is required to move water from the tank
into the distribution system. Therefore, operating costs are greater when compared to systems with
tanks that float on the system. In addition, the expense of this type of tank configuration includes
the capital and operating costs of a generator, transfer switch, valving, and controls so that the
system can operate during power outages. Because the hydraulic grade line of the system is higher
than the water surface elevation in the tank, filling the pumped storage tank wastes energy that
must be added again when water is pumped out of the tank. The amount of energy lost depends on
how much lower the water level in the tank is compared to the system hydraulic grade line.
2.5.3 Application of Storage
Equalization and Fire Storage
For equalization storage and fire storage within the water distribution system of a pressure zone,
elevated water storage that floats on the system is recommended. Floating storage provides readily
available storage and provides the most efficient design for this application.
Clearwell and Emergency Storage
For clearwell or emergency storage which is filled from a water supply, water could be pumped
from the wells into the ground storage, then pumped into the distribution system. This application
can provide a large volume of storage at lower capital cost while not requiring water to be re-
pumped at a higher head.
2.5.4 Pumping Requirements
The following are design parameters based on type of pumping configuration to meet system
requirements.
Pumping into an Elevated Tank
• Elevated water storage provides equalization storage for meeting
peak hour demands
• Pumps sized to meet average daily demand on the maximum
demand day
• Prevents large fluctuations in pressure due to changes in pump
operations
• Backup power optional

Water Storage
City of Otsego, MN P05409-2015-007
Pumping into a Closed System
• Pumps sized to meet peak hour demands
• Pump sized to provide fire protection
• Requires larger pumps and larger size water main leaving the
pumping station in order to meet peak hour demands
• Required to provide backup power
3 STORAGE FACILITIES
Otsego currently has 3 elevated tanks that provide the storage for their distribution system. As
the system grows in demand, more facilities will be required to provide the necessary
equalization and emergency storage.
3.1 EXISTING FACILITIES
The existing water storage facilities are shown in Table 3.1.
Table 3.1 Existing Storage Facilities
Storage Facility
Capacity of Storage
Facility
(Million Gallons)
Pressure Zone
Served
Overflow Elevation
(ft)
Water Tower #1 0.40 Low 1055
Water Tower #2 1.00 High 1120
Water Tower #3 1.00 High 1120
Currently the Otsego distribution system is split into effectively 2 different systems. Water Tower
#2 serves the western half of the system and Water Towers #1 and #3 serve the eastern half of the
system. The eastern half has a Low Pressure Zone and a High Pressure Zone, which are separated
by pressure reducing valves (PRV).
3.1.1 Merging the Existing System
The eastern and western halves of the system will eventually be connected by piping to form one
system. This connection will allow the volume from Tower #2 to be used as additional storage in
the eastern half of the system. Although Tower #3 has the same HGL as Tower #2, the storage for
Tower #3 will still be limited to serving the eastern half of the system due to the location of the
pressure zone boundaries. Due to its relatively lower HGL, Tower #1 is limited to serving the
Low Pressure Zone.

Water Storage
City of Otsego, MN P05409-2015-007
3.2 FUTURE FACILITIES
While merging the existing system will provide some level of redundant storage, most of the future
storage volume for Otsego will be provided by new facilities. Analysis of current demands and
projected growth should be ongoing to determine the upcoming storage needs of the distribution
system.
3.2.1 Elevated Storage Facilities
As discussed above, it is recommended to have enough floating storage volume to meet the system
demand equalization and provide some level of fire protection. Based on current population
growth projections and the fire protection scenarios discussed above, an additional volume of 4.5
million gallons (MG) would be required in elevated storage for Otsego’s distribution system. It is
recommended to add this additional storage incrementally in 3 different water towers, each with a
volume of 1.5 MG. These new towers should all be constructed to serve the High Pressure Zone
as shown in Table 3.2. New PRV stations should be added in order to provide additional storage
volume to the Low Pressure Zone.
Table 3.2 Existing & Future Elevated Storage Facilities
Storage Facility
Capacity of Storage
Facility
(Million Gallons)
Pressure Zone
Served
Overflow Elevation
(ft)
Water Tower #1 0.40 Low 1055
Water Tower #2 1.00 High 1120
Water Tower #3 1.00 High 1120
Future Tower #4 1.50 High 1120
Future Tower #5 1.50 High 1120
Future Tower #6 1.50 High 1120
3.2.2 Ground Level Storage Facilities
When Otsego’s distribution system grows to a certain point, a new water treatment facility will be
constructed to provide additional source capacity. This treatment plant will have a clearwell that
will provide some ground level storage. As discussed above, this storage volume will need to be
pumped into the system. In addition to the clearwell, ground storage reservoirs (GSR) with
corresponding pumping stations could be constructed. Ground storage typically has a lower capital
cost than an elevated tank, while still providing emergency storage volume. Based on current
projections for full build-out of Otsego’s distribution system, the recommended ground storage
facilities are listed in Table 3.3.

Water Storage
City of Otsego, MN P05409-2015-007
Table 3.3 Future Ground Level Storage Facilities
Storage Facility
Capacity of
Storage Facility
(Million Gallons)
Pressure Zone
Served
Overflow
Elevation
(ft)
Future WTP 2.00 High N/A
Future GSR 2.00 High N/A
Table 3.4 lists all the existing and recommended storage facilities for the distribution system.
Table 3.4 All Existing & Future Storage Facilities
Storage Facility
Capacity of Storage
Facility
(Million Gallons)
Pressure Zone
Served
Overflow Elevation
(ft)
Water Tower #1 0.40 Low 1055
Water Tower #2 1.00 High 1120
Water Tower #3 1.00 High 1120
Future Tower #4 1.50 High 1120
Future Tower #5 1.50 High 1120
Future Tower #6 1.50 High 1120
Future WTP 2.00 High N/A
Future GSR 2.00 High N/A

Storage AnalysisCity of Otsego
Average to Maximum Day Peaking Factor
5,039 people 5,682 people 28,095 people - people 60,000 people - people
0.71 MGD 0.80 MGD 4.41 MGD - MGD 8.58 MGD - MGD
2.54 MGD 2.86 MGD 11.47 MGD - MGD 22.31 MGD - MGD
WTP Operation
Equalization 0.38 MG 0.43 MG 1.72 MG - MG 3.35 MG - MG
Fire 0.54 MG 0.54 MG 0.96 MG - MG 0.96 MG - MG
Total 0.92 MG 0.97 MG 3.37 MG - MG 5.64 MG - MG
Overall System
WTP Operation
Equalization 0.38 MG 0.43 MG 1.72 MG - MG 3.35 MG - MG
Emergency 0.35 MG 0.40 MG 2.21 MG - MG 4.29 MG - MG
Total 0.73 MG 0.83 MG 4.61 MG - MG 8.97 MG - MG
Overall System
WTP Operation
Equalization 0.38 MG 0.43 MG 1.72 MG - MG 3.35 MG - MG
Emergency 0.55 MG 0.62 MG 3.09 MG - MG 6.01 MG - MG
Total 0.93 MG 1.05 MG 5.50 MG - MG 10.69 MG - MG
Overall System
WTP Operation
Equalization 0.38 MG 0.43 MG 1.72 MG - MG 3.35 MG - MG
Emergency 0.37 MG 0.42 MG 1.98 MG - MG 3.86 MG - MG
Total 0.75 MG 0.85 MG 4.39 MG - MG 8.55 MG - MG
Overall System
6%
15%
No. of Fires
1 3,000 gpm 3 hrs 0.54 MG
1 4,000 gpm 4 hrs 0.96 MG
2 2,000 gpm 4 hrs 0.96 MG
2.00 MG 2.00 MG
0.40 MG 0.40 MG1
1.00 MG 1.00 MG1
1.00 MG 1.00 MG1
1.50 MG 1.50 MG1
1.50 MG 1.50 MG1
1.50 MG 1.50 MG1
2.00 MG 2.00 MG1
10.90 MG 10.90 MG
Demand Scenario
Future Water Tower #6 High 1120 40.00
Future Ground Storage Reservoir High 952 34.00
2080 Scenario
60,000 people
2.60
8.58 MGD
1.34 MG
5.64 MG
1.34 MG
8.97 MG
1.34 MG
10.69 MG
1.34 MG
8.55 MG
22.31 MGD
High
Pressure Zone
Low Pressure
Zone
2018 Scenario 2040 Scenario
1.97 MG 5.50 MG
people
MGD
MGD
10,721
3.60
1.50
5.40 MGD
4.41 MGD
MG
50% Production offline 24 hrs
with 0 hr initial response
Required Storage basd on
Emergency Storage
0.00 MG 0.69 MG
Required Storage based on Fire
Protection
0.00
1.89 MG
2.60
MG 0.69 MG
0.69
Scenario 1
Required Storage basd on
Emergency Storage
MG
3.37 MG
West
Pressure Zone
Average Day Demand
Maximum Day Demand
Pressure Zone Breakdown
Maximum Day Demand
Scenario 2
50% Production offline 24 hrs
with 6 hr initial response
1.56 MG 4.61 MG
4.39
Fire Flow Duration
WTP Operational Storage =
50% Production offline 12 hrs
with 6 hr initial response 1.60 MG
Scenario 3
11.47
Maximum Day Demand based on
2018 Population
Average Day Demand
Population served
Required Storage basd on
Emergency Storage
0.00 MG 0.69 MG
East Pressure
Zone
Maximum Day Demand based on
projected 2080 population
High
Pressure Zone
Low Pressure
Zone
Design Parameters
Maximum Day Demand based on
projected 2040 population
28,095 people
of Maximum Day DemandEqualization Storage =
1 Pressure reducing valves (PRVs) deliver water from High Zone to Low Zone
Water Tower #1
Future Water Tower #4 High 1120 40.00
Water Tower #2
Storage Facility
Overflow
Elevation Head Range
of Maximum Day Demand
Population served
MG0.00
High
WTP Clearwell
High 1120
1120 40.00Water Tower #3
Future Water Tower #5
Total Storage Available
40.00
Capacity of
Storage Facility
Pressure Zone
Served
High 1120 40.00
Low 1055 35.00
NA NA 15.00
Available
Capacity
Future Requirements
Fire Flow Requirements Volume
2018 Requirements


Regulatory ReviewCity of Otsego, MN P05409-2015-007
Technical Memorandum: Regulatory Review
Otsego Drinking Water System Master Plan
To: Kurt NeidermeierUtility ManagerCity of Otsego
From: Nancy Zeigler, PEScott Schaefer, PEAE2S
Date: April 29, 2019
Project No: P05409-2015-007
1 SUMMARY
The City of Otsego will measure the performance of its current and future drinking water system against established criteria and drinking water regulations. The City is planning for its continued growth and will continue to provide an abundant and reliable supply of safe, quality water to system customers. Primary objectives include conformance with standard engineering design criteria, compliance with existing and anticipated drinking water regulations and the ability to achieve the specific established target treatment goals.
1.1 MDH STANDARDS (TEN STATE STANDARDS)
The Minnesota Department of Health (MDH) establishes standards, formally and informally, through its engineering plan review process. In Minnesota, water system design follows the guidelines of the MDH and the Great Lakes–Upper Mississippi River Board of State and Provincial Public Health and Environmental Managers Standards for Water Works1, or the Ten States Standards. Ten States Standards primarily consists of Policy Statements, Interim Standards and Recommended Standards for the design of water systems.
The Policy Statements address innovative treatment processes for which sufficient data does not yet exist to establish specific recommended design parameters. The Policy Statements also recommend approaches and considerations for addressing specific issues that may not develop into

Regulatory ReviewCity of Otsego, MN P05409-2015-007
standards. The seven (7) Policy Statements provided in the most recent (2018) edition of Ten State Standards are as follows:
Pre-Engineered Water Treatment Plants; Automated/Unattended Operation of Surface Water Treatment Plants; Bag and Cartridge Filters for Public Water Supplies; Ultraviolet Light for Treatment of Public Water Supplies; Infrastructure Security for Public Water Supplies; Arsenic Removal; and Design Considerations for the Optimization of Rapid Rate Filtration at Surface Water
Treatment Plants.
The Interim Standards provide design criteria currently used for new process system design, but the data is limited and insufficient for recognition as a recommended standard. Currently, there are two (2) interim standards: 1) Use of Chloramine Disinfectant for Public Water Supplies and 2) Membrane Technologies for Public Water Supplies.
Proven technology developed the Recommended Standards, with the intent to serve as the guide for the design of public water systems. The Recommended Standards comprehensively address aspects of the following nine (9) primary areas of public water supplies:
Submission of Plans; General Design Considerations; Source Development; Treatment; Chemical Application; Pumping Facilities; Finished Water Storage; Distribution System Piping and Appurtenances; and Waste Residuals.
1.2 STANDARD INDUSTRY PRACTICES AND PROFESSIONAL JUDGEMENT
Although Ten States Standards provides recommended guidelines for many aspects of drinking water systems, the standards are insufficient to address every aspect of detailed water system design comprehensively. Raw water quality characteristics and the variability of raw water quality are unique to each treatment facility. The performance of treatment processes may vary significantly depending on application and integration with other treatment processes. Equipment manufacturers offer competing products that, although similar, offer different size considerations, ancillary equipment and treatment characteristics. In addition, preferences of the Otsego staff will influence specific aspects of system design. Where innovative or alternative technologies are considered and where recommended standards are not available, standard industry practices and best professional judgment of sizing and performance will be determined from manufacturers’ data and available performance information from other installations.

Regulatory ReviewCity of Otsego, MN P05409-2015-007
1.3 SECURITY AND REDUNDANCY
The safety of the public water supply to the City of Otsego is a vital concern in this planning process. All WTP facilities employ special safety considerations. Ten States Standards identifies that water treatment plant design must comply with all applicable safety code and regulations which include, and may not be limited to, Uniform Building Code, Uniform Fire Code, National Fire Protection Association Standards, and state and federal Occupational Safety and Health Administration (OSHA) standards. Safety considerations include noise protection, confined space entry, personal protective equipment and clothing, safety showers and eyewashes, guardrails, warning signs, smoke detectors, and fire extinguishers. Ten States Standards recognizes that water systems are vulnerable to intentional acts of vandalism, sabotage, or destruction. A few of the key items related to facility protection identified in the “Policy Statement on Infrastructure Security for Public Water Supplies” include:
1. Incorporate redundancy and enhanced security features in the design to eliminate single points of failure. Incorporate additional protection measures if redundancy is not feasible.
2. Maintain an inventory of critical parts for use in the event that damage, or destruction occurs on a critical component.
3. Limit human and vehicle access to the facility through controlled locations only. 4. Secure computer-based technologies such as SCADA from unauthorized access or
cyber-attacks. Equip all automated control systems with manual overrides to provide the option to operate manually.
5. Encourage the addition of real time water quality monitoring with continuous reporting and alarms to provide early warning of possible intentional contamination events.
6. Design chemical delivery, handling and storage facilities to ensure that chemicals are safe from intentional release.
Safety and security will be a major factor in the preliminary design. The design will incorporate enhanced safety measures to ensure protection of water plant operators and the public.
2 DRINKING WATER REGULATIONS
Congress passed the Safe Drinking Water Act (SDWA) in 1974. Its purpose was to establish a uniform set of regulations and water quality standards for public water systems across the United States. The SDWA focused on identifying substances present in drinking water that had adverse public health effects. The City of Otsego is currently required to meet the regulations of the SDWA under the enforcement responsibility of the Minnesota Department of Health (MDH), the Primacy Agency. Minnesota became one of the first (5) states to achieve primacy and to begin regulating public water supply systems at the state level in 1976.
To strengthen the SDWA, especially the regulation setting process, Congress amended most of the 1974 SDWA in 1986. Under the 1986 SDWA Amendments, the number of regulated

Regulatory ReviewCity of Otsego, MN P05409-2015-007
contaminants increased from 23 to 89. Each standard consisted of a sampling frequency requirement and a maximum contaminant level (MCL). Congress originally mandated the US EPA to establish MCLs for 25 new parameters every three years under the amended 1986 SDWA.2 Amendments to the SDWA in 1986 included several regulations that directly or indirectly affect the future City of Otsego.
Congress signed a Reauthorization of the SDWA into law (Public Law 104-182) on August 6, 1996. The law repealed the original mandate established by Congress for the US EPA to regulate 25 new contaminants every three (3) years and replaced it with a new standard-setting process to identify contaminants for future regulation based on their occurrence, the health risk they pose and cost-benefit evaluations.3 The 1996 SDWA Reauthorization made several additional important changes including: 1) establishing new requirements for selecting contaminants for regulation; 2) mandating the use of sound science; 3) allowing analyses of health risk reductions, costs and benefits; 4) establishing an occurrence database; and 5) evaluating permitting competing risks.
Under the Reauthorization, the US EPA selects at least five (5) new contaminants to consider for regulation every five (5) years with regulations geared toward those imposing the highest health risk. Surface water treatment facilities have been the focus of heightened regulations due to the concerns over microbiological contaminants and disinfection by-products (DBPs). The Reauthorization of the SDWA has provided a review of the original SDWA and a better understanding of the significance of providing regulations that emphasize the importance of maintaining proper disinfection while controlling the formation of DBPs. Recent discussions regarding future drinking water regulations include commercial and industrial chemicals, pesticides, biological toxins, additional disinfection byproducts and waterborne pathogens.
The City of Otsego will achieve its goal of providing customers with quality water by complying with the primary drinking water regulations, satisfying secondary drinking water regulations and addressing the water quality issues not specifically addressed by primary or secondary regulations. Primary drinking water regulations control or will control filtration, turbidity, filter backwash, disinfection, DBPs, disinfectant residuals, total coliform bacteria, lead, copper and a long list of additional analytes in the water through MCLs. These regulations protect public health. The secondary drinking water regulations help provide water that is aesthetically and cosmetically pleasing. Secondary drinking water regulations and other considerations also address technical effects, a term coined by the SDWA Advisor, that address such issues as corrosivity.4
2.1 PRIMARY DRINKING WATER STANDARDS
Primary drinking water regulations address microbial contaminants, disinfectants and disinfection by-products (DBPs), maximum residual disinfectant levels (MRDLs), inorganic and organic compounds, radionuclides, treatment techniques (TT), maximum contaminant levels (MCLs) and other advisory objectives and parameters. The primary drinking water standards are legally enforceable standards that apply to public water systems. Primary standards protect public health by limiting the levels of contaminants in drinking water.

Regulatory ReviewCity of Otsego, MN P05409-2015-007
2.1.1 Lead and Copper Rule
The 1986 Amendments to the SDWA required US EPA to promulgate drinking water standards for contaminants that impose potential adverse health risks. Lead and copper were specifically listed in the 1986 SDWA amendments for mandatory development of a National Primary Drinking Water Regulation (NPDWR); US EPA responded by promulgating the LCR, which was published in 1991. The stated goal of the LCR is to “minimize lead and copper at users’ taps while ensuring that treatment does not cause the system to violate any NPDWR”.2 This goal is intended to be accomplished through the application of corrosion control strategies (i.e. varying pH levels, alkalinity levels and inhibitor utilization). The LCR action levels for lead and copper are 0.015 mg/L and 1.30 mg/L, respectively, in the 90th percentile of samples measured at customer taps.
The City of Otsego tests for lead and copper contaminants according to the Minnesota Department of Health requirements. The City has not had a violation. Otsego does add an orthophosphate/polyphosphate blend to the water to inhibit corrosion and sequester lead and copper and further treatment in addition to this method is not currently required.
The US EPA published the LCR Short-Term Revisions on October 10, 2007. The revisions included changes in both the health effects language and utility’s public education requirements. The revisions intended to clarify and enhance implementation of the LCR in the areas of monitoring, treatment, customer awareness, and lead service line replacement. The revisions also aimed to improve compliance with public education requirements.
The US EPA is currently considering Long-Term Revisions to the LCR. Requirements under consideration for modification include sample site selection criteria, sampling procedures, water quality monitoring, continued emphasis on lead service line replacement and consecutive water system requirements.
Another recent related regulation is the Reduction of Lead in Drinking Water Act of 2011. Congress signed the Act into law on January 4, 2011, which became effective on January 4, 2014. Provisions of the federal law revise the SDWA definition of "lead free" for piping, pipe fittings, plumbing fittings and fixtures. The amendment reduces the lead limit from eight percent to 0.25% for brass and bronze. The limit for solder and flux remains at 0.2%. The federal law applies to the wetted surfaces of any product used in a drinking water system. The new requirement requires suppliers, contractors, the engineering community and water utilities to revise specifications for no-lead brass plumbing fittings and components such as curb stops, meters, regulators, check valves, and now fire hydrants. There is ongoing discussion regarding the US EPA's interpretation of the law regarding the inclusion of system fire hydrants.
2.1.2 Volatile Organic Chemicals Rule (VOC Rule)
The VOC Rule became effective under the SDWA on January 9, 1989. The VOC Rule established MCLs for eight (8) volatile organic chemicals (VOCs) such as benzene, carbon tetrachloride, vinyl chloride, etc. that are suspected human carcinogens through ingestion. The VOC Rule is part of the Phase I Rules of the SDWA.

Regulatory ReviewCity of Otsego, MN P05409-2015-007
Based on review of the most recent water quality analysis VOCs were determined to be below the Reporting Limit.
2.1.3 Phase II/IIb and Phase V Rules
The Phase II and Phase IIb Rules became effective on July 1, 1991 and January 1, 1993, respectively. Phase II/IIb Rules nearly doubled the number of regulated drinking water contaminants by setting standards for 38 VOCs, synthetic organic chemicals (SOCs) and inorganic chemicals (IOCs). The Rules regulate Thirty-six (36) of the contaminants by MCLs and two (2), acrylamide and epichlorohydrin, by limiting their use in drinking water treatment chemicals.
Although a large number of Phase II/IIb chemicals result from human activity, others occur naturally in water. These contaminants have been shown to either be or are suspected to be carcinogenic through ingestion. Some of the other effects of these contaminants include damage to numerous organs in the body, circulatory system damage, bone damage, nervous system damage and disorders, thyroid damage, and decreased body weight.
PWSs are required to ensure the water they supply meets the MCL for each Phase II/IIb chemical. Phase II/IIb introduced a plan for synchronizing compliance monitoring across several existing and upcoming rules. Monitoring frequencies for most source-related contaminants were coordinated with compliance periods of three (3) years each. Phase II/IIb monitoring requirements also established:
1. Sampling locations for surface and groundwater systems; 2. The initial sampling frequency that is specific for a contaminant or contaminant group;3. Lower repeat sampling frequencies for water systems that do not detect a specific
contaminant or contaminant group during the initial monitoring;4. Increased monitoring frequencies for water systems that do detect initial contaminants, 5. Monitoring waivers for reducing or eliminating the sampling frequencies; and,6. One-time monitoring requirements for 30 other unregulated contaminants.
The Phase V Rule, effective on January 17, 1994, set standards for 23 more contaminants. Contaminants monitored under Phase V included five (5) IOCs, cyanide, three (3) VOCs, and fifteen (15) pesticides or SOCs. The US EPA set different monitoring schedules for different contaminants, depending on the routes by which each contaminant enters the water supply. In general, surface water systems must take samples more frequently than groundwater systems because the source water is subject to more influences that are external. Systems that prove over several years that they are not susceptible to contamination can apply for a variance to reduce monitoring frequency.

Regulatory ReviewCity of Otsego, MN P05409-2015-007
2.1.4 Arsenic Rule
The US EPA based the 1975 arsenic standard of 50 ppb on a Public Health Standard dating back to 1942. The US EPA proposed a revised Arsenic Rule in June 2000 and published the revision in the Federal Register on January 22, 2001. This revised rule applies to all community water systems and non-transient non-community water systems and requires compliance with an MCL of 10 ppb, based on samples obtained from all entry points to the distribution system. In addition to the MCL, the rule also specifies a non-enforceable MCLG of zero. The compliance date for the revised Arsenic Rule is January 23, 2006. Arsenic causes adverse health effects in humans at high exposure levels. High levels of arsenic typically lead to gastrointestinal irritation accompanied by difficulty in swallowing, thirst, hypertension, and convulsions. A range from 70 to 180 mg/L is the estimated lethal dosage for humans. Otsego has never experienced concerns related to compliance with the Arsenic Rule.
2.1.5 Radionuclides Final Rule
The US EPA proposed a NPDWR for six (6) radionuclides in 1991, which included combined radium 226, radium 228, (adjusted) gross alpha, beta particle and photon radioactivity, radon, and uranium. The US EPA published a revision to this rule, promulgating the final drinking water standards for (non-radon) radionuclides in drinking water, in December 2000. This revised rule became effective on December 8, 2003. The revised rule finalized MCLG for all regulated radionuclides at zero. This rule, which applies to all community water systems, changes the monitoring requirements to include sampling from all distribution system entry points. The adverse health effects associated with exposure to radionuclides include radiotoxicity, which affects human tissue, and chemotoxicity, which affects human organs. Research links extended radionuclide exposure to cancer. Table 2.1 provides the MCLs and MCLGs for regulated radionuclides.
Table 2.1 Primary Drinking Water Regulations for Radionuclides (Excluding Radon)
Radionuclides MCL MCLG
Radium 226/228 5 pCi/L 0
Beta and Photon Emitters 4 mrem/year 0
Gross Alpha Emitters 15 pCi/L 0
Uranium 30 μg/L 0
The City annually tests for radionuclides to ensure customer safety compliance with drinking water regulations. Some of Otsego’s wells have reported total radium concentrations that exceed the regulated MCL. As such, Wells #1 and #2 are emergency wells that are only used in an emergency and when blended with Well #6. This usually occurs in the summer months when there is the highest water demand. Due to it radium levels, Well #8 must be blended with Well #3 and produce less than half of the East Water System use. By blending the well water and limiting the use of

Regulatory ReviewCity of Otsego, MN P05409-2015-007
certain wells, the City reduces the radionuclide concentrations below the MCL. For future development, the City is looking into radium removal as part of the treatment process.
The US EPA proposed a Radon Rule in November 1999. The Rule did not pass, so there is currently no federally enforceable drinking water standard for radon. The originally conceived Radon Rule applied to all public water suppliers that use groundwater or mixed ground and surface water. The rule proposed a MCLG, a MCL, an alternative maximum contaminant level (AMCL), and requirements for multimedia mitigation (MMM) program plans to address radon in drinking water. The proposed regulation provided two (2) options for the maximum level of radon that is allowable in community water supplies. The proposed MCL was 300 pCi/L of drinking water, and the proposed AMCL was 4,000 pCi/L of drinking water. The AMCL applied to States with enhanced indoor air programs and the lower MCL applied to States without enhanced indoor air programs. The State of Minnesota has a developed indoor air quality program, which would suggest an associated AMCL of 4,000 pCi/L for the City of Otsego.
The U.S. Surgeon General and US EPA recommend that radon be mitigated if the radon level is 4 pCi/L of air or higher. Radon levels have not been found to be a concern in Otsego.
2.1.6 Total Coliform Rule (TCR)
The TCR became effective under the SDWA on December 31, 1990. This rule established microbiological standards and monitoring requirements that apply to all PWSs. The purpose of the TCR is to prevent outbreaks of waterborne microbial diseases by regulating a group of organisms that include fecal coliform and Escherichia coli (E.coli). The potential health effects of microbial organisms include gastroenteric and Legionnaires’ disease. The US EPA published revisions to the 1989 TCR rule on February 13, 2013 and made minor corrections on February 26, 2014. The Revised Total Coliform Rule (RTCR) targets greater public health protection. The RTCR:
1. Requires public water systems that are vulnerable to microbial contamination to identify and fix problems; and
2. Establishes criteria for systems to qualify for reduced monitoring.The presence or absence of total coliform is the general indication used to measure the level of pathogenic contamination within the water. However, the RTCR removed and replaced the MCLG and MCL for fecal coliform with MCLG for E. coli of zero (0). While the basic monitoring requirements of the TCR remain unchanged, the RTCR established criteria for systems to stay on reduced monitoring frequencies and establishes increased monitoring for high-risk systems or systems with a history of noncompliance. Public water systems that exceed the specified frequency of total coliform occurrence are required to conduct additional assessment. All PWSs must comply with the RTCR starting April 1, 2016.
The City of Otsego has had positive coliform tests. However, follow-up sampling has always shown no contamination present. There can be many contributing factors to positive coliform tests, and the negative follow-up results indicate that coliforms are not a substantial driver for additional

Regulatory ReviewCity of Otsego, MN P05409-2015-007
treatment. However, filtration generally removes coliforms and can be considered an additional layer of protection in addition to disinfection practices.
2.1.7 Stage 1 Disinfectants-Disinfection By-Products Rule (Stage 1 D/DBPR)
The Stage 1 D/DBPR established MCLs for eleven (11) DBPs, categorized into two (2) groups of organic by-products (four (4) trihalomethanes (THMs) and five (5) haloacetic acids (HAA5s)) and two (2) inorganic by-products (chlorite and bromate). The Stage 1 D/DBPR also established maximum residual disinfectant level goals (MRDLGs) and maximum residual disinfectant levels (MRDLs) for three (3) disinfectants: chlorine, chloramines and chlorine dioxide. Compliance was required by January 2002 for all community water systems (CWSs) (public water systems that are connected to 15 year-round residences or serve 25 people in a residential setting on a year-round basis) serving more than 10,000 people.
Table 2.2 presents the MRDLs and MRDLGs for the three (3) disinfectants. The running annual average (RAA) of samples collected at TCR sampling locations, computed quarterly, governs compliance with the MRDLs. The regulation recognizes the beneficial disinfection properties of chlorine, chloramines and chlorine dioxide. The MRDLs and MRDLGs were determined as a balance to provide adequate control for public health effects while allowing the ability to control pathogens and other microbial waterborne microbial contaminants under varying conditions. Basing compliance on a running annual average allows CWSs the flexibility to increase disinfectant residual levels for short periods, as necessary to address specific issues within the water system and still maintain compliance.
A review of chlorine residual data provided by Otsego indicates their distribution system chlorine residuals are well below the 4 mg/L MRDL. Total chlorine residuals typically range between 0.65 and 2.03 mg/L.
Table 2.2 Stage 1 D/DBPR Maximum Residual Disinfectant Levels and Goals
Disinfectant MRDLs (mg/L)
MRDLGs (mg/L)
Chlorine (measured as Cl2) 4.0 4.0
Chloramines (measured as Cl2) 4.0 4.0
Chlorine Dioxide (measured as ClO2) 0.8 0.8
Table 2.3 identifies the MCLs for the various DBPs regulated under Stage 1. The National Cancer Institute lists some DBPs as probable human carcinogens and links some to adverse effects on the liver, kidneys, nervous system and reproductive system.

Regulatory ReviewCity of Otsego, MN P05409-2015-007
Table 2.3 Stage 1 D/DBPR MCLs
Total THMs are the sum of the following four (4) trihalomethanes: chloroform, bromdichloromethane, dibromochloromethane and bromoform. The Stage 1 TTHM MCL is 80 micrograms per liter (g/L) based on a RAA from quarterly distribution system samples. HAA5 is the sum of the following five (5) haloacetic acids: monochloracetic acid, dichloroacetic acid, trichloroacetic acid, monobromoacetic acid and dibromoacetic acid. Stage 1 established a HAA5 MCL of 60 g/L, as an RAA of quarterly distribution system samples. Stage 1 regulates chlorite, a degradation product of chlorine dioxide, at an MCL of 1.0 mg/L. Ozonation of water containing the bromide ion form bromate. The Stage 1 D/DBPR regulates bromate at 10 g/L.
Disinfection by-products are regularly tested for in the distribution system according to the Minnesota Departments of Health’s requirements. Results are consistently below the MCL limits. HHA concentrations have ranged from 2.4-6.7 ppb. TTHM concentrations have ranged from 2.5-8.1 ppb.
2.1.8 Stage 2 Disinfectants/Disinfection By-Products Rule (Stage 2 D/DBPR)
The US EPA finalized and published the Stage 2 D/DBPR on January 4, 2006. The Stage 2 D/DBPR intended to reduce potential cancer, reproductive and developmental health risks from DBPs in drinking water. Under the Stage 2 D/DBPR, systems conduct an evaluation of their distribution system, known as an Initial Distribution System Evaluation (IDSE), to identify the locations with high DBP concentrations. The systems then use these locations as the sampling sites for Stage 2 D/DBPR compliance monitoring. The system determines whether each monitoring location complies with the MCLs for two (2) groups of DBPs (TTHM and HAA5). This approach, referred to as the locational running annual average (LRAA), differs from the Stage 1 D/DBPR requirements, which determines compliance by calculating the RAAs of samples from all monitoring locations across the system.
The Stage 2 D/DBPR also requires each system to determine if they have exceeded an operational evaluation level using their compliance monitoring results. The operational evaluation level provides an early warning of possible future MCL violations, which allows the system to take proactive steps to remain in compliance. A system that exceeds an operational evaluation level is required to review their operational practices and submit a report to the Primacy Agency that identifies actions to mitigate future high DBP levels, particularly those that may jeopardize their compliance with the DBP MCLs.
Regulated Disinfection By-Products Stage 1 MCLs (mg/L)
Total Trihalomethanes (TTHM) 0.08
Haloacetic Acids (HAA5) 0.06
Chlorite 1.00
Bromate 0.01

Regulatory ReviewCity of Otsego, MN P05409-2015-007
The PWS compliance deadline varies based on the population served. Wholesale and consecutive systems of any size must comply with the requirements of the Stage 2 D/DBPR on the same schedule as required for the largest system in the combined distribution system (defined as the interconnected distribution system consisting of wholesale systems and consecutive systems that receive finished water).
Based on the population of Otsego, the City was required to begin collecting samples at the Stage 2 D/DBPR sites by October 1, 2013.
2.1.9 Ground Water Rule
Historically, groundwater was free of microbial contamination, but recent research indicates that some groundwater is a source of waterborne disease. Gastrointestinal symptoms such as diarrhea, vomiting, etc. characterize most cases of waterborne disease. These symptoms are much more serious and can be fatal for persons in sensitive subpopulations such as young children, the elderly, and persons with compromised immune systems. In addition, research links long-term health effects such as adult onset diabetes and myocarditis (inflammation of the middle muscular layer of the heart wall) with some viral pathogens found in groundwater.
The 1996 amendments to the SDWA required US EPA to develop regulations that require disinfection of groundwater systems “as necessary” to protect the public health. The Ground Water Rule (GWR) establishes multiple barriers to protect against bacteria and viruses in drinking water from groundwater sources and will establish a targeted strategy to identify groundwater systems at high risk for fecal contamination. The US EPA issues the GWR as a final regulation in 2006. This rule applies to public groundwater systems (systems that have at least 15 service connections or regularly serve at least 25 individuals daily at least 60 days out of the year). Implementation of this rule began in January 2010. The requirements of this rule include:
System sanitary surveys conducted by the State which are intended to identify significant deficiencies;
Hydrogeologic sensitivity assessments for non-disinfected systems; Source water microbial monitoring by systems that do not disinfect and draw from
hydrogeologically sensitive aquifers or have detected fecal indicators within the system’s distribution system;
Corrective action by any system with significant deficiencies or positive microbial samples indicating fecal contamination; and
Compliance monitoring for systems that disinfect to ensure that they reliably achieve 4-log (99.99 percent) inactivation or removal of viruses.
A positive total coliform result from the TCR routine sampling triggers source water monitoring. Source water monitoring requires the system to collect a sample from the well(s) for further microbial analysis. If the sample is positive, then the system must take corrective action as directed by the state. Otsego’s best action to maintain compliance with the Ground Water Rule is to

Regulatory ReviewCity of Otsego, MN P05409-2015-007
maintain chlorine residuals in the distribution system sufficient to prevent positive coliform results in their TCR samples.
2.2 SECONDARY DRINKING WATER STANDARDS
The US EPA established secondary drinking water regulations for contaminants that may adversely affect the finished water appearance, taste and odor; promote adverse digestive effects; discolor human skin and teeth; or have economic impacts (hard or corrosive water on plumbing fixtures and equipment). There are three (3) general categories of established secondary maximum contamination levels (SMCLs): aesthetic objectives, cosmetic objectives and technical effects. The US EPA maintains that the SMCLs represent reasonable goals for non-health threatening contaminants. States may establish higher or lower levels as appropriate for the local conditions. SMCLs are not federally enforceable, but individual Primacy Agencies can adopt them as enforceable standards. Table 2.4 provides a list of secondary contaminants and the associated SMCLs. No SMCLs are enforceable in Minnesota at this time.
Table 2.4 Secondary Maximum Contaminant Levels
Secondary Contaminant Secondary MCL
Aluminum 0.05 to 0.2 mg/L
Chloride 250 mg/L
Color 15 color units
Copper 1.0 mg/L
Corrosivity Non-corrosive
Fluoride 2.0 mg/L
Foaming Agents 0.5 mg/L
Iron 0.3 mg/L
Manganese 0.05 mg/L
Odor 3 TON (threshold odor number)
pH 6.5 to 8.5
Silver 0.1 mg/L
Sulfate 250 mg/L
Total Dissolved Solids (TDS) 500 mg/L
Zinc 5 mg/L

Regulatory ReviewCity of Otsego, MN P05409-2015-007
2.2.1 Aesthetic Objectives
Aesthetic objectives are water quality objectives that a water supply system strives to meet, although they do not have adverse effects on public health. These objectives include controlling color, taste, odor and foaming.
2.2.1.1 Color
In addition to undesirable aesthetics, color in potable water may also stain clothes and plumbing fixtures. A colorimeter measures color on a graded from zero to 70, with zero being perfectly clear water. The test is somewhat subjective, requiring a visual comparison of the color of the water sample to a color wheel. The SMCL for color is 15 color units. Color may be indicative of aluminum, iron, manganese, dissolved organic material, inadequate treatment, high disinfectant demand or the formation of DBPs.
Naturally occurring iron and manganese in the Otsego water supply is largely responsible for the color in the finished water. Soluble iron and manganese oxidize when exposed to air (oxygen) and result in noticeable color and staining of wetted surfaces, fixtures, and laundry.
2.2.1.2 Foaming
Foaming is not typically a problem with ground water systems. Detergents or similar substances in the water usually cause foaming when the water becomes aerated. The US EPA has established an SMCL for foaming agents of 0.5 mg/L. An oily, fishy or perfume-like taste is often associated with foaming.
2.2.1.3 Iron and Manganese
Water systems recognize the presence of iron in water by its rusty color, metallic taste and reddish or orange staining effects. Black or brown color, bitter metallic taste and black staining effects indicate manganese presence. The SMCLs for iron and manganese are 0.3 mg/L and 0.05 mg/L, respectively.
The majority of Otsego’s wells have historically reported iron and manganese concentrations above the SMCLs. In the most recent data provided by the City, iron concentrations ranged from 0.71 mg/L to 0.73mg/L on the East side and 0.08 mg/L to 0.39 mg/L on the West side. The East side consistently exceeds the SMCL for iron and the West side can depending on the wells running. In the most recent data from the City, manganese concentrations ranged from 0.01 mg/L to 0.10 mg/L on the East side and 0.28 mg/L to 0.63 mg/L on the West side. Both systems consistently exceed the SMCL for manganese.
2.2.1.4 Taste and Odor
Public acceptance of the drinking water typically measures taste and odor rather than by scientific methods, with unacceptable taste and odor usually manifested as public complaints. Most organic and some inorganic compounds contribute to the taste and odor of water. Water systems perform

Regulatory ReviewCity of Otsego, MN P05409-2015-007
odor tests to describe and quantify (subjectively) odor intensity. The threshold odor number (TON) is the standard unit measurement of odor intensity. Calculate the TON by determining the dilution ratio required to keep odor detectable in the water sample with odor-free water added.
The SMCL for odor in drinking water is 3 TON. Although a potential source of odor in the Otsego water supply, hydrogen sulfide odor has not been a concern. Chlorination oxidizes hydrogen sulfide, mitigating this odor-causing substance.
2.2.1.5 Sulfate
Sulfate is not toxic, carcinogenic nor chronically harmful to humans in reasonable concentrations. At concentrations above 250 mg/L, sulfates give a salty taste to the water. The current SMCL for sulfate is 250 mg/L, based on taste and odor effects. The federal government considered a primary drinking water standard for sulfates in the past. The US EPA proposed an MCLG of 500 mg/L for sulfate in December 1994. Resource limitations, however, forced the US EPA to defer action on the proposed rule.
From the available data, sulfate concentrations have ranged from less than 2 mg/L to 9.3 mg/L. Sulfate concentrations are not a concern for the City of Otsego.
2.2.1.6 Cosmetic Objectives
Cosmetic objectives address effects that do not damage the body, but typically produce undesirable visual effects, such as skin and tooth discoloration. These objectives include controlling silver concentrations and controlling the fluoride residual in the distribution system.
The ingestion of silver greater than the non-enforceable secondary maximum contaminate level (SMCL) of 0.10 mg/L relates to skin discoloration.
In August 2015, the US Department of Health and Human Services released a new optimum fluoride concentration of 0.7 mg/L. Previous recommendations were for a range of concentration of fluoride between 0.7 and 1.2 mg/L to reduce cavity formation without producing significant fluorosis (enamel mottling) of the teeth. The US EPA SMCL for fluoride is 2.0 mg/L and the regulated MCL is 4.0 mg/L. Above 2.0 mg/L, fluorosis becomes more prominent. Minnesota State Statutes indicate a required fluoride concentration between 0.9 and 1.2 mg/L.
The City of Otsego adds fluoride by dosing fluorosilicic acid in their existing pump houses. From the most recent data, fluoride concentrations in the distribution system range from 0.51 mg/L to 0.93 mg/L. The City’s MDH official approved this reduction below the Minnesota State Statute.
2.2.2 Technical Effects
Adverse technical effects can cause damage to downstream water equipment processes and can sometimes reduce the effectiveness of treatment for other contaminants. In addition, technical effects can cause damage in the distribution system components and fixtures in homes. These adverse technical effects include corrosivity and scaling.

Regulatory ReviewCity of Otsego, MN P05409-2015-007
By-products formed by corrosion of piping and plumbing have health, aesthetic and economic implications. The SMCL for corrosivity is non-corrosive water. Water pH and the distribution of carbonate species (carbonic acid, bicarbonate and carbonate) directly affect corrosion of metal components. Lower pH water tends to be more corrosive, so pH is evaluated a surrogate indicator of corrosivity.
The pH of the well water for the Otsego water supply typically ranges between 7.3 and 7.8. The pH is consistently within the established SMCL pH range of 6.5 to 8.5.
2.3 OTHER WATER QUALITY STANDARDS
2.3.1 Hardness
Water suppliers classify the hardness of a water as soft (below 60 mg/L as CaCO3), medium hard (60 to 120 mg/L as CaCO3), hard (120 to 180 mg/L as CaCO3), very hard (180 to 350 mg/L as CaCO3) and brackish (above 350 mg/L as CaCO3).5 Although higher values of hardness are not dangerous, public acceptance typically requires a water supply below 150 mg/L as CaCO3. Hard water also tends to stain bathroom fixtures and leave scale in water heaters. Agencies recommend that suppliers of potable water maintain total hardness levels below 120 mg/L as CaCO3, when economically feasible.
The hardness of the Otsego water supply is typically in the range of 186 mg/L to 239 mg/L for the East side and 270 mg/L to 310 mg/L on the West side. The water supply falls into the categories of “very hard”. Removal of hardness (“softening”) can be an expensive treatment process. Home water softeners allow system customers to address hardness on an individual basis, as they feel appropriate. However, in-home water softeners have increased the chloride levels to the City’s wastewater treatment facilities (WWTFs), causing them to struggle to reach their discharge permit for the anticipated future chloride limits, particularly for the West WWTF where the receiving stream does not offer dilution. Therefore, softening, or other methods of removing hardness, will be considered for future system improvements could be considered, if found to be economically viable. Also note that total dissolved solids (TDS) limit for the East WWTF could be near the in-stream limit for the Crow River without future TDS reductions in the effluent as the City grows at or near buildout capacity. The TDS concentrations are related to chloride and hardness as home water softeners are a contributor to increased TDS.
2.3.2 Sodium
Although not a primary drinking water standard, the World Health Organization (WHO) recommends a maximum concentration standard of 200 mg/L for sodium. The WHO established this guideline for people on a restricted sodium diet. From the most recent City data, sodium concentrations were reported in a range of 3.9 mg/L to 4.3 mg/L. Otsego’s concentration are well below the WHO recommended concentration for sodium.

Regulatory ReviewCity of Otsego, MN P05409-2015-007
2.4 REFERENCES
1 Great Lakes Upper Mississippi River Board of State Public Health & Environmental Managers, Recommended Standards for Water Works, Health Educational Services, Albany, NY, 2012 Edition.
2 Leland, David E., “Implementation Status of Oregon’s Safe Drinking Water Act”, Journal of the American Water Works Association, February 1993.
3 Pontius, Frederick W., and Warburton, Albert E., “Inside S. 1316”, Journal of the American Water Works Association, March 1996.
4 Pontius, Frederick W., SDWA Advisor, 1997.
5 Lindeburg, PE, Michael R., Civil Engineering Reference Manual for the PE Exam, Eighth Edition, 2001, p. 25-3.
3 TREATMENT TARGET GOALS
Beyond continued compliance with all primary drinking water regulations, the City of Otsego, together with AE2S, established additional treatment target goals for the future of the City’s system. The treatment target goals implement treatment for iron and manganese (color) removal, radium removal, promote compliance with D/DBP regulations, and enhance the stability of the residual disinfectant in the finished water supply.
The Project Team determined the following treatment target goals to be primary goals for the Drinking Water Master Supply Plan. In addition to identifying the treatment target goals, the Project Team also developed recommended measurement criteria for each goal.
3.1 IRON AND MANGANESE REMOVAL
Mitigation of the aesthetic effects of iron and manganese from the finished water supply is one of the primary objectives of additional water treatment. Recommended Measurement Criteria:
Consistently achieve iron and manganese concentrations less than half of the established SMCL.
SMCL Regulation(mg/L)
Treatment Goal(mg/L)
Iron 0.30 0.15
Manganese 0.05 0.025

Regulatory ReviewCity of Otsego, MN P05409-2015-007
3.2 RADIUM REMOVAL
Mitigation of adverse health effects associated with exposure of water system customers to radionuclides is another primary objective of the Drinking Water Master Plan. The City’s goals are to consistently achieve combined radium (Radium-226 and Radium-228) and gross alpha emitters concentrations less than half of the established MCL.
MCL Regulation(pCi/L)
Treatment Goal(mg/L)
Combined Radium 5 2.5
Gross Alpha Emitters 15 7.5
3.3 FINISHED WATER STABILITY - DISINFECTION
Maintaining a disinfection strategy and ensuring a biologically stable distribution system water quality is another primary objective for future facilities. Recommended Measurement Criteria:
Consistently provide a total chlorine residual of 1.5 mg/L to 2.0 mg/L in the finished water leaving the WTP;
Consistently meet the established chloramine MRDL of 4.0 mg/L;
Consistently provide stable total chlorine residuals in the City’s distribution system; and
No nitrification in the City’s distribution system.
3.4 RADON
Although radon is not a regulated contaminant, raw water radium levels prompted conversations related to mitigation of radon in future WTP facilities, as needed. Facilities will include ventilation and radon monitors to ensure the safety of the operational staff.Recommended Measurement Criteria:
Consistently monitor the air quality of the facility and alert the proper City staff if radon levels are above 2.0 pCi/L.
If the radon is above the recommended criteria, the City can install additional radon mitigation measures.


Reasonable Treatment Alternatives ScreeningCity of Otsego, MN P05409-2015-007
Technical Memorandum: Reasonable Treatment Alternatives Screening
Otsego Drinking Water System Master Plan
To: Kurt NeidermeierUtility ManagerCity of Otsego
From: Nancy Zeigler, PEScott Schaefer, PEAE2S
Date: July 29, 2019
Project No: P05409-2015-007
1 SUMMARY
Based on the review of raw water quality and desired treated water quality, the City will accomplish the following treatment objectives in the water treatment process:
Iron and manganese removal
Total hardness removal
Radium removal
Fluoridation
Disinfection and maintaining a disinfectant residual in the distribution systemAE2S evaluated several alternative technologies to accomplish these treatment objectives for the 2019 Drinking Water Master Plan.

Reasonable Treatment Alternatives ScreeningCity of Otsego, MN P05409-2015-007
2 TREATMENT OPTIONS
2.1 FILTRATION:
Water treatment facilities typically use filtration as a polishing step for the removal of suspended solids and particles from water. For ground water sources, oxidation of iron and manganese, coagulation, and lime softening often precedes filtration. Excluding membrane filtration technology, there are four general classes of filters including rapid rate gravity filters, rapid rate pressure filters, diatomaceous earth filters, and slow sand filters. Based on industry trends, treatment facility footprint considerations, and operator convenience, the Project Team deemed gravity filters and pressure filters most appropriate in the treatment concepts developed for this report.
2.1.1 Pressure vs. Gravity Filtration
The differences between gravity and pressure filtration plants are summarized below. Each type is discussed in detail in the following sections.
2.1.2 Gravity Filtration
The use of a rapid rate gravity filter shall generally require pretreatment according to Ten States Standards Section 4.3.1.1, except that Section 4.8.1.2 allows for iron and manganese filtration after detention without sedimentation. Consider sedimentation if iron and manganese concentrations are so high as to cause an overload of iron and manganese solids on the filter. Determine the rate of filtration based on the raw water quality, the level of pretreatment, filter media, water quality control parameters, and competency of the operating personnel. The recommended maximum filter loading rate for a manganese dioxide coated rapid rate gravity filter under normal operating conditions and acceptable pretreatment is 3.0 gpm/ft² according to Ten States Standards Section 4.8.3.d.

Reasonable Treatment Alternatives ScreeningCity of Otsego, MN P05409-2015-007
According to Ten States Standards, facilities must provide a minimum of two (2) filter units. When providing only two (2) units, each filter shall be capable of handling the plant design capacity at normal and projected maximum daily demands at the approved filtration rate. When providing multiple filters, the remaining filters shall be capable of handling the plant design capacity at projected maximum daily demands at the approved filtration rate when the largest filter is off line.
Design the filter structure to include the following:
1. A minimum filter box depth of 8½ feet;2. A minimum water depth of three (3) feet over the surface of the filter media;3. A trapped effluent preventing backflow of air and airlocking of the media; 4. An overflow to prevent flooding; 5. Cleanouts; and,6. A washwater drain having a capacity capable of handling the maximum backwash flow.
Also, consider all applicable safety precautions. The bottoms of the washwater collection troughs shall be above the expanded filter media level during backwashing, and the top level of each trough shall be at the same common elevation. Provide a minimum of two (2) inches of freeboard in the washwater troughs at the maximum backwash rate. The washwater troughs shall be equally spaced throughout the filter area, and the troughs shall be spaced to provide a maximum horizontal travel distance for the backwashed solids of three (3) feet.
The filter media shall be clean silica sand or other natural or synthetic media.
The media shall possess the following characteristics:
1. A total depth of not less than 24 inches and generally not more than 30 inches; 2. A uniformity coefficient of the smallest size medium no greater than 1.65; and 3. A minimum of 12 inches of media with an effective size no greater than 0.45 mm to 0.55
mm and with a specific gravity greater than other filtering material within the filter. Types of filter media include anthracite, sand, granular activated carbon, gravel, or other acceptable media.
Ten States Standards Section 4.3.1.7 also does not recommend porous plate bottoms (underdrains) where they may clog by iron and manganese. Gravel support should comply with Ten States Standards Section 4.3.1.6.e.2 graduation requirements.
Provide the following appurtenances with every filter: 1) influent and effluent sampling taps, 2) a head loss gauge, and 3) a flow meter. Make provisions to allow sampling and head loss measurement at several filter interior locations via wall sleeves in the filter box.
Normal backwashing of a rapid gravity filter occurs at a minimum rate of 15 gpm/ft². Ten States Standards recommends designing systems to be capable of a rate of 20 gpm/ft² or the rate required

Reasonable Treatment Alternatives ScreeningCity of Otsego, MN P05409-2015-007
to achieve 50 percent expansion of the filter bed. However, for greensand media and manganese-coated media, Ten States Standards requires normal wash rates of 8 to 10 gpm/ ft² and 15 to 20 gpm/ ft², respectively. The Ten States Standards require air washing capability of 3 to 5 cfm/ ft² suitable for iron and manganese filtration plants and meeting the requirements of Section 4.3.1.9. When backwashing simultaneously with air wash, Ten States Standards state that wash water flows should not exceed 8 gpm/ ft² unless operating experience demonstrates a need for higher flows and media loss is not problematic.
A rate of flow indicator, preferably fitted with a totalizer, shall be located in a place where the operator can easily read the flow along the main washwater line. Ten States Standards requires redundancy of the backwash pumps, unless an alternate source is available. The backwash shall last at least 15 minutes per filter at the design backwash rate.
Section 9.5 of Ten States Standards outlines the design requirements of filter backwash waste from iron and manganese filtration plants. It allows sand filter beds (Section 9.5.1), lagoons (Section 9.5.2), and sanitary sewer discharge (Section 9.5.3). Recycle of supernatant or filtrate from “red water” waste treatment facilities is not allowed except as approved by the reviewing authority.
Figure 2.1 illustrates the general plan view arrangement of a gravity filter.

Reasonable Treatment Alternatives ScreeningCity of Otsego, MN P05409-2015-007
2.1.3 Pressure Filtration
Ten States Standards recommends that the rate of filtration within pressure filters not exceed 4.0 gpm/ ft²; and often iron and manganese WTPs reduce this value to 2.0 to 2.2 gpm/ ft² to maintain consistent finished water quality. Additionally, Ten States Standards recommends the design of pressure filters include the following components:
1. Loss of head gauges on the inlet and outlet pipes for each battery of filters; 2. A flow meter for each filtering unit; 3. A minimum side wall height of five feet; 4. The top of the backwash water collection troughs to be at least 18 inches above the
surface of the media; 5. The underdrain system to efficiently collect the filtered water and to uniformly
distribute the backwash water at a rate not less than 15 gpm/ ft² of filter area;
Figure 2.1 Typical Gravity Filter - Plan View

Reasonable Treatment Alternatives ScreeningCity of Otsego, MN P05409-2015-007
6. An air release valve on the highest point of each filter; 7. An accessible manway to facilitate inspection and repairs of at least 24 inches in
diameter; and 8. A means to observe the wastewater during the backwashing process.
The minimum criteria relative to structural details, hydraulics, filter media, etc., provided in the conventional rapid rate gravity filters also applies to pressure filters, where appropriate. Figure 2.2 and Figure 2.3 below illustrate the general cross section and side elevation arrangement of a pressure filter.
Figure 2.2 Pressure Filter Cross Section

Reasonable Treatment Alternatives ScreeningCity of Otsego, MN P05409-2015-007
Figure 2.3 Typical Pressure Filter Side Elevation
2.1.4 Backwash Recycle & Additional Considerations
Either gravity or pressure filtration systems will require periodic backwashing to clean the filter media and remove the accumulated iron and manganese material. Although it may be possible to discharge the backwash wastewater directly to the sanitary sewer, an alternative for consideration will be the implementation of a traditional or inclined plate backwash recovery system. Responsible use of area groundwater resources is becoming an increasingly important topic. The Minnesota DNR encourages Water Treatment Plants to recover and reuse backwash water to the greatest extent possible. When considering future issues with the DNR and ongoing service charges for volumetric discharge, backwash recovery systems will be an important consideration for the future WTP.
An important concept in designing and optimizing a filtration system is Unit Filter Run Volume (UFRV). UFRV is a measurement of the volume of water though one square foot on filter media between backwash cycles. Maximizing UFRV will extend filter run-times and reduce backwash frequency, thereby reducing backwash wastewater and operational time on backwash support systems. UFRV can be optimized through the strategic selection of oxidation alternatives (i.e., different oxidants will create different size floc particles, influencing filterability) and filter media (i.e., strategic selection of effective media size will help promote filtration throughout the media depth).
2.2 SOFTENING
Implementing softening technology will improve the quality of finished water delivered to system customers, but there will be significant cost implications associated with that improvement. The decisions of 1) whether or not to soften, 2) how much of the water to soften, and 3) which softening technology to use are largely co-dependent. There are three (3) primary water softening technologies available (ion exchange, lime softening, and membranes) and each of the technologies will have advantages, disadvantages, and varying cost implications depending on both the selected technology and the determined capacity of the treatment system.

Reasonable Treatment Alternatives ScreeningCity of Otsego, MN P05409-2015-007
Another important factor to consider is the management of the residual and/or concentrate streams from the softening process. Both the flow volumes and characteristics of the residuals from any water softening process should be carefully evaluated during consideration of the alternatives. The residuals streams can frequently be overlooked during the design process but will ultimately have significant impact of the costs for management/disposal.
Above 2500 gpm lime softening and RO are generally more favorable, and less than 700 gpm-ion exchange is generally more favorable.
Ion exchange was ruled out due to the disadvantages listed above and the fact that the City’s future WTPs will be greater than 700 gpm.
Lime softening removes calcium, magnesium, and radium and was further considered. The process has been shown to remove up to 90% during co-precipitation with calcium and magnesium. Lime softening plants must be gravity driven and therefore are usually not cost-effective for small treatment facilities. A typical process is shown in Figure 2.4. Following a discussion of treatment alternative with City staff, lime softening was ruled out due to the disadvantages above.
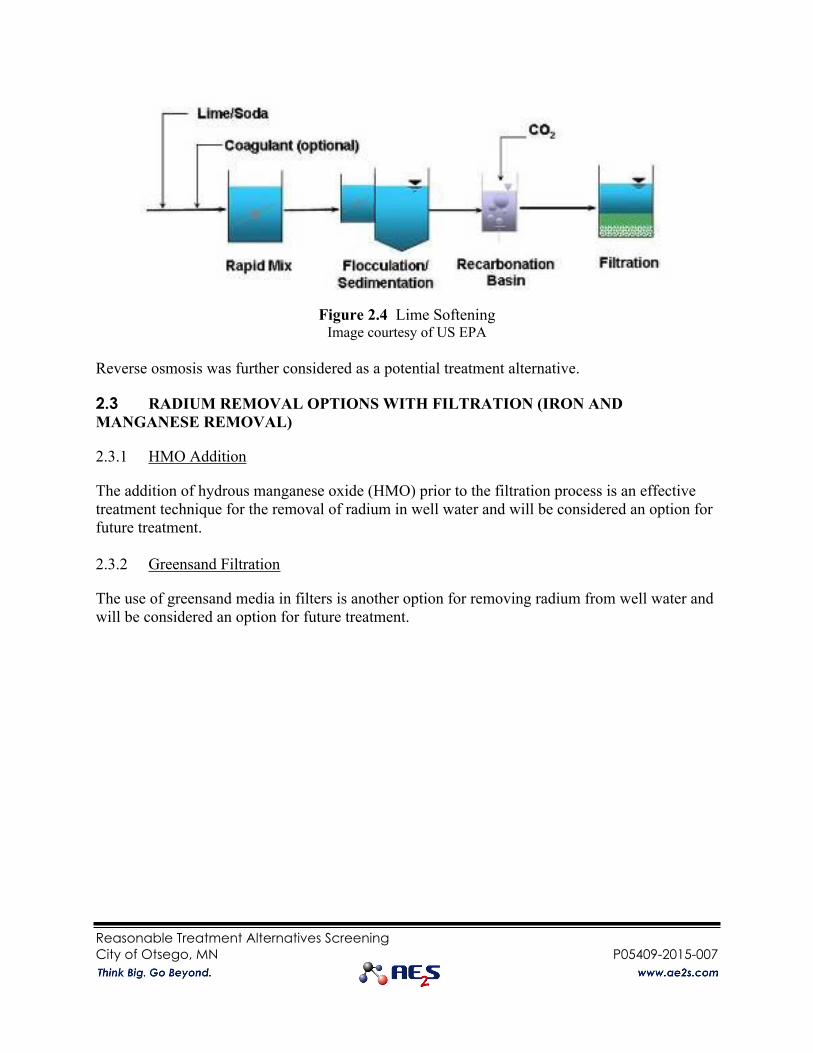
Reasonable Treatment Alternatives ScreeningCity of Otsego, MN P05409-2015-007
Figure 2.4 Lime SofteningImage courtesy of US EPA
Reverse osmosis was further considered as a potential treatment alternative.
2.3 RADIUM REMOVAL OPTIONS WITH FILTRATION (IRON AND MANGANESE REMOVAL)
2.3.1 HMO Addition
The addition of hydrous manganese oxide (HMO) prior to the filtration process is an effective treatment technique for the removal of radium in well water and will be considered an option for future treatment.
2.3.2 Greensand Filtration
The use of greensand media in filters is another option for removing radium from well water and will be considered an option for future treatment.

Reasonable Treatment Alternatives ScreeningCity of Otsego, MN P05409-2015-007
3 WATER TREATMENT PLANT OPTIONS
Based on a discussion of reasonable treatment alternatives with City staff, the following alternatives were considered for treatment:
Alternative1 Gravity Filtration E/W Collector WTP System
2 Gravity Filtration Dispersed WTP System
3 Gravity Filtration Central WTP System
4 Pressure Filtration E/W Collector WTP System
5 Pressure Filtration Dispersed WTP System
6 Pressure Filtration Central WTP System
7 Reverse Osmosis E/W Collector WTP System
8 Reverse Osmosis Dispersed WTP System
9 Reverse Osmosis Central WTP System
10 RO on West & Filtration on East E/W Collector WTP System
11 Maximize existing WTP infrastructure*
Combination of Dispersed & Collector WTP System
12 Surface Water Treatment Central WTP System


Water Treatment Alternative Development
City of Otsego, MN P05409-2013-002
Technical Memorandum: Treatment Alternative Development
Otsego Drinking Water System Master Plan
To: Kurt Neidermeier Utility Manager City of Otsego From: Nancy Zeigler, PE Scott Schaefer, PE AE2S
Date: July 30, 2019 Project No: P05409-2015-007
1 ALTERNATIVES EVALUATION – WATER TREATMENT
ALTERNATIVE DEVELOPMENT AND OBJECTIVES
The primary objectives of the treatment alternatives are to provide a treatment system to accommodate current/projected design service populations.
A phased approach was used for evaluating treatment alternatives. A phased approach to improvements has the following benefits:
• Lowers initial investment;
• Delays operation, maintenance and repair/replacement costs;
• Reduces construction duration;
• Provides flexibility for unforeseen growth patterns, either slower or faster than anticipated; and,
• Provides flexibility to accommodate future regulatory requirements.
Water treatment alternatives were evaluated to meet the projected ultimate water demands and regulations.
As discussed in the Basis of Design TM, land use plans and historic demands were used to establish current and projected demands. Population and demand projections are summarized in Table 1.1.

Water Treatment Alternative Development
City of Otsego, MN P05409-2013-002
Table 1.1 Existing and Projected Demands Summary
Current Population Served 11,511
Current Peak Day Demand, MGD 4.9
2080 Population Served ~60,000
2080 Peak Day Demand, MGD ~22.3
All alternatives will require increased utility services (power, natural gas, water) to the sites over the course of time. Costs for extending these utility services are not included in the analysis conducted in this TM.
The following factors were used for evaluating and sizing treatment facilities:
• Capacity was based on projected water demands.
• Treatment was based on well water quality and regulations
• A computer model of the distribution system was used for evaluating each alternative and required trunk main location and size t meet desirable distribution pressures and available fire flows.
2 ALTERNATIVES CONSIDERED BUT ELIMINATED Alternatives that were considered but determined to be less desirable and, therefore, eliminated from further evaluation are as follows. Additional information is provided in the Reasonable Alternatives Screening – Water Treatment TM.
• Gravity Filtration – Multiple Dispersed WTP Systems
• Gravity Filtration – 1 Central WTP System
• Pressure Filtration – 2 Collector WTP Systems
• Pressure Filtration – 1 Central WTP System
• Reverse Osmosis – 2 Collector WTP Systems
• Reverse Osmosis – Multiple Dispersed WTP Systems
• Reverse Osmosis – 1 Central WTP System
• Reverse Osmosis and Filtration – 2 Collector WTP Systems
• Surface Water Treatment – 1 Central WTP System
3 ALTERNATIVES FURTHER EVALUATED
Alternatives that were screened and deemed reasonable are further evaluated in this TM. These alternatives include:

Water Treatment Alternative Development
City of Otsego, MN P05409-2013-002
• Alternative 1: Gravity Filtration - 2 Larger WTPs
• Alternative 2: Pressure Filtration - Dispersed WTP System
• Alternative 3: Combination of Dispersed & Collector WTP System
The treatment by gravity or pressure will consist of chemical addition and filtration. Proposed chemical feeds for all options include:
• Chlorine
• Fluoride
• Orthophosphate/Polyphosphate
• Sodium Permanganate
• Manganese and Iron Removal
• HMO for Radium Removal
4 ALTERNATIVE 1: GRAVITY FILTRATION - 2 LARGER WTPS
A typical process flow diagram and WTP layout for a larger gravity filtration WTP is included in the Appendix. This alternative consists of 2 larger water treatment facilities. Existing and future wells would pump to two larger centrally located gravity filtration WTPs (“Collector WTPs”). The water would then flow by gravity through the filters and into a clearwell for storage. Stored water would be pumped into the distribution system. Some considerations for this alternative include the following:
• Increased length of raw water mains from wells to facility.
• Increased size of trunk main leaving facility.
• Two centralized locations for treatment.
• Relatively easy to update to new standards.
5 ALTERNATIVE 2: PRESSURE FILTRATION - DISPERSED WTP
SYSTEM
A typical process flow diagram and WTP layout for a relatively smaller pressure filtration WTP is included in the Appendix. This alternative consists of dispersed, small WTPs that use pressure filtration. The existing pumping facilities would be upgraded to include pressure filtration where possible. The water from the wells would be pumped through the pressure filters and into the distribution system.
Some considerations for this alternative include the following:
• Dispersed treatment spread across the City
• Two or three wells would enter a pump house and undergo pressure filtration and treatment before entering the distribution system. Storage and re-pumping should not be required.

Water Treatment Alternative Development
City of Otsego, MN P05409-2013-002
6 ALTERNTIVE 3: COMBINATION OF DISPERSED & COLLECTOR
WTP SYSTEM
Alternative 3 is a combination of Alternatives 1 & 2. It consists of dispersed, small WTPs with pressure filtration as well as one larger gravity filtration facility
Some considerations for this alternative include the following:
• Benefits of having a larger facility while also maintaining smaller WTPs
• Flexibility in phasing
7 COMPARISON OF ALTERNATIVES
The different Alternative will require the same number of wells and total storage, but will differ in the size and number of WTPs and size and length of raw watermain from wells to WTPs.
Table 7.1 Comparison of Alternatives
Alt. 1 - Gravity Filtration-2 Larger
WTPs
Alt. 2 - Pressure Filtration- Dispersed
WTP System
Alt. 3 - Combination of Dispersed & Collector WTPs
Total Wells 17 17 17
Total Towers/Ground Storage Tanks
10.9 MG 10.9 MG 10.9 MG
Large WTP 2 0 1
Small WTP 0 8 4
New Raw Watermain
12-inch 43,600 ft. 10,000 ft. 15,000 ft
New Trunk Watermain
12-inch 55,700 ft. 73,800 ft. 66,800 ft.
16-inch 42,100 ft. 33,100 ft. 33,800 ft.
24-inch 16,900 ft. 1,300 ft. 6,300 ft.
36-inch 1,300 ft.

Water Treatment Alternative Development
City of Otsego, MN P05409-2013-002
8 OPINIONS OF PROBABLE COSTS – WATER TREATMENT
ALTERNATIVES
8.1 CAPITAL COSTS
The construction cost and operation and maintenance cost estimates presented are based on 2019 dollars. Detailed financial analysis should provide an inflation factor, which is checked and adjusted annually through the life of the facilities. The conceptual opinion of probable cost was developed based on previous project data. This cost opinion represents a Class 4 Estimate based on the definitions of the Association for Advancement of Cost Engineering (AACE) International. This level of cost opinion is appropriate for planning level evaluations made with incomplete information. The cost opinion at this level of engineering is considered to have an accuracy range of +50/-30 percent. Actual costs will not be determined until a bidding process has been completed at the time of construction.
The alternatives presented may require the procurement of additional land. Engineering (design, bidding, and construction) and legal/administrative were assumed to be approximately 20 percent of construction costs. Construction contingency was assumed to be 15 percent.
A summary of probable construction and capital costs for water treatment alternatives are presented in Table 8.1. Alt. 3 Combination of Dispersed and Collector WTP was the lowest capital cost alternative. Alt. 2 and Alt. 1 were the second and third capital cost alternatives, respectively.
Table 8.1 Opinion of Probable Construction and Capital Costs – (2019 $)
Description
Alt. 1 - Gravity
Filtration-2 Larger WTPs
Alt. 2 - Pressure
Filtration- Dispersed
WTP system
Alt. 3 - Combination of Dispersed & Collector
WTPs
Factors
Treatment Plant Costs $44,000,000 $40,000,000 $38,000,000
Piping Cost Estimate $16,110,000 $12,670,000 $13,715,000 -
Raw Watermain $4,360,000 $1,000,000 $1,500,000 -
Subtotal $64,470,000 $53,670,000 $53,215,000
Construction Contingencies $9,671,000 $8,051,000 $7,982,000 15-percent
Undeveloped Design Details $6,447,000 $5,367,000 $5,322,000 10-percent
Construction Subtotal $80,588,000 $67,088,000 $66,519,000
Engineering, Legal, Admin $12,894,000 $10,734,000 $10,643,000 20-percent
Total Opinion of Probable Cost $93,482,000 $77,822,000 $77,162,000

Water Treatment Alternative Development
City of Otsego, MN P05409-2013-002
8.2 OPERATION AND MAINTENANCE AND O&M NET PRESENT WORTH
Operation, maintenance and repair (OM&R) costs are a significant portion of the total annual cost of water treatment. They are essential to include in evaluations and analyses of planned alternatives. In many instances, an analysis of the OM&R costs reveals significant enough annual costs to justify the selection of a more expensive capital cost alternative. In other instances, it allows a less expensive capital cost alternative to be selected while planning for future OM&R costs. Major OM&R costs include labor, power, equipment maintenance and repair, lab testing and chemical costs. Some of the alternatives presented in this report require more operator attention and thus, carry a higher estimated labor cost. Labor requirements were determined using the Northeast Guide for Estimating Staffing at Publicly
and Privately Owned Wastewater Treatment Plants (2008). This document provides an update and expansion to a 1973 EPA Guide for labor requirements, and it provides more detailed information for biosolids treatment processes. An average cost of $89,000 per year per employee was used and includes all wages and benefits. Power costs are based on a unit cost of $0.07 per kW-hr. Equipment maintenance/repair costs are based on equipment lifetime repairs. Annual maintenance costs were calculated based on the value and complexity of the equipment. A simple net present worth (NPW) analysis for the O&M costs were completed to compare the cost of each of the alternatives in 2019 dollars. The analysis uses anticipated O&M costs discussed previously. The present worth analysis was prepared over 20 years and assuming 80-percent of projected buildout annual costs to account for phased construction. Operations, maintenance, and repair costs and a 20-year simplified NPW for the OM&R costs for the water treatment alternatives are presented in Table 8.2. Alt. 1 Two Large Gravity Filter Plants is the lowest O&M/O&M NPW alternative. Alt. 3 & Alt. 2 were second and third, respectively. However, all alternatives were relatively close in OM&R cost estimates, with a range of $1.58 - $1.65 million average annual cost.

Water Treatment Alternative Development
City of Otsego, MN P05409-2013-002
Table 8.2 Opinion of Probable Operations, Maintenance, & Repair Costs: (2019$)
Alt. 1
Two Large Gravity Filter Plants
Alt. 2 Individual Pressure
Treatment
Alt. 3 Combo
Labor $ 178,000.00 $ 178,000.00 $ 178,000.00
Power $ 84,136.42 $ 68,741.90 $ 76,782.11
Maintenance and Repair $ 21,358.73 $ 207,669.84 $ 150,069.84
Chemical $ 1,200,000.00 $ 1,200,000.00 $ 1,200,000.00
Total Average Annual Cost $ 1,583,495.15 $ 1,654,411.74 $ 1,604,851.95
NPW (20 Year) $ 25,335,922.43 $ 26,470,587.78 $ 25,677,631.15

Water Treatment Alternative Development
City of Otsego, MN P05409-2013-002
8.3 Alternative Costs Summary
A summary of the presented costs is included in Figure 8.1. This figure details the capital and O&M NPW values summed.
Figure 8.1 Alternative Costs Summary – Water Treatment ($millions)
$93.5
$77.8 $77.2
$25.3
$26.5 $25.7
$118.8
$104.3 $102.8
$0.0
$20.0
$40.0
$60.0
$80.0
$100.0
$120.0
$140.0
Alt. 1 - Gravity
Filtration-2 Larger WTPs
Alt. 2 - Pressure
Filtration- Dispersed
WTP system
Alt. 3 - Combination of
Dispersed & Collector
WTPs
Alternative Costs ($millions)
Capital Cost O&M NPW

Water Treatment Alternative Development
City of Otsego, MN P05409-2013-002
9 KEPNER-TREGOE ANALYSIS AND RESULTS
A Kepner-Tregoe decision making process was used in evaluating the water treatment alternatives. The process began by determining a list of criteria to rank the alternatives. The criteria were selected to cover a wide range of important categories including costs, stakeholder acceptance, and operations. A total of twenty-one criteria were chosen. These criteria were then ranked in terms of their importance on a scale of one to ten. The ability of each water treatment alternative to satisfy the respective criteria was then assigned using a scale of one to ten. A weighted value for each criterion was determined based on the criteria importance and alternative’s ability to satisfy – this was performed by multiplying the criteria performance by the ability to satisfy. These values were then weighted using the top performing alternative for each category and the overall category significance to provide values used in the final analysis. Table 9.1 and Figure 9.1 detail the categories, criteria, and results.
Table 9.1 Kepner-Tregoe Analysis – Water Treatment Alternatives

Water Treatment Alternative Development
City of Otsego, MN P05409-2013-002
Figure 9.1 Kepner-Tregoe Analysis
10 RECOMMENDATION
Based on the presented costs and Kepner-Tregoe analysis, AE2S recommends that Alt. 3 Combination of Dispersed and Collector WTP be selected. Alt. 3 provides the highest ranked Kepner-Tregoe alternative.
1.50 1.45 1.47
5.40 5.92 6.00
2.502.44 2.47
9.409.81 9.95
0.00
2.00
4.00
6.00
8.00
10.00
12.00
Alt. 1 - Gravity Filtration-2 Larger
WTPs
Alt. 2 - Pressure Filtration- Dispersed
WTP system
Alt. 3 - Combination of Dispersed &
Collector WTPs
KT Analysis
STAKEHOLDER COST OPERATIONS


Drinking Water Improvements Phasing
City of Otsego, MN P05409-2015-007
Technical Memorandum: Drinking Water Improvements Phasing
Otsego Drinking Water System Master Plan
To: Kurt Neidermeier Utility Manager City of Otsego From: Scott Schaefer, PE Nancy Zeigler, PE AE2S
Date: November 19, 2019 Project No: P05409-2015-007
1 SUMMARY
The previous technical memorandums detailed information for multiple alternatives including costs (capital, operations & maintenance, net present worth), advantages/disadvantages, City input, and professional judgement. Based on the information presented in these technical memorandums, specific alternatives were recommended and selected for phasing discussion. The specific selected alternatives were as follows:
• 1 - Central Water Treatment Plant
• 4 - Smaller dispersed WTP located at or near the existing pump houses
A discussion of the phasing plan is detailed by this technical memorandum and includes capital costs for phases projected to occur within the next 20 years.

Drinking Water Improvements Phasing
City of Otsego, MN P05409-2015-007
2 PHASING FACTORS
After selection of the specific alternative, the following factors were the primary considerations in determining when specific equipment and phase initiations were required for each facility:
• Capacity: Any time a critical facility approaches capacity, a new phase is required (unless it is determined with certainty that no additional growth will occur). Capacity is not the only phasing factor; however, it is the primary driver for many phase initiations.
• Regulatory: While it is possible that regulatory phasing factors may coincide with capacity requirements, regulatory requirements on their own are a factor. They can dictate the decision to move to a new technology or add a unit process in an earlier phase rather than expand using existing technology. Additionally, regulatory expectations can allow for specific items to be planned for, but not provided/built until later phases.
• Miscellaneous: Additional drivers, such as current deficiencies or deficiencies that develop between phases, may exist and require smaller scale, interim projects to address outside of the major phases. Discussion of these items is limited in this memorandum to existing issues.
• Age/Condition: The age and condition of existing facilities can be a driver for capital projects. Age/condition will be a trigger for equipment maintenance, but they are not a primary driver for major phases of capital expenditure.
3 PHASING PLAN
The following assumptions were used in the development of the phasing plan for the drinking water infrastructure:
• “Phase Initiation” is defined as the beginning of Preliminary Design and/or Preliminary Engineering Report.
• Population projections used throughout the study have been based on an increase in RECs of 282/year.
• All demand values presented are based on population projections and resulting water demands as developed in previous memorandums.
• Items considered incidental to an improvement (e.g., piping, site civil, and electrical) are not explicitly included in the summary tables.
• These phasing improvements do not include an assessment of the need to replace equipment, as required by condition, over time. A separate rehabilitation and replacement analysis was conducted for the existing equipment.

Drinking Water Improvements Phasing
City of Otsego, MN P05409-2015-007
3.1 WELLS, TOWERS, WTP & DISTRIBUTION SYSTEM
The addition of wells, towers, WTPs and resulting trunk watermains will be dependent on population growth and resulting water demands. A phasing plan of the key projects that are anticipate in the next 20 years is provided in Table 3.1.
Table 3.1 Water Project Phasing Plan: 2020-2040
Groupings Capital Improvement Project
Projected Project
Initiation Year
Projected Project
On-Line Year
Near Term Improvements
New Well 9 (or 1A) to Replace Well 1 2019 2020
Tower No. 4 (1.5 MG) West System 2020 2021
Connect East & West Systems (Minimum) 2020 2023
Additional East & West Trunk Watermain (Development driven)
2025 2032
New Well 10 at Pump House 4 2021 2023
Satellite WTPs;
Implement over 2 to 3
years
Rehab Pump House 2 (Treatment) 2025 2026
Rehab Pump House 4 (Treatment) 2025 2026
Rehab Pump House 3 (Treatment) 2026 2027
Rehab Pump House 1 (Treatment) 2026 2027
Large WTP Package
New Well 11 (New Central Wellfield) & Raw Watermain
2029 2031
New Well 12 (New Central Wellfield) & Raw Watermain
2029 2031
New Well 13 (New Central Wellfield) & Raw Watermain
2034 2036
New Well 14 (New Central Wellfield) & Raw Watermain
2038 2040
WTP 1 & 1 MG Clearwell (Phase 1) 2029 2032
Trunk Watermain Improvements (Minimum) 2033 2040
Longer Term Distribution
Improvements
Additional Trunk Watermain Improvements (Development Driven)
2033 2040
Tower No. 5 (1.5 MG) (Upper Zone) 2034 2035

Drinking Water Improvements Phasing
City of Otsego, MN P05409-2015-007
3.1.1 Wells
Figure 3.1 shows well capacity over the next 20 years as related to population and water demand. Future well capacity will need to meet future maximum day water demands. The adequacy of a City’s well supply is evaluated based on its firm capacity, which assumes the largest well out of service. Prior to the connection of the East and West systems two wells are assumed to be out of service for firm capacity. After the connection of the two systems only one is assumed to be out of service. The capacity of future wells has been assumed to be 1000 gpm.
Based on assumptions, one East well and one West well will be needed before a new central wellfield is developed for four wells near the Central WTP. One of the increases in well firm capacity is due to connecting the East and West systems in 2023.
Figure 3.1 Well Phasing: 2019-2040
0.0
2.0
4.0
6.0
8.0
10.0
12.0
14.0
16.0
18.0
2019 2024 2029 2034 2039
-
5,000
10,000
15,000
20,000
25,000
30,000
De
ma
nd
(M
GD
)
Year
Po
pu
lati
on
Otsego Well Capacity and Water Demand
Population Served Maximum Day DemandAverage Daily Demand Well Firm Capacity

Drinking Water Improvements Phasing
City of Otsego, MN P05409-2015-007
3.1.2 Storage
The proposed timing of storage facilities is presented in Figure 3.2. Storage facilities are typically sized to provide: 1) Equalization Storage – to meet hourly system water demands exceeding supply pumping capacity, 2) Fire Protection Storage – to meet the demands of firefighting, and 3) Emergency Storage – to provide water reserves for contingencies such as system failures, power outages, and other emergencies.
3.2 PHASE INITIATION AND OPERATIONAL TRIGGERS
The actual timing of capital improvements listed in Table 3.1 will be dependent on actual population growth rates. If growth is slower than the assumed 282 RECs per year than projects may be delayed. The addition of Tower 4 and the connection of the East and West systems are significant near-term capital improvement projects. Tower 4 is anticipated to be needed at 4393 RECs and the connection of the East and West systems is anticipated to be needed at 5239 RECs. Figure 3.3 detail the years Tower 4 and the East-West connection are needed based on different growth rates.

Drinking Water Improvements Phasing
City of Otsego, MN P05409-2015-007
Figure 3.4 Water Storage Timing: 2019-2040

Drinking Water Improvements Phasing
City of Otsego, MN P05409-2015-007
Figure 3.3 Water System – Phase Initiation and Operational Triggers: 2019-2040
3000
4000
5000
6000
7000
8000
9000
10000
2019 2024 2029 2034 2039
RECs
Year
Water System - Phase Initiation and Operational Triggers (2019-
2040)
Initiate Tower No. 4 (1.5 MG) West System & Connect East & West
Systems = 4393 RECS
100
150
200
300
Connect East &
West Systems
Tower No. 4 (1.5 MG) Online =

Drinking Water Improvements Phasing
City of Otsego, MN P05409-2015-007
3.3 PHASING 20-YEAR CAPITAL COSTS
Table 3.3 and Figure 3.4 present the capital costs in 2019 dollars of the phases projected to occur within 20 years.
Table 3.3 Opinion of Probable Project Capital Costs: 2020-2040
Groupings Capital Improvement Project
Projected Project
Initiation Year
Projected Project
On-Line Year
Total Projected Cost
(2019$)
Near Term Improvements
New Well 9 (or 1A) to Replace Well 1 2019 2020 $800,000
Tower No. 4 (1.5 MG) West System 2020 2021 $6,325,000
Connect East & West Systems (Minimum) 2020 2023 $5,482,500
Additional East & West Trunk Watermain (Development driven)
2025 2032 $2,220,000
New Well 10 at Pump House 4 2021 2023 $1,500,000
Satellite WTPs;
Implement over 2 to 3
years
Rehab Pump House 2 (Treatment) 2025 2026 $9,000,000
Rehab Pump House 4 (Treatment) 2025 2026 $3,000,000
Rehab Pump House 3 (Treatment) 2026 2027 $3,000,000
Rehab Pump House 1 (Treatment) 2026 2027 $9,000,000
Large WTP Package
New Well 11 (New Central Wellfield) & Raw Watermain
2029 2031 $1,500,000
New Well 12 (New Central Wellfield) & Raw Watermain
2029 2031 $1,500,000
New Well 13 (New Central Wellfield) & Raw Watermain
2034 2036 $1,500,000
New Well 14 (New Central Wellfield) & Raw Watermain
2038 2040 $1,500,000
WTP 1 & 1 MG Clearwell (Phase 1) 2029 2032 $26,400,000
Trunk Watermain Improvements (Minimum) 2033 2040 $4,620,000
Longer Term Distribution
Improvements
Additional Trunk Watermain Improvements (Development Driven)
2033 2040 $2,355,000
Tower No. 5 (1.5 MG) (Upper Zone) 2034 2035 $6,325,000

Drinking Water Improvements Phasing
City of Otsego, MN P05409-2015-007
Figure 3.4 Water Utility CIP: 2020-2040
A more detailed CIP is attached. Since WTP initiation is likely regulatory driven and not explicitly tied to growth and development a potential CIP without Treatment is also attached.
$0
$5
$10
$15
$20
$25
20
20
20
21
20
22
20
23
20
24
20
25
20
26
20
27
20
28
20
29
20
30
20
31
20
32
20
33
20
34
20
35
20
36
20
37
20
38
20
39
20
40
An
nu
al E
ncu
mb
era
nce
, $M
MOtsego Water Utility CIP

Otsego Opinion of Probable Project Capital Costs – 2020-2040
Groupings Capital Improvement Project
Projected
Project
Initiation
Year
Projected
Project On-
Line Year
Total Projected
Cost (2019$)2020 2021 2022 2023 2024 2025 2026 2027 2028 2029 2030 2031 2032 2033 2034 2035 2036 2037 2038 2039 2040
New Well 9 (or 1A) to Replace Well 1 2019 2020 $800,000 $800,000
Tower No. 4 (1.5 MG) West System 2020 2021 $6,325,000 $300,000 $6,025,000
Connect East & West Systems (Minimum) 2020 2023 $5,482,500 $50,000 $50,000 $2,691,250 $2,691,250
Additional East & West Trunk Watermain (Development driven) 2025 2032 $2,220,000 $277,500 $277,500 $277,500 $277,500 $277,500 $277,500 $277,500 $277,500
New Well 10 at Pump House 4 2021 2023 $1,500,000 $30,000 $125,000 $1,345,000
Rehab Pump House 2 (Treatment) 2025 2026 $9,000,000 $900,000 $8,100,000
Rehab Pump House 4 (Treatment) 2025 2026 $3,000,000 $300,000 $2,700,000
Rehab Pump House 3 (Treatment) 2026 2027 $3,000,000 $250,000 $2,750,000
Rehab Pump House 1 (Treatment) 2026 2027 $9,000,000 $750,000 $8,250,000
New Well 11 (New Central Wellfield) & Raw Watermain 2029 2031 $1,500,000 $110,000 $125,000 $1,265,000
New Well 12 (New Central Wellfield) & Raw Watermain 2029 2031 $1,500,000 $110,000 $125,000 $1,265,000
New Well 13 (New Central Wellfield) & Raw Watermain 2034 2036 $1,500,000 $110,000 $125,000 $1,265,000
New Well 14 (New Central Wellfield) & Raw Watermain 2038 2040 $1,500,000 $110,000 $125,000 $1,265,000
WTP 1 & 1 MG Clearwell (Phase 1) 2029 2032 $26,400,000 $528,000 $1,672,000 $12,100,000 $12,100,000
Trunk Watermain Improvements (Minimum) 2030 2031 $4,620,000 $385,000 $4,235,000
Additional Trunk Watermain Improvements (Development Driven) 2033 2040 $2,355,000 $294,375 $294,375 $294,375 $294,375 $294,375 $294,375 $294,375 $294,375
Tower No. 5 (1.5 MG) (Upper Zone) 2034 2035 $6,325,000 $300,000 $6,025,000
Annual Encumberance, $MM $1.15 $6.11 $2.82 $4.04 $0.00 $1.48 $12.08 $11.28 $0.28 $1.25 $2.58 $19.14 $12.38 $0.29 $0.59 $6.44 $1.56 $0.29 $0.29 $0.42 $1.56
Notes:
Total Project Cost includes: 25% contingency & 20% Eng. Legal & Admin.
Projected "On-Line Year" based upon maintaining level of service critiera (i.e. storage/fireflow, etc)
WTP initiation is likely regulatory driven and not explicitly tied to development/growth
Near Term
Improvements
Satellite WTPs;
Implement over 2
to 3 years
Large WTP
Package
Longer Term
Distribution
Improvements

Otsego - No Treatement Option -Opinion of Probable Project Capital Costs – 2020-2040
Groupings Capital Improvement Project
Projected
Project
Initiation
Year
Projected
Project On-
Line Year
Total Projected
Cost (2019$)2020 2021 2022 2023 2024 2025 2026 2027 2028 2029 2030 2031 2032 2033 2034 2035 2036 2037 2038 2039 2040
New Well 9 (or 1A) to Replace Well 1 2019 2020 $800,000 $800,000
Tower No. 4 (1.5 MG) West System 2020 2021 $6,325,000 $300,000 $6,025,000
Connect East & West Systems (Minimum) 2020 2023 $5,482,500 $50,000 $50,000 $2,691,250 $2,691,250
Additional East & West Trunk Watermain (Development driven) 2025 2032 $2,220,000 $277,500 $277,500 $277,500 $277,500 $277,500 $277,500 $277,500 $277,500
New Well 10 at Pump House 4 2021 2023 $1,500,000 $30,000 $125,000 $1,345,000
Rehab Pump House 2 (Treatment) 2028 2029 $3,000,000 $250,000 $2,750,000
Rehab Pump House 4 (Treatment) 2034 2035 $3,000,000 $250,000 $2,750,000
Rehab Pump House 3 (Treatment) 2031 2032 $3,000,000 $250,000 $2,750,000
Rehab Pump House 1 (Treatment) 2025 2026 $3,000,000 $250,000 $2,750,000
New Well 11 (New Central Wellfield) & Raw Watermain 2029 2031 $1,500,000 $110,000 $125,000 $1,265,000
New Well 12 (New Central Wellfield) & Raw Watermain 2034 2036 $1,500,000 $110,000 $125,000 $1,265,000
New Well 13 (New Central Wellfield) & Raw Watermain 2038 2040 $1,500,000 $110,000 $125,000 $1,265,000
Pump House 5 & 1 MG Clearwell 2029 2032 $6,000,000 $120,000 $380,000 $2,750,000 $2,750,000
Trunk Watermain Improvements (Minimum) 2030 2031 $4,620,000 $385,000 $4,235,000
Additional Trunk Watermain Improvements (Development Driven) 2033 2040 $2,355,000 $294,375 $294,375 $294,375 $294,375 $294,375 $294,375 $294,375 $294,375
Tower No. 5 (1.5 MG) (Upper Zone) 2034 2035 $6,325,000 $300,000 $6,025,000
Annual Encumberance, $MM $1.15 $6.11 $2.82 $4.04 $0.00 $0.53 $3.03 $0.28 $0.53 $3.26 $1.17 $8.78 $5.78 $0.29 $0.95 $9.19 $1.56 $0.29 $0.40 $0.42 $1.56
Notes:
Total Project Cost includes: 25% contingency & 20% Eng. Legal & Admin.
Projected "On-Line Year" based upon maintaining level of service critiera (i.e. storage/fireflow, etc)
Existing Pump
Station
Rehabilitation
Near Term
Improvements
Longer Term
Distribution
Improvements
New Pump House
& Wells


Existing Equipment R&R AnalysisCity of Otsego, MN P05409-2015-007
Technical Memorandum: Existing Equipment Rehabilitation & Replacement Analysis
Otsego Drinking Water System Master Plan
To: Kurt NeidermeierUtility ManagerCity of Otsego
From: Nancy Zeigler, PE Scott Schaefer, PEAE2S
Date: August 15, 2018
Project No: P05409-2015-007
1 SUMMARY
A summary of the major existing water infrastructure for the City of Otsego is provided in this technical memorandum.

Existing Equipment R&R AnalysisCity of Otsego, MN P05409-2015-007
2 EXISTING INFRASTRUCTURE
The major water infrastructure of the City includes water towers, wells, and pumping facilities. The pumping facilities were originally labeled as Well Houses. Through the drinking water master planning, it was determined that these facilities would be termed Pump Houses to avoid confusion with facilities associated with wells.
Table 2.1 provides a summary of the existing wells, when they were installed, their status, as well as the rehabilitation schedule and associated cost as identified in the City’s 2019 Water Utility CIP planning. Wells have an average lifespan of 100 years and are typically inspected and rehabilitated every 10-12 years based on average use and video. Rehabilitation typically includes service and repair of equipment as well as the potential for redevelopment of the well which includes cavern expansion and sand removal.
Table 2.1. Well Summary
*Years in bold are planned in the City’s 2018-2027 CIP Water Utility Plan
Table 2.2 shows the summary of the four Pump Houses that Otsego currently operates. These buildings contain raw water piping, sometimes a well, chemical storage and addition, and distribution piping, as well as various valves and gauges. The typical life span for these buildings is 100 years with an estimated rehabilitation schedule of every 20 years. The table below shows the year the building was constructed. These pump houses will be scheduled for total renovation and rehabilitation, including the addition of treatment, as part of the overall drinking water system plan. Therefore, costs are included in the proposed phasing and CIP plan included in a separate TM.
WellYear
Installed
Status of Operatio
nRehabilitation Schedule*
Estimated Rehabilitatio
n CostWell #1 1994 Emergency
Only To be retired N/A
Well #1 (new) 2020 New 2030 $80,000
Well #2 1998 Emergency Only 2022 $60,000
Well #3 2001 Active Redeveloped 2007, motor replaced 2014, 2021 $120,000
Well #4 2003 Active Pump and pipe replaced 2019, Inspect 2031 $70,000
Well #5 2003 Active Pump, motor, and pipe replaced 2017, 2027 $70,000
Well #6 2004 Active Pump inspection in 2009, Some pipe and seals replaced 2016, 2027 $70,000
Well #7 2005 Active Pump, motor, and pipe replaced 2017, 2028 $70,000
Well #8 2007 Active Pump replaced 2017, VFD replaced 2018, 2025 $120,000

Existing Equipment R&R AnalysisCity of Otsego, MN P05409-2015-007
Table 2.2. Pump House summary
Structure Name Year Constructed
Pump House 1 2000
Pump House 2 2001
Pump House 3 2004
Pump House 4 2005
Table 2.3 shows the summary of the three water towers. Coatings applied previously have a life span of about 15-20 years. Inspections are conducted on a five-year basis to update coating condition and assist with determining specific timing of rehabilitation. The following is from the City’s 2018 Water Utility CIP and the 2019 Water Utility CIP planning. New coatings are assumed to have a life span of approximately 25 years.
Table 2.3. Storage Summary
Structure Name
Type of Storage Structure
Year Constructed
Year to be Rehabilitated
Estimated Rehabilitation Cost
Tower 1 Elevated storage 1999 Not scheduled N/A
Tower 2 Elevated storage 2004 2020 $954,436
Tower 3 Elevated storage 2008 Inspection 2027Reconditioning 2028
$27,000$1,750,000

APPENDIX A
Maps

#I#I
#I
#I
]̂UT
]̂UT
]̂UT
ISTH 94
95th St NE
MNTH 101
60th St NE
70th St NE
CSAH 37
Kadle
r Ave
NE
River Rd
80th St NE Odea
n Ave
NE
CSAH 36
70th St
Page
Ave
Nash
ua Av
e NE
83rd St NE
Parri
sh Av
e NE
96th St NE
Maso
n Ave
NE
Mc A
llister
Ave N
E
6119
70th St NE
¯
Newtown TankOverflow = 4100 ft
City ofOtsegoWater
DistributionSystem
Existing System
Water MainDiameter
ProposedGravity Sewer
UpsizeExistingGravity Sewer
UpsizeExistingGravity Sewer
Water Facilities]̂UT Water Tower
Existing Well House#I Pressure Reducing Valve
City LimitsWater Distribution Main
16" Water Main12" Water Main10" Water Main8" Water Main6" Water Main4" Water Main3" Water Main
Test #22-12 psi
Test #23-24 psi
Advanced Engineering and Environmental Services, Inc.
0 10,0005,000 Feet

#I#I
#I
#I
]̂UT
]̂UT
]̂UT
ISTH 94
95th St NE
MNTH 101
60th St NE
70th St NE
CSAH 37
Kadle
r Ave
NE
River Rd
80th St NE Odea
n Ave
NE
CSAH 36
70th St
Page
Ave
Nash
ua Av
e NE
83rd St NE
Parri
sh Av
e NE
96th St NE
Maso
n Ave
NE
Mc A
llister
Ave N
E
6119
70th St NE
¯
Newtown TankOverflow = 4100 ft
City ofOtsegoWater
DistributionSystem
Existing System
Max Day Demand(5.4 MGD)
ProposedGravity Sewer
UpsizeExistingGravity Sewer
UpsizeExistingGravity Sewer
Water Facilities]̂UT Water Tower
Existing Well House#I Pressure Reducing Valve
City LimitsWater Distribution Main
16" Water Main12" Water Main10" Water Main8" Water Main6" Water Main4" Water Main3" Water Main
Test #22-12 psi
Test #23-24 psi
Advanced Engineering and Environmental Services, Inc.
0 10,0005,000 Feet
Average Pressures< 30 psi30 - 39 psi40 - 49 psi50 - 59 psi60 - 69 psi70 - 79 psi80 - 89 psi90 - 99 psi> 100 psi

#I#I
#I
#I
]̂UT
]̂UT
]̂UT
ISTH 94
95th St NE
MNTH 101
60th St NE
70th St NE
CSAH 37
Kadle
r Ave
NE
River Rd
80th St NE Odea
n Ave
NE
CSAH 36
70th St
Page
Ave
Nash
ua Av
e NE
83rd St NE
Parri
sh Av
e NE
96th St NE
Maso
n Ave
NE
Mc A
llister
Ave N
E
6119
70th St NE
¯
Newtown TankOverflow = 4100 ft
City ofOtsegoWater
DistributionSystem
Existing System
Max Day Demand(5.4 MGD)
ProposedGravity Sewer
UpsizeExistingGravity Sewer
UpsizeExistingGravity Sewer
Water Facilities]̂UT Water Tower
Existing Well House#I Pressure Reducing Valve
City LimitsWater Distribution Main
16" Water Main12" Water Main10" Water Main8" Water Main6" Water Main4" Water Main3" Water Main
Test #22-12 psi
Test #23-24 psi
Available Fire Flow at 20 psiLess than 500 gpm500 to 1,000 gpm1,000 to 1,500 gpm1,500 to 2,500 gpm2,500 to 3,500 gpm3,500 to 5,000 gpm5,000 to 8,000 gpmGreater than 8,000 gpm
Advanced Engineering and Environmental Services, Inc.
0 10,0005,000 Feet

[Ú
#I#I
#I
#I#I
#I
#I
]̂UT
]̂UT
]̂UT
]̂UT
]̂UT
]̂UT
MNTH 101
60th St NE
70th St NE
CSAH 37
Kadle
r Ave
NE
River Rd
80th St NE
Odea
n Ave
NE
La B
eaux
Ave
CSAH 36
70th St
Page
Ave
Nash
ua Av
e NE
83rd St NE
Parri
sh Av
e NE
96th St NE
Mc A
llister
Ave N
E 6119
90th St NE
70th St NE
¯
Newtown TankOverflow = 4100 ft
City ofOtsegoWater
DistributionSystemFuture Water
Distribution SystemPressure Zones
ProposedGravity Sewer
UpsizeExistingGravity Sewer
UpsizeExistingGravity Sewer
Water Storage]̂UT Existing Tower]̂UT Future Tower
Pressure Reducing Valve#I Existing#I FutureDistribution Facility[Ú Future Booster StationWater Main
ExistingFuture
Pressure ZonesHighLowSW BoosterExpansion AreaCity Limits
Test #22-12 psi
Test #23-24 psi
Advanced Engineering and Environmental Services, Inc.
0 10,0005,000 Feet

[Ú
3Q
3Q[Ú
#I#I
#I
#I
#I
#I
]̂UT
]̂UT
]̂UT
]̂UT
]̂UT
]̂UT
UT
MNTH 101
60th St NE
70th St NE
CSAH 37
Kadle
r Ave
NE
River Rd
80th St NE
Odea
n Ave
NE
La B
eaux
Ave
CSAH 36
70th St
Page
Ave
Nash
ua Av
e NE
83rd St NE
Parri
sh Av
e NE
96th St NE
Mc A
llister
Ave N
E 6119
90th St NE
70th St NE
¯
Newtown TankOverflow = 4100 ft
City ofOtsegoWater
DistributionSystem2 Larger WTP's
System AlternativeMax Day Demand
(22.3 MGD)
ProposedGravity Sewer
UpsizeExistingGravity Sewer
UpsizeExistingGravity Sewer
Water Storage]̂UT Existing Tower]̂UT Future TowerUT Future GSR
Pressure Reducing Valve#I Existing#I FutureDistribution Facility3Q Future WTP[Ú Future Booster StationExisting Water Main
16" Water Main12" Water Main10" Water Main8" Water Main6" Water Main
Future Water Main24" Water Main16" Water Main12" Water MainExpansion AreaCity Limits
Test #22-12 psi
Test #23-24 psi
Average Pressures< 30 psi30 - 39 psi40 - 49 psi50 - 59 psi60 - 69 psi70 - 79 psi80 - 89 psi90 - 99 psi> 100 psi
Advanced Engineering and Environmental Services, Inc.
0 10,0005,000 Feet
[Ú
[Ú
#I#I
#I
#I#I
#I
#I
]̂UT
]̂UT
]̂UT
]̂UT
]̂UT
]̂UT
UT
MNTH 101
60th St NE
70th St NE
CSAH 37
River Rd
80th St NE
Odea
n Ave
NE
La B
eaux
Ave
CSAH 36
70th St
Page
Ave
Nash
ua Av
e NE
83rd St NE
Parri
sh Av
e NE
96th St NE
Mc A
llister
Ave N
E 6119
70th St NE
¯
Newtown TankOverflow = 4100 ft
City ofOtsegoWater
DistributionSystem
Dispersed WTPSystem AlternativeMax Day Demand
(22.3 MGD)
ProposedGravity Sewer
UpsizeExistingGravity Sewer
UpsizeExistingGravity Sewer
Water Storage]̂UT Existing Tower
]̂UT Future TowerUT Future GSR
Pressure Reducing Valve#I Existing#I FutureDistribution Facility
Existing Well HouseFuture Well House
[Ú Future Booster StationExisting Water Main
16" Water Main12" Water Main10" Water Main8" Water Main6" Water Main
Future Water Main24" Water Main16" Water Main12" Water MainExpansion AreaCity Limits
Test #22-12 psi
Test #23-24 psi
Average Pressures< 30 psi30 - 39 psi40 - 49 psi50 - 59 psi60 - 69 psi70 - 79 psi80 - 89 psi90 - 99 psi> 100 psi
Advanced Engineering and Environmental Services, Inc.
0 10,0005,000 Feet

3Q[Ú
[Ú
#I#I
#I
#I#I
#I
#I
]̂UT
]̂UT
]̂UT
]̂UT
]̂UT
]̂UT
UT
MNTH 101
60th St NE
70th St NE
CSAH 37
River Rd
80th St NE
Odea
n Ave
NE
La B
eaux
Ave
CSAH 36
70th St
Page
Ave
Nash
ua Av
e NE
83rd St NE
Parri
sh Av
e NE
96th St NE
Mc A
llister
Ave N
E 6119
90th St NE
70th St NE
¯
Newtown TankOverflow = 4100 ft
City ofOtsegoWater
DistributionSystem
Combination WTPSystem AlternativeMax Day Demand
(22.3 MGD)
ProposedGravity Sewer
UpsizeExistingGravity Sewer
UpsizeExistingGravity Sewer
Water Storage]̂UT Existing Tower
]̂UT Future TowerUT Future GSR
Pressure Reducing Valve#I Existing#I FutureDistribution Facility
Existing Well House3Q Future WTP[Ú Future Booster StationExisting Water Main
16" Water Main12" Water Main10" Water Main8" Water Main6" Water Main
Future Water Main36" Water Main24" Water Main16" Water Main12" Water MainExpansion AreaCity Limits
Test #22-12 psi
Test #23-24 psi
Average Pressures< 30 psi30 - 39 psi40 - 49 psi50 - 59 psi60 - 69 psi70 - 79 psi80 - 89 psi90 - 99 psi> 100 psi
Advanced Engineering and Environmental Services, Inc.
0 10,0005,000 Feet
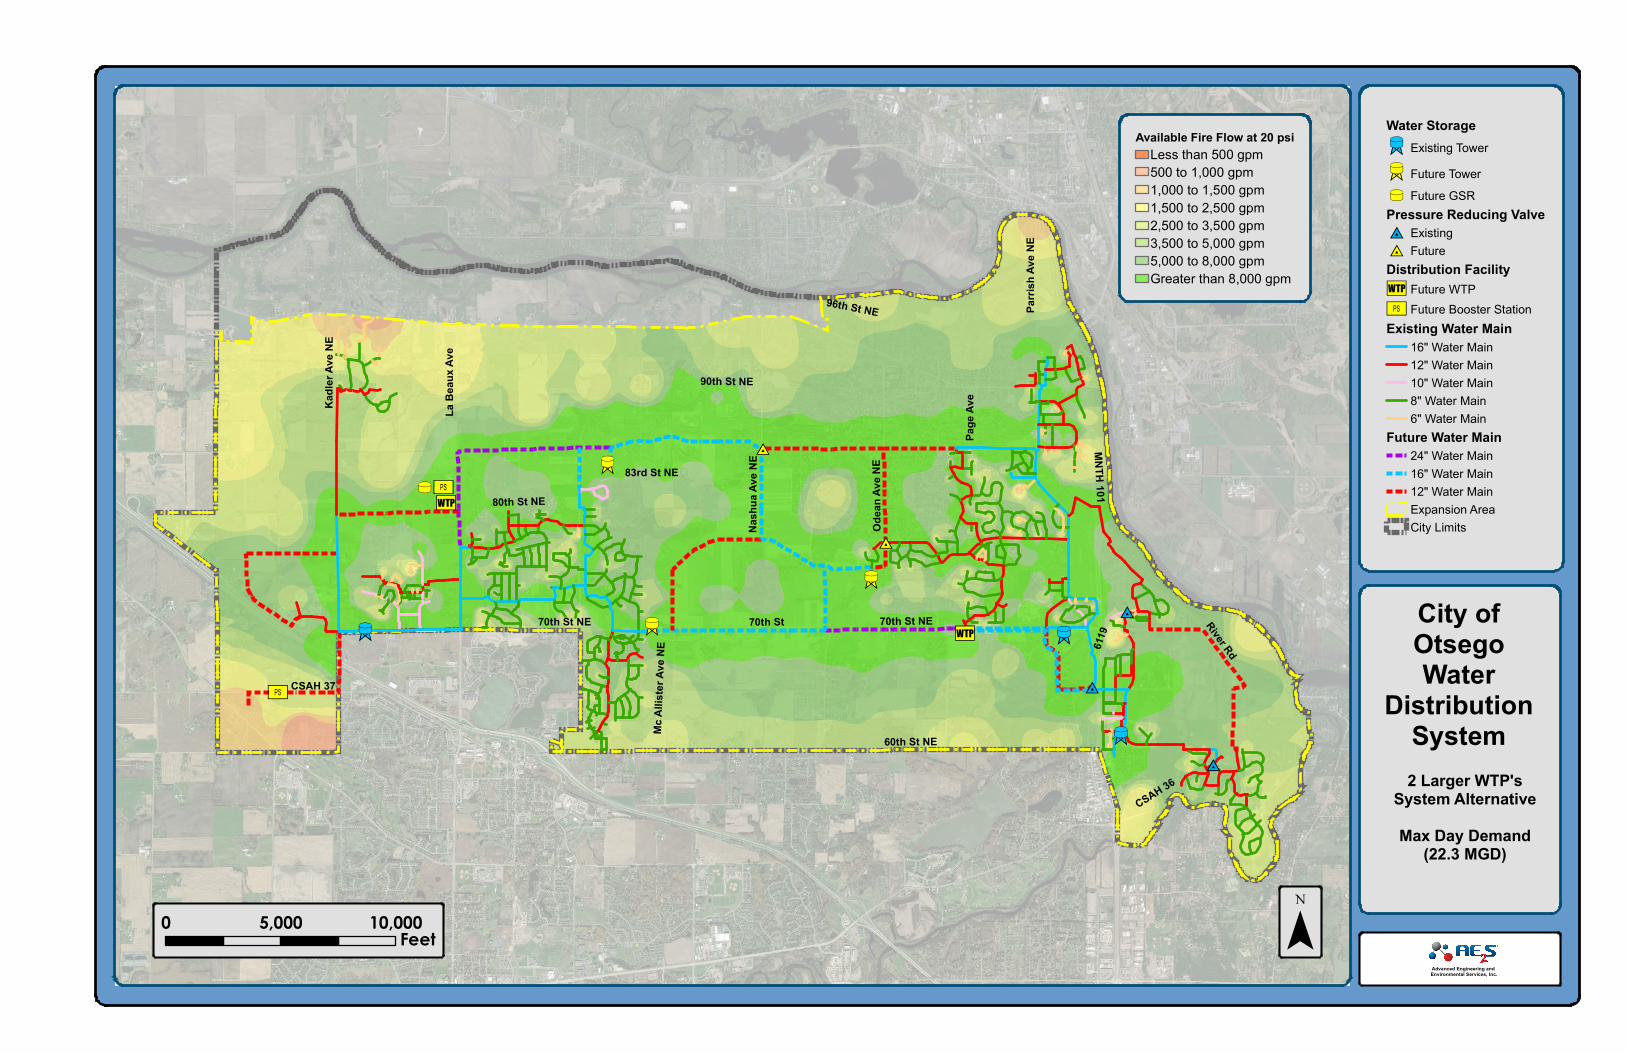
[Ú
3Q
3Q[Ú
#I#I
#I
#I
#I
#I
]̂UT
]̂UT
]̂UT
]̂UT
]̂UT
]̂UT
UT
MNTH 101
60th St NE
70th St NE
CSAH 37
Kadle
r Ave
NE
River Rd
80th St NE
Odea
n Ave
NE
La B
eaux
Ave
CSAH 36
70th St
Page
Ave
Nash
ua Av
e NE
83rd St NE
Parri
sh Av
e NE
96th St NE
Mc A
llister
Ave N
E 6119
90th St NE
70th St NE
¯
Newtown TankOverflow = 4100 ft
City ofOtsegoWater
DistributionSystem2 Larger WTP's
System AlternativeMax Day Demand
(22.3 MGD)
ProposedGravity Sewer
UpsizeExistingGravity Sewer
UpsizeExistingGravity Sewer
Water Storage]̂UT Existing Tower]̂UT Future TowerUT Future GSR
Pressure Reducing Valve#I Existing#I FutureDistribution Facility3Q Future WTP[Ú Future Booster StationExisting Water Main
16" Water Main12" Water Main10" Water Main8" Water Main6" Water Main
Future Water Main24" Water Main16" Water Main12" Water MainExpansion AreaCity Limits
Test #22-12 psi
Test #23-24 psi
Available Fire Flow at 20 psiLess than 500 gpm500 to 1,000 gpm1,000 to 1,500 gpm1,500 to 2,500 gpm2,500 to 3,500 gpm3,500 to 5,000 gpm5,000 to 8,000 gpmGreater than 8,000 gpm
Advanced Engineering and Environmental Services, Inc.
0 10,0005,000 Feet

[Ú
[Ú
#I#I
#I
#I#I
#I
#I
]̂UT
]̂UT
]̂UT
]̂UT
]̂UT
]̂UT
UT
¯
Newtown TankOverflow = 4100 ft
City ofOtsegoWater
DistributionSystem
Dispersed WTPSystem AlternativeMax Day Demand
(22.3 MGD)
ProposedGravity Sewer
UpsizeExistingGravity Sewer
UpsizeExistingGravity Sewer
Water Storage]̂UT Existing Tower]̂UT Future TowerUT Future GSR
Pressure Reducing Valve#I Existing#I FutureDistribution Facility
Existing Well HouseFuture Well House
[Ú Future Booster StationExisting Water Main
16" Water Main12" Water Main10" Water Main8" Water Main6" Water Main
Future Water Main24" Water Main16" Water Main12" Water MainExpansion AreaCity Limits
Test #22-12 psi
Test #23-24 psi
Available Fireflow at 20 psiLess than 500 gpm500 to 1,000 gpm1,000 to 1,500 gpm1,500 to 2,500 gpm2,500 to 3,500 gpm3,500 to 5,000 gpm5,000 to 8,000 gpmGreater than 8,000 gpm
Advanced Engineering and Environmental Services, Inc.
0 10,0005,000 Feet

3Q[Ú
[Ú
#I#I
#I
#I#I
#I
#I
]̂UT
]̂UT
]̂UT
]̂UT
]̂UT
]̂UT
UT
MNTH 101
60th St NE
70th St NE
CSAH 37
River Rd
80th St NE
Odea
n Ave
NE
La B
eaux
Ave
CSAH 36
70th St
Page
Ave
Nash
ua Av
e NE
83rd St NE
Parri
sh Av
e NE
96th St NE
Mc A
llister
Ave N
E 6119
90th St NE
70th St NE
¯
Newtown TankOverflow = 4100 ft
City ofOtsegoWater
DistributionSystem
Combination WTPSystem AlternativeMax Day Demand
(22.3 MGD)
ProposedGravity Sewer
UpsizeExistingGravity Sewer
UpsizeExistingGravity Sewer
Water Storage]̂UT Existing Tower]̂UT Future TowerUT Future GSR
Pressure Reducing Valve#I Existing#I FutureDistribution Facility
Existing Well House3Q Future WTP[Ú Future Booster StationExisting Water Main
16" Water Main12" Water Main10" Water Main8" Water Main6" Water Main
Future Water Main36" Water Main24" Water Main16" Water Main12" Water MainExpansion AreaCity Limits
Test #22-12 psi
Test #23-24 psi
Available Fire Flow at 20 psiLess than 500 gpm500 to 1,000 gpm1,000 to 1,500 gpm1,500 to 2,500 gpm2,500 to 3,500 gpm3,500 to 5,000 gpm5,000 to 8,000 gpmGreater than 8,000 gpm
Advanced Engineering and Environmental Services, Inc.
0 10,0005,000 Feet

APPENDIX B
Water Treatment Plant Figures

RAW
WAT
ER SU
PPLY
TREA
TMEN
TCL
EARW
ELL
PUM
PING
DIST
RIBU
TION
Distribution System
ChlorineFluoride
Orthophosphate/Polyphosphate
WELL WELL WELL WELLWELL WELLWELL WELL
GRAVITY FILTERS
CLEARWELL
BACKWASH BASINS (Two parallel settling basins)
Chlorine
HMO (if needed)
Permanganate(Optional)
Backwash Supply Water

File: \\ae2s.com
\P
rojectF
iles\O
\O
tsego\05409-2015-007\C
AD
D
wgs\04-P
rocess\A
utocad\P
lan S
heets\P
P - 12 M
GD
G
ravity F
ilter.dw
gLast S
aved: B
y: S
teve S
eibert D
ate: W
ednesday, A
ugust 14, 2019 9:39:34 A
M
Plotted: B
y: S
teve S
eibert D
ate: W
ednesday, A
ugust 14, 2019
Layout: P
LA
N
SHEET
PROJECT NUMBER
CHECKED / APPROVED
DATE
DRAWING TYPE
PREPARED BY
of
DRAWING
/
Advanced Engineering and Environmental Services, Inc. l Water Tower Pl Business Ctr 6901 E Fish Lake Rd Ste 184 Maple Grove, MN 55369 l (t) 763-463-5036 (f) 763-463-5037 l www.ae2s.com
PR
EL
IMIN
AR
Y N
OT
FO
R C
ON
STR
UCT
ION
PR
EL
IMIN
AR
Y N
OT
FO
R C
ON
STR
UCT
ION
OT
SE
GO
D
RIN
KIN
G W
AT
ER
M
AS
TE
R P
LA
N
CIT
Y O
F O
TS
EG
O
OT
SE
GO
, M
IN
NE
SO
TA
12
M
GD
G
RA
VIT
Y F
IL
TE
R - O
VE
RA
LL
P
LA
N - M
AIN
L
EV
EL
MIL
EST
ON
E - 3
0%
PRELIMINARY
SAS
NDZ NDZ
AUG 2019
05409-2015-007
2 2
P2
1
P2OVERALL PLAN - MAIN LEVEL
0 4' 8' 12' 20'16'
ELECTRICAL ROOM
CHLORINE ROOM
FILTER NO. 1 FILTER NO. 2 FILTER NO. 3 FILTER NO. 4 BLOWER ROOM
CHLORINE FEED
MECHANICAL
ROOM
OFFICE
LAB
FLUORIDE FEED
ROOM
TOILET
HIGH SERVICE PUMPS
CLEARWELL (BELOW)
CLEARWELL (FUTURE)
FILTER NO. 5
(FUTURE)
FILTER NO. 6
(FUTURE)
FILTER NO. 7
(FUTURE)
FILTER NO. 8
(FUTURE)
154'-4"
53
'-0
"
23
'-0
"
15'-0"
23
'-0
"
15'-0"
23
'-0
"
15'-0"
23
'-0
"
15'-0"
HALLWAY
49'-4"
19
'-0
"
105'-0"
STORAGE
PERMANGANATE
FEED ROOM
POLY & HMO FEED ROOM
BACKWASH RECLAIM TANKS
NO. 1 AND NO. 2 (BELOW)
79'-8"
40
'-0
"
BACKWASH RECLAIM TANKS NO. 3 AND NO. 4 (FUTURE - BELOW)

RAW
WAT
ER SU
PPLY
TREA
TMEN
TDI
STRI
BUTI
ON
Distribution System
ChlorineFluoride
Orthophosphate/Polyphosphate
WELL WELL
Back
was
h Su
pply
Wat
er
Chlorine
HMO (if needed)
Permanganate(Optional)
BACKWASH BASINS (Two parallel settling basins)

File: \\ae2s.com
\P
rojectF
iles\O
\O
tsego\05409-2015-007\C
AD
D
wgs\04-P
rocess\A
utocad\P
lan S
heets\P
P - 3 M
GD
P
ressure F
ilter N
o.1.dw
gLast S
aved: B
y: S
teve S
eibert D
ate: T
uesday, A
ugust 13, 2019 4:18:00 P
M
Plotted: B
y: S
teve S
eibert D
ate: W
ednesday, A
ugust 14, 2019
Layout: P
LA
N
SHEET
PROJECT NUMBER
CHECKED / APPROVED
DATE
DRAWING TYPE
PREPARED BY
of
DRAWING
/
Advanced Engineering and Environmental Services, Inc. l Water Tower Pl Business Ctr 6901 E Fish Lake Rd Ste 184 Maple Grove, MN 55369 l (t) 763-463-5036 (f) 763-463-5037 l www.ae2s.com
PR
EL
IMIN
AR
Y N
OT
FO
R C
ON
STR
UCT
ION
PR
EL
IMIN
AR
Y N
OT
FO
R C
ON
STR
UCT
ION
OT
SE
GO
D
RIN
KIN
G W
AT
ER
M
AS
TE
R P
LA
N
CIT
Y O
F O
TS
EG
O
OT
SE
GO
, M
IN
NE
SO
TA
3 M
GD
P
RE
SS
UR
E F
IL
TE
R - O
VE
RA
LL
P
LA
NM
ILES
TO
NE
- 30%
PRELIMINARY
SAS
NDZ NDZ
AUG 2019
05409-2015-007
1 2
P1
1
P1OVERALL PLAN
12"
0 2' 4' 6' 8' 10'
FILTER NO. 1
(36' x 10')
FILTER NO. 2
(36' x 10')
STORAGE
ELECTRICAL ROOM FLUORIDE ROOM CHLORINE ROOM
POLY & HMO
PERMANGANATE
BACKWASH RECLAIM (BELOW)
53'-4"
70
'-0
"
9'-4
"
9'-4"
14'-4"
10
'-0
"
14'-4"20'-0"
16
'-6
"1
0'-0
"9
'-6
"
MECHANICAL
ROOM