Embed Size (px)
Citation preview

OTT Local Sales OverviewBill Caudill
Vice President Digital Media Sales
Nexstar Media Group

2
197 Local and Network Affiliated TV Stations
115 U.S. Markets
458 Local Websites and Mobile Apps
43 U.S. States
1,800+ Sellers throughout US

OTT Agenda
• OTT Overview
• OTT Demand
• Forms of OTT
• Digital Video Ecosystem
• Target Cable Advertisers
• Comscore X Cross Platform Sales
• Sales Structure/Education/Training

OTT Overview
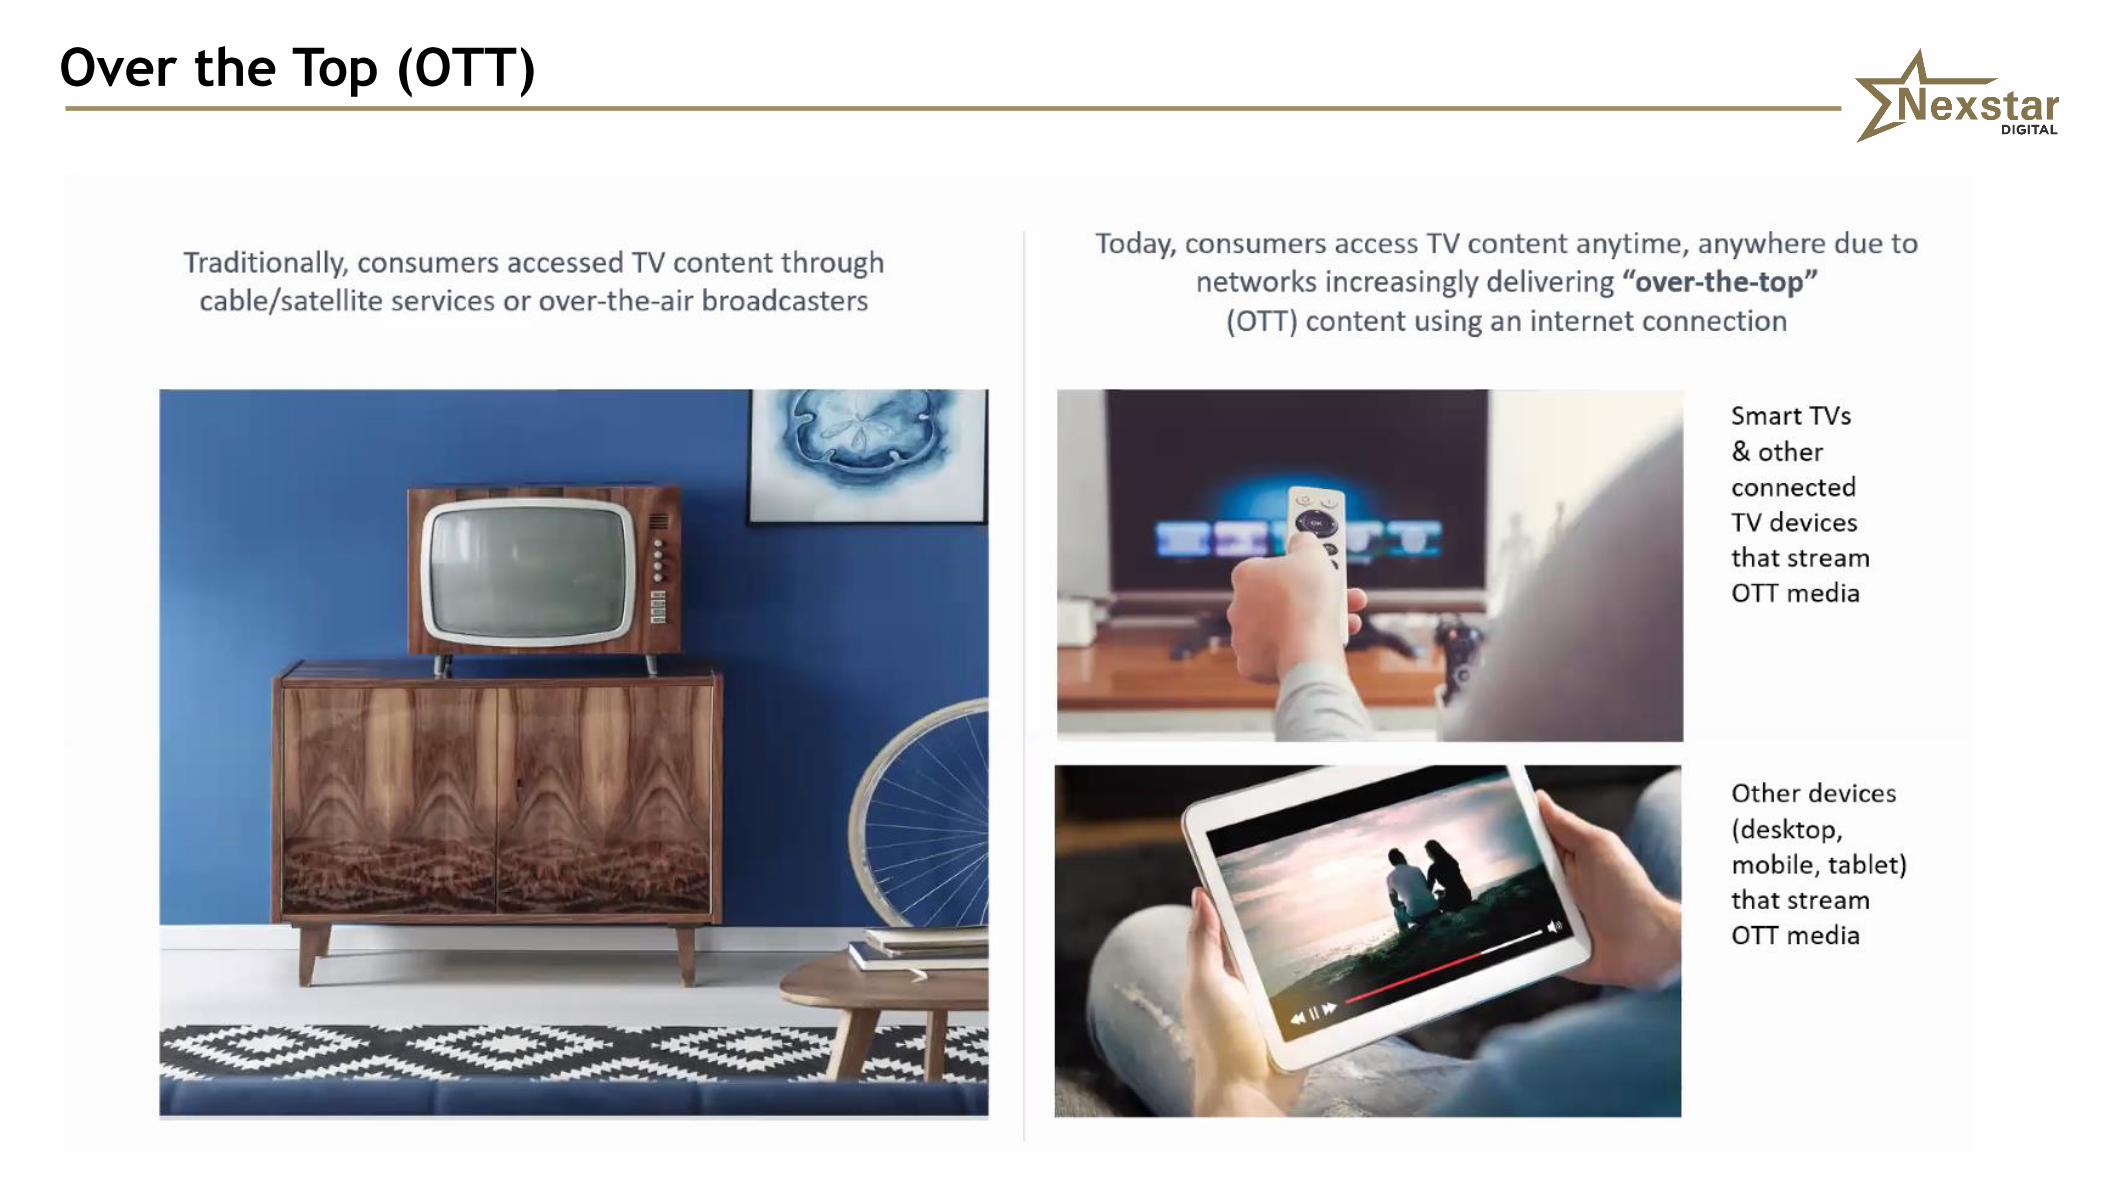
Over the Top (OTT)

Over the Top (OTT)
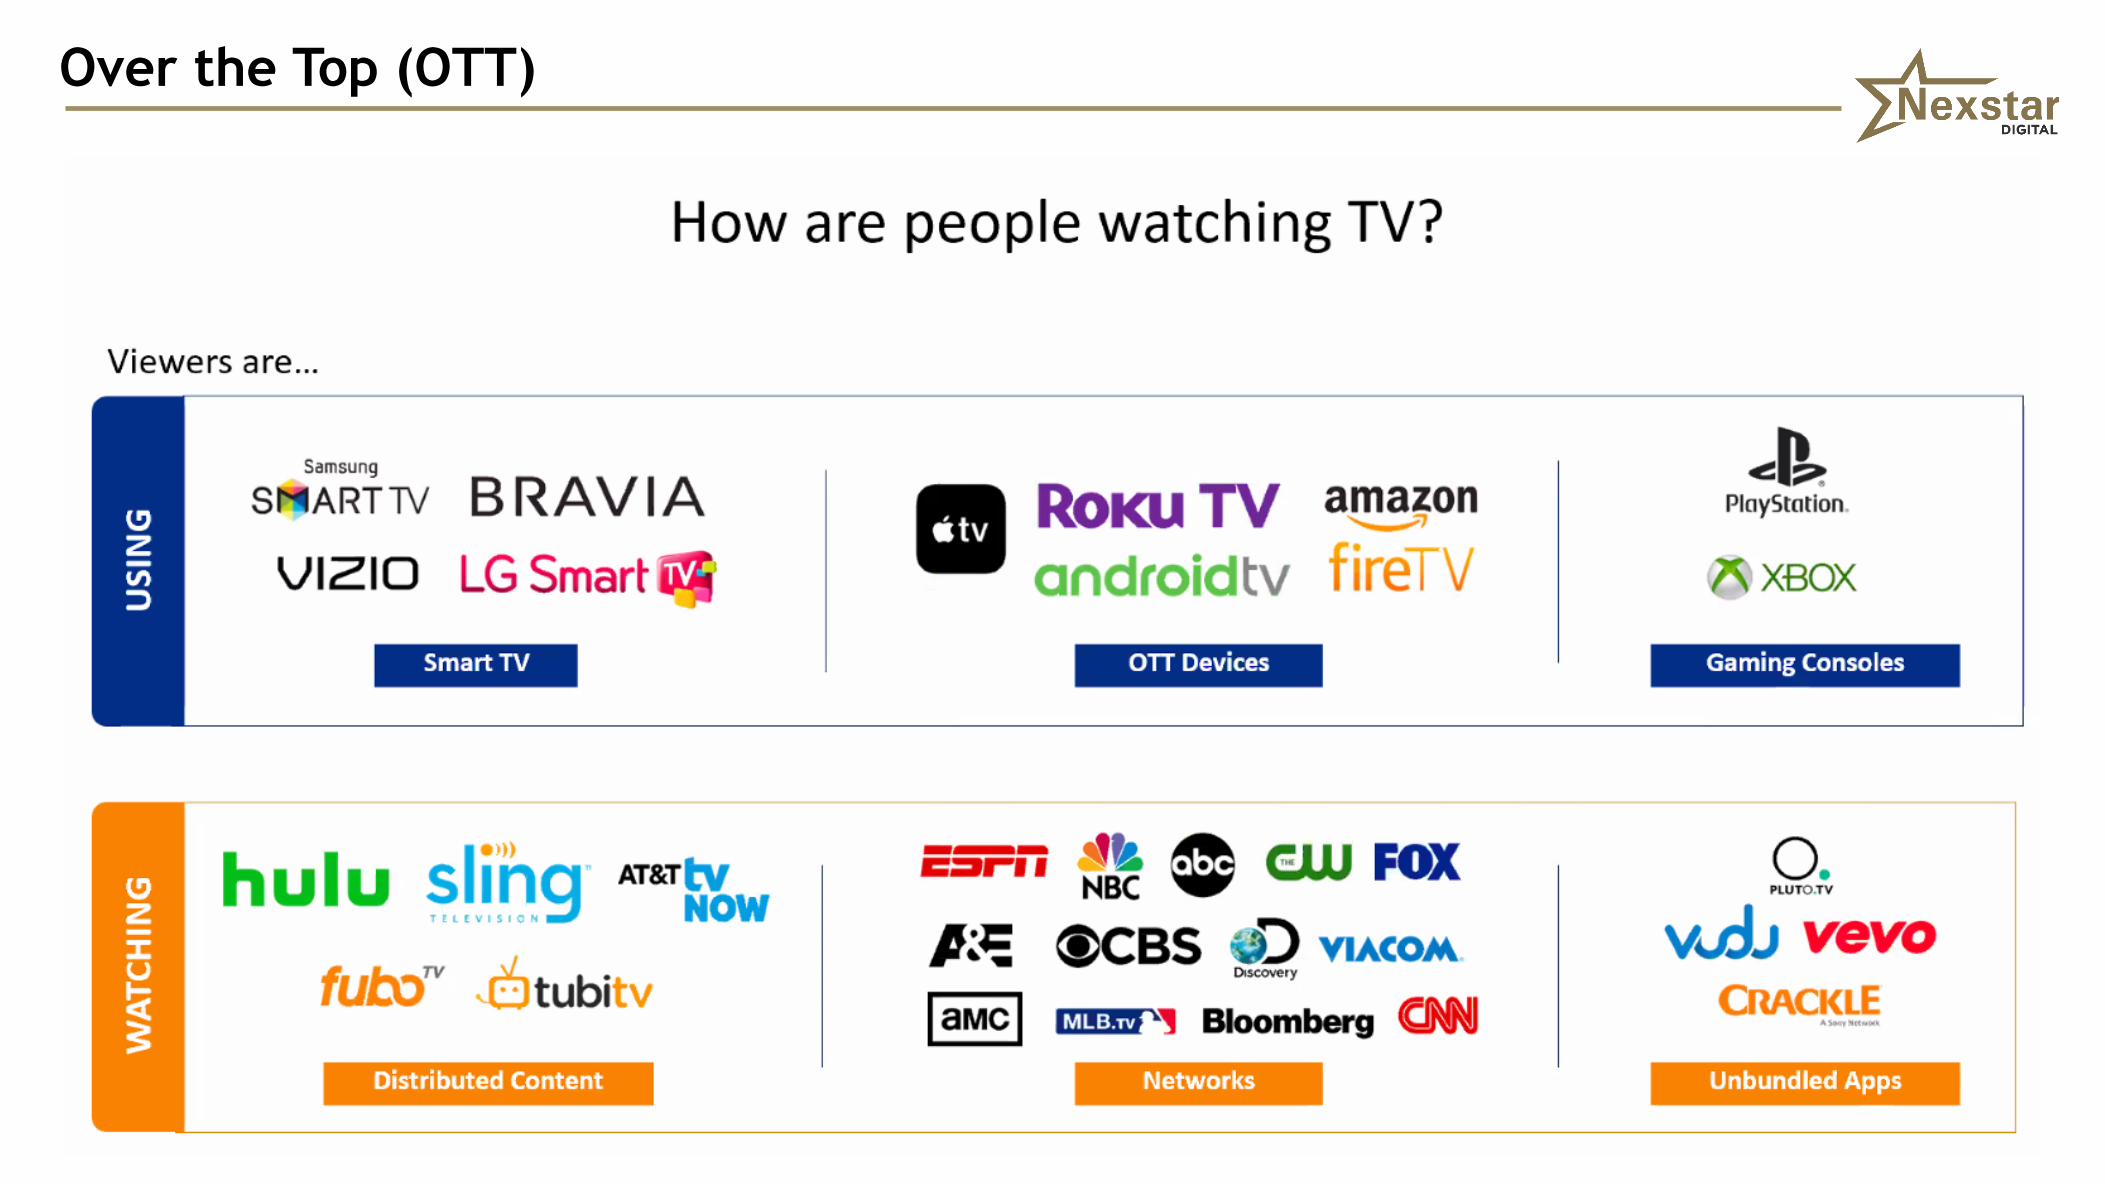
Over the Top (OTT)

OTT Demand

OTT Demand
Between 2019 and 2023, US
advertisers will increase
their spending on connected
TV from $6.94 billion to
$14.12 billion.

Forms of OTT
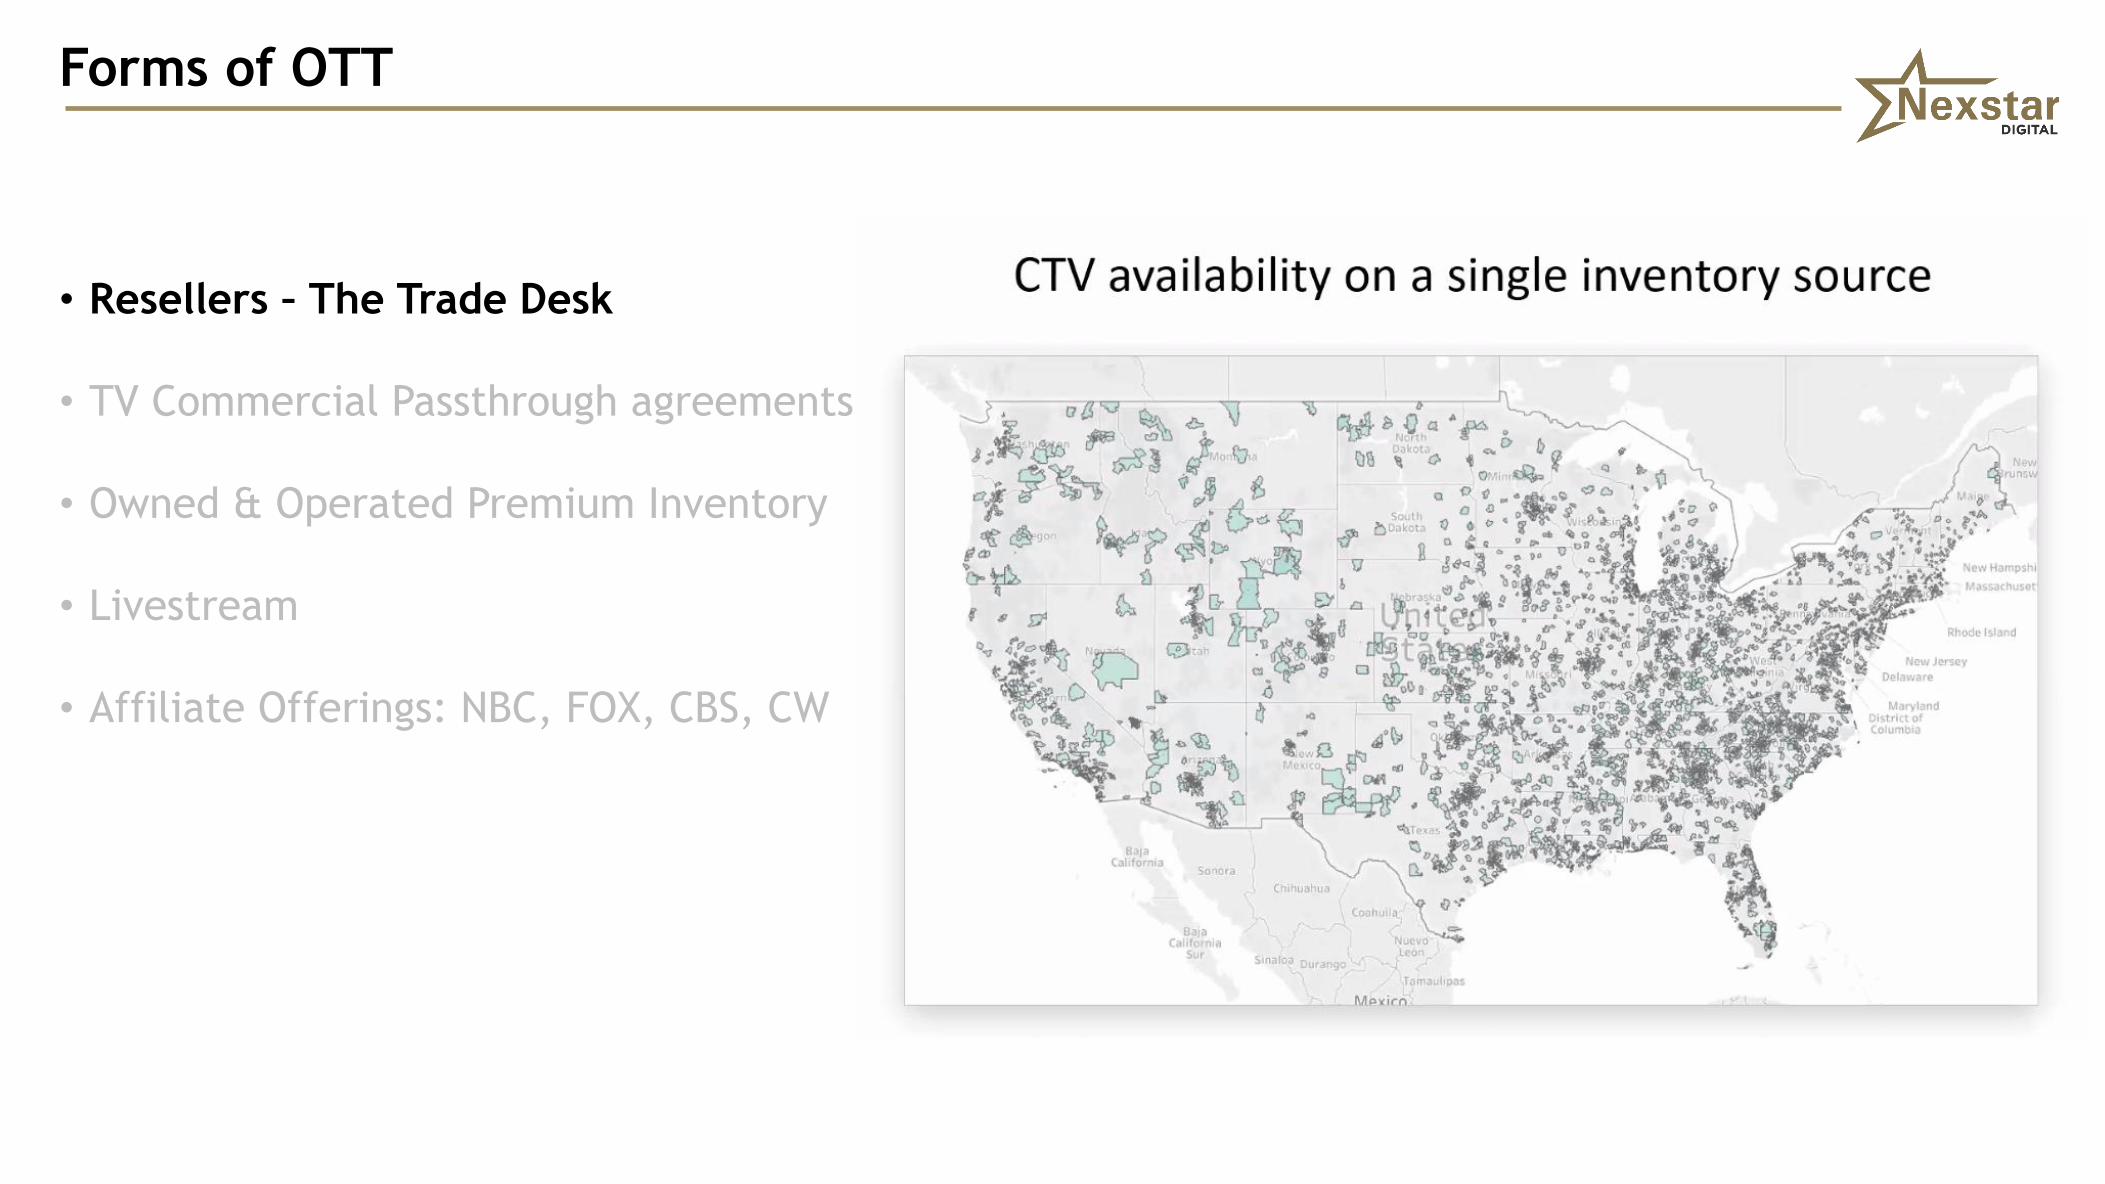
Forms of OTT
• Resellers – The Trade Desk
• TV Commercial Passthrough agreements
• Owned & Operated Premium Inventory
• Livestream
• Affiliate Offerings: NBC, FOX, CBS, CW

Forms of OTT
• Resellers – The Trade Desk
• TV Commercial Passthrough agreements
• Owned & Operated Premium Inventory
• Livestream
• Affiliate Offerings: NBC, FOX, CBS, CW

Forms of OTT

Partial List of OTT Content Provider
• ABC News
• ACORN.TV
• Amazon Video
• Apple TV iTunes
• CBS All Access
• CBS News
• CNN Go
• Crackle
• Crunchyroll
• CWTV
• Dailymotion
• DirecTV Now
• Disney Now
• Fox News / Fox
Nation
• Fubo.tv
• HBO Now
• Hulu
• iFood.tv
• iHeartRadio
• Mixer
• MLB.tv
• MLG.tv
• NBA App
• NBC News
• NBC Sports
• Netflix
• NFL Mobile
• NHL
• Pandora Radio
• PBS
• PBS Kids
• Philo
• PlayStation Vue
• Pluto.TV
• Showtime
• Sling TV
• Spotify
• Starz
• Syfy Now
• TBS
• The Roku Channel
• The Vidmark
Channel
• Travel Channel
• Tubi TV
• Twitch
• USA
• VEVO
• VRV
• VUDU
• Watch TNT
• Watch ESPN
• WWE
• Xbox Movies & TV
• Xumo
• YouTube
• YouTube TV
15
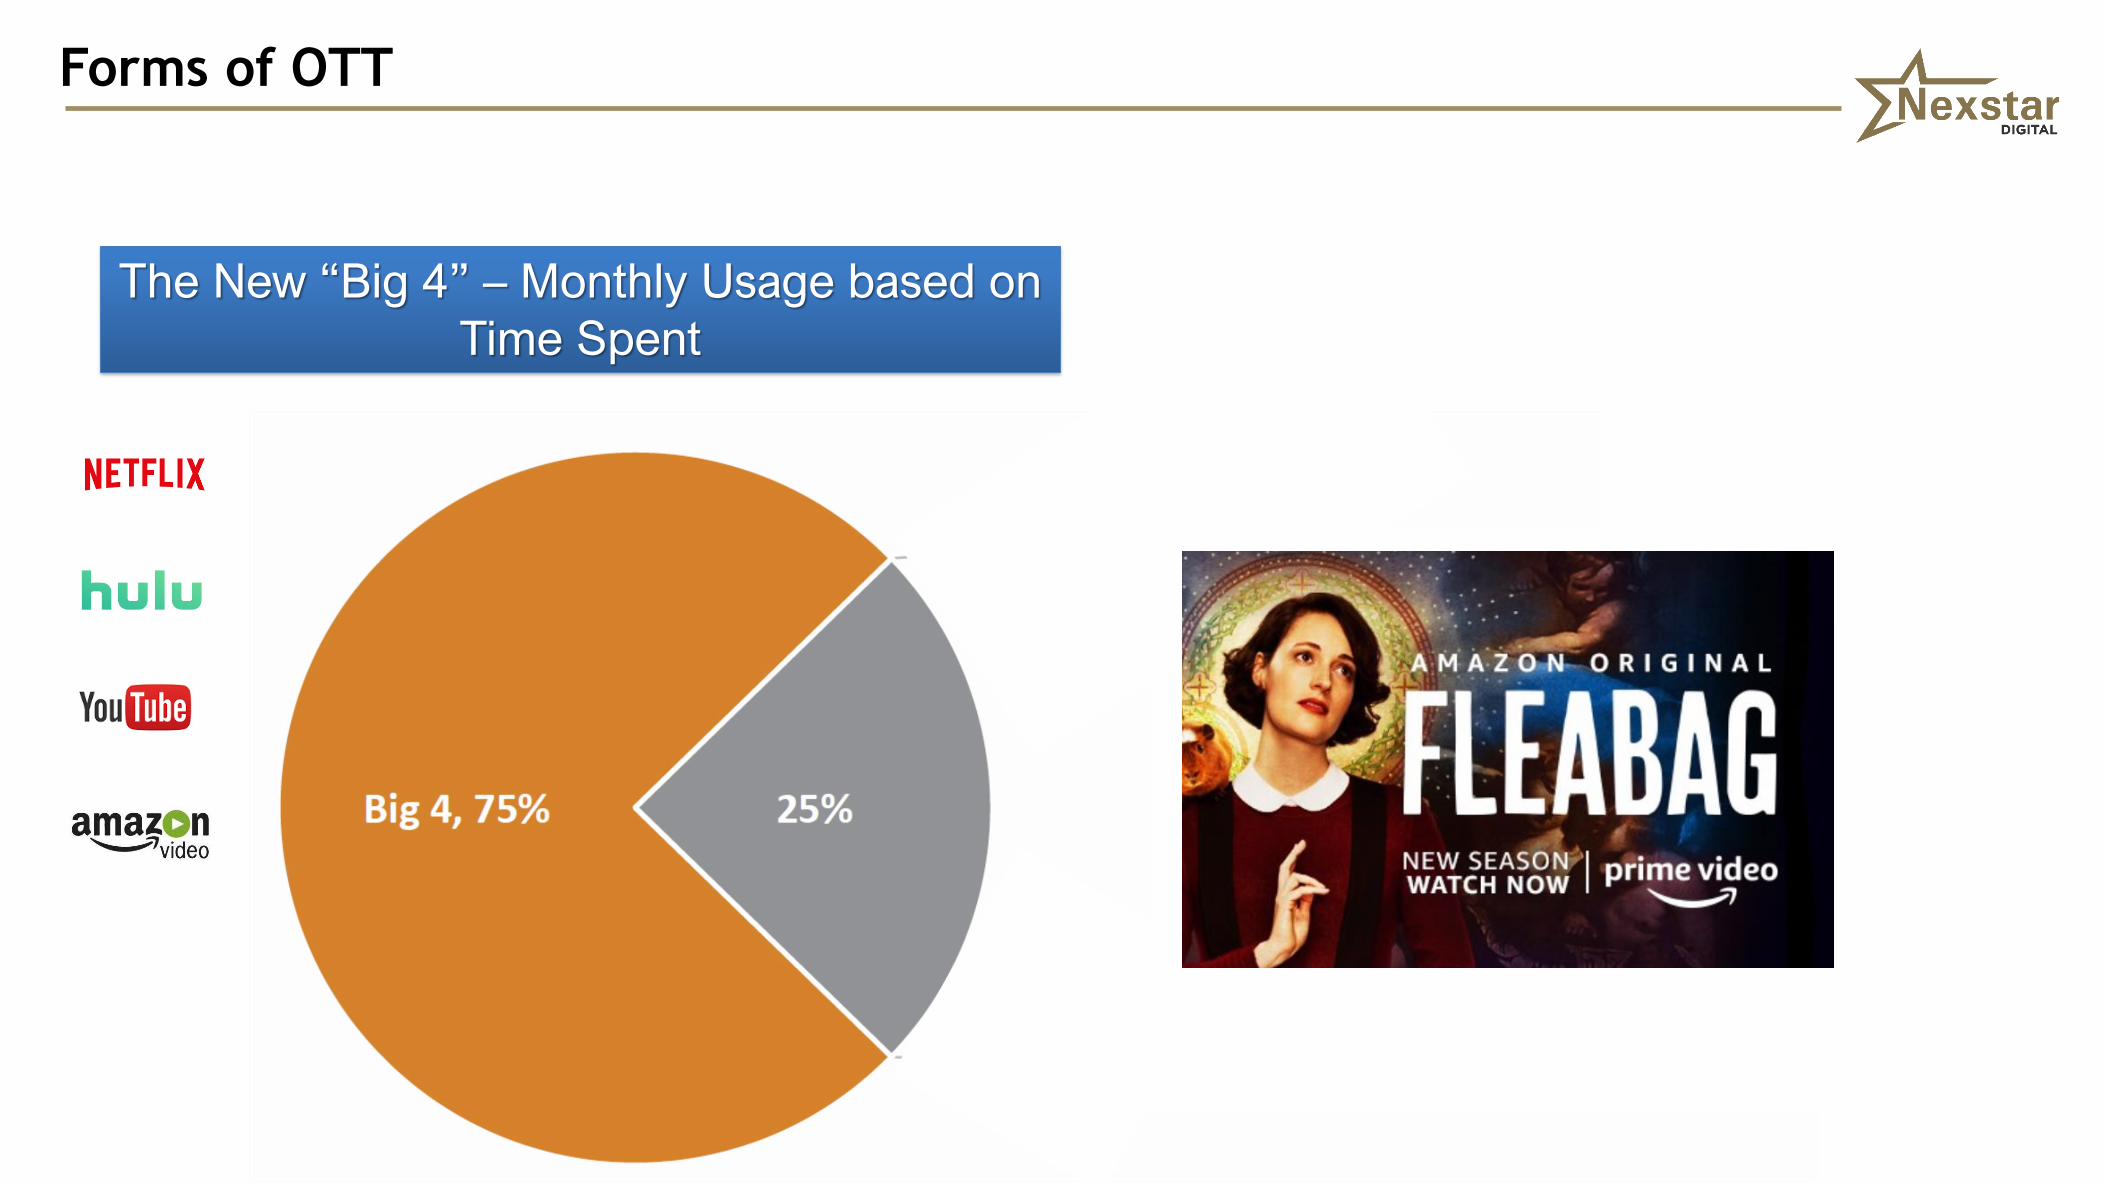
The New “Big 4” – Monthly Usage based on
Time Spent
Forms of OTT

EMMYS: Best Comedy “FLEABAG” Amazon Prime Video

17
The New “Big 4” – Monthly Usage based on
Time Spent
Forms of OTT

Forms of OTT
• Resellers – The Trade Desk
• TV Commercial Passthrough agreements
• Owned & Operated Premium Inventory
• Livestream
• Affiliate Offerings: NBC, FOX, CBS, CW

Forms of OTT
• Resellers – The Trade Desk
• TV Commercial Passthrough agreements
• Owned & Operated Premium Inventory
• Livestream
• Affiliate Offerings: NBC, FOX, CBS, CW

• Total Pageviews – Legacy Nexstar 2018 to 2019:
❑ 2018 – 5,001,412,768
❑ 2019 – 5,510,887,596
oGrowth of 509,474,828 year over year
o10% increase
• Total Video Views – Legacy Nexstar 2018 to 2019:
❑ 2018 – 227,781,581
❑ 2019 – 539,506,929
oGrowth of 311,725,348 year over year
o137% increase
Forms of OTT
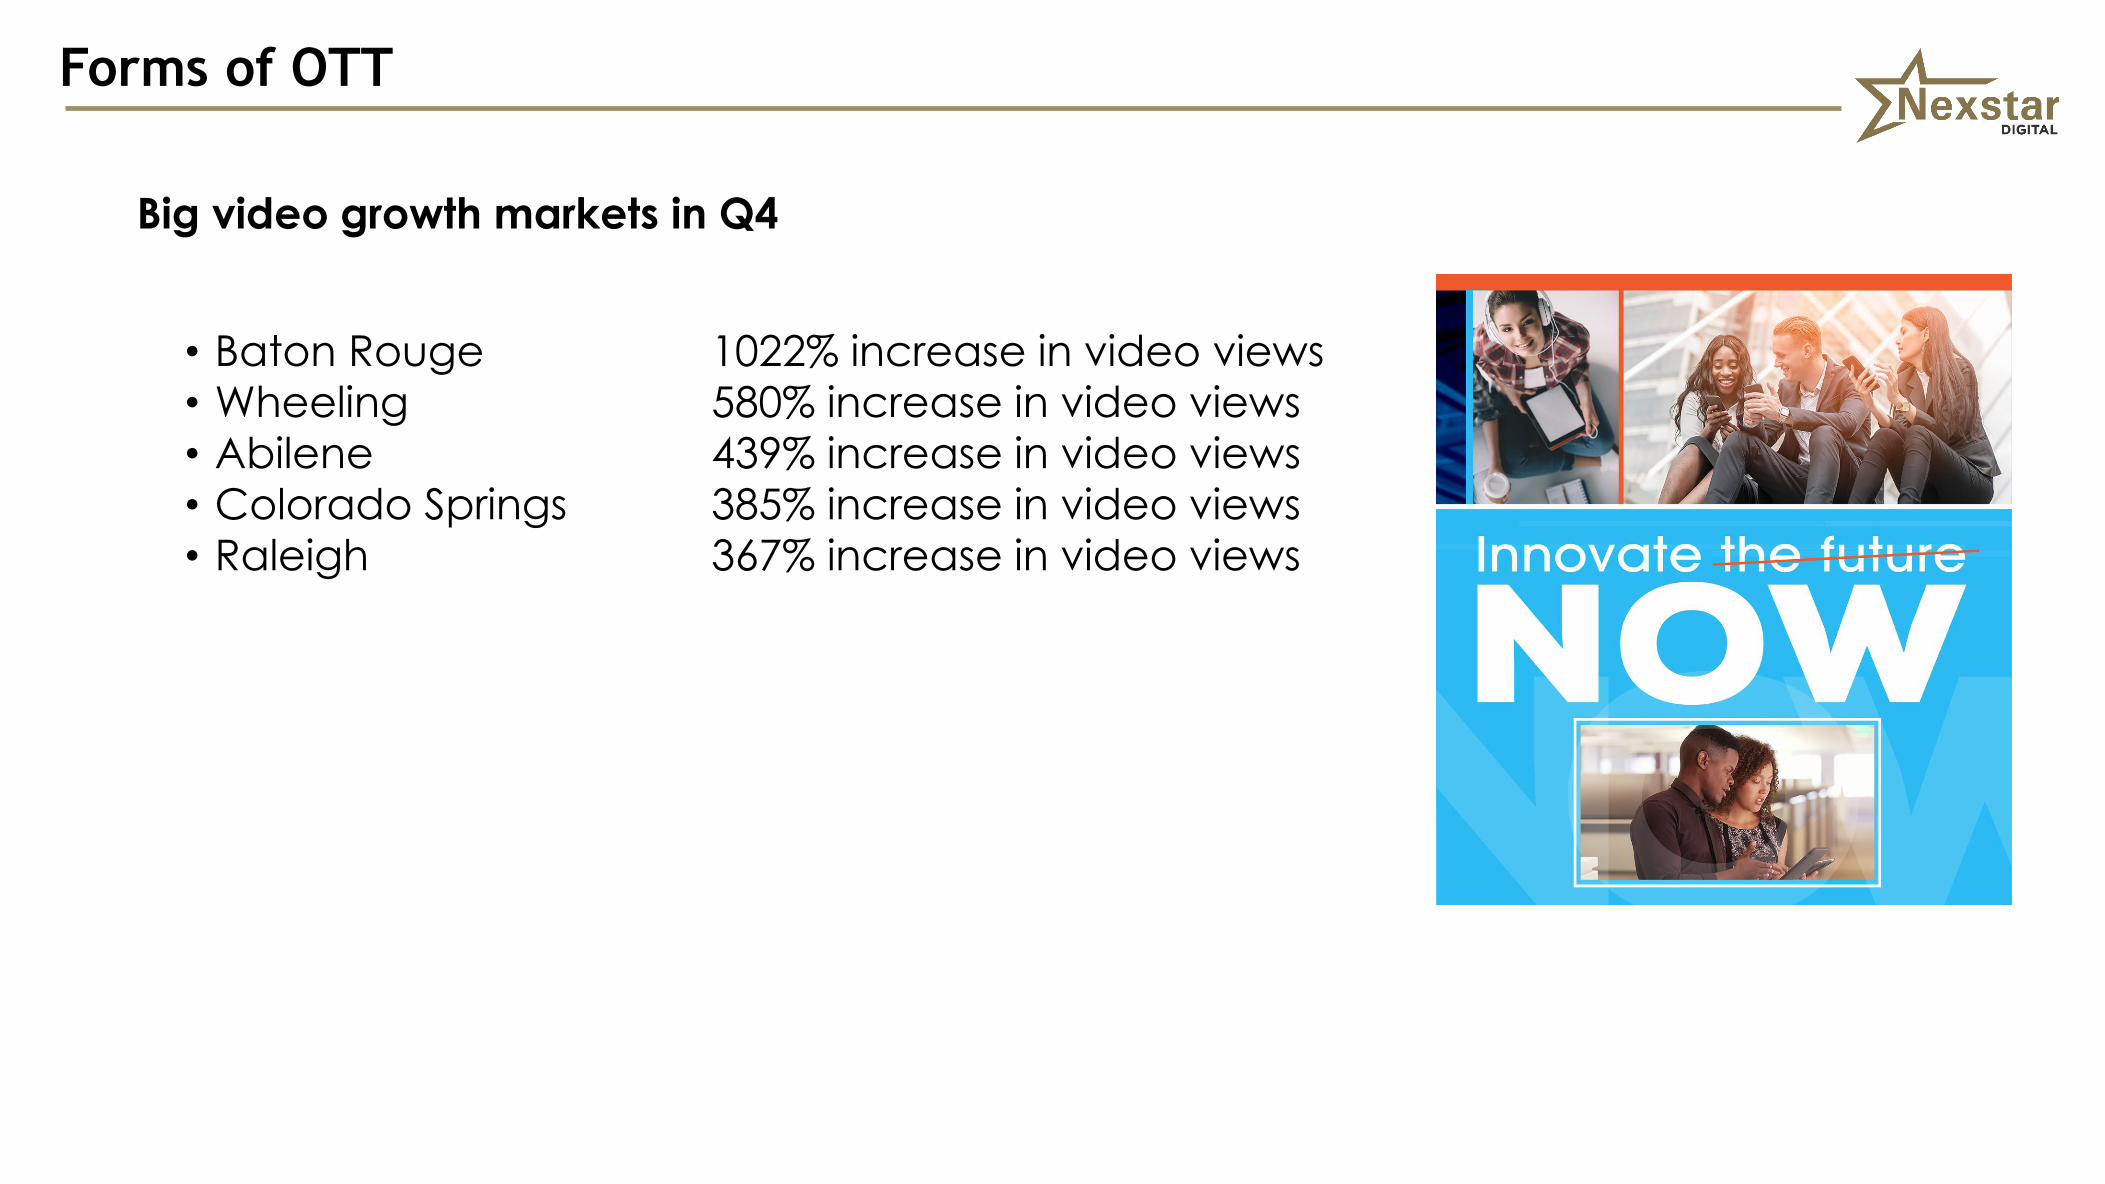
Big video growth markets in Q4
• Baton Rouge 1022% increase in video views
• Wheeling 580% increase in video views
• Abilene 439% increase in video views
• Colorado Springs 385% increase in video views
• Raleigh 367% increase in video views
Forms of OTT

Forms of OTT
• Resellers – The Trade Desk
• TV Commercial Passthrough agreements
• Owned & Operated Premium Inventory
• Livestream
• Affiliate Offerings: NBC, FOX, CBS, CW

User initiated audio
Mobile Web Video Overlay
Mobile App Pre Roll
Desktop Pre-roll Video
Desktop OutstreamVideo
❑Television Schedule
❑Core Digital Video❑Desktop/Mobile Web: Pre Roll Video/Instream
❑Desktop: Outstream
❑Desktop: In Banner Video Ads
❑Desktop: Native Video via Nativo
❑Mobile Web: Mobile Video Overlay
❑Mobile App: Pre Roll Video
❑Sales Shows/Segments Online
❑Live stream (parades)
❑Nexstar Digital❑OTT, CTV, Blend
❑Programmatic / Targeted Video
User initiated audio
Digital Video Ecosystem

Digital Video Ecosystem

Digital Video Ecosystem
• Reaching Audiences with Video
• Video Environments
• O&O Video Content

Digital Video Ecosystem
• Reaching Audiences with Video
• Video Environments
• O&O Video Content

Connect your brand with a highly engaged audience, wherever they are…
PREMIUM AUDIENCE
Local news consumers
Your demographic
Geographic, behavioral, custom targeting
EVERY ENVIRONMENT
Television
Desktop and Laptop computers
Tablets and Mobile devices
Pre-Roll
Audience “on the go” engaging
with non-skippable video.
Extend your reach into our
network!
In-Banner Video
Grab your audience while
scrolling through their favorite
websites
Outstream
Your video won’t be missed
in-line with premium news
content on desktop and
laptop computers
Overlay
Reach mobile users with this
highly viewable unit
QUALITY CONTENT
Livestream Events
Episodes and Videos
Digital News
VIDEOA N YW H E R E
Local, loyal news audience
in a trusted, credible space
On-Air
Digital Video Ecosystem
OTT
Local, premium audience
watching their favorite programs

Target Cable Advertisers
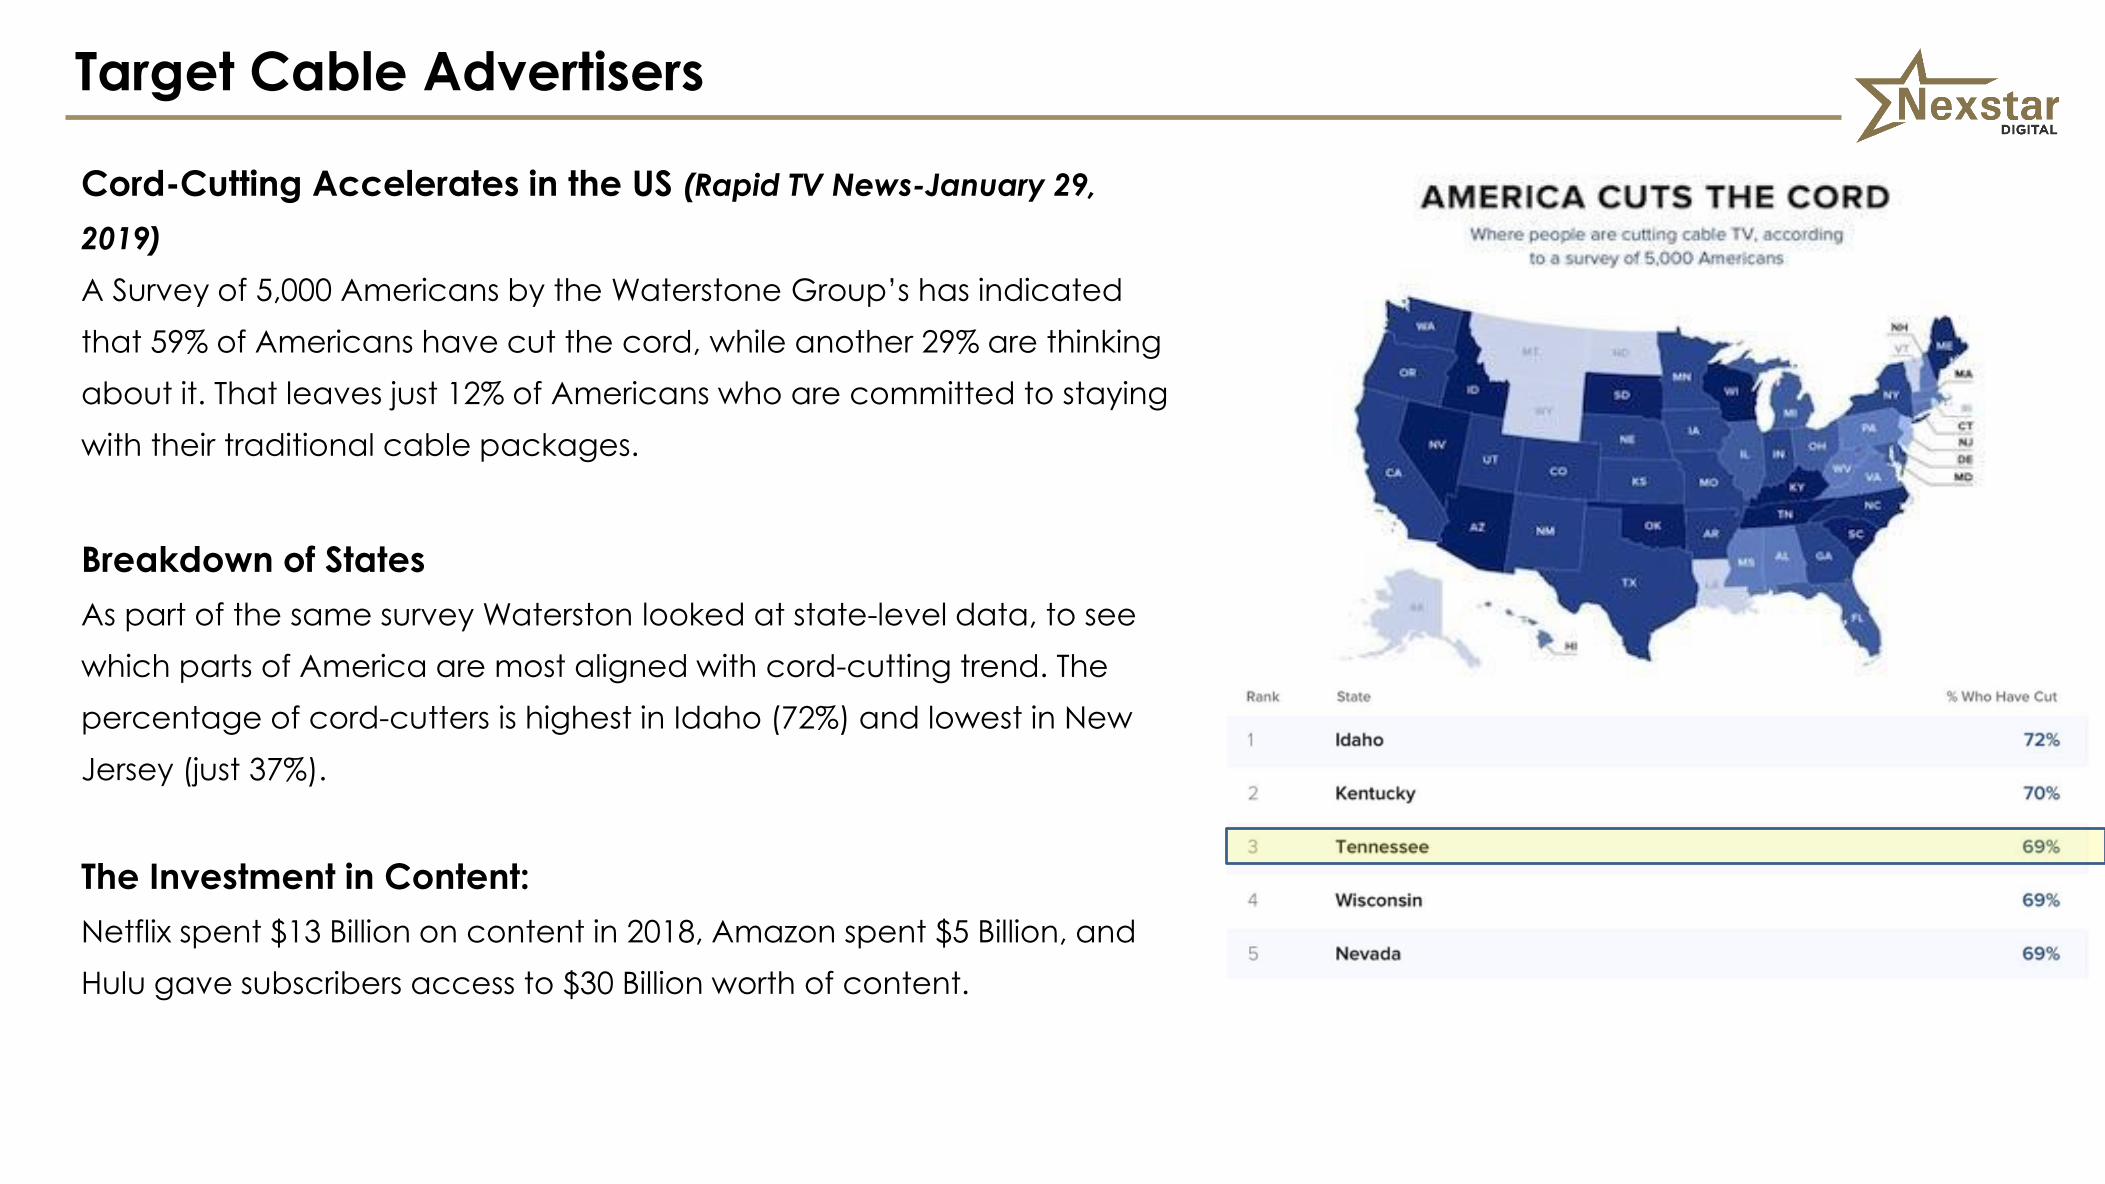
Cord-Cutting Accelerates in the US (Rapid TV News-January 29,
2019)
A Survey of 5,000 Americans by the Waterstone Group’s has indicated
that 59% of Americans have cut the cord, while another 29% are thinking
about it. That leaves just 12% of Americans who are committed to staying
with their traditional cable packages.
Breakdown of States
As part of the same survey Waterston looked at state-level data, to see
which parts of America are most aligned with cord-cutting trend. The
percentage of cord-cutters is highest in Idaho (72%) and lowest in New
Jersey (just 37%).
The Investment in Content:
Netflix spent $13 Billion on content in 2018, Amazon spent $5 Billion, and
Hulu gave subscribers access to $30 Billion worth of content.
Target Cable Advertisers

CABLE SPEND IN PORTLAND ‘18 v ‘19
Business Category
# of Businesses
2018
2018 Cable
Local
2019 Cable
Local Difference
FINANCE BANKING &
INSURANCE 6,122 3.07 2.574 -0.496
HEALTH CARE 15,830 2.74 2.305 -0.435
AUTO 1,512 2.705 2.002 -0.703
AUTO AFTERMARKET 5,868 2.188 1.831 -0.357
FURNITURE 1,931 2.176 1.759 -0.417
BROADCAST &
PUBLISHING 1,728 1.943 1.716 -0.227
Automotive Sales 1,187 2.184 1.54 -0.644
Eating and Drinking
Places 10,545 1.847 1.486 -0.361
MISC. RETAIL 8,149 1.706 1.445 -0.261
Furniture Sales 1,198 1.619 1.286 -0.333
Banks 1,216 1.502 1.267 -0.235
Food Stores-Retail 3,575 1.165 0.951 -0.214
ENTERTAINMENT &
AMUSEMENT 4,423 1.067 0.894 -0.173
TELECOMMUNICATIO
NS 1,863 1.038 0.863 -0.175
Television
Broadcasting Stations 34 0.872 0.829 -0.043
Medical Doctors 3,829 0.916 0.777 -0.139
Cable and Other Pay
Television Services TV
Services 106 0.875 0.722 -0.153
Credit and Mortgage
Services 782 0.861 0.721 -0.14
Business Category
# of Businesses
2018
2018 Cable
Local
2019 Cable
Local Difference
Other Medical
Professionals 6,458 0.857 0.713 -0.144
All Other Business
Locations 96,634 0.833 0.707 -0.126
AIRLINES & TRAVEL 6,794 0.745 0.663 -0.082
Retail Tires 303 0.753 0.648 -0.105
Legal Services 3,694 0.754 0.627 -0.127
Retail Jewelry 617 0.673 0.564 -0.109
Automotive Parts and
Supplies 735 0.673 0.547 -0.126
Gambling Casinos 36 0.601 0.547 -0.054
Government 3,758 0.623 0.528 -0.095
Automotive Repair
Services 3,857 0.633 0.527 -0.106
Pharmacies 366 0.611 0.512 -0.099
Telecommunications
Services 1,372 0.618 0.511 -0.107
Hospitals 259 0.596 0.495 -0.101
Retail Floor Coverings 734 0.557 0.473 -0.084
Electric Power Utilities 183 0.563 0.472 -0.091
PERSONAL SERVICES 4,693 0.533 0.457 -0.076
Recreational Vehicle
Dealers 180 0.516 0.457 -0.059
Physical Fitness
Facilities 1,054 0.498 0.419 -0.079
Other Schools 4,341 0.498 0.411 -0.087
Retail Sporting Goods 822 0.454 0.383 -0.071
WHOLESALE TRADE 258 0.476 0.38 -0.096
HVAC Installation
and Repair 172 0.475 0.379 -0.096
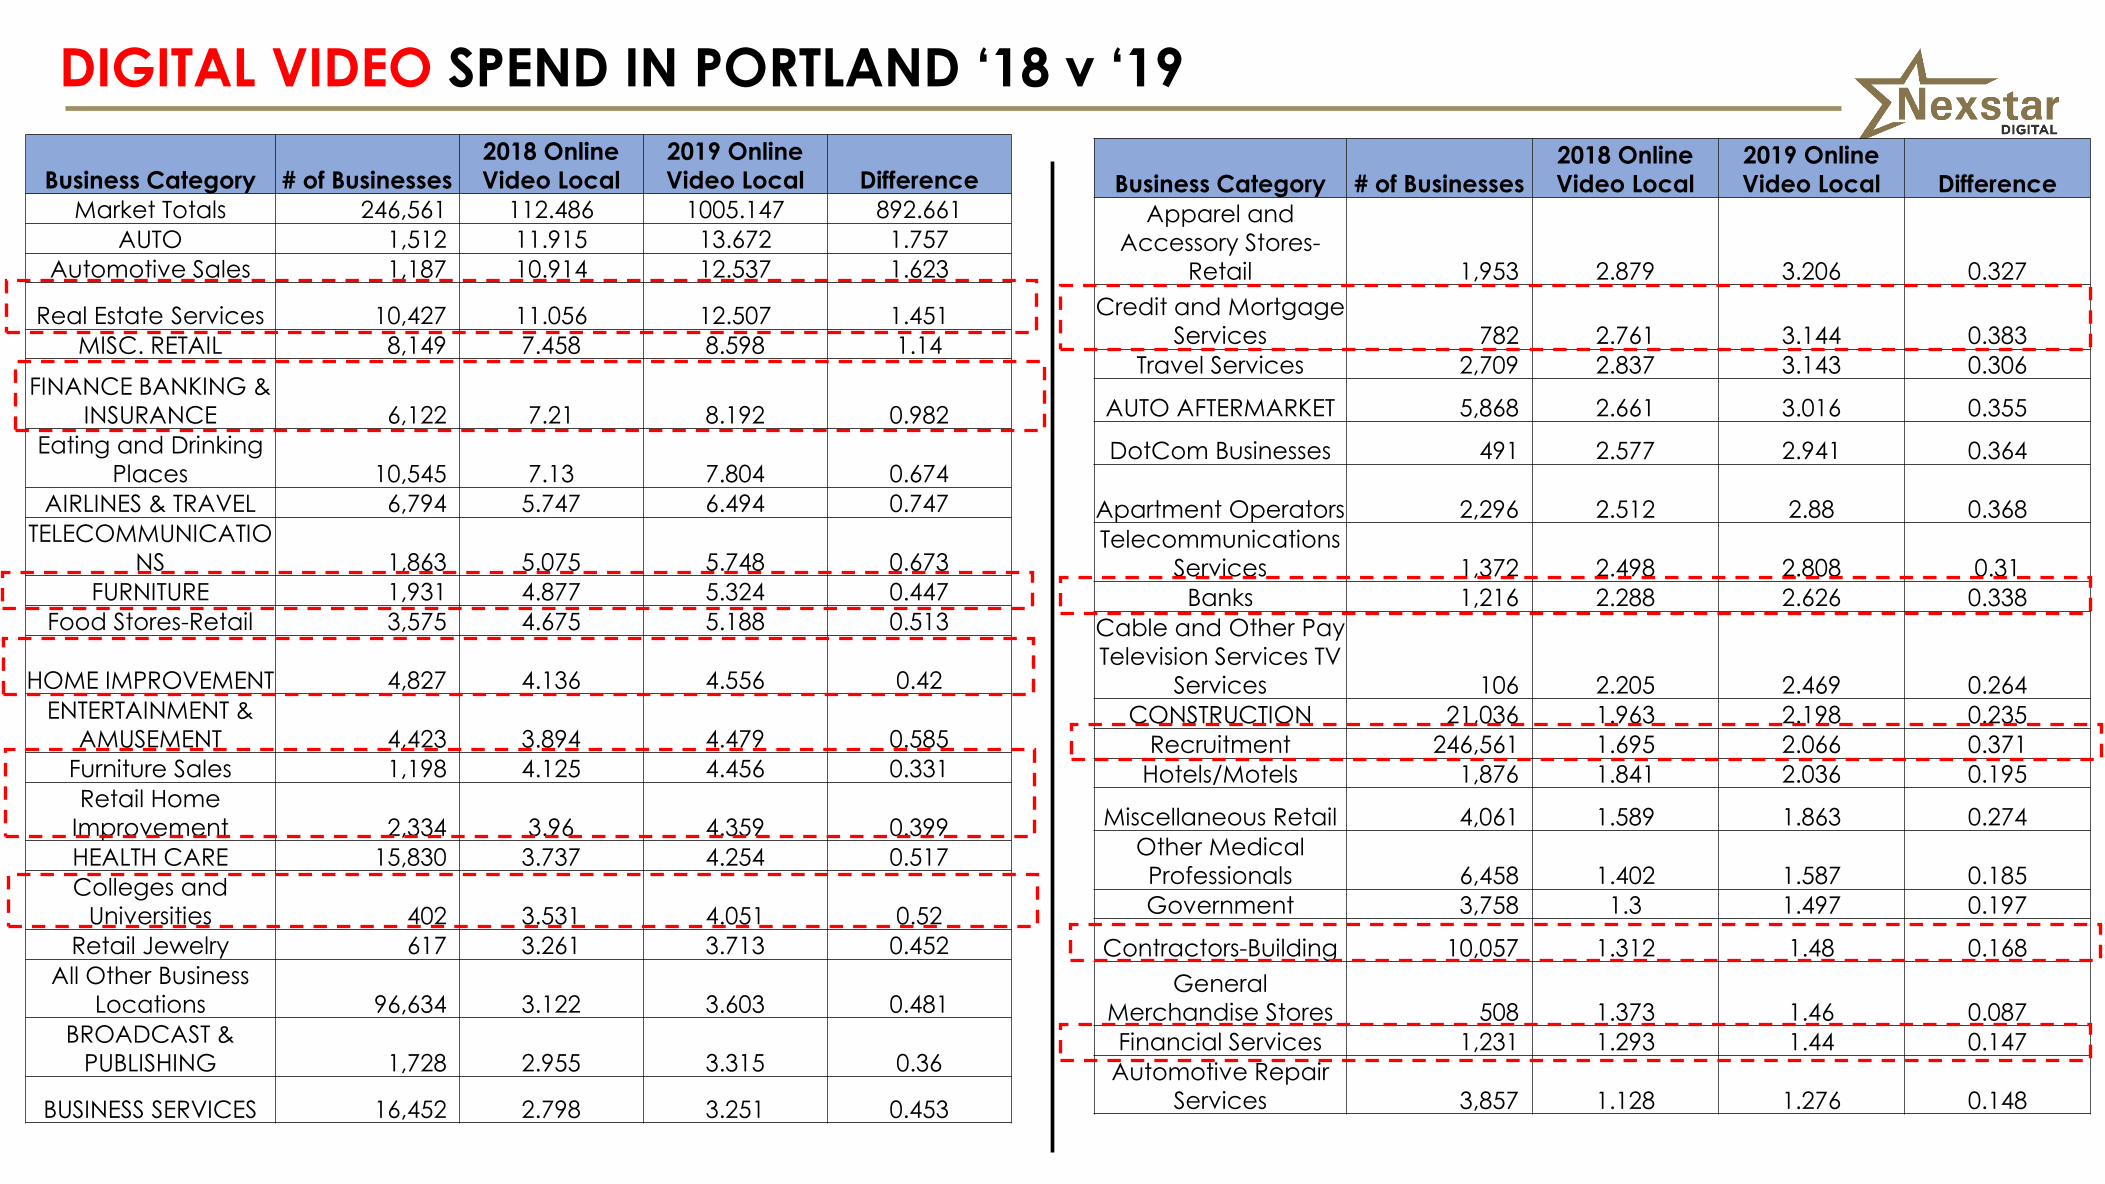
DIGITAL VIDEO SPEND IN PORTLAND ‘18 v ‘19
Business Category # of Businesses
2018 Online
Video Local
2019 Online
Video Local Difference
Market Totals 246,561 112.486 1005.147 892.661
AUTO 1,512 11.915 13.672 1.757
Automotive Sales 1,187 10.914 12.537 1.623
Real Estate Services 10,427 11.056 12.507 1.451
MISC. RETAIL 8,149 7.458 8.598 1.14
FINANCE BANKING &
INSURANCE 6,122 7.21 8.192 0.982
Eating and Drinking
Places 10,545 7.13 7.804 0.674
AIRLINES & TRAVEL 6,794 5.747 6.494 0.747
TELECOMMUNICATIO
NS 1,863 5.075 5.748 0.673
FURNITURE 1,931 4.877 5.324 0.447
Food Stores-Retail 3,575 4.675 5.188 0.513
HOME IMPROVEMENT 4,827 4.136 4.556 0.42
ENTERTAINMENT &
AMUSEMENT 4,423 3.894 4.479 0.585
Furniture Sales 1,198 4.125 4.456 0.331
Retail Home
Improvement 2,334 3.96 4.359 0.399
HEALTH CARE 15,830 3.737 4.254 0.517
Colleges and
Universities 402 3.531 4.051 0.52
Retail Jewelry 617 3.261 3.713 0.452
All Other Business
Locations 96,634 3.122 3.603 0.481
BROADCAST &
PUBLISHING 1,728 2.955 3.315 0.36
BUSINESS SERVICES 16,452 2.798 3.251 0.453
Business Category # of Businesses
2018 Online
Video Local
2019 Online
Video Local Difference
Apparel and
Accessory Stores-
Retail 1,953 2.879 3.206 0.327
Credit and Mortgage
Services 782 2.761 3.144 0.383
Travel Services 2,709 2.837 3.143 0.306
AUTO AFTERMARKET 5,868 2.661 3.016 0.355
DotCom Businesses 491 2.577 2.941 0.364
Apartment Operators 2,296 2.512 2.88 0.368
Telecommunications
Services 1,372 2.498 2.808 0.31
Banks 1,216 2.288 2.626 0.338
Cable and Other Pay
Television Services TV
Services 106 2.205 2.469 0.264
CONSTRUCTION 21,036 1.963 2.198 0.235
Recruitment 246,561 1.695 2.066 0.371
Hotels/Motels 1,876 1.841 2.036 0.195
Miscellaneous Retail 4,061 1.589 1.863 0.274
Other Medical
Professionals 6,458 1.402 1.587 0.185
Government 3,758 1.3 1.497 0.197
Contractors-Building 10,057 1.312 1.48 0.168
General
Merchandise Stores 508 1.373 1.46 0.087
Financial Services 1,231 1.293 1.44 0.147
Automotive Repair
Services 3,857 1.128 1.276 0.148

Comscore LXPlatform Report

ComScore XPlatform Report
This chart shows the incremental audience provided by digital platforms
0.0%
10.0%
20.0%
30.0%
40.0%
50.0%
60.0%
70.0%
80.0%
WBRE Wilkes-Barre, Pa. (NBC) WEHT Evansville, Ind. (ABC) WHTM Harrisburg, Pa. (ABC) WTAJ Altoona, Pa. (CBS)
News
Primetime

Sales Structure, Education, Training
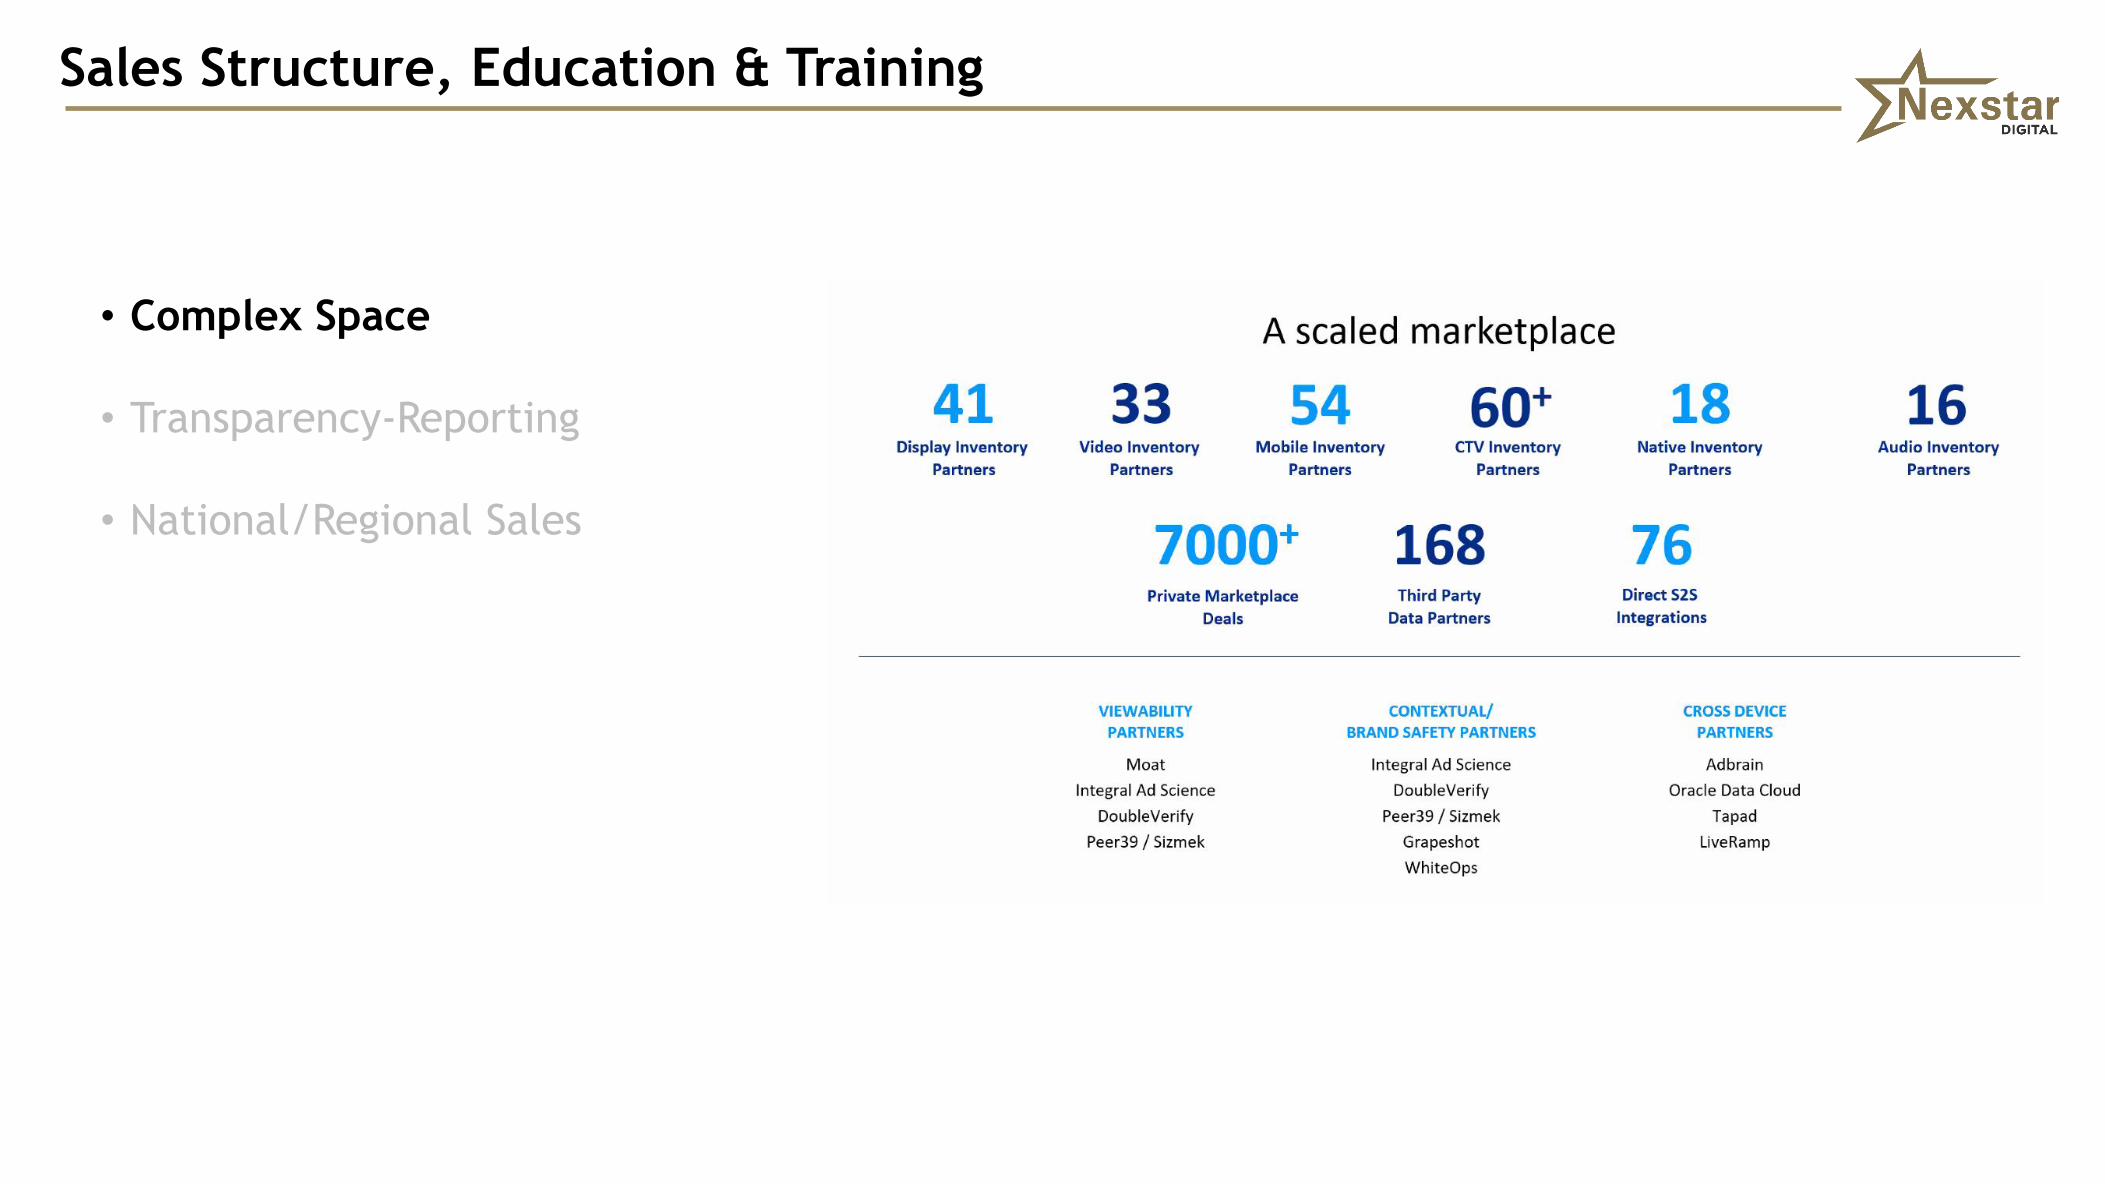
Sales Structure, Education & Training
• Complex Space
• Transparency-Reporting
• National/Regional Sales
Sales Structure, Education & Training
• Complex Space
• Transparency-Reporting
• Local Direct National Sales

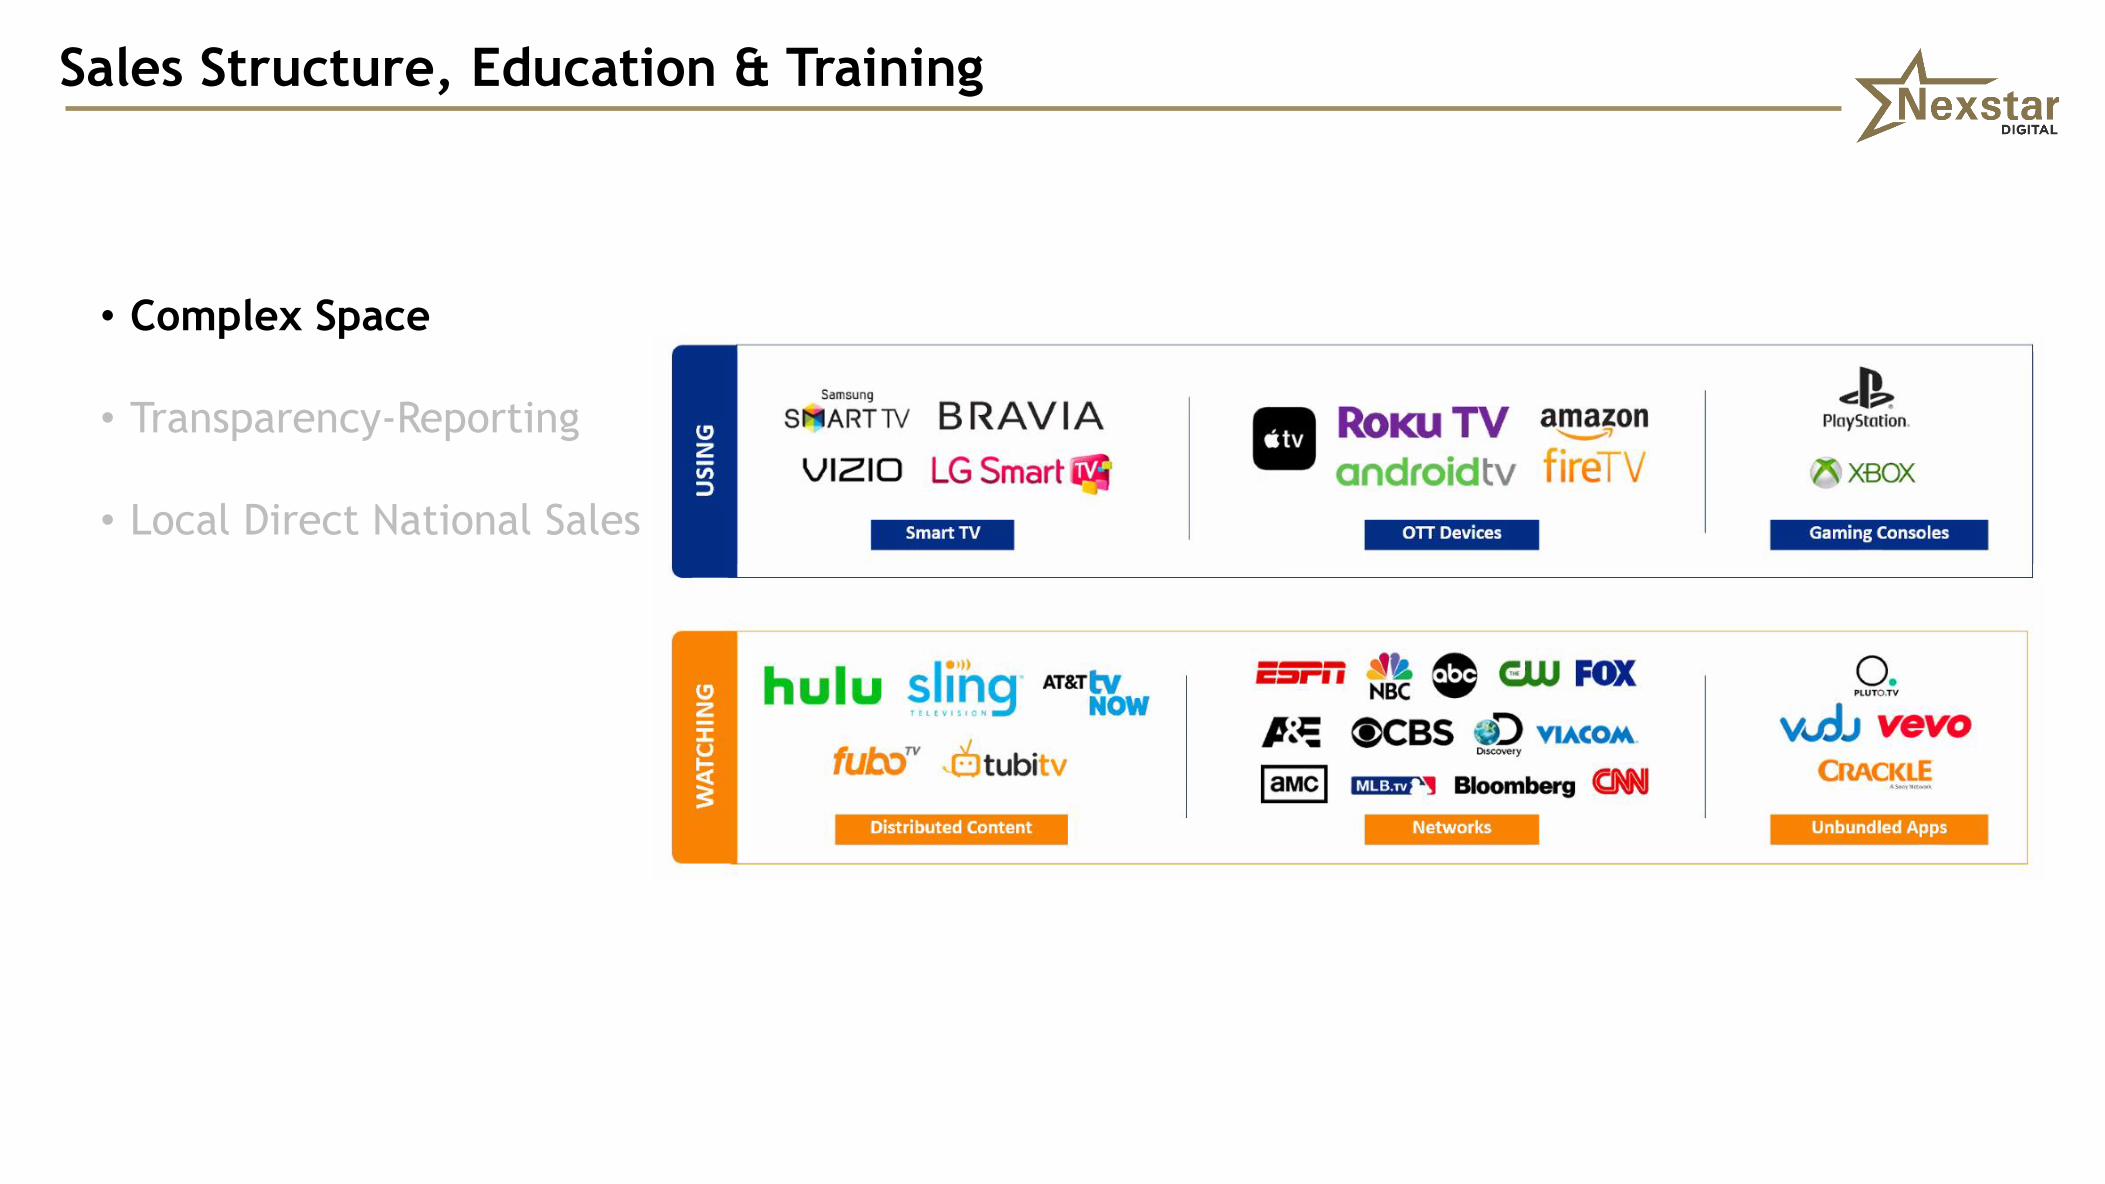
Sales Structure, Education & Training
• Complex Space
• Transparency-Reporting
• Local Direct National Sales

Sales Structure, Education & Training
• Complex Space
• Transparency-Reporting
• Local Direct/National Sales

Thank You!