Embed Size (px)
Citation preview
Our Financials
64
#Council’sstrong financial position has a net positive cash flow
65> BACK TO CONTENTS | > BACK TO INDEX
What is this report all about?This report is designed to give community members with limited experience in reading financial statements, a better understanding of the financial performance (what we earned and what we spent) and position (the financial health) of Moreton Bay Regional Council.
This report describes the financial statements on a step-by-step basis, to help explain what each statement means.
This report focuses on: The Income Statement The Balance Sheet The Cash Flow Statement The Statement of Changes in Equity
Each statement tells a story about council’s finances. It’s a bit like watching television. You need a number of key elements working together to create a clear picture. Imagine a television without power or an aerial – you would not get the picture. To get a clear picture of council’s financial health, it is important to examine each of the financial statements. In addition to the financial statements, the accompanying notes help to explain what has occurred during the reporting period and disclose other important information. What is the reporting period?You might notice that the financial statements cover the period from 15 March 2008 to 30 June 2009. This reporting period is unique to these financial statements as it covers the period from the amalgamation of the three former councils, to the typical reporting end date of 30 June. Next year, the financial statements will cover the standard reporting period, from 1 July 2009 to 30 June 2010.
So what does it all mean?This next section will attempt to break down each financial statement in more detail to help explain what it means and how it fits into the overall analysis of council’s financial health (performance and position).
Our Financials

66
The Income StatementThe Income Statement illustrates how council has performed for the period. It was previously known as the Profit and Loss Statement. The Income Statement illustrates what we have earned (revenue) and what we have spent (expenses) on maintaining and operating the community services and assets council provides.
There are three main categories of revenue for this financial year; Gain on Restructure of Local Government, Operating Revenue and Capital Revenue.
For the reporting period, the majority of revenue comes from the ‘Gain on Restructure of Local Government’. This represents the value (the assets and liabilities) of the former councils that now form Moreton Bay Regional Council. This figure is unique to this reporting period, because it relates directly to the amalgamation and won’t appear next financial year.
REVENUE $‘000
Operating Revenue
Rates and utility charges 327,058
Fees and charges 55,321
Grants, subsidies and contributions 31,990
Interest revenue 25,154
Other 18,914
Total Operating Revenue 458,437
Capital Revenue
Grants, subsidies and contributions 208,213
Net (loss) on disposal of fixed assets (1,189)
Total Capital Revenue 207,024
Capital Income
Net gain due to water reform 42,486
Gain on restructure of local government 3,486,987
Total Capital Income 3,529,473
TOTAL REVENUE 4,194,934
The operating revenue of council is the money raised that is used to fund operating expenses. The majority of operating revenue is derived from rates and utility charges. These funds come directly from the council’s major stakeholder – the community.
Rates are very important as the money ensures council can provide many essential services to the community such as clean water, sewerage, waste facilities, roads and stormwater drainage. The rates are also used to fund operations such as libraries, swimming pools, cultural facilities, parks, and sport and recreation areas.
Other operating revenue includes fees and charges (such as dog licences, health licences, building and development applications), grants and subsidies (provided by the State and Federal Government and in some cases the private sector), interest revenue (which is earned by investing surplus cash) and other income (sale of goods and services, private works and other revenue sources).
What have we earned?
Gain on restructure of local government 83%Operating revenue 11%Capital revenue 6%
Operating Revenue
Rates and utility charges 72%Fees & charges 12%Interest revenue 5%Other 4%Grants/subsidies & contributions 7%
REVENUE - What we have earned

67> BACK TO CONTENTS | > BACK TO INDEX
Capital revenue is sourced for the specific purpose of constructing council’s assets now and in the future. The majority of council’s capital revenue is derived from grants and subsidies (provided by the State and Federal Government) and contributions (provided by developers, builders and individuals).
On 1 July 2008, council transferred assets to the Bulk Water Authority. The net gain due to water reform represents the difference between the compensation received and the book value of assets transferred. Like the gain on restructure of local government, the gain due to water reform is also unique to this reporting period.
The net loss on disposal of assets represents the difference between the money received for the sale of assets, and the value of the assets on council’s books.
ExPENSE $’000
Employee costs 179,666
Materials and services 222,700
Depreciation 101,511
Amortisation 1,494
Finance costs 13,566
Other 413
TOTAL ExPENSE 519,350
Operating expenses represent the cost to council of running services, operating facilities and maintaining assets. Materials and services are the goods and services required for operational and maintenance purposes within council. These make up 42 per cent of council’s expenses. Employee costs are the labour costs that council incurs in operating and maintaining the services and assets of the region. Depreciation and amortisation represents the cost of council’s assets over time. These assets amount to $3.9 billion and include roads, drains, storm water infrastructure, water and sewerage infrastructure and cultural assets.
Capital expenditure (what we spend to build or enhance assets) is not shown on the Income Statement. Instead, capital expenditure is reflected in the Balance Sheet and is discussed on page 70.
NET RESULT $3,675,584
The net result is sometimes known in the commercial world as ‘profit or loss’. This term is not used by local government, because council is a not-for-profit entity. That is, the difference between what we earn (revenue) and what we spend (expense), is expected to be neutral (zero) or in a positive position to generate funding for future years (strategic planning).
The net result for this period is extremely large compared to prior years and expected future years. The Income Statement shows two substantial transactions related to local government amalgamation and water reform in South-East Queensland. Without these two items, the net result would have been $146 million.
Capital Revenue
Grants/subsidies & contributions 83.4%Net (loss) on disposal of fixed assets -0.4%Net gain due to water reform 17%
What does it cost to operate and maintain council services and assets?
Materials & services 42%Depreciation & amortisation 20%Other 3%Employee costs 35%
OPERATING ExPENSES
68
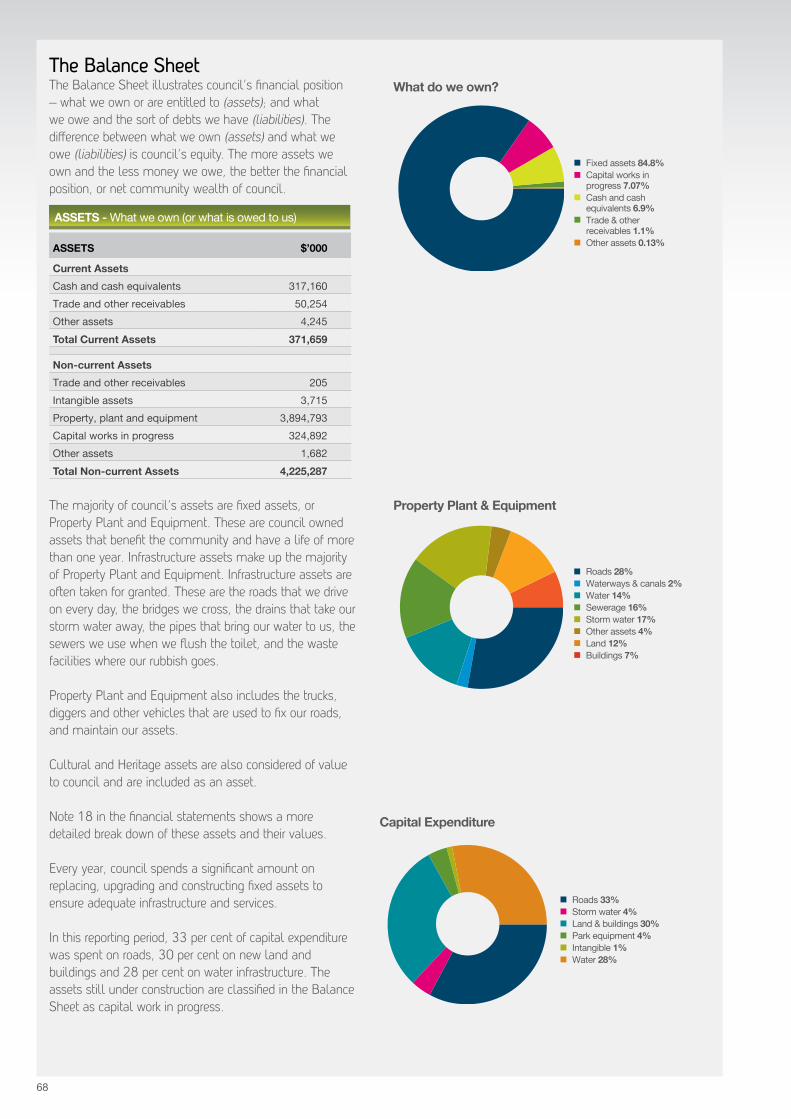
The Balance SheetThe Balance Sheet illustrates council’s financial position – what we own or are entitled to (assets); and what we owe and the sort of debts we have (liabilities). The difference between what we own (assets) and what we owe (liabilities) is council’s equity. The more assets we own and the less money we owe, the better the financial position, or net community wealth of council.
ASSETS $’000
Current Assets
Cash and cash equivalents 317,160
Trade and other receivables 50,254
Other assets 4,245
Total Current Assets 371,659
Non-current Assets
Trade and other receivables 205
Intangible assets 3,715
Property, plant and equipment 3,894,793
Capital works in progress 324,892
Other assets 1,682
Total Non-current Assets 4,225,287
The majority of council’s assets are fixed assets, or Property Plant and Equipment. These are council owned assets that benefit the community and have a life of more than one year. Infrastructure assets make up the majority of Property Plant and Equipment. Infrastructure assets are often taken for granted. These are the roads that we drive on every day, the bridges we cross, the drains that take our storm water away, the pipes that bring our water to us, the sewers we use when we flush the toilet, and the waste facilities where our rubbish goes.
Property Plant and Equipment also includes the trucks, diggers and other vehicles that are used to fix our roads, and maintain our assets.
Cultural and Heritage assets are also considered of value to council and are included as an asset.
Note 18 in the financial statements shows a more detailed break down of these assets and their values.
Every year, council spends a significant amount on replacing, upgrading and constructing fixed assets to ensure adequate infrastructure and services.
In this reporting period, 33 per cent of capital expenditure was spent on roads, 30 per cent on new land and buildings and 28 per cent on water infrastructure. The assets still under construction are classified in the Balance Sheet as capital work in progress.
Capital Expenditure
Roads 33%Storm water 4%land & buildings 30%Park equipment 4%Intangible 1%Water 28%
What do we own?
Fixed assets 84.8%Capital works in progress 7.07%Cash and cash equivalents 6.9%Trade & other receivables 1.1%Other assets 0.13%
ASSETS - What we own (or what is owed to us)
Property Plant & Equipment
Roads 28%Waterways & canals 2%Water 14%Sewerage 16%Storm water 17%Other assets 4%land 12%Buildings 7%

69> BACK TO CONTENTS | > BACK TO INDEX
Community Equity
Retained surplus 81%Asset revaluation reserve 13%Other reserves 6%
What do we owe?
loans 75%Trade & other payables 15%Provision for employee entitlements 6%Provision for restoration 3%unearned revenue 1%
LIABILITIES $’000
Current Liabilities
Trade and other payables 48,900
Interest bearing liabilities 56,580
Provision for employee entitlements 4,351
Provision for restoration 285
unearned revenue 2,631
Total Current Liabilities 112,747
Non-Current liabilities
Trade and other payables 5,057
Interest bearing liabilities 212,392
Provision for employee entitlements 18,902
Provision for restoration 11,321
Total Non-current Liabilities 247,672
TOTAL LIABILITIES 360,419
ASSETS - What we own (or what is owed to us)
Liabilities are what council owes suppliers, employees and lenders, both now and in the future. The current liabilities illustrate what we owe within the next 12 months. The non-current liabilities show what is owing in the future.
Liabilities also represent future estimated costs to be incurred (provisions). The two provisions that council holds in its Balance Sheet are for employee entitlements and restoration costs. The provision for employee entitlements is an estimate of what is expected to be paid to council’s employees in long-service leave and accumulated sick leave. The provision for restoration is the estimated future cost of restoring landfill sites to their original condition.
The largest liability council holds is loans from the Queensland Treasury Corporation. Council borrows money for funding capital expenditure. As discussed in the assets section on page 70, capital expenditure is expenditure on essential assets such as roads, bridges, drains, water and sewerage infrastructure. Loans for water and sewerage infrastructure are taken out over a term of 20 years and all other borrowings have a term of 15 years. The weighted average interest rate on borrowings is 6.36 per cent.
COMMUNITY EQUITY – Community wealth
COMMUNITY EQUITY $’000
Retained surplus 3,437,228
Asset revaluation reserve 560,943
Other reserves 238,356
TOTAL COMMUNITY EQUITY 4,236,527
Community Equity is the difference between council’s total assets and total liabilities. It represents the net wealth of council. It is broken up between the Asset Revaluation Reserve (the net amounts our fixed assets have increased over the years as market values have increased), Other Reserves (money council has set aside for specific ‘rainy days’) and Retained Surplus (the net amount of community wealth not yet allocated to specific reserves).

70
Cash Flow Statement
$’000
Cash Flows From Operating Activities
Receipts in the course of operations 474,324
Payments to suppliers and employees (441,141)
Interest and other costs of finance paid (11,085)
Net cash inflow from operating activities 22,098
Cash Flows From Investing Activities
Payments for property, plant and equipment (408,070)
Proceeds from sale of property, plant & equipment 2,973
Other capital proceeds 135,324
Interest and dividends received 25,154
Net cash outflow from investing activities (244,619)
Cash Flows From Financing Activities
Net loans to community organisations 35
Proceeds from borrowings 258,444
Repayment of borrowings (11,576)
Net cash inflow from financing activities 246,903
Net increase in cash and cash equivalents 24,382
Cash and equivalents transferred on amalgamation 292,778
Cash and equivalents at the end of the period 317,160
Statement of Cash Flows - For the period 15 March 2008 to 30 June 2009The Cash Flow Statement shows how council has generated its cash.
Like any business, sound cash management is essential. Without cash:
1. Council could not pay its bills and employees.
2. Council may miss opportunities to invest money in assets that provide it with the best return for the community.
3. Council may be forced to borrow money that it doesn’t need which costs council, and ultimately the community, money in interest.
The Cash Flow Statement is split up into three main cash components:
1. Operating Activities – these generate cash from normal operations, seen in the Income Statement as operating revenue and operating expenses. For an organisation to be healthy there must be positive cash flows from operating activities (net cash inflows).
2. Investing Activities – these relate to the purchasing and disposal of long-term assets (like Property Plant and Equipment).
3. Financing Activities – these relate to the receipt and repayment of council borrowings. This figure can be positive or negative, depending on council’s needs, so long as the level of debt is kept in check. The borrowings value is seen in the Balance Sheet.
NET CASH FlOW SOuRCES
Net cash inflow - operating activities
Net cash outflow - investing activities
Net cash inflow - financing activities
Cash at the end of the period
400
200
0
-200
-400
Net Cash Flow Sources

71> BACK TO CONTENTS | > BACK TO INDEX
The Statement of Changes in Equity
The Statement of Changes in Equity illustrates how the equity (the difference between what we own and what we owe) has changed as a result of what has happened on the income statement (retained surplus) and what has happened to the value of fixed assets on the balance sheet (asset revaluation reserve).
Other reserves form the part of Community Equity that has been put aside for future projects such as replacing roads and building bridges. The other reserve balance increases when money is transferred from the retained surplus (which has come from the net result on the Income Statement), and decreases when its funds are used for specific projects.
RETAINEd SURPLUSASSET REVALUATION
RESERVE OTHER RESERVESTOTAL COMMUNITY
EQUITY
$’000 $’000 $’000 $’000
Opening Balance - - - -
Surplus for the period 3,675,584 - - 3,675,584
Movement in the asset revaluation reserve
- 560,943 - 560,943
Total recognised income and expense
3,675,584 560,943 - 4,236,527
Transfers to and from reserves
Transfers to reserves (351,317) - 351,317 -
Transfers from reserves 112,961 - (112,961) -
Total transfers to and from reserve
(238,356) - 238,356 -
Balance at 30 June 2009 3,437,228 560,943 238,356 4,236,527
Summing it all upThe first set of Moreton Bay Regional Council Financial Statements illustrates that council is in a strong financial position, with a net positive cash flow (more money coming in than going out) and a Balance Sheet that indicates council has enough money to cover its obligations in 2009/10.
Council’s commitment to sound financial management and strategic planning will help ensure the continuing success and stability of our beautiful region.
Want to know more?Please email your questions to [email protected]
Statement of Changes in Equity - For the period 15 March 2008 to 30 June 2009
72
INDEX
AAccountability .................................. 55Aged Care Respite Service .................23Albany Creek Leisure Centre ...............30Amalgamation ....................... 2, 10, 11 Assets ..............................................68Audit committee ................................52Australia Day Awards .........................17Art awards ........................................18
BBanksia Beach Water Treatment Plant 46Beachmere beautification project .........31Birralee Child Care Centre ...................23Bongaree Seaside Museum ................30Brendale commercial projects .............34Broadband project .............................34 Burpengary East Sewerage Treatment Plant ...............................46Business events ................................35
CCaboolture Historical Village ...............31 Caboolture Library, Learning Centre and Art Gallery ........................................34Caboolture State Equestrian Centre .....30Caboolture Regional Sports Park .........20Capital expenditure ............................68 Cats and dogs ...................................24Cemeteries ................................ 10, 24Certification Professionals ............ 10, 56Charlie Moorhead Nature Refuge ........40Chief Executive Officer’s Report .............7CEO’s role and function......................53Climate change .................................39 Code of Conduct ................................53 Community Assisted Transport Service 23Community financial report ....... 63 – 71Community forum .............................52 Confidential matters .........................52Coordination Committee .....................52Corporate governance ........................51Corporate Plan ..................................51Council award wins ............................14Council meetings...............................51 Councillors .....................................8, 9 Councillor’s roles and functions .........53Councillor remuneration .............. 53, 54
dDeclared plants .................................24Debt management ............................69Destination Management Plan ............35Disability program..............................23Disaster management ........................26Dohles Rocks ....................................40
EEconomic Development Operational Plan ...............................35Educational programs ........... 23, 24, 42Electoral divisions ................................3Exhibitions ........................................19Expenses policy .......................... 58, 59
FFees and charges ..............................11Festivals and events ..........................17Financial performance ........................71Financial statements .................. See CDFreedom of Information ......................56
GGodwin Beach Environmental Reserve 40
IImmunisation programs .....................24
JJames Drysdale Reserve ....................20John Oxley Reserve ...........................20
KKey financial statistics ..........................5Kinsellas Sporting Field ......................20Koalas ..............................................41
LLibraries ...........................................22Loan borrowing policy ........................60Local laws ........................................10Logo ...................................................2
MManagement structure ................ 12, 13Mash It Up .......................................22Mayor’s report .................................... 6Mayor’s role and functions .................53Mission ...............................................4Moreton Bay Water TMP and SAMP ...47Mosquito control ...............................25Murrumba Downs Advanced Treatment Plant ...............................46Murrumba Downs Wastewater Treatment Plant ...............................46
OOlder and Bolder ...............................21
PPetsmart Programs ............................24Pine Rivers Family Day Care ...............23
Pine Rivers Home Assist Secure ..........23
Pine Rivers Park .................................30
Pressure and Leakage Management ...47
Population ..........................................5
RRecords management ........................11
Redcliffe streetscaping .......................34
Redcliffe Tennis Centre .......................20
Regional Arts Development Fund ......18
Regional Floodplain Database ...........34
Registers and documents ...................55
Revenue policy ........................... 61, 62
Risk management .............................57
Roads ...............................................32
Road Safety Partnership Project .........25
SSafer Suburbs project ........................25
Samford Parklands ............................29
Sandstone Point Foreshore Parkland ....40
SHAFT .............................................21
Shorebird mapping ............................40
Sister Cities ......................................35
Special and Separate charges ...... 56, 57
Staff ................................................14
Standing and Advisory committees .....52
Strategic Planning Wheel ...................50
South Pine Sports Complex ................20
TTenders ............................................57
V Values ...............................................4
Vehicles ...........................................41
Vision ................................................4
Visitor Information Centres .................35
Volunteers ........................................22
WWater reform ....................... 48, 66, 67
Waste management ................... 41, 42
Waterways ................................ 41, 47
Welcoming Places ...........................22
Woodford Arts Space ........................31
Woodside Sports Field ......................20
Woody Point Jetty ............................29
Woorim beautification project .............31
Workplace Health and Safety ..... 48, 57
YYoungs Crossing Road .......................32

1