Embed Size (px)
Citation preview

OUR FIRST QUARTER
INTERIM REPORT FIRST QUARTER
DECEMBER 2017 – FEBRUARY 2018
GROUP KEY FIGURES
Financial Year-end November 30 Q1 2018 Q1 2017Change
in %9)
Results of Operations during Reporting Period in EUR m
Revenues at constant exchange rates1) 299.2 298.0 0.4
Revenues 290.4 302.8 -4.1
Adjusted EBITDA at constant exchange rates2) 54.9 59.0 -7.0
Adjusted EBITDA3) 52.6 59.9 -12.1
in % of revenues 18.1 19.8 –
Adjusted EBITA4) 29.4 37.2 -21.0
in % of revenues 10.1 12.3 –
Results of operations 17.3 28.2 -38.7
Adjusted net income5) 58.8 19.2 > 100.0
Net Assets as of Reporting Date in EUR m
Total assets 2,388.5 2,373.7 0.6
Equity 823.9 789.9 4.3
Equity ratio in % 34.5 33.3 –
Net working capital 224.0 222.1 0.8
in % of revenues of the last twelve months 16.8 16.4 –
Capital expenditure 10.8 15.1 -28.2
Net financial debt 726.9 789.8 -8.0
Adjusted EBITDA leverage6) 2.4 2.6 –
Financial and Liquidity Position during Reporting Period in EUR m
Cash flow from operating activities -2.3 10.4 > -100.0
Cash flow from investing activities -10.7 -13.3 -19.9
thereof cash paid for capital expenditure -10.8 -15.1 -28.2
Free cash flow before financing activities -13.0 -2.9 > -100.0
Employees
Employees as of the reporting date (total) 9,773 9,807 -0.3
Stock Data
Number of shares at reporting date in million 31.4 31.4 –
Share price7) at reporting date in EUR 63.10 74.01 -14.7
Market capitalization at reporting date in EUR m 1,981.3 2,323.9 -14.7
Share price high7) during reporting period in EUR 73.25 76.56 –
Share price low7) during reporting period in EUR 60.90 67.14 –
Earnings per share in EUR 1.55 0.41 > 100.0
Adjusted earnings per share8) in EUR 1.85 0.60 > 100.0
1) Revenues at constant exchange rates of the first quarter 2017 were, for a better comparability, translated at the budget rates 2018, which are equivalent to the average rates of the financial year 2017 and can be found in Note (1) of the interim consolidated financial statements.
2) Adjusted EBITDA at constant exchange rates: Earnings before income taxes, net finance expense, amortization of fair value adjustments, depreciation and amortization, impairment losses, restructuring expenses, and one-off income and expenses. For a better comparability, adjusted EBITDA of the first quarter 2017 at constant exchange rates was translated at the budget rates 2018, which are equivalent to the average rates of the financial year 2017 and can be found in Note (1) of the interim consolidated financial statements.
3) Adjusted EBITDA: Earnings before income taxes, net finance expense, amortization of fair value adjustments, depreciation and amortization, impairment losses, restructuring expenses, and one-off income and expenses.
4) Adjusted EBITA: Earnings before income taxes, net finance expense, amortization of fair value adjustments, impairment losses, restructuring expenses, and one-off income and expenses.
5) Adjusted net income: Consolidated net income before non-cash amortization of fair value adjustments, restructuring expenses, impairment losses, one-off income and expenses (including significant non-cash expenses), and the related tax effects.
6) Adjusted EBITDA leverage: The relation of net financial debt to adjusted EBITDA of the last twelve months according to the credit agreement currently in place.7) Xetra closing price.8) Adjusted earnings per share after non-controlling interests divided by 31.4m shares.9) Change calculated on a EUR k basis.
1
DIVISIONS
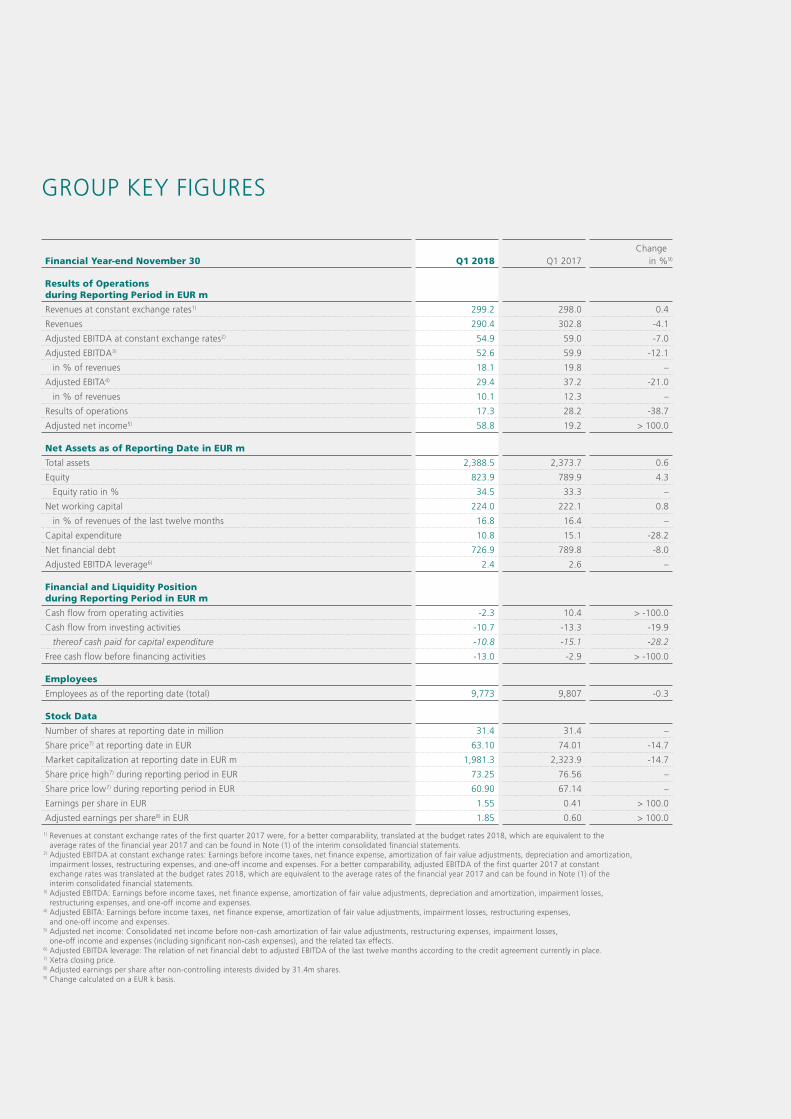
› Primary Packaging Glass
The Primary Packaging Glass Division produces glass primary packaging for
medicines and cosmetics, such as pharma jars, ampoules, injection vials,
cartridges, perfume flacons and cream jars.
1) Revenues at constant exchange rates by division include intercompany revenues and were in the first quarter 2017, for a better comparability, translated at the budget rates 2018, which are equivalent to the average rates of the financial year 2017 and can be found in Note (1) of the interim consolidated financial statements.
2) Revenues by division include intercompany revenues.3) Adjusted EBITDA at constant exchange rates: Earnings before income taxes, net finance expense, amortization of fair value adjustments, depreciation and amortization,
impairment losses, restructuring expenses, and one-off income and expenses. Adjusted EBITDA at constant exchange rates of the first quarter 2017 was, for a better comparability, translated at the budget rates 2018, which are equivalent to the average rates of the financial year 2017 and can be found in Note (1) of the interim consolidated financial statements.
4) Adjusted EBITDA: Earnings before income taxes, net finance expense, amortization of fair value adjustments, depreciation and amortization, impairment losses, restructuring expenses, and one-off income and expenses.
5) Change calculated on a EUR k basis.
› Plastics & Devices
The product portfolio of the Plastics & Devices Division includes complex,
customer-specific products for the simple and safe administration of medi-
cines, such as insulin pens, inhalers and prefillable syringes. Also included
are diagnostics and medical technology products such as lancets and test
systems as well as pharmaceutical plastic containers for liquid and solid
medicines with closure and safety systems.
in EUR m Q1 2018 Q1 2017 Change in %5)
Revenues at constant exchange rates1) 162.7 161.9 0.5
Revenues2) 157.3 164.6 -4.5
Adjusted EBITDA at constant exchange rates3) 39.6 39.5 0.2
Adjusted EBITDA4) 37.6 40.3 -6.6
in % of revenues 23.9 24.5 –
Capital expenditure 5.9 6.7 -11.8
in EUR m Q1 2018 Q1 2017 Change in %5)
Revenues at constant exchange rates1) 136.5 136.5 –
Revenues2) 133.1 138.6 -3.9
Adjusted EBITDA at constant exchange rates3) 20.6 24.2 -14.9
Adjusted EBITDA4) 20.3 24.3 -16.3
in % of revenues 15.3 17.5 –
Capital expenditure 4.2 5.9 -28.0
2
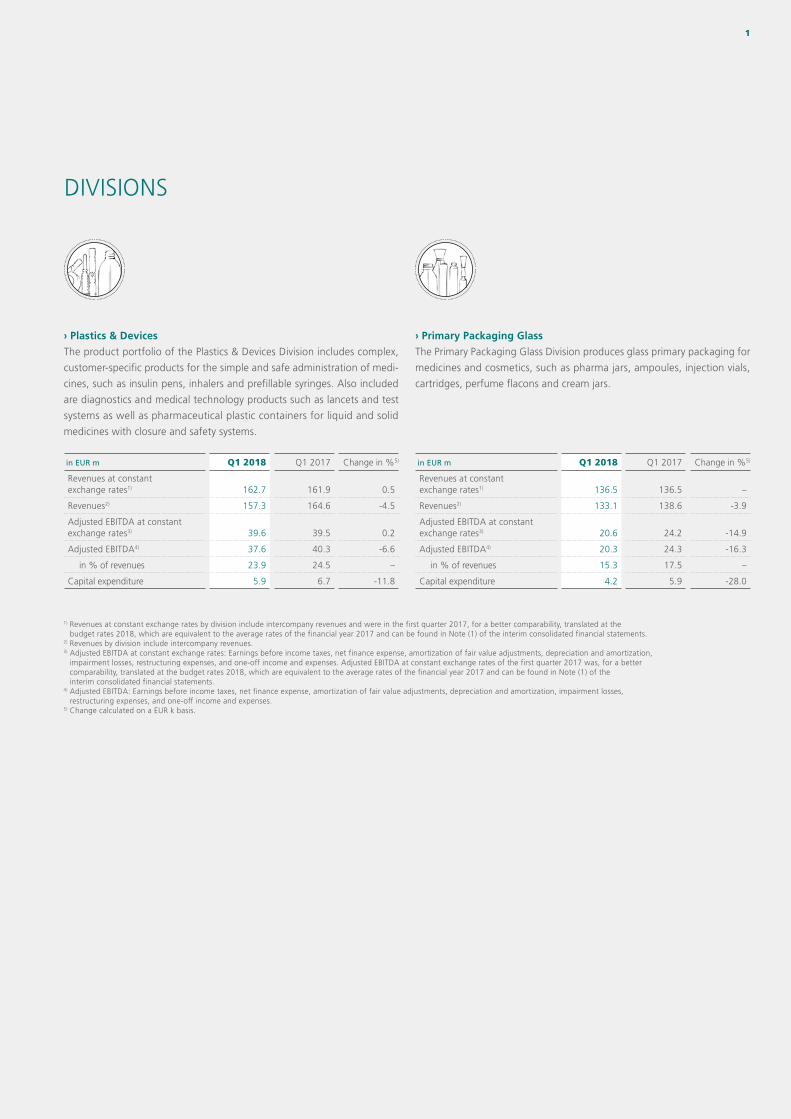
KEY FACTS FIRST QUARTER 2018
› Revenues at constant exchange rates amounting to EUR 299.2m in the first quarter of
2018—as expected, stable relative to prior-year period; organic revenue growth of 0.4%
› Adjusted EBITDA at constant exchange rates amounts to EUR 54.9m, as budgeted below
the EUR 59.0m in the prior-year quarter
› The development of the US dollar against the Euro—which, on average, fell from USD
1.06 in the prior-year quarter to USD 1.21 in the first quarter of 2018—led to a 4.1%
decrease in revenues to EUR 290.4m and in adjusted EBITDA to EUR 52.6m solely based
on currency effects
› Adjusted earnings per share increased to EUR 1.85, compared with EUR 0.60 in the
prior-year quarter, primarily due to effects of the US tax reform
› Guidance for the financial year 2018 confirmed
› Call option for acquisition of the remaining 25% of shares in Triveni Polymer Private Ltd.
(New Delhi/India) exercised by Gerresheimer on April 9, 2018
3
4 GERRESHEIMER ON THE CAPITAL MARKETS 4 Gerresheimer shares 4 Proposed dividend of EUR 1.10 per share 4 Positive analyst recommendations continue to outweigh significantly 5 Gerresheimer bond
6 INTERIM GROUP MANAGEMENT REPORT DECEMBER 2017 – FEBRUARY 2018 6 Development of the economic environment 7 Currency effects 7 Revenue performance 8 Results of operations10 Net assets12 Operating cash flow13 Cash flow statement 13 Employees13 Report on opportunities and risks14 Outlook
15 INTERIM CONSOLIDATED FINANCIAL STATEMENTS DECEMBER 2017 – FEBRUARY 201816 Consolidated income statement17 Consolidated statement of comprehensive income 18 Consolidated balance sheet 19 Consolidated statement of changes in equity 20 Consolidated cash flow statement 21 Notes to the interim consolidated financial statements
28 FURTHER INFORMATION28 Financial calendar28 Imprint
CONTENTS
4 Gerresheimer AG INTERIM REP ORT DECEMBER 2017 – FEBRUARY 2018
GERRESHEIMER ON THE CAPITAL MARKETS
GERRESHEIMER SHARES
Global stock markets started the new year on a positive trend. This was
supported by good global economic growth and the US tax reform adopted
in December 2017. International stock markets underwent a noticeable
correction in early February 2018. This was thought to be driven by con-
cerns that the US Federal Reserve would implement the interest rate rises
announced some time ago more quickly than previously expected.
Gerresheimer shares followed this movement, as did our benchmark index,
the MDAX. Up to mid-February 2018, our share price performance was
well above that of the MDAX. The Gerresheimer share price marked its first
quarter 2018 high of EUR 73.25 on January 23, 2018, having up to that
point gained 9.2% since the beginning of our financial year 2018.
With the publication of the consolidated results for our financial year 2017
on February 22, 2018, the Gerresheimer share price fell briefly to close on
February 23, 2018 at EUR 60.90, its lowest level in the first quarter of 2018.
Our share price soon started recovering from February 26, 2018 and closed
the first quarter on February 28, 2018 at EUR 63.10.
Compared with the MDAX, the Gerresheimer share price was 3.1% below
the performance of the index in the period from December 1, 2017 to
February 28, 2018.
Our share price continued to recover through to March 9, 2018, when
it closed 0.1% down on December 1, 2017, while the MDAX had fallen
further, by 3.3%.
PROPOSED DIVIDEND OF EUR 1.10 PER SHARE
At the Annual General Meeting on April 25, 2018, the Management Board
and Supervisory Board will propose an increased dividend of EUR 1.10 per
share for the financial year 2017 (2016: EUR 1.05 per share). This represents
a total dividend distribution of EUR 34.5m—an increase of 4.8% against
the prior-year dividend—and, subject to approval, would mark the seventh
dividend increase in succession. The dividend distribution ratio amounts to
27.1% of adjusted net income after non-controlling interests. This distri-
bution is in line with our dividend policy of distributing to our shareholders
between 20% and 30% of adjusted net income after non-controlling
interests, depending on our operating performance.
POSITIVE ANALYST RECOMMENDATIONS CONTINUE TO OUTWEIGH SIGNIFICANTLY
Gerresheimer shares were covered by 16 bank analysts as of the end of the
first quarter of 2018. With seven buy, seven hold and two sell recommen-
dations, positive ratings continued to outweigh significantly. The average
target price as of February 28, 2018 was EUR 71.15.
Gerresheimer Shares: Key Data
Q1 2018 Q1 2017 FY 2017
Number of shares at reporting date in million 31.4 31.4 31.4
Share price1) at reporting date in EUR 63.10 74.01 67.06
Market capitalization at reporting date in EUR m 1,981.3 2,323.9 2,105.7
Share price high1) during reporting period in EUR 73.25 76.56 78.01
Share price low1) during reporting period in EUR 60.90 67.14 61.03
Earnings per share in EUR 1.55 0.41 3.21
Dividend per share in EUR – – 1.102)
1) Xetra closing price.2) Proposed appropriation of retained earnings.
GERRESHEIMER ON THE C API TAL MARKE T S
Gerresheimer AG MDAX
95%
90%
105%
100%
110%
101%
102%
103%
December January MarchFebruary
December January February
Feb. 28, 2018EUR 63.10
closing price
Gerresheimer AG shares versus MDAX (indexed)
Index November 30, 2017 = 100%
5
GERRESHEIMER BOND
The Gerresheimer bond price (ISIN: XS0626028566) remained at a high level.
As of February 28, 2018, the bond price closed at 101.0%. The background
to the change in the price is the repayment of the bond on May 19, 2018.
Because of this, the effective interest rate as of February 28, 2018 is 0.1%.
Rating agencies Moody’s and Standard & Poor’s both retain investment grade
ratings for Gerresheimer at Baa3 and BBB- respectively. The bond can be traded
in floor trading in Frankfurt as well as on regional exchanges in Germany.
Bond reference dataISIN XS0626028566
WKN A1H3VP
Issuer Gerresheimer AG
Volume EUR 300m
Coupon/coupon date 5% p.a./May 19
Maturity date May 19, 2018
Bond price1) at reporting date 101.0%
Effective annual interest rate (yield to maturity)2) at reporting date 0.1% p. a.
Bond rating at reporting dateStandard & Poor's: BBB-, stable outlook Moody's: Baa3, negative outlook
Corporate rating at reporting date
Standard & Poor's: BBB-, stable outlook Moody's: Baa3, negative outlook
Denomination EUR 1,000.00 par value
ListingsBerlin, Duesseldorf, Frankfurt (floor trading), Hamburg, Hanover, Munich, Stuttgart
1) Closing price, Stuttgart Stock Exchange.2) Based on the closing price on Stuttgart Stock Exchange.
GERRESHEIMER ON THE C API TAL MARKE T S
95%
90%
105%
100%
110%
101%
102%
103%
December January MarchFebruary
December January February
Feb. 28, 2018EUR 63.10
closing price
Gerresheimer AG Bond: Price Performance
Market price November 30, 2017 = 102.2%
Gerresheimer AG
INTERIM GROUP MANAGEMENT REP ORT6 Gerresheimer AG INTERIM REP ORT DECEMBER 2017 – FEBRUARY 2018
1) International Monetary Fund: World Economic Outlook Update, January 2018. 2) Federal Ministry for Economic Affairs and Energy: Monthly report, March 2018.3) IQVIA (formerly Quintiles IMS), January 10, 2018.4) For a definition of pharmerging markets (emerging markets), please see Note (8)
of the Notes to the Consolidated Financial Statements.
According to the Federal Ministry for Economic Affairs and Energy (BMWi),
the German economy is in a strong upturn. In addition to industrial new
orders, which hit new records in December, consumer propensity to spend
and retail sentiment also remain positive.2) The IMF nonetheless projects a
slight decrease in economic growth for Germany to 2.3% in 2018, compared
with 2.5% in 2017.
The IMF’s growth rate forecast for emerging markets in 2018 is 4.9%,
slightly above the prior-year figure of 4.7%. That is substantially higher
than the growth rate in industrialized nations. Specifically, the IMF expects
6.6% gross domestic product (GDP) growth for China (2017: 6.8%) and
an increase of 7.4% for India (2017: 6.7%); in Brazil, GDP is projected to
show growth of 1.9% (2017: 1.1%).
Global pharma market growth weakened significantly in 2017. As well as in
price erosion reported by various pharma groups, this also made itself felt in
volume growth, which is the indicator relevant to us and which according
to IQVIA3) came to only 0.1% in 2017. On this basis, IQVIA calculates an
average annual growth rate of 2.1% for the years 2012 to 2017, with 3%
growth in the period 2011 to 2016 as against 6% in the period 2006 to
2011. Whereas the pharmerging markets4) recorded average volume growth
of 3.9% in the years 2012 to 2017, the corresponding trend in other markets
was substantially more negative. These even saw volumes fall by an average
of 0.2% a year over the last five years.
The generics subsegment, which is subject to very strong price pressure in
the North American market especially, recorded volume growth of 1.0% at
global level in 2017. The average annual growth rate here in the years 2012
to 2017 was 3.1%. On a regional comparison, the pharmerging markets
showed an average of 3.9% growth per year for the last five years, whereas
average annual volume growth in other markets was just 0.8%.
INTERIM GROUP MANAGEMENT REPORT DECEMBER 2017 – FEBRUARY 2018
DEVELOPMENT OF THE ECONOMIC ENVIRONMENT
In its January 2018 economic outlook, the International Monetary Fund (IMF)1)
raised its forecast for global economic growth in 2018 by 0.2 percentage
points to 3.9%. The reasons given are a generally improved growth mo-
mentum and the expected effects of the US tax reform. However, the IMF
stresses as before that the outlook fundamentally remains skewed to the
downside over the medium term. As potential threats, it notes among other
things a tightening of the global financial environment due to a faster than
expected pace of monetary policy normalization, potentially leading to rising
interest rates. It also mentions financial market turbulence in emerging
markets where, for example, China’s transformation towards consumption
and services is currently losing pace and, in conjunction with high debt
levels, could lead to a sharp growth slowdown.
For the USA, the IMF expects growth of 2.7% for 2018. It thus increased
its October forecast by 0.4 percentage points. Alongside the stronger than
expected economic activity in conjunction with a rise in external demand,
this is notably attributed to the anticipated macroeconomic effects of the
US tax reform.
For the eurozone, estimates for 2018 project a slight decrease in economic
growth to about 2.2%—compared with growth of some 2.4% in 2017.
The reason cited by the IMF are weaker productivity, demographic change
in a number of countries and a public and private debt overhang.
INTERIM GROUP MANAGEMENT REP ORT 7
Based on this trend, IQVIA projects average annual volume growth in the
global pharma market of 2.0% for the years 2017 to 2022, compared
with the 3.0% expected in the prior year for the years 2016 to 2021. The
expectation for pharmerging markets is for an average of 3.0% per year in
the next five years, whereas average volume growth of 1.7% is projected for
other markets. This expectation underscores IQVIA’s opinion that the current
weakness in other pharma markets is likely to be temporary in nature. For
the generics subsegment, IQVIA expects volume growth at an average of
2.7% for the next five years, with 3.1% anticipated for the pharmerging
markets and 1.7% for other markets.
CURRENCY EFFECTS
The Gerresheimer Group’s strong international presence exposes our revenue
performance and results of operations to external factors such as currency
movements. For this reason, we additionally state revenues, revenue growth
and adjusted EBITDA in the management report at constant exchange
rates. The figures are calculated using actual average exchange rates in
the financial year 2017. For the US dollar—which is expected to have the
largest currency impact on our Group currency, accounting for about a third
of Group revenues budgeted for the financial year 2018 or about 40% of
adjusted EBITDA—we have assumed an exchange rate of approximately
USD 1.12 to EUR 1.00. As before, a rise or fall in the US dollar against the
euro by about one cent has an impact of around EUR 4m on revenues and
EUR 1m on adjusted EBITDA. Given our production locations in the USA
and financial debt in US dollars, fluctuations in the US dollar/euro exchange
rate have no material effect on Group earnings performance and essentially
only lead to translation effects. As in prior years, external factors such as
the development of energy and commodity prices had little impact on the
Gerresheimer Group’s results of operations in the reporting period. Price
fluctuations in the procurement markets for raw materials and energy are
largely offset by contractually agreed price escalation clauses, hedging
transactions, productivity gains and price adjustments.
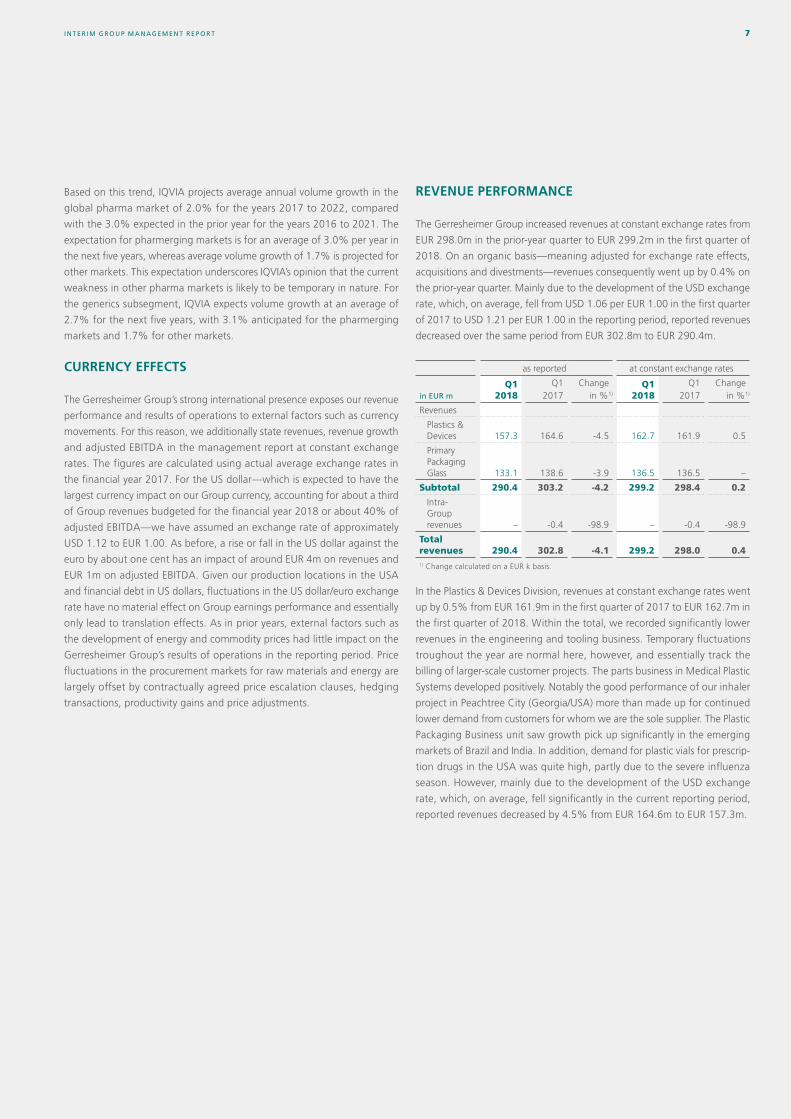
REVENUE PERFORMANCE
The Gerresheimer Group increased revenues at constant exchange rates from
EUR 298.0m in the prior-year quarter to EUR 299.2m in the first quarter of
2018. On an organic basis—meaning adjusted for exchange rate effects,
acquisitions and divestments—revenues consequently went up by 0.4% on
the prior-year quarter. Mainly due to the development of the USD exchange
rate, which, on average, fell from USD 1.06 per EUR 1.00 in the first quarter
of 2017 to USD 1.21 per EUR 1.00 in the reporting period, reported revenues
decreased over the same period from EUR 302.8m to EUR 290.4m.
as reported at constant exchange rates
in EUR mQ1
2018Q1
2017Change
in %1)
Q1 2018
Q1 2017
Changein %1)
Revenues
Plastics & Devices 157.3 164.6 -4.5 162.7 161.9 0.5
Primary Packaging Glass 133.1 138.6 -3.9 136.5 136.5 –
Subtotal 290.4 303.2 -4.2 299.2 298.4 0.2
Intra-Group revenues – -0.4 -98.9 – -0.4 -98.9
Total revenues 290.4 302.8 -4.1 299.2 298.0 0.41) Change calculated on a EUR k basis.
In the Plastics & Devices Division, revenues at constant exchange rates went
up by 0.5% from EUR 161.9m in the first quarter of 2017 to EUR 162.7m in
the first quarter of 2018. Within the total, we recorded significantly lower
revenues in the engineering and tooling business. Temporary fluctuations
troughout the year are normal here, however, and essentially track the
billing of larger-scale customer projects. The parts business in Medical Plastic
Systems developed positively. Notably the good performance of our inhaler
project in Peachtree City (Georgia/USA) more than made up for continued
lower demand from customers for whom we are the sole supplier. The Plastic
Packaging Business unit saw growth pick up significantly in the emerging
markets of Brazil and India. In addition, demand for plastic vials for prescrip-
tion drugs in the USA was quite high, partly due to the severe influenza
season. However, mainly due to the development of the USD exchange
rate, which, on average, fell significantly in the current reporting period,
reported revenues decreased by 4.5% from EUR 164.6m to EUR 157.3m.
INTERIM GROUP MANAGEMENT REP ORT8 Gerresheimer AG INTERIM REP ORT DECEMBER 2017 – FEBRUARY 2018
Revenues at constant exchange rates in the Primary Packaging Glass Division,
at EUR 136.5m, were unaltered in the first quarter of 2018 relative to the
prior-year quarter. Revenues in the North America region are once again
down. A noteworthy factor here is the relatively pronounced reticence
among our large pharma customers to place orders. This has persisted since
the beginning of the financial year 2017 and, in our view, is improving only
gradually. However, we have been able to fully compensate for the decrease
with positive revenue performance in all other regions. The key drivers here
have been strong growth in China and in the cosmetics business. Reported
revenues—including exchange rate changes—decreased by 3.9% in the
Primary Packaging Glass Division from EUR 138.6m in the first quarter of
2017 to EUR 133.1m in the reporting period.
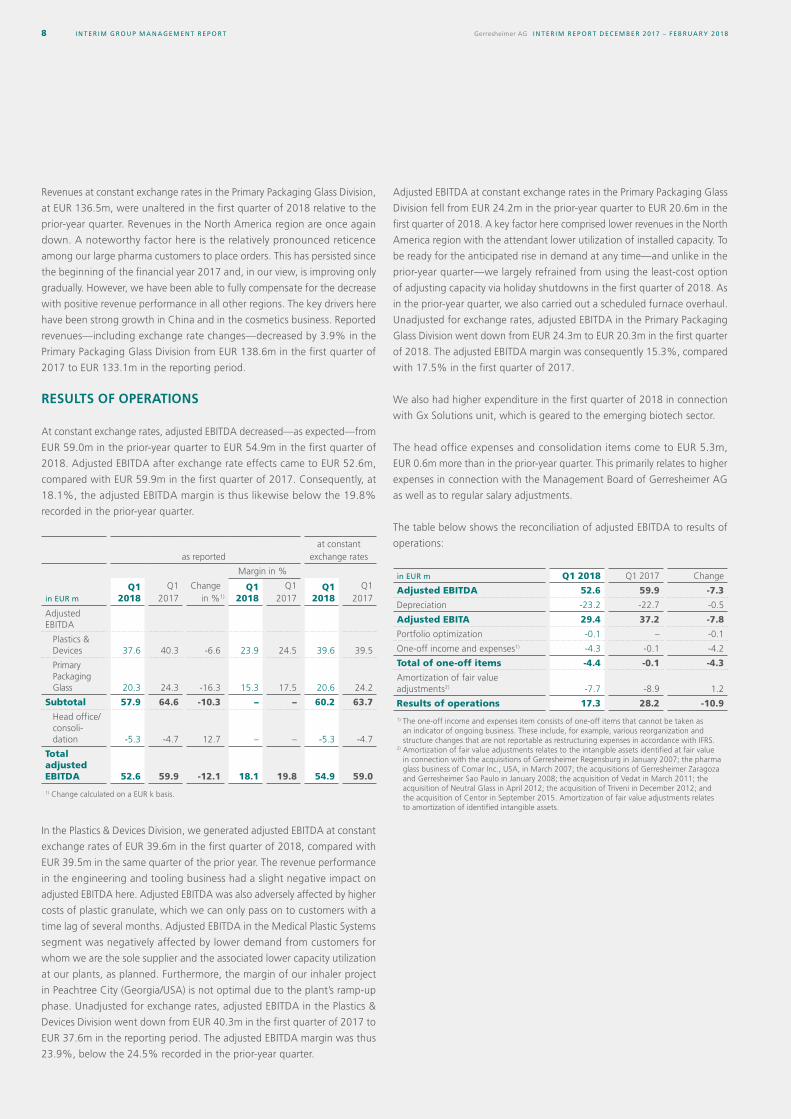
RESULTS OF OPERATIONS
At constant exchange rates, adjusted EBITDA decreased—as expected—from
EUR 59.0m in the prior-year quarter to EUR 54.9m in the first quarter of
2018. Adjusted EBITDA after exchange rate effects came to EUR 52.6m,
compared with EUR 59.9m in the first quarter of 2017. Consequently, at
18.1%, the adjusted EBITDA margin is thus likewise below the 19.8%
recorded in the prior-year quarter.
as reported at constant
exchange rates
Margin in %
in EUR mQ1
2018Q1
2017Change
in %1)
Q1 2018
Q1 2017
Q1 2018
Q1 2017
Adjusted EBITDA
Plastics & Devices 37.6 40.3 -6.6 23.9 24.5 39.6 39.5
Primary Packaging Glass 20.3 24.3 -16.3 15.3 17.5 20.6 24.2
Subtotal 57.9 64.6 -10.3 – – 60.2 63.7
Head office/consoli-dation -5.3 -4.7 12.7 – – -5.3 -4.7
Total adjusted EBITDA 52.6 59.9 -12.1 18.1 19.8 54.9 59.0
1) Change calculated on a EUR k basis.
In the Plastics & Devices Division, we generated adjusted EBITDA at constant
exchange rates of EUR 39.6m in the first quarter of 2018, compared with
EUR 39.5m in the same quarter of the prior year. The revenue performance
in the engineering and tooling business had a slight negative impact on
adjusted EBITDA here. Adjusted EBITDA was also adversely affected by higher
costs of plastic granulate, which we can only pass on to customers with a
time lag of several months. Adjusted EBITDA in the Medical Plastic Systems
segment was negatively affected by lower demand from customers for
whom we are the sole supplier and the associated lower capacity utilization
at our plants, as planned. Furthermore, the margin of our inhaler project
in Peachtree City (Georgia/USA) is not optimal due to the plant’s ramp-up
phase. Unadjusted for exchange rates, adjusted EBITDA in the Plastics &
Devices Division went down from EUR 40.3m in the first quarter of 2017 to
EUR 37.6m in the reporting period. The adjusted EBITDA margin was thus
23.9%, below the 24.5% recorded in the prior-year quarter.
Adjusted EBITDA at constant exchange rates in the Primary Packaging Glass
Division fell from EUR 24.2m in the prior-year quarter to EUR 20.6m in the
first quarter of 2018. A key factor here comprised lower revenues in the North
America region with the attendant lower utilization of installed capacity. To
be ready for the anticipated rise in demand at any time—and unlike in the
prior-year quarter—we largely refrained from using the least-cost option
of adjusting capacity via holiday shutdowns in the first quarter of 2018. As
in the prior-year quarter, we also carried out a scheduled furnace overhaul.
Unadjusted for exchange rates, adjusted EBITDA in the Primary Packaging
Glass Division went down from EUR 24.3m to EUR 20.3m in the first quarter
of 2018. The adjusted EBITDA margin was consequently 15.3%, compared
with 17.5% in the first quarter of 2017.
We also had higher expenditure in the first quarter of 2018 in connection
with Gx Solutions unit, which is geared to the emerging biotech sector.
The head office expenses and consolidation items come to EUR 5.3m,
EUR 0.6m more than in the prior-year quarter. This primarily relates to higher
expenses in connection with the Management Board of Gerresheimer AG
as well as to regular salary adjustments.
The table below shows the reconciliation of adjusted EBITDA to results of
operations:
in EUR m Q1 2018 Q1 2017 Change
Adjusted EBITDA 52.6 59.9 -7.3
Depreciation -23.2 -22.7 -0.5
Adjusted EBITA 29.4 37.2 -7.8
Portfolio optimization -0.1 – -0.1
One-off income and expenses1) -4.3 -0.1 -4.2
Total of one-off items -4.4 -0.1 -4.3
Amortization of fair value adjustments2) -7.7 -8.9 1.2
Results of operations 17.3 28.2 -10.9
1) The one-off income and expenses item consists of one-off items that cannot be taken as an indicator of ongoing business. These include, for example, various reorganization and structure changes that are not reportable as restructuring expenses in accordance with IFRS.
2) Amortization of fair value adjustments relates to the intangible assets identified at fair value in connection with the acquisitions of Gerresheimer Regensburg in January 2007; the pharma glass business of Comar Inc., USA, in March 2007; the acquisitions of Gerresheimer Zaragoza and Gerresheimer Sao Paulo in January 2008; the acquisition of Vedat in March 2011; the acquisition of Neutral Glass in April 2012; the acquisition of Triveni in December 2012; and the acquisition of Centor in September 2015. Amortization of fair value adjustments relates to amortization of identified intangible assets.
INTERIM GROUP MANAGEMENT REP ORT 9
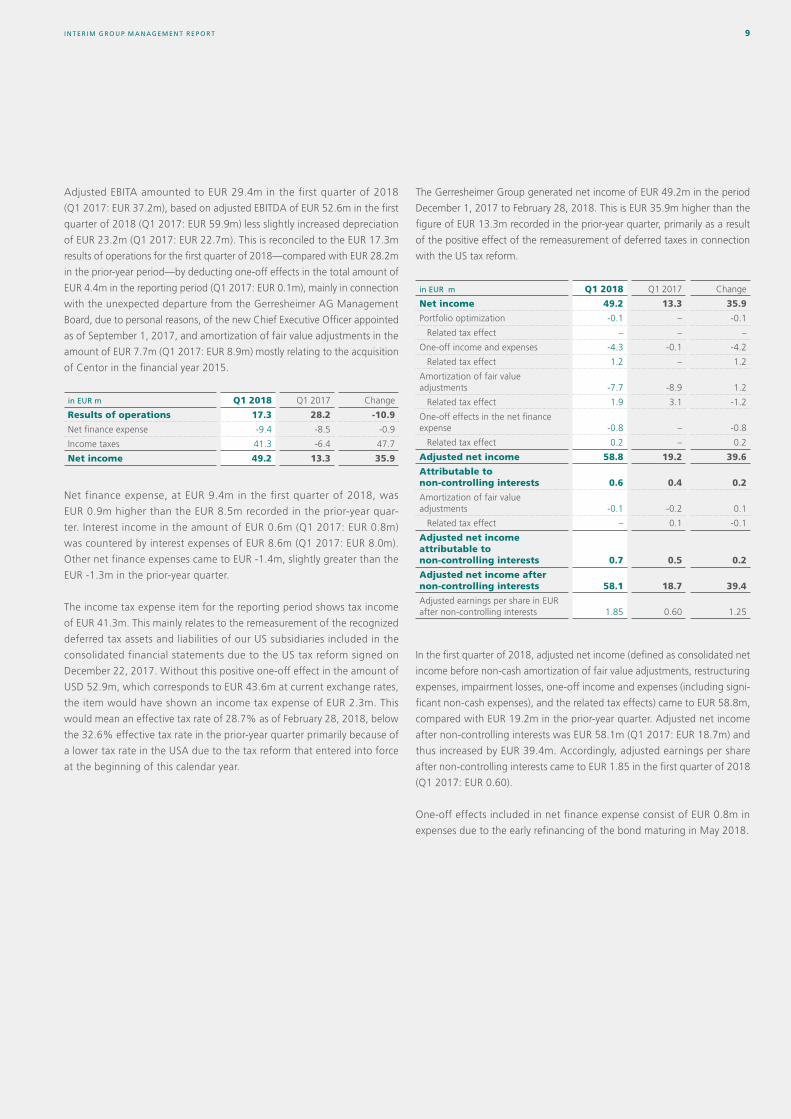
Adjusted EBITA amounted to EUR 29.4m in the first quarter of 2018
(Q1 2017: EUR 37.2m), based on adjusted EBITDA of EUR 52.6m in the first
quarter of 2018 (Q1 2017: EUR 59.9m) less slightly increased depreciation
of EUR 23.2m (Q1 2017: EUR 22.7m). This is reconciled to the EUR 17.3m
results of operations for the first quarter of 2018—compared with EUR 28.2m
in the prior-year period—by deducting one-off effects in the total amount of
EUR 4.4m in the reporting period (Q1 2017: EUR 0.1m), mainly in connection
with the unexpected departure from the Gerresheimer AG Management
Board, due to personal reasons, of the new Chief Executive Officer appointed
as of September 1, 2017, and amortization of fair value adjustments in the
amount of EUR 7.7m (Q1 2017: EUR 8.9m) mostly relating to the acquisition
of Centor in the financial year 2015.
in EUR m Q1 2018 Q1 2017 Change
Results of operations 17.3 28.2 -10.9
Net finance expense -9.4 -8.5 -0.9
Income taxes 41.3 -6.4 47.7
Net income 49.2 13.3 35.9
Net finance expense, at EUR 9.4m in the first quarter of 2018, was
EUR 0.9m higher than the EUR 8.5m recorded in the prior-year quar-
ter. Interest income in the amount of EUR 0.6m (Q1 2017: EUR 0.8m)
was countered by interest expenses of EUR 8.6m (Q1 2017: EUR 8.0m).
Other net finance expenses came to EUR -1.4m, slightly greater than the
EUR -1.3m in the prior-year quarter.
The income tax expense item for the reporting period shows tax income
of EUR 41.3m. This mainly relates to the remeasurement of the recognized
deferred tax assets and liabilities of our US subsidiaries included in the
consolidated financial statements due to the US tax reform signed on
December 22, 2017. Without this positive one-off effect in the amount of
USD 52.9m, which corresponds to EUR 43.6m at current exchange rates,
the item would have shown an income tax expense of EUR 2.3m. This
would mean an effective tax rate of 28.7% as of February 28, 2018, below
the 32.6% effective tax rate in the prior-year quarter primarily because of
a lower tax rate in the USA due to the tax reform that entered into force
at the beginning of this calendar year.
The Gerresheimer Group generated net income of EUR 49.2m in the period
December 1, 2017 to February 28, 2018. This is EUR 35.9m higher than the
figure of EUR 13.3m recorded in the prior-year quarter, primarily as a result
of the positive effect of the remeasurement of deferred taxes in connection
with the US tax reform.
in EUR m Q1 2018 Q1 2017 Change
Net income 49.2 13.3 35.9
Portfolio optimization -0.1 – -0.1
Related tax effect – – –
One-off income and expenses -4.3 -0.1 -4.2
Related tax effect 1.2 – 1.2
Amortization of fair valueadjustments -7.7 -8.9 1.2
Related tax effect 1.9 3.1 -1.2
One-off effects in the net finance expense -0.8 – -0.8
Related tax effect 0.2 – 0.2
Adjusted net income 58.8 19.2 39.6
Attributable to non-controlling interests 0.6 0.4 0.2
Amortization of fair value adjustments -0.1 -0.2 0.1
Related tax effect – 0.1 -0.1
Adjusted net income attributable to non-controlling interests 0.7 0.5 0.2
Adjusted net income after non-controlling interests 58.1 18.7 39.4
Adjusted earnings per share in EUR after non-controlling interests 1.85 0.60 1.25
In the first quarter of 2018, adjusted net income (defined as consolidated net
income before non-cash amortization of fair value adjustments, restructuring
expenses, impairment losses, one-off income and expenses (including signi-
ficant non-cash expenses), and the related tax effects) came to EUR 58.8m,
compared with EUR 19.2m in the prior-year quarter. Adjusted net income
after non-controlling interests was EUR 58.1m (Q1 2017: EUR 18.7m) and
thus increased by EUR 39.4m. Accordingly, adjusted earnings per share
after non-controlling interests came to EUR 1.85 in the first quarter of 2018
(Q1 2017: EUR 0.60).
One-off effects included in net finance expense consist of EUR 0.8m in
expenses due to the early refinancing of the bond maturing in May 2018.
INTERIM GROUP MANAGEMENT REP ORT10 Gerresheimer AG INTERIM REP ORT DECEMBER 2017 – FEBRUARY 2018
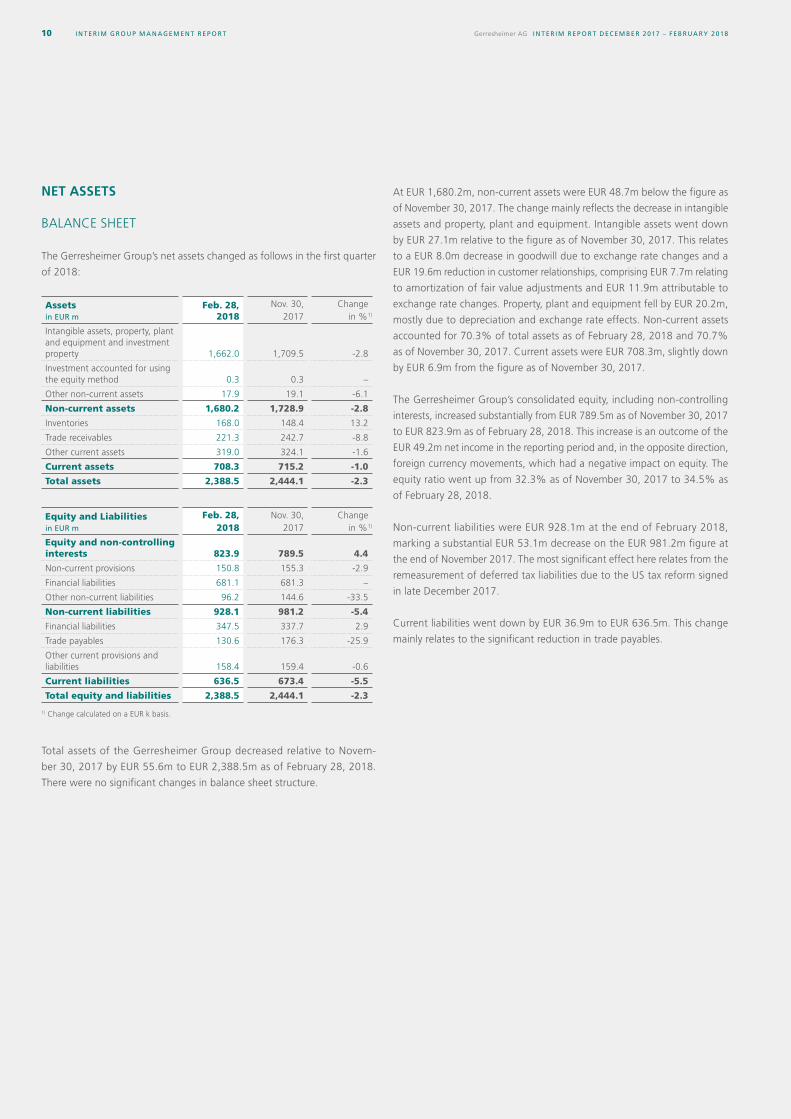
NET ASSETS
BALANCE SHEET
The Gerresheimer Group’s net assets changed as follows in the first quarter
of 2018:
Assets in EUR m
Feb. 28, 2018
Nov. 30, 2017
Change in %1)
Intangible assets, property, plant and equipment and investment property 1,662.0 1,709.5 -2.8
Investment accounted for using the equity method 0.3 0.3 –
Other non-current assets 17.9 19.1 -6.1
Non-current assets 1,680.2 1,728.9 -2.8
Inventories 168.0 148.4 13.2
Trade receivables 221.3 242.7 -8.8
Other current assets 319.0 324.1 -1.6
Current assets 708.3 715.2 -1.0
Total assets 2,388.5 2,444.1 -2.3
Equity and Liabilities in EUR m
Feb. 28, 2018
Nov. 30, 2017
Change in %1)
Equity and non-controlling interests 823.9 789.5 4.4
Non-current provisions 150.8 155.3 -2.9
Financial liabilities 681.1 681.3 –
Other non-current liabilities 96.2 144.6 -33.5
Non-current liabilities 928.1 981.2 -5.4
Financial liabilities 347.5 337.7 2.9
Trade payables 130.6 176.3 -25.9
Other current provisions and liabilities 158.4 159.4 -0.6
Current liabilities 636.5 673.4 -5.5
Total equity and liabilities 2,388.5 2,444.1 -2.3
1) Change calculated on a EUR k basis.
Total assets of the Gerresheimer Group decreased relative to Novem-
ber 30, 2017 by EUR 55.6m to EUR 2,388.5m as of February 28, 2018.
There were no significant changes in balance sheet structure.
At EUR 1,680.2m, non-current assets were EUR 48.7m below the figure as
of November 30, 2017. The change mainly reflects the decrease in intangible
assets and property, plant and equipment. Intangible assets went down
by EUR 27.1m relative to the figure as of November 30, 2017. This relates
to a EUR 8.0m decrease in goodwill due to exchange rate changes and a
EUR 19.6m reduction in customer relationships, comprising EUR 7.7m relating
to amortization of fair value adjustments and EUR 11.9m attributable to
exchange rate changes. Property, plant and equipment fell by EUR 20.2m,
mostly due to depreciation and exchange rate effects. Non-current assets
accounted for 70.3% of total assets as of February 28, 2018 and 70.7%
as of November 30, 2017. Current assets were EUR 708.3m, slightly down
by EUR 6.9m from the figure as of November 30, 2017.
The Gerresheimer Group’s consolidated equity, including non-controlling
interests, increased substantially from EUR 789.5m as of November 30, 2017
to EUR 823.9m as of February 28, 2018. This increase is an outcome of the
EUR 49.2m net income in the reporting period and, in the opposite direction,
foreign currency movements, which had a negative impact on equity. The
equity ratio went up from 32.3% as of November 30, 2017 to 34.5% as
of February 28, 2018.
Non-current liabilities were EUR 928.1m at the end of February 2018,
marking a substantial EUR 53.1m decrease on the EUR 981.2m figure at
the end of November 2017. The most significant effect here relates from the
remeasurement of deferred tax liabilities due to the US tax reform signed
in late December 2017.
Current liabilities went down by EUR 36.9m to EUR 636.5m. This change
mainly relates to the significant reduction in trade payables.
INTERIM GROUP MANAGEMENT REP ORT 11
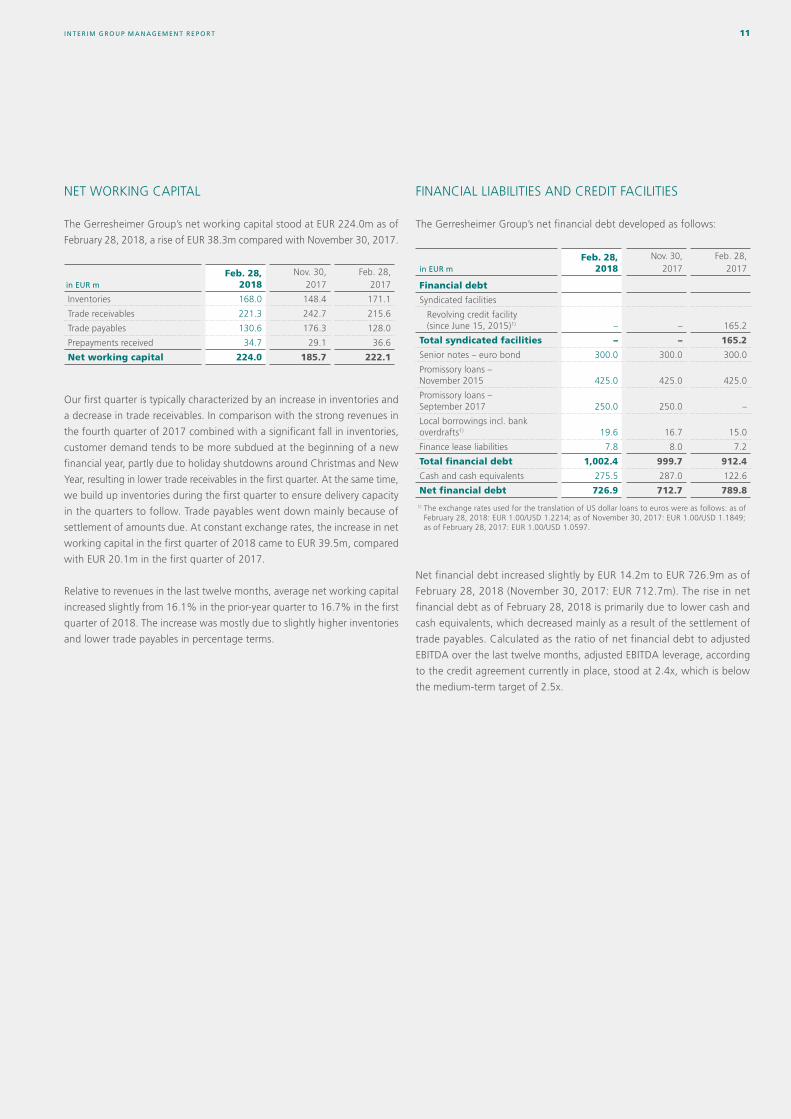
NET WORKING CAPITAL
The Gerresheimer Group’s net working capital stood at EUR 224.0m as of
February 28, 2018, a rise of EUR 38.3m compared with November 30, 2017.
in EUR mFeb. 28,
2018Nov. 30,
2017Feb. 28,
2017
Inventories 168.0 148.4 171.1
Trade receivables 221.3 242.7 215.6
Trade payables 130.6 176.3 128.0
Prepayments received 34.7 29.1 36.6
Net working capital 224.0 185.7 222.1
Our first quarter is typically characterized by an increase in inventories and
a decrease in trade receivables. In comparison with the strong revenues in
the fourth quarter of 2017 combined with a significant fall in inventories,
customer demand tends to be more subdued at the beginning of a new
financial year, partly due to holiday shutdowns around Christmas and New
Year, resulting in lower trade receivables in the first quarter. At the same time,
we build up inventories during the first quarter to ensure delivery capacity
in the quarters to follow. Trade payables went down mainly because of
settlement of amounts due. At constant exchange rates, the increase in net
working capital in the first quarter of 2018 came to EUR 39.5m, compared
with EUR 20.1m in the first quarter of 2017.
Relative to revenues in the last twelve months, average net working capital
increased slightly from 16.1% in the prior-year quarter to 16.7% in the first
quarter of 2018. The increase was mostly due to slightly higher inventories
and lower trade payables in percentage terms.
FINANCIAL LIABILITIES AND CREDIT FACILITIES
The Gerresheimer Group’s net financial debt developed as follows:
in EUR mFeb. 28,
2018Nov. 30,
2017Feb. 28,
2017
Financial debt
Syndicated facilities
Revolving credit facility (since June 15, 2015)1) – – 165.2
Total syndicated facilities – – 165.2
Senior notes – euro bond 300.0 300.0 300.0
Promissory loans –November 2015 425.0 425.0 425.0
Promissory loans –September 2017 250.0 250.0 –
Local borrowings incl. bank overdrafts1) 19.6 16.7 15.0
Finance lease liabilities 7.8 8.0 7.2
Total financial debt 1,002.4 999.7 912.4
Cash and cash equivalents 275.5 287.0 122.6
Net financial debt 726.9 712.7 789.8
1) The exchange rates used for the translation of US dollar loans to euros were as follows: as of February 28, 2018: EUR 1.00/USD 1.2214; as of November 30, 2017: EUR 1.00/USD 1.1849; as of February 28, 2017: EUR 1.00/USD 1.0597.
Net financial debt increased slightly by EUR 14.2m to EUR 726.9m as of
February 28, 2018 (November 30, 2017: EUR 712.7m). The rise in net
financial debt as of February 28, 2018 is primarily due to lower cash and
cash equivalents, which decreased mainly as a result of the settlement of
trade payables. Calculated as the ratio of net financial debt to adjusted
EBITDA over the last twelve months, adjusted EBITDA leverage, according
to the credit agreement currently in place, stood at 2.4x, which is below
the medium-term target of 2.5x.
INTERIM GROUP MANAGEMENT REP ORT12 Gerresheimer AG INTERIM REP ORT DECEMBER 2017 – FEBRUARY 2018
Drawings on the revolving credit facility (facility amount of EUR 450.0m) were
EUR 0.0m as of February 28, 2018 and thus showed no change relative to
November 30, 2017. Consequently, the entire EUR 450.0m facility amount
under the revolving credit facility was available to us as of February 28, 2018
for capital expenditure, acquisitions and other operational requirements.
Making use of the favorable market environment, the bond that matures
in May 2018 was refinanced ahead of schedule on September 27, 2017 by
means of EUR 250.0m promissory loans.
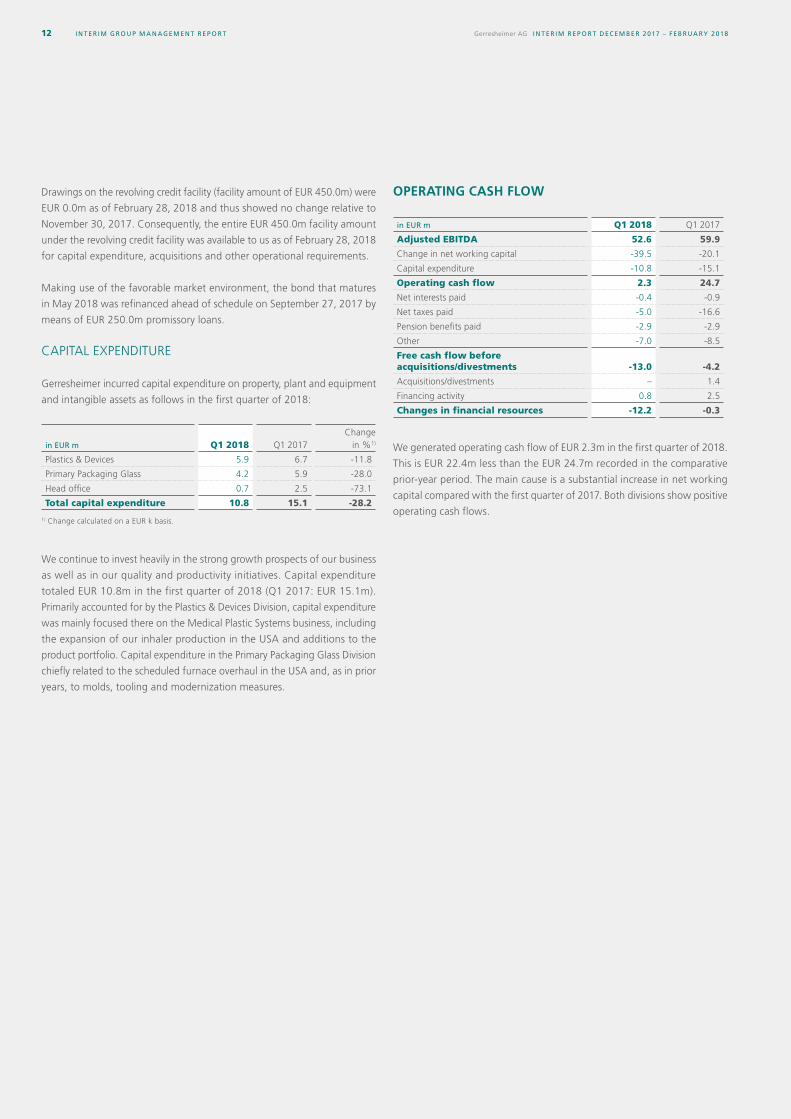
CAPITAL EXPENDITURE
Gerresheimer incurred capital expenditure on property, plant and equipment
and intangible assets as follows in the first quarter of 2018:
in EUR m Q1 2018 Q1 2017Change
in %1)
Plastics & Devices 5.9 6.7 -11.8
Primary Packaging Glass 4.2 5.9 -28.0
Head office 0.7 2.5 -73.1
Total capital expenditure 10.8 15.1 -28.2 1) Change calculated on a EUR k basis.
We continue to invest heavily in the strong growth prospects of our business
as well as in our quality and productivity initiatives. Capital expenditure
totaled EUR 10.8m in the first quarter of 2018 (Q1 2017: EUR 15.1m).
Primarily accounted for by the Plastics & Devices Division, capital expenditure
was mainly focused there on the Medical Plastic Systems business, including
the expansion of our inhaler production in the USA and additions to the
product portfolio. Capital expenditure in the Primary Packaging Glass Division
chiefly related to the scheduled furnace overhaul in the USA and, as in prior
years, to molds, tooling and modernization measures.
OPERATING CASH FLOW
in EUR m Q1 2018 Q1 2017
Adjusted EBITDA 52.6 59.9
Change in net working capital -39.5 -20.1
Capital expenditure -10.8 -15.1
Operating cash flow 2.3 24.7
Net interests paid -0.4 -0.9
Net taxes paid -5.0 -16.6
Pension benefits paid -2.9 -2.9
Other -7.0 -8.5
Free cash flow before acquisitions/divestments -13.0 -4.2
Acquisitions/divestments – 1.4
Financing activity 0.8 2.5
Changes in financial resources -12.2 -0.3
We generated operating cash flow of EUR 2.3m in the first quarter of 2018.
This is EUR 22.4m less than the EUR 24.7m recorded in the comparative
prior-year period. The main cause is a substantial increase in net working
capital compared with the first quarter of 2017. Both divisions show positive
operating cash flows.
INTERIM GROUP MANAGEMENT REP ORT 13
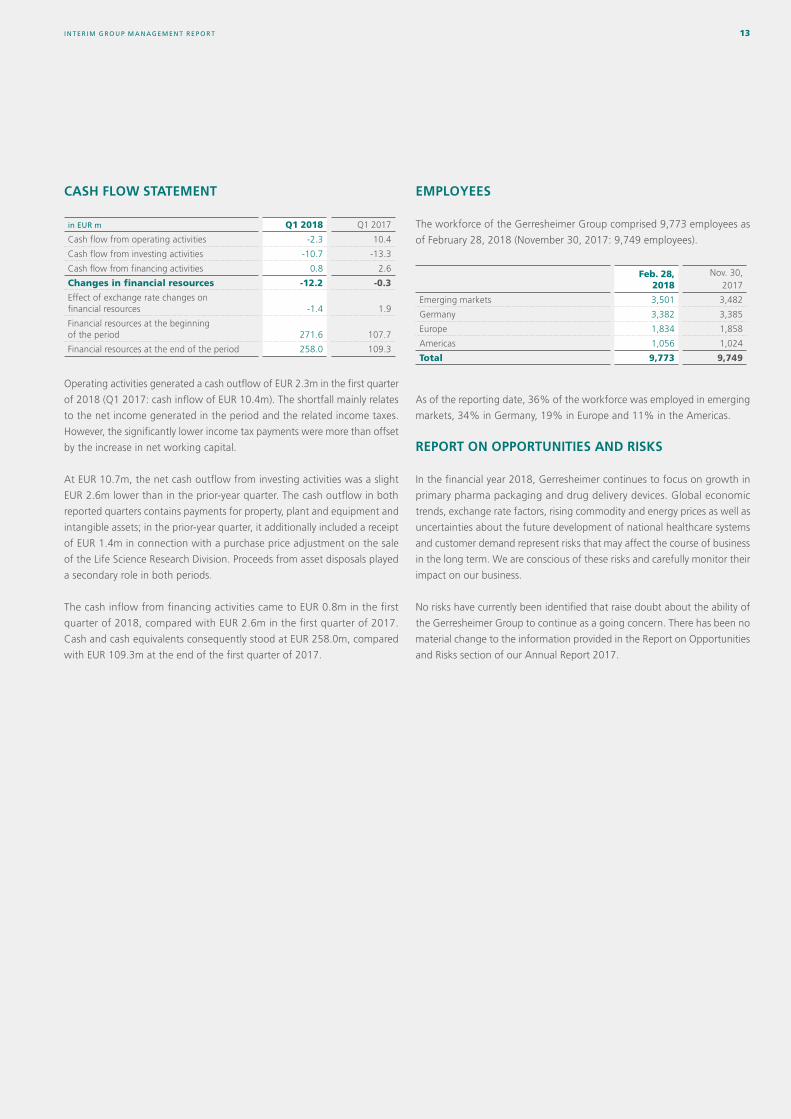
CASH FLOW STATEMENT
in EUR m Q1 2018 Q1 2017
Cash flow from operating activities -2.3 10.4
Cash flow from investing activities -10.7 -13.3
Cash flow from financing activities 0.8 2.6
Changes in financial resources -12.2 -0.3
Effect of exchange rate changes on financial resources -1.4 1.9
Financial resources at the beginning of the period 271.6 107.7
Financial resources at the end of the period 258.0 109.3
Operating activities generated a cash outflow of EUR 2.3m in the first quarter
of 2018 (Q1 2017: cash inflow of EUR 10.4m). The shortfall mainly relates
to the net income generated in the period and the related income taxes.
However, the significantly lower income tax payments were more than offset
by the increase in net working capital.
At EUR 10.7m, the net cash outflow from investing activities was a slight
EUR 2.6m lower than in the prior-year quarter. The cash outflow in both
reported quarters contains payments for property, plant and equipment and
intangible assets; in the prior-year quarter, it additionally included a receipt
of EUR 1.4m in connection with a purchase price adjustment on the sale
of the Life Science Research Division. Proceeds from asset disposals played
a secondary role in both periods.
The cash inflow from financing activities came to EUR 0.8m in the first
quarter of 2018, compared with EUR 2.6m in the first quarter of 2017.
Cash and cash equivalents consequently stood at EUR 258.0m, compared
with EUR 109.3m at the end of the first quarter of 2017.
EMPLOYEES
The workforce of the Gerresheimer Group comprised 9,773 employees as
of February 28, 2018 (November 30, 2017: 9,749 employees).
Feb. 28, 2018
Nov. 30, 2017
Emerging markets 3,501 3,482
Germany 3,382 3,385
Europe 1,834 1,858
Americas 1,056 1,024
Total 9,773 9,749
As of the reporting date, 36% of the workforce was employed in emerging
markets, 34% in Germany, 19% in Europe and 11% in the Americas.
REPORT ON OPPORTUNITIES AND RISKS
In the financial year 2018, Gerresheimer continues to focus on growth in
primary pharma packaging and drug delivery devices. Global economic
trends, exchange rate factors, rising commodity and energy prices as well as
uncertainties about the future development of national healthcare systems
and customer demand represent risks that may affect the course of business
in the long term. We are conscious of these risks and carefully monitor their
impact on our business.
No risks have currently been identified that raise doubt about the ability of
the Gerresheimer Group to continue as a going concern. There has been no
material change to the information provided in the Report on Opportunities
and Risks section of our Annual Report 2017.
INTERIM GROUP MANAGEMENT REP ORT14 Gerresheimer AG INTERIM REP ORT DECEMBER 2017 – FEBRUARY 2018
OUTLOOK
The forward-looking statements on the business performance of the
Gerresheimer Group presented in the following and the assumptions deemed
significant regarding the economic development of the market and industry
are based on our own assessments, which we currently believe realistic
according to the information we have available. However, such assessments
entail uncertainty and the inevitable risk that projected developments may
not correlate in direction or extent with actual developments.
DEVELOPMENT OF THE ECONOMIC ENVIRONMENT
Global and regional economic development
The assessment of the economic conditions has not materially changed
compared with our disclosures in our Annual Report. We therefore refer to
the Outlook section in our Annual Report 2017.
MARKET AND BUSINESS OPPORTUNITIES FOR THE GERRESHEIMER GROUP
Prospects for the financial year 2018
Assessments of the prospects for the financial year 2018 have not funda-
mentally changed compared with the information provided in our Annual
Report. We therefore refer to the Outlook section in our Annual Report 2017.
Overall Group
The Gerresheimer Group pursues a successful, clear-cut strategy geared to
sustained and profitable growth. Our expectations for the financial year 2018,
in each case assuming constant exchange rates and excluding acquisitions
and divestments, remain as follows: For the US dollar—which is expected
to have the largest currency impact on our Group currency, accounting
for about a third of Group revenues in 2018 or about 40% of adjusted
EBITDA—we have assumed an exchange rate of approximately USD 1.12
to EUR 1.00. As before, a rise or fall in the US dollar against the euro by
about one cent has an impact of around EUR 4m on revenues and EUR 1m
on adjusted EBITDA.
In terms of revenues, the figure attained in the financial year 2017 represents
the lower limit of our expectation for the financial year 2018. At the upper
end, we expect Group revenues at constant exchange rates of up to around
EUR 1.4bn. For adjusted EBITDA at constant exchange rates, we project a
range of EUR 305m to 315m for the financial year 2018, compared with
adjusted EBITDA of EUR 307.2m5) in the financial year 2017. Additional
positive effects below the level of adjusted EBITDA follow, firstly, from
redemption of the EUR 300.0m bond issue in May 2018 using the refinancing
already completed with EUR 250.0m promissory loans. We expect that this
alone will, at constant exchange rates, lead to an approximately EUR 5.5m
improvement in net finance expense compared with the financial year 2017.
Secondly, as a company that largely serves the US market from US-based
production, we also gain an one-off positive effect from the US tax reform
in the amount of approximately USD 52.9m as a result of remeasurement of
deferred taxes accounted for in the now completed first quarter of 2018. Had
the impact of the US tax reform already applied in the financial year 2017,
there would have been a positive effect in the low single-digit millions of
euros on current income taxes and our net income for 2017.
Largely due to our favorable growth prospects, and driven by our initiatives to
boost productivity and quality, capital expenditure in the financial year 2018
is expected to amount to around 8% of revenues at constant exchange rates.
Our net working capital profile has improved significantly in recent years.
We continue to anticipate net working capital as a percentage of revenues
to be around 16% as of the financial year-end 2018. Depending on our
revenue performance, average net working capital can also slightly exceed
16% in the course of the year, as it may be necessary to produce in advance
for some customers in order to meet any higher demand in the second half
of 2018 or also for the financial year 2019.
Our long-term targets are as follows:
› Our Gx ROCE guidance is to be around 15% (previously at least 12%),
not least with a view to the many new products and services, as well as
in consideration of further optimization measures as part of the usual
productivity improvements at our plants, which we are currently putting
in place and refining with our customers and cooperation partners.
› We continue to believe a net financial debt to adjusted EBITDA ratio of
2.5x to be right for Gerresheimer, with temporary variation above or below
this tolerated because M&A activity cannot be planned in exact detail.
› That leaves us with substantial leeway, especially for acquisitions, before
reaching a ratio of 3.5 times net financial debt to adjusted EBITDA. We
have attained this notably by means of rigorous cash flow management
coupled with productivity improvements, without having to adjust our
financing structures. This means we should at all times be in a position
to leverage opportunities on the markets relevant to us primarily by using
external financing.
5) Excluding the effect from fair value measurement of the Triveni put option.
15
16 CONSOLIDATED INCOME STATEMENT
17 CONSOLIDATED STATEMENT OF COMPREHENSIVE INCOME
18 CONSOLIDATED BALANCE SHEET
19 CONSOLIDATED STATEMENT OF CHANGES IN EQUITY
20 CONSOLIDATED CASH FLOW STATEMENT
21 NOTES TO THE INTERIM CONSOLIDATED FINANCIAL STATEMENTS 21 (1) General 21 (2) Consolidated Cash Flow Statement 21 (3) Seasonal Effects on Business Activity
22 Notes to the Condensed Interim Consolidated Financial Statements 22 (4) Other Operating Income 22 (5) Other Operating Expenses 22 (6) Income Taxes 22 (7) Distributions to Third Parties 22 (8) Inventories 22 (9) Financial Liabilities 22 (10) Reporting on Financial Instruments 25 (11) Other Financial Obligations 25 (12) Segment Reporting
27 Other Notes 27 (13) Related Party Disclosures 27 (14) Events after the Balance Sheet Date
INTERIM CONSOLIDATED FINANCIAL STATEMENTS DECEMBER 2017 – FEBRUARY 2018
INTERIM CONSOL IDATED F INANCI AL S TATEMENT S16 Gerresheimer AG INTERIM REP ORT DECEMBER 2017 – FEBRUARY 2018
CONSOLIDATED INCOME STATEMENT
for the Period from December 1, 2017 to February 28, 2018
in EUR k Notes Q1 2018 Q1 2017
Revenues 290,366 302,813
Cost of sales -209,250 -214,370
Gross profit 81,116 88,443
Selling and administrative expenses -62,070 -62,373
Other operating income (4) 4,940 3,940
Restructuring expenses -63 -9
Other operating expenses (5) -6,612 -1,765
Results of operations 17,311 28,236
Interest income 551 758
Interest expense -8,598 -8,007
Other financial expenses -1,359 -1,264
Net finance expense -9,406 -8,513
Net income before income taxes 7,905 19,723
Income taxes (6) 41,307 -6,437
Net income 49,212 13,286
Attributable to equity holders of the parent 48,658 12,920
Attributable to non-controlling interests 554 366
Diluted and non-diluted earnings per share (in EUR) 1.55 0.41
Notes (1) to (14) are an integral part of these interim consolidated financial statements.
INTERIM CONSOL IDATED F INANCI AL S TATEMENT S 17
CONSOLIDATED STATEMENT OF COMPREHENSIVE INCOME
for the Period from December 1, 2017 to February 28, 2018
in EUR k Q1 2018 Q1 2017
Net income 49,212 13,286
Income taxes from the revaluation of defined benefit plans -571) –
Other comprehensive income that will not be reclassified subsequently to profit or loss -57 –
Changes in the fair value of available for sale financial assets -1 –
Other comprehensive income from financial instruments -1 –
Currency translation -14,760 13,312
Other comprehensive income from currency translation -14,760 13,312
Other comprehensive income that will be reclassified to profit or loss when specific conditions are met -14,761 13,312
Other comprehensive income -14,818 13,312
Total comprehensive income 34,394 26,598
Attributable to equity holders of the parent 34,148 24,877
Attributable to non-controlling interests 246 1,721
1) Effect of the revaluation of deferred tax assets on provisions for pensions and similar obligations under the US tax reform signed on December 22, 2017.
Notes (1) to (14) are an integral part of these interim consolidated financial statements.
INTERIM CONSOL IDATED F INANCI AL S TATEMENT S18 Gerresheimer AG INTERIM REP ORT DECEMBER 2017 – FEBRUARY 2018
CONSOLIDATED BALANCE SHEET
as of February 28, 2018
ASSETS
in EUR k Notes Feb. 28, 2018 Nov. 30, 2017 Feb. 28, 2017
Non-current assets
Intangible assets 1,074,138 1,101,229 1,194,941
Property, plant and equipment 582,345 602,577 606,164
Investment property 5,565 5,732 5,732
Investments accounted for using the equity method 252 252 184
Income tax receivables 1,647 1,394 1,293
Other financial assets 5,077 5,077 5,276
Other receivables 1,660 1,594 1,438
Deferred tax assets 9,550 11,030 13,803
1,680,234 1,728,885 1,828,831
Current assets
Inventories (8) 168,014 148,362 171,135
Trade receivables 221,275 242,684 215,604
Income tax receivables 4,220 2,522 1,987
Other financial assets 17,779 17,020 8,859
Other receivables 21,465 17,588 24,666
Cash and cash equivalents 275,495 287,036 122,624
708,248 715,212 544,875
Total assets 2,388,482 2,444,097 2,373,706
EQUITY AND LIABILITIES
in EUR k Notes Feb. 28, 2018 Nov. 30, 2017 Feb. 28, 2017
Equity
Subscribed capital 31,400 31,400 31,400
Capital reserve 513,827 513,827 513,827
IAS 39 reserve -6 -5 -41
Currency translation reserve -85,473 -71,021 -14,485
Retained earnings 327,463 278,862 220,333
Equity attributable to equity holders of the parent 787,211 753,063 751,034
Non-controlling interests 36,708 36,462 38,859
823,919 789,525 789,893
Non-current liabilities
Deferred tax liabilities 95,186 143,539 157,980
Provisions for pensions and similar obligations 140,293 145,104 158,772
Other provisions 10,516 10,190 8,846
Other financial liabilities (9) + (10) 681,051 681,304 745,510
Other liabilities 1,039 1,092 203
928,085 981,229 1,071,311
Current liabilities
Provisions for pensions and similar obligations 13,437 13,580 13,348
Other provisions 31,781 35,214 52,576
Trade payables 130,607 176,303 127,962
Other financial liabilities (9) + (10) 347,474 337,667 194,828
Income tax liabilities 7,246 9,387 11,336
Other liabilities 105,933 101,192 112,452
636,478 673,343 512,502
1,564,563 1,654,572 1,583,813
Total equity and liabilities 2,388,482 2,444,097 2,373,706
Notes (1) to (14) are an integral part of these interim consolidated financial statements.
INTERIM CONSOL IDATED F INANCI AL S TATEMENT S 19
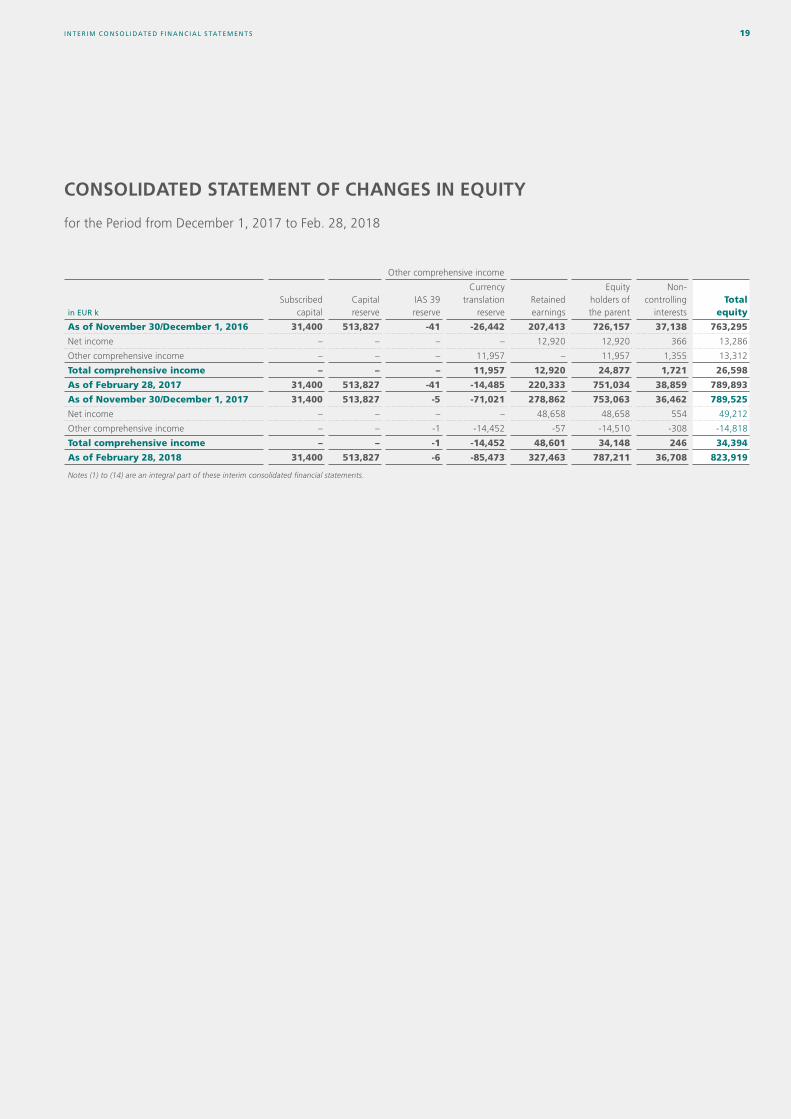
CONSOLIDATED STATEMENT OF CHANGES IN EQUITY
for the Period from December 1, 2017 to Feb. 28, 2018
Other comprehensive income
in EUR k
Subscribed capital
Capital reserve
IAS 39 reserve
Currency translation
reserve Retained earnings
Equity holders of the parent
Non-controlling
interests Total
equity
As of November 30/December 1, 2016 31,400 513,827 -41 -26,442 207,413 726,157 37,138 763,295
Net income – – – – 12,920 12,920 366 13,286
Other comprehensive income – – – 11,957 – 11,957 1,355 13,312
Total comprehensive income – – – 11,957 12,920 24,877 1,721 26,598
As of February 28, 2017 31,400 513,827 -41 -14,485 220,333 751,034 38,859 789,893
As of November 30/December 1, 2017 31,400 513,827 -5 -71,021 278,862 753,063 36,462 789,525
Net income – – – – 48,658 48,658 554 49,212
Other comprehensive income – – -1 -14,452 -57 -14,510 -308 -14,818
Total comprehensive income – – -1 -14,452 48,601 34,148 246 34,394
As of February 28, 2018 31,400 513,827 -6 -85,473 327,463 787,211 36,708 823,919
Notes (1) to (14) are an integral part of these interim consolidated financial statements.
INTERIM CONSOL IDATED F INANCI AL S TATEMENT S20 Gerresheimer AG INTERIM REP ORT DECEMBER 2017 – FEBRUARY 2018
CONSOLIDATED CASH FLOW STATEMENT
for the Period from December 1, 2017 to February 28, 2018
in EUR k Notes Q1 2018 Q1 2017
Net income 49,212 13,286
Income taxes (6) -41,307 6,437
Amortization/impairment losses of intangible assets 8,475 9,383
Depreciation/impairment losses of property, plant and equipment 22,463 22,132
Change in other provisions -2,604 -318
Change in provisions for pensions and similar obligations -4,877 -2,054
Gain (-)/Loss (+) on the disposal of non-current assets/liabilities 45 -21
Net finance expense 9,406 8,513
Interests paid -714 -1,355
Interests received 269 459
Income taxes paid -7,212 -18,678
Income taxes received 2,243 2,119
Change in inventories -20,868 -14,502
Change in trade receivables and other assets 13,217 13,405
Change in trade payables and other liabilities -39,710 -27,123
Other non-cash expenses/income 9,640 -1,255
Cash flow from operating activities -2,322 10,428
Cash received from disposals of non-current assets 170 416
Cash paid for capital expenditure
in intangible assets -1,659 -3,110
in property, plant and equipment -9,175 -11,979
Cash received in connection with divestments, net of cash paid (2) – 1,356
Cash flow from investing activities -10,664 -13,317
Distributions from third parties – 78
Raising of loans 6,323 16,699
Repayment of loans -5,386 -14,075
Cash paid for finance lease -167 -161
Cash flow from financing activities 770 2,541
Changes in financial resources -12,216 -348
Effect of exchange rate changes on financial resources -1,356 1,906
Financial resources at the beginning of the period 271,596 107,742
Financial resources at the end of the period 258,024 109,300
Components of the financial resources
Cash and cash equivalents 275,495 122,624
Bank overdrafts -17,471 -13,324
Financial resources at the end of the period 258,024 109,300
Notes (1) to (14) are an integral part of these interim consolidated financial statements.
INTERIM CONSOL IDATED F INANCI AL S TATEMENT S 21
NOTES TO THE INTERIM CONSOLIDATED FINANCIAL STATEMENTS
of Gerresheimer AG for the Period from December 1, 2017 to February 28, 2018
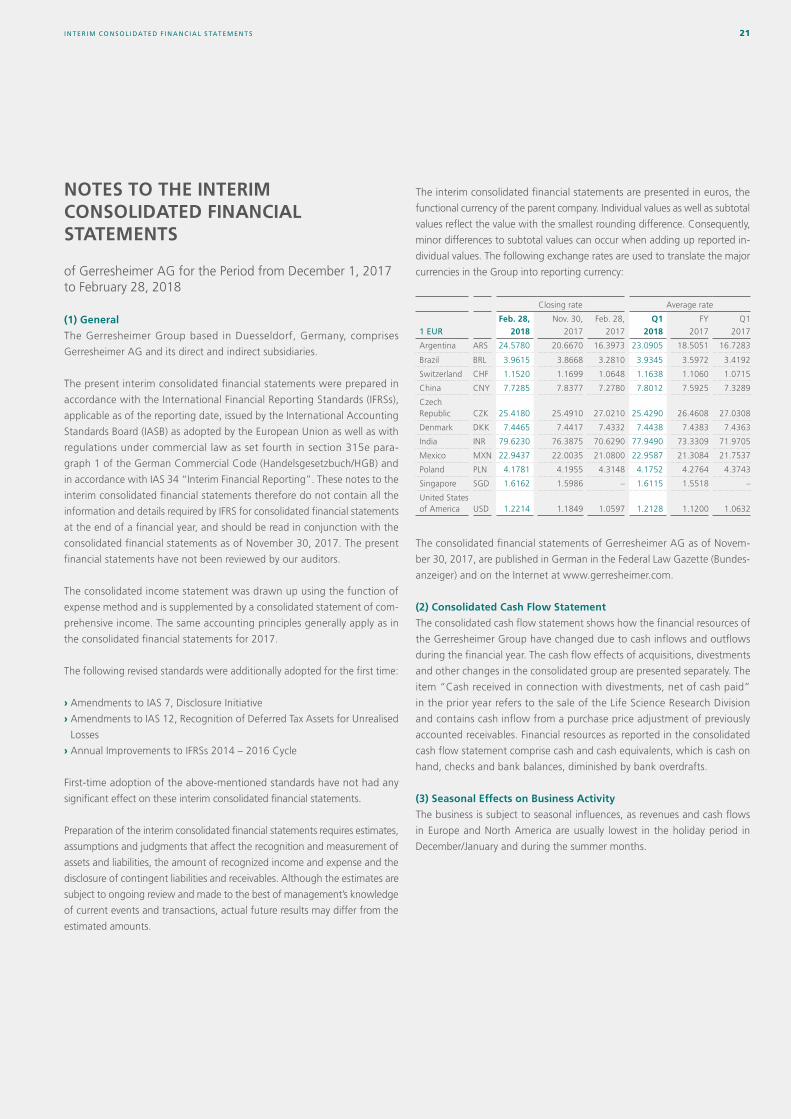
(1) General
The Gerresheimer Group based in Duesseldorf, Germany, comprises
Gerresheimer AG and its direct and indirect subsidiaries.
The present interim consolidated financial statements were prepared in
accordance with the International Financial Reporting Standards (IFRSs),
applicable as of the reporting date, issued by the International Accounting
Standards Board (IASB) as adopted by the European Union as well as with
regulations under commercial law as set fourth in section 315e para-
graph 1 of the German Commercial Code (Handelsgesetzbuch/HGB) and
in accordance with IAS 34 “Interim Financial Reporting”. These notes to the
interim consolidated financial statements therefore do not contain all the
information and details required by IFRS for consolidated financial statements
at the end of a financial year, and should be read in conjunction with the
consolidated financial statements as of November 30, 2017. The present
financial statements have not been reviewed by our auditors.
The consolidated income statement was drawn up using the function of
expense method and is supplemented by a consolidated statement of com-
prehensive income. The same accounting principles generally apply as in
the consolidated financial statements for 2017.
The following revised standards were additionally adopted for the first time:
› Amendments to IAS 7, Disclosure Initiative
› Amendments to IAS 12, Recognition of Deferred Tax Assets for Unrealised
Losses
› Annual Improvements to IFRSs 2014 – 2016 Cycle
First-time adoption of the above-mentioned standards have not had any
significant effect on these interim consolidated financial statements.
Preparation of the interim consolidated financial statements requires estimates,
assumptions and judgments that affect the recognition and measurement of
assets and liabilities, the amount of recognized income and expense and the
disclosure of contingent liabilities and receivables. Although the estimates are
subject to ongoing review and made to the best of management’s knowledge
of current events and transactions, actual future results may differ from the
estimated amounts.
The interim consolidated financial statements are presented in euros, the
functional currency of the parent company. Individual values as well as subtotal
values reflect the value with the smallest rounding difference. Consequently,
minor differences to subtotal values can occur when adding up reported in-
dividual values. The following exchange rates are used to translate the major
currencies in the Group into reporting currency:
Closing rate Average rate
1 EURFeb. 28,
2018Nov. 30,
2017
Feb. 28,
2017
Q1 2018
FY
2017
Q1
2017
Argentina ARS 24.5780 20.6670 16.3973 23.0905 18.5051 16.7283
Brazil BRL 3.9615 3.8668 3.2810 3.9345 3.5972 3.4192
Switzerland CHF 1.1520 1.1699 1.0648 1.1638 1.1060 1.0715
China CNY 7.7285 7.8377 7.2780 7.8012 7.5925 7.3289
Czech Republic CZK 25.4180 25.4910 27.0210 25.4290 26.4608 27.0308
Denmark DKK 7.4465 7.4417 7.4332 7.4438 7.4383 7.4363
India INR 79.6230 76.3875 70.6290 77.9490 73.3309 71.9705
Mexico MXN 22.9437 22.0035 21.0800 22.9587 21.3084 21.7537
Poland PLN 4.1781 4.1955 4.3148 4.1752 4.2764 4.3743
Singapore SGD 1.6162 1.5986 – 1.6115 1.5518 –
United States of America USD 1.2214 1.1849 1.0597 1.2128 1.1200 1.0632
The consolidated financial statements of Gerresheimer AG as of Novem-
ber 30, 2017, are published in German in the Federal Law Gazette (Bundes-
anzeiger) and on the Internet at www.gerresheimer.com.
(2) Consolidated Cash Flow Statement
The consolidated cash flow statement shows how the financial resources of
the Gerresheimer Group have changed due to cash inflows and outflows
during the financial year. The cash flow effects of acquisitions, divestments
and other changes in the consolidated group are presented separately. The
item “Cash received in connection with divestments, net of cash paid”
in the prior year refers to the sale of the Life Science Research Division
and contains cash inflow from a purchase price adjustment of previously
accounted receivables. Financial resources as reported in the consolidated
cash flow statement comprise cash and cash equivalents, which is cash on
hand, checks and bank balances, diminished by bank overdrafts.
(3) Seasonal Effects on Business Activity
The business is subject to seasonal influences, as revenues and cash flows
in Europe and North America are usually lowest in the holiday period in
December/January and during the summer months.
INTERIM CONSOL IDATED F INANCI AL S TATEMENT S22 Gerresheimer AG INTERIM REP ORT DECEMBER 2017 – FEBRUARY 2018
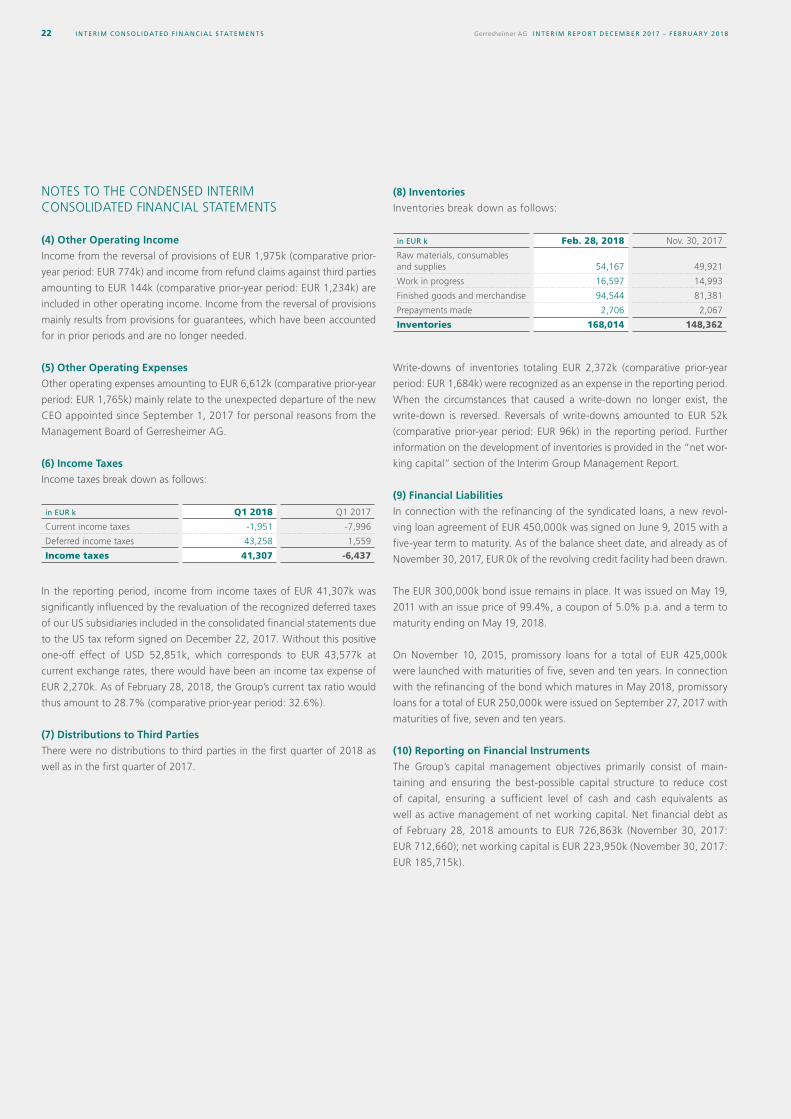
NOTES TO THE CONDENSED INTERIM CONSOLIDATED FINANCIAL STATEMENTS
(4) Other Operating Income
Income from the reversal of provisions of EUR 1,975k (comparative prior-
year period: EUR 774k) and income from refund claims against third parties
amounting to EUR 144k (comparative prior-year period: EUR 1,234k) are
included in other operating income. Income from the reversal of provisions
mainly results from provisions for guarantees, which have been accounted
for in prior periods and are no longer needed.
(5) Other Operating Expenses
Other operating expenses amounting to EUR 6,612k (comparative prior-year
period: EUR 1,765k) mainly relate to the unexpected departure of the new
CEO appointed since September 1, 2017 for personal reasons from the
Management Board of Gerresheimer AG.
(6) Income Taxes
Income taxes break down as follows:
in EUR k Q1 2018 Q1 2017
Current income taxes -1,951 -7,996
Deferred income taxes 43,258 1,559
Income taxes 41,307 -6,437
In the reporting period, income from income taxes of EUR 41,307k was
significantly influenced by the revaluation of the recognized deferred taxes
of our US subsidiaries included in the consolidated financial statements due
to the US tax reform signed on December 22, 2017. Without this positive
one-off effect of USD 52,851k, which corresponds to EUR 43,577k at
current exchange rates, there would have been an income tax expense of
EUR 2,270k. As of February 28, 2018, the Group’s current tax ratio would
thus amount to 28.7% (comparative prior-year period: 32.6%).
(7) Distributions to Third Parties
There were no distributions to third parties in the first quarter of 2018 as
well as in the first quarter of 2017.
(8) Inventories
Inventories break down as follows:
in EUR k Feb. 28, 2018 Nov. 30, 2017
Raw materials, consumables and supplies 54,167 49,921
Work in progress 16,597 14,993
Finished goods and merchandise 94,544 81,381
Prepayments made 2,706 2,067
Inventories 168,014 148,362
Write-downs of inventories totaling EUR 2,372k (comparative prior-year
period: EUR 1,684k) were recognized as an expense in the reporting period.
When the circumstances that caused a write-down no longer exist, the
write-down is reversed. Reversals of write-downs amounted to EUR 52k
(comparative prior-year period: EUR 96k) in the reporting period. Further
information on the development of inventories is provided in the “net wor-
king capital” section of the Interim Group Management Report.
(9) Financial Liabilities
In connection with the refinancing of the syndicated loans, a new revol-
ving loan agreement of EUR 450,000k was signed on June 9, 2015 with a
five-year term to maturity. As of the balance sheet date, and already as of
November 30, 2017, EUR 0k of the revolving credit facility had been drawn.
The EUR 300,000k bond issue remains in place. It was issued on May 19,
2011 with an issue price of 99.4%, a coupon of 5.0% p.a. and a term to
maturity ending on May 19, 2018.
On November 10, 2015, promissory loans for a total of EUR 425,000k
were launched with maturities of five, seven and ten years. In connection
with the refinancing of the bond which matures in May 2018, promissory
loans for a total of EUR 250,000k were issued on September 27, 2017 with
maturities of five, seven and ten years.
(10) Reporting on Financial Instruments
The Group’s capital management objectives primarily consist of main-
taining and ensuring the best-possible capital structure to reduce cost
of capital, ensuring a sufficient level of cash and cash equivalents as
well as active management of net working capital. Net financial debt as
of February 28, 2018 amounts to EUR 726,863k (November 30, 2017:
EUR 712,660); net working capital is EUR 223,950k (November 30, 2017:
EUR 185,715k).
INTERIM CONSOL IDATED F INANCI AL S TATEMENT S 23
The Gerresheimer Group’s risk management system for credit risk, liquidity
risk and individual market risks, including interest risks, currency risks and
other price risks, is described, including its objectives, policies and pro-
cesses and their measures to monitor the covenants to be complied with,
in the Opportunity and Risk Report section of the Group Management
Report of the consolidated financial statements as of November 30, 2017.
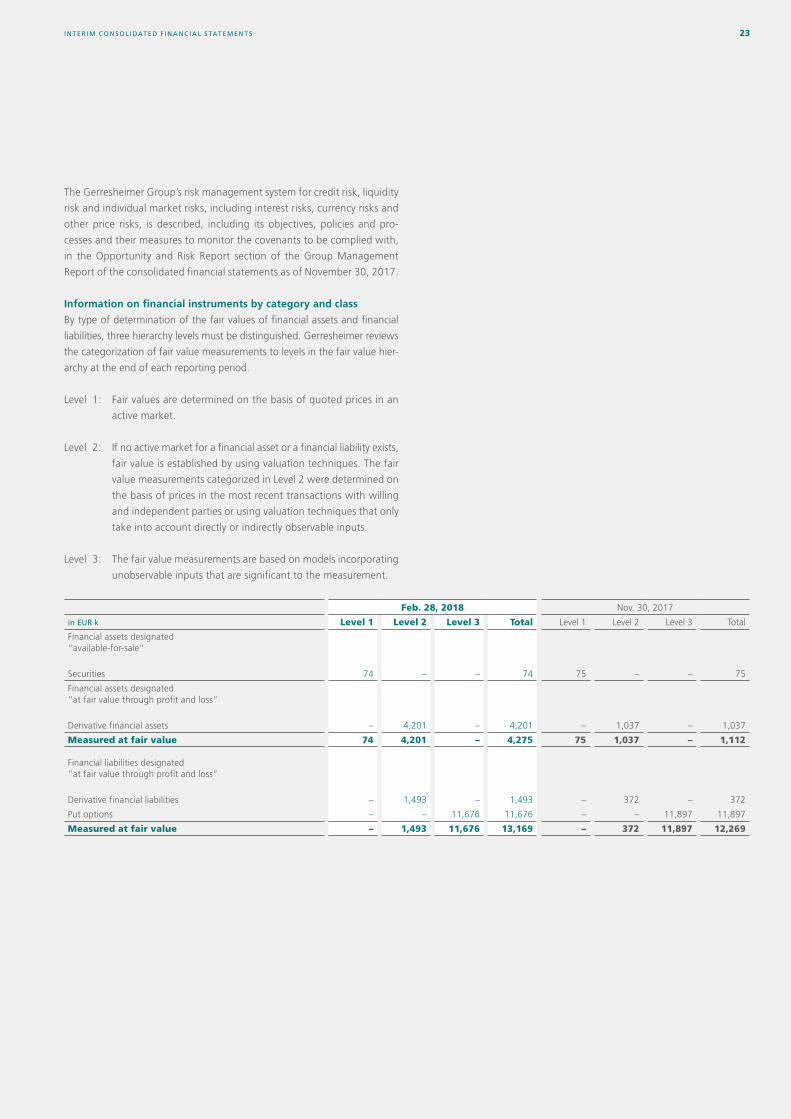
Information on financial instruments by category and class
By type of determination of the fair values of financial assets and financial
liabilities, three hierarchy levels must be distinguished. Gerresheimer reviews
the categorization of fair value measurements to levels in the fair value hier-
archy at the end of each reporting period.
Level 1: Fair values are determined on the basis of quoted prices in an
active market.
Level 2: If no active market for a financial asset or a financial liability exists,
fair value is established by using valuation techniques. The fair
value measurements categorized in Level 2 were determined on
the basis of prices in the most recent transactions with willing
and independent parties or using valuation techniques that only
take into account directly or indirectly observable inputs.
Level 3: The fair value measurements are based on models incorporating
unobservable inputs that are significant to the measurement.
Feb. 28, 2018 Nov. 30, 2017
in EUR k Level 1 Level 2 Level 3 Total Level 1 Level 2 Level 3 Total
Financial assets designated “available-for-sale”
Securities 74 – – 74 75 – – 75
Financial assets designated “at fair value through profit and loss”
Derivative financial assets – 4,201 – 4,201 – 1,037 – 1,037
Measured at fair value 74 4,201 – 4,275 75 1,037 – 1,112
Financial liabilities designated “at fair value through profit and loss”
Derivative financial liabilities – 1,493 – 1,493 – 372 – 372
Put options – – 11,676 11,676 – – 11,897 11,897
Measured at fair value – 1,493 11,676 13,169 – 372 11,897 12,269
INTERIM CONSOL IDATED F INANCI AL S TATEMENT S24 Gerresheimer AG INTERIM REP ORT DECEMBER 2017 – FEBRUARY 2018
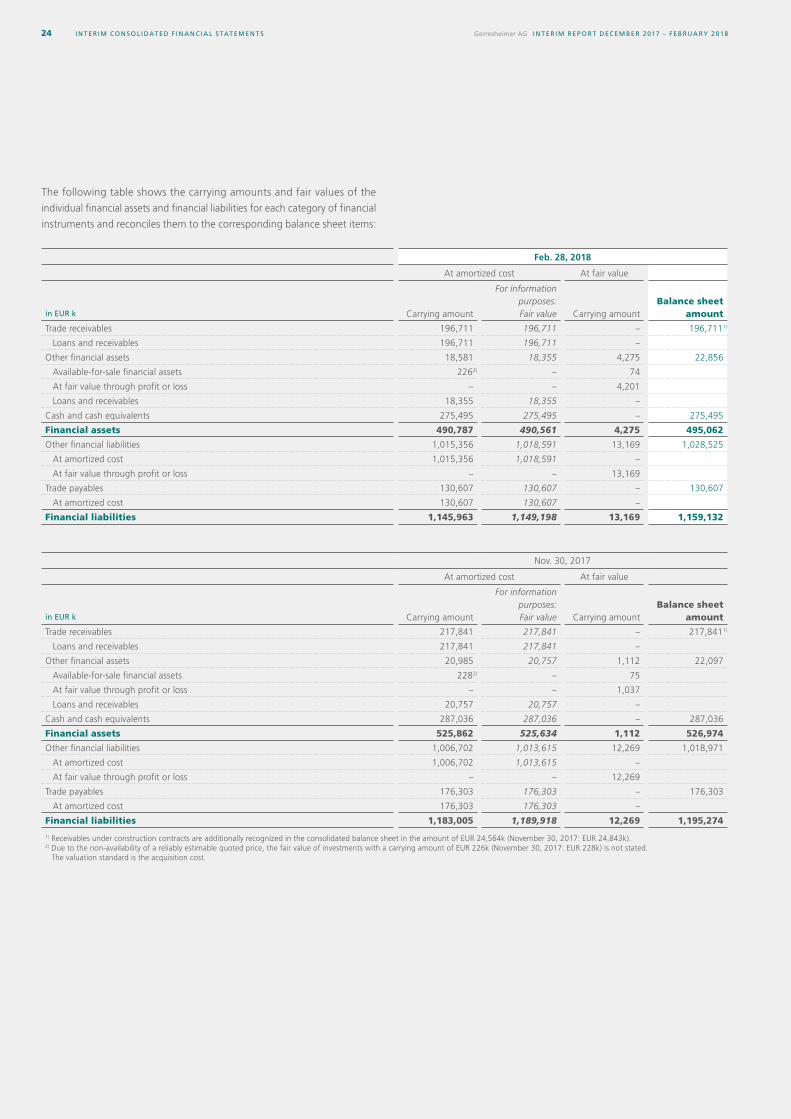
The following table shows the carrying amounts and fair values of the
individual financial assets and financial liabilities for each category of financial
instruments and reconciles them to the corresponding balance sheet items:
Feb. 28, 2018
At amortized cost At fair value
in EUR k Carrying amount
For information purposes: Fair value Carrying amount
Balance sheet amount
Trade receivables 196,711 196,711 – 196,7111)
Loans and receivables 196,711 196,711 –
Other financial assets 18,581 18,355 4,275 22,856
Available-for-sale financial assets 2262) – 74
At fair value through profit or loss – – 4,201
Loans and receivables 18,355 18,355 –
Cash and cash equivalents 275,495 275,495 – 275,495
Financial assets 490,787 490,561 4,275 495,062
Other financial liabilities 1,015,356 1,018,591 13,169 1,028,525
At amortized cost 1,015,356 1,018,591 –
At fair value through profit or loss – – 13,169
Trade payables 130,607 130,607 – 130,607
At amortized cost 130,607 130,607 –
Financial liabilities 1,145,963 1,149,198 13,169 1,159,132
Nov. 30, 2017
At amortized cost At fair value
in EUR k Carrying amount
For information purposes: Fair value Carrying amount
Balance sheet amount
Trade receivables 217,841 217,841 – 217,8411)
Loans and receivables 217,841 217,841 –
Other financial assets 20,985 20,757 1,112 22,097
Available-for-sale financial assets 2282) – 75
At fair value through profit or loss – – 1,037
Loans and receivables 20,757 20,757 –
Cash and cash equivalents 287,036 287,036 – 287,036
Financial assets 525,862 525,634 1,112 526,974
Other financial liabilities 1,006,702 1,013,615 12,269 1,018,971
At amortized cost 1,006,702 1,013,615 –
At fair value through profit or loss – – 12,269
Trade payables 176,303 176,303 – 176,303
At amortized cost 176,303 176,303 –
Financial liabilities 1,183,005 1,189,918 12,269 1,195,274
1) Receivables under construction contracts are additionally recognized in the consolidated balance sheet in the amount of EUR 24,564k (November 30, 2017: EUR 24,843k).2) Due to the non-availability of a reliably estimable quoted price, the fair value of investments with a carrying amount of EUR 226k (November 30, 2017: EUR 228k) is not stated.
The valuation standard is the acquisition cost.
INTERIM CONSOL IDATED F INANCI AL S TATEMENT S 25
Liabilities measured at amortized cost include finance lease liabilities for which
Group companies are the lessees. As of February 28, 2018, these liabilities
amount to EUR 7,776k (November 30, 2017: EUR 8,004k).
The fair values of receivables, loans and liabilities are measured at the present
value of future cash flows discounted at the current interest rate as of the
balance sheet date. The fair values are discounted at an interest rate, taking
into account the maturity of the asset or the remaining term of the liability
and the counterparty’s credit standing as of the balance sheet date.
Due to the predominantly short terms, the fair values of trade receivables,
trade payables, other financial assets, other financial liabilities as well as cash
and cash equivalents do not differ significantly from their carrying amounts.
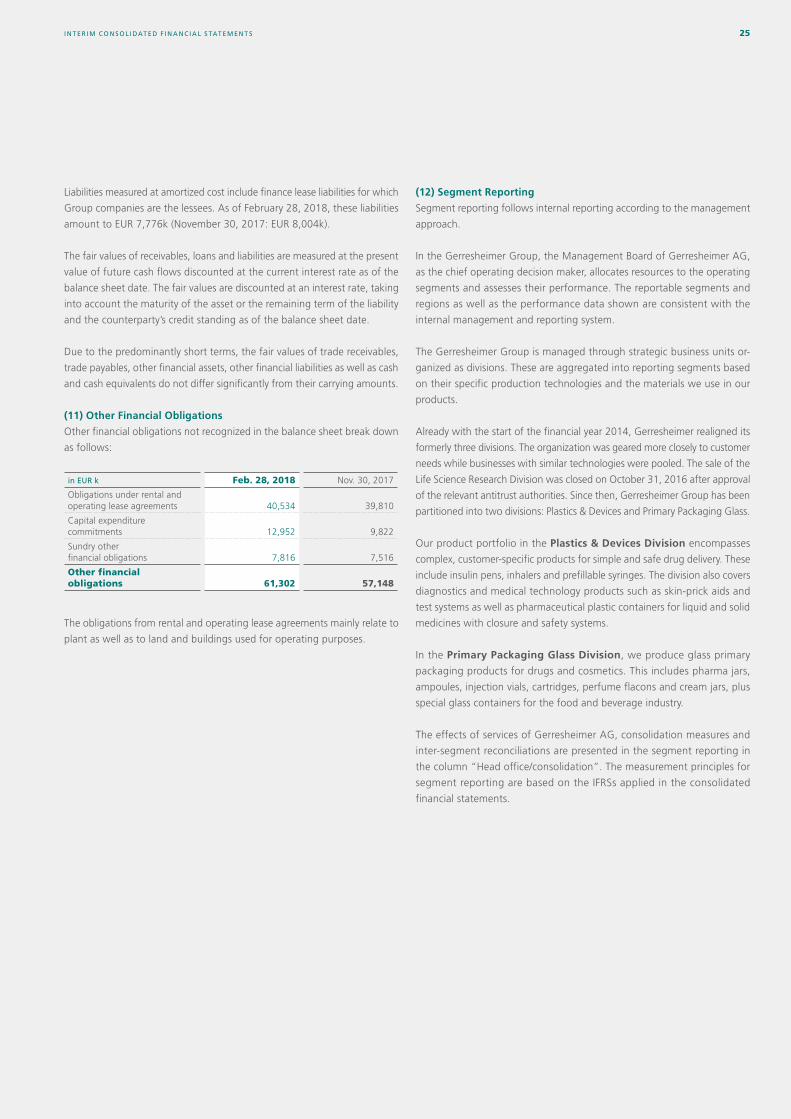
(11) Other Financial Obligations
Other financial obligations not recognized in the balance sheet break down
as follows:
in EUR k Feb. 28, 2018 Nov. 30, 2017
Obligations under rental and operating lease agreements 40,534 39,810
Capital expenditure commitments 12,952 9,822
Sundry other financial obligations 7,816 7,516
Other financial obligations 61,302 57,148
The obligations from rental and operating lease agreements mainly relate to
plant as well as to land and buildings used for operating purposes.
(12) Segment Reporting
Segment reporting follows internal reporting according to the management
approach.
In the Gerresheimer Group, the Management Board of Gerresheimer AG,
as the chief operating decision maker, allocates resources to the operating
segments and assesses their performance. The reportable segments and
regions as well as the performance data shown are consistent with the
internal management and reporting system.
The Gerresheimer Group is managed through strategic business units or-
ganized as divisions. These are aggregated into reporting segments based
on their specific production technologies and the materials we use in our
products.
Already with the start of the financial year 2014, Gerresheimer realigned its
formerly three divisions. The organization was geared more closely to customer
needs while businesses with similar technologies were pooled. The sale of the
Life Science Research Division was closed on October 31, 2016 after approval
of the relevant antitrust authorities. Since then, Gerresheimer Group has been
partitioned into two divisions: Plastics & Devices and Primary Packaging Glass.
Our product portfolio in the Plastics & Devices Division encompasses
complex, customer-specific products for simple and safe drug delivery. These
include insulin pens, inhalers and prefillable syringes. The division also covers
diagnostics and medical technology products such as skin-prick aids and
test systems as well as pharmaceutical plastic containers for liquid and solid
medicines with closure and safety systems.
In the Primary Packaging Glass Division, we produce glass primary
packaging products for drugs and cosmetics. This includes pharma jars,
ampoules, injection vials, cartridges, perfume flacons and cream jars, plus
special glass containers for the food and beverage industry.
The effects of services of Gerresheimer AG, consolidation measures and
inter-segment reconciliations are presented in the segment reporting in
the column “Head office/consolidation”. The measurement principles for
segment reporting are based on the IFRSs applied in the consolidated
financial statements.
INTERIM CONSOL IDATED F INANCI AL S TATEMENT S26 Gerresheimer AG INTERIM REP ORT DECEMBER 2017 – FEBRUARY 2018
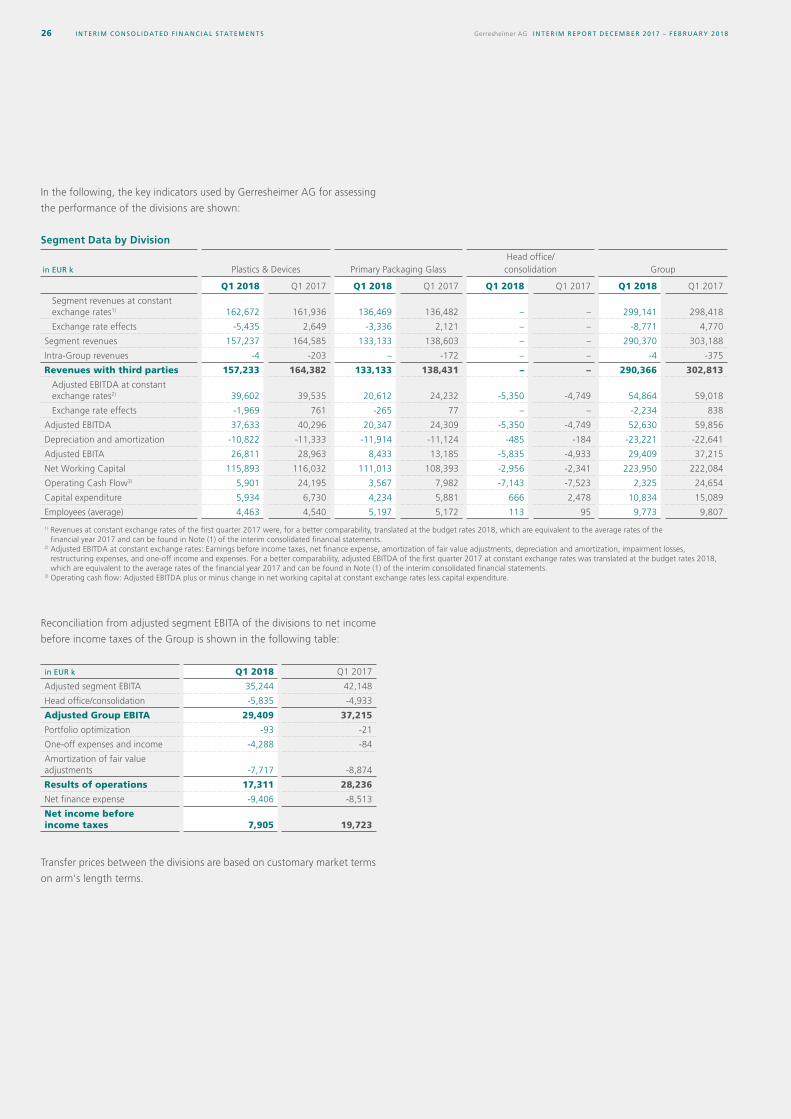
In the following, the key indicators used by Gerresheimer AG for assessing
the performance of the divisions are shown:
Segment Data by Division
in EUR k Plastics & Devices Primary Packaging GlassHead office/ consolidation Group
Q1 2018 Q1 2017 Q1 2018 Q1 2017 Q1 2018 Q1 2017 Q1 2018 Q1 2017
Segment revenues at constant exchange rates1) 162,672 161,936 136,469 136,482 – – 299,141 298,418
Exchange rate effects -5,435 2,649 -3,336 2,121 – – -8,771 4,770
Segment revenues 157,237 164,585 133,133 138,603 – – 290,370 303,188
Intra-Group revenues -4 -203 – -172 – – -4 -375
Revenues with third parties 157,233 164,382 133,133 138,431 – – 290,366 302,813
Adjusted EBITDA at constant exchange rates2) 39,602 39,535 20,612 24,232 -5,350 -4,749 54,864 59,018
Exchange rate effects -1,969 761 -265 77 – – -2,234 838
Adjusted EBITDA 37,633 40,296 20,347 24,309 -5,350 -4,749 52,630 59,856
Depreciation and amortization -10,822 -11,333 -11,914 -11,124 -485 -184 -23,221 -22,641
Adjusted EBITA 26,811 28,963 8,433 13,185 -5,835 -4,933 29,409 37,215
Net Working Capital 115,893 116,032 111,013 108,393 -2,956 -2,341 223,950 222,084
Operating Cash Flow3) 5,901 24,195 3,567 7,982 -7,143 -7,523 2,325 24,654
Capital expenditure 5,934 6,730 4,234 5,881 666 2,478 10,834 15,089
Employees (average) 4,463 4,540 5,197 5,172 113 95 9,773 9,807
1) Revenues at constant exchange rates of the first quarter 2017 were, for a better comparability, translated at the budget rates 2018, which are equivalent to the average rates of the financial year 2017 and can be found in Note (1) of the interim consolidated financial statements.
2) Adjusted EBITDA at constant exchange rates: Earnings before income taxes, net finance expense, amortization of fair value adjustments, depreciation and amortization, impairment losses, restructuring expenses, and one-off income and expenses. For a better comparability, adjusted EBITDA of the first quarter 2017 at constant exchange rates was translated at the budget rates 2018, which are equivalent to the average rates of the financial year 2017 and can be found in Note (1) of the interim consolidated financial statements.
3) Operating cash flow: Adjusted EBITDA plus or minus change in net working capital at constant exchange rates less capital expenditure.
Reconciliation from adjusted segment EBITA of the divisions to net income
before income taxes of the Group is shown in the following table:
in EUR k Q1 2018 Q1 2017
Adjusted segment EBITA 35,244 42,148
Head office/consolidation -5,835 -4,933
Adjusted Group EBITA 29,409 37,215
Portfolio optimization -93 -21
One-off expenses and income -4,288 -84
Amortization of fair value adjustments -7,717 -8,874
Results of operations 17,311 28,236
Net finance expense -9,406 -8,513
Net income before income taxes 7,905 19,723
Transfer prices between the divisions are based on customary market terms
on arm's length terms.
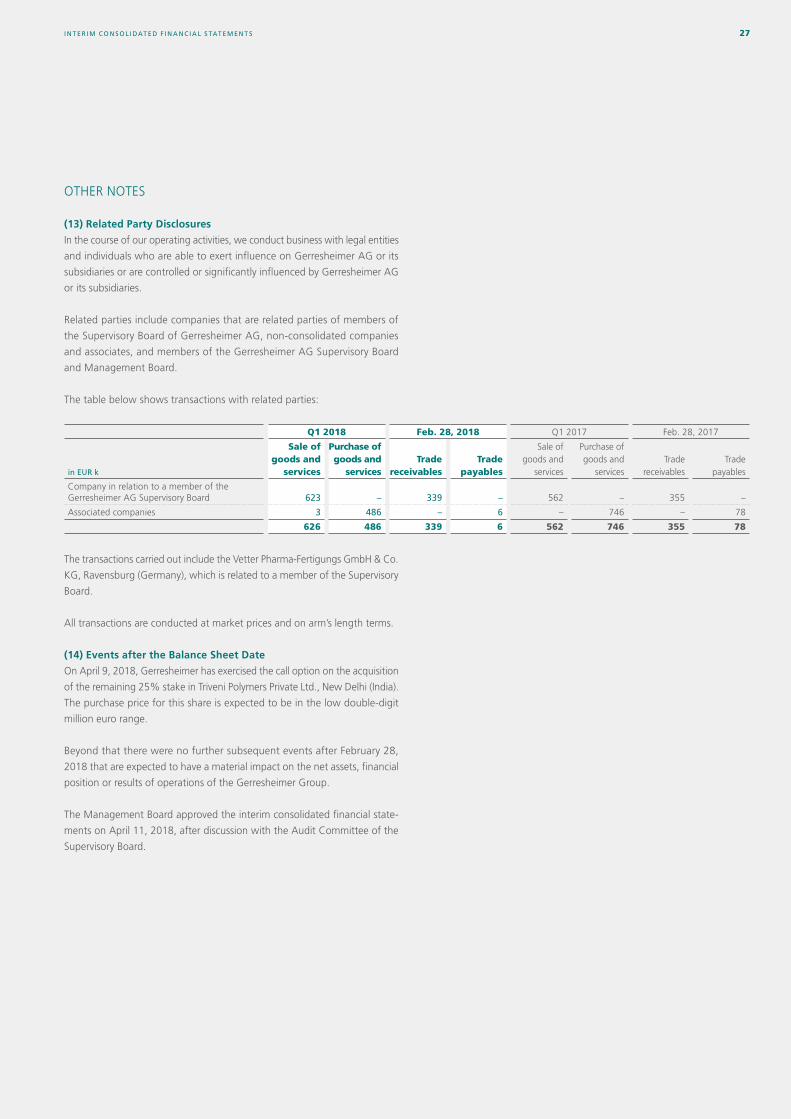
INTERIM CONSOL IDATED F INANCI AL S TATEMENT S 27
OTHER NOTES
(13) Related Party Disclosures
In the course of our operating activities, we conduct business with legal entities
and individuals who are able to exert influence on Gerresheimer AG or its
subsidiaries or are controlled or significantly influenced by Gerresheimer AG
or its subsidiaries.
Related parties include companies that are related parties of members of
the Supervisory Board of Gerresheimer AG, non-consolidated companies
and associates, and members of the Gerresheimer AG Supervisory Board
and Management Board.
The table below shows transactions with related parties:
Q1 2018 Feb. 28, 2018 Q1 2017 Feb. 28, 2017
in EUR k
Sale of goods and
services
Purchase of goods and
servicesTrade
receivablesTrade
payables
Sale of goods and
services
Purchase of goods and
servicesTrade
receivablesTrade
payables
Company in relation to a member of the Gerresheimer AG Supervisory Board 623 – 339 – 562 – 355 –
Associated companies 3 486 – 6 – 746 – 78
626 486 339 6 562 746 355 78
The transactions carried out include the Vetter Pharma-Fertigungs GmbH & Co.
KG, Ravensburg (Germany), which is related to a member of the Supervisory
Board.
All transactions are conducted at market prices and on arm’s length terms.
(14) Events after the Balance Sheet Date
On April 9, 2018, Gerresheimer has exercised the call option on the acquisition
of the remaining 25% stake in Triveni Polymers Private Ltd., New Delhi (India).
The purchase price for this share is expected to be in the low double-digit
million euro range.
Beyond that there were no further subsequent events after February 28,
2018 that are expected to have a material impact on the net assets, financial
position or results of operations of the Gerresheimer Group.
The Management Board approved the interim consolidated financial state-
ments on April 11, 2018, after discussion with the Audit Committee of the
Supervisory Board.
FURTHER INFORMATION28 Gerresheimer AG INTERIM REP ORT DECEMBER 2017 – FEBRUARY 2018
April 25, 2018 Annual General Meeting 2018
July 12, 2018 Interim Report 2nd Quarter 2018
October 11, 2018 Interim Report 3rd Quarter 2018
Publisher
Gerresheimer AG
Klaus-Bungert-Strasse 4
40468 Duesseldorf
Germany
Phone +49 211 61 81-00
Fax +49 211 61 81-295
E-mail [email protected]
www.gerresheimer.com
Concept and layout
Kirchhoff Consult AG, Hamburg, Germany
Text
Gerresheimer AG, Duesseldorf, Germany
Note to the Interim ReportThis Interim Report is the English translation of the original German version; in case of deviations between these two, the German version prevails.
Note regarding the rounding of figuresDue to the commercial rounding of figures and percentages, small deviations may occur.
DisclaimerThis Interim Report contains certain future-oriented statements. Future-oriented statements include all statements which do not relate to historical facts and events and contain future-oriented expressions such as “believe”, “estimate”, “assume”, “expect”, “forecast”, “intend”, “could” or “should” or expressions of a similar kind. Such future-oriented statements are subject to risks and uncertainties since they relate to future events and are based on the Company’s current assumptions, which may not in the future take place or be fulfilled as expected. The Company points out that such future-oriented statements provide no guarantee for the future and that actual events including the financial position and profitability of the Gerresheimer Group and developments in the economic and regulatory fundamentals may vary substantially (particularly on the down side) from those explicitly or implicitly assumed or described in these statements. Even if the actual results for the Gerresheimer Group, including its financial position and profitability and the economic and regulatory fundamentals, are in accordance with such future-oriented statements in this Interim Report, no guarantee can be given that this will continue to be the case in the future.
FINANCIAL CALENDAR
IMPRINT

Gerresheimer AG
Klaus-Bungert-Strasse 4 40468 DuesseldorfGermanyPhone +49 211 61 81-00Fax +49 211 61 81-295E-mail [email protected]