Embed Size (px)
Citation preview
Our fresh water 2017DATA TO 2016
>> New Zealand’s Environmental Reporting Series
Crown copyright ©
Unless otherwise stated, this copyright work is licensed for re-use under a Creative Commons Attribution 3.0 New Zealand licence. Except for any photographs, in essence, you are free to copy, distribute and adapt the work, as long as you attribute the work to the New Zealand Government and abide by the other licence terms. To view a copy of this licence, visit Creative Commons Attribution 3.0 New Zealand licence. To reuse a photograph please seek permission by sending a request to the stated image owner.
Please note that neither the New Zealand Government emblem nor the New Zealand Government logo may be used in any way which infringes any provision of the Flags, Emblems, and Names Protection Act 1981 or would infringe such provision if the relevant use occurred within New Zealand. Attribution to the New Zealand Government should be in written form and not by reproduction of any emblem or the New Zealand Government logo.
If you publish, distribute, or otherwise disseminate this work (or any part of it) to the public without adapting it the following attribution statement should be used:
Source: Ministry for the Environment, Stats NZ, and data providers, and licensed by the Ministry for the Environment and Stats NZ for re-use under the Creative Commons Attribution 3.0 New Zealand licence.
If you adapt this work in any way, or include it in a collection, and publish, distribute, or otherwise disseminate that adaptation or collection to the public, the following attribution statement should be used:
This work uses material sourced from the Ministry for the Environment, Stats NZ, and data providers, which is licensed by the Ministry for the Environment and Stats NZ for re-use under the Creative Commons Attribution 3.0 New Zealand licence.
Where practicable, please hyperlink the name of the Ministry for the Environment or Stats NZ to the Ministry for the Environment or Stats NZ web page that contains, or links to, the source data.
DisclaimerWhile all care and diligence has been used in processing, analysing, and extracting data and information for this publication, the Ministry for the Environment, Stats NZ, and the data providers give no warranty in relation to the report or data used in the report – including its accuracy, reliability, and suitability – and accept no liability whatsoever in relation to any loss, damage, or other costs relating to the use of any part of the report (including any data) or any compilations, derivative works, or modifications of the report (including any data).
CitationMinistry for the Environment & Stats NZ (2017). New Zealand’s Environmental Reporting Series: Our fresh water 2017. Retrieved from www.mfe.govt.nz and www.stats.govt.nz.
Published in April 2017 by Ministry for the Environment & Stats NZ
Publication number: ME 1305
ISSN: 2382-0179 (online) ISBN: 978-0-908339-89-1 (online)
New Zealand’s Environmental Reporting Series: Our fresh water 2017 3
Contents
Message to our readers 4
About this report 5
Purpose of Our fresh water 2017 5
Data collection, analyses, and limitations 7
Executive summary 8
Introduction to our fresh water 18
Our freshwater environments 18
Why fresh water is important 18
Māori ways of knowing and monitoring the freshwater environment 19
Ki uta ki tai – from the mountains to the sea 21
The way we use our land creates legacy effects 23
Water quality 25
Land-based activities are putting pressure on water quality 26
Modelled river water quality 32
Monitored water quality 43
Monitored river water quality 45
Monitored lake water quality 52
Monitored groundwater quality 54
Implications of deteriorating water quality 57
Data gaps 58
Water quantity and flows 59
Climate patterns influence freshwater flows 60
Human activities alter the natural flows in our water bodies 61
Implications of altered river flows 68
Data gaps 68
Ecosystems, habitats, and species 69
Human activities are degrading some ecosystems 70
Status of the health and mauri of ecosystems and habitats 75
Status of our freshwater species 79
Implications of degrading ecosystems 83
Data gaps 84
Acknowledgements 85
Glossary 87
Appendix: New Zealand Threat Classification System 90
References 91
New Zealand’s Environmental Reporting Series: Our fresh water 2017 4
Message to our readers
He taura whiri kotahi mai anō te kopunga tai no i te pu au
From the source to the mouth of the sea all things are joined together as one
Our freshwater environments support our way of life – water sustains our agriculture, industries, tourism, and the health and well-being of people and communities. For Māori, fresh water is a taonga and fundamental to the cultural identity of iwi.
Ki uta ki tai (from the mountains to the sea) recognises the movement of water through the landscape and the numerous interactions it may have on its journey. Fully appreciating this helps us understand the true impact of what we do in the environment. If water quality is degraded at one point, it will be felt downstream. Similarly if it is enhanced, the value will resonate in other places.
New Zealand is fortunate to have plenty of fresh water, but like the rest of the world, it is becoming increasingly clear our natural resources are limited if we continue to use them in the same way we have done. Good science, data, and information have the potential to transform the impact we have – especially if we are committed to increasing the value we get from our primary industry-based economy and supporting our growing population.
Environmental reporting is about unleashing the power of data to benefit the environment and people. Our environmental reporting series provides a national picture of our environment while acknowledging the significance of regional and local variation. This helps us see where the greatest pressures are and where we are performing well so we can learn from each other and lift New Zealand’s environmental performance as a whole.
Our fresh water 2017 is the first dedicated report on fresh water in New Zealand’s Environmental Reporting Series and will be a baseline for tracking change over time. A key takeaway from this report is the need to get better at collecting and reporting consistent data on fresh water. We present a story with the information we have, but there are things we inherently know are an issue, but we lack the quantitative evidence to show exactly how these affect the freshwater environment.
Based on the data we do have, we know many of our native freshwater species are under pressure, water quality varies across the country, and the way we use our land impacts our fresh water.
It will take time and collaboration with others to get the reliable, well-structured, and relevant statistics we need, and we are continually looking at ways to improve data for future reports. But we can’t wait for perfect information to make decisions.
We hope this report helps New Zealanders better understand our fresh water, supports informed discussions, and ultimately leads to good decisions about freshwater priorities and management.
Vicky Robertson Liz MacPherson Secretary for the Environment Government Statistician
New Zealand’s Environmental Reporting Series: Our fresh water 2017 5
About this report
Our fresh water 2017 presents information about the state of our fresh water, the pressures
on this state, and what that means for us and the environment. This report will support policy
makers, businesses, iwi, community groups, and individuals to make informed decisions about
freshwater issues and priorities.
Our fresh water 2017 focusses on three themes:
water quality
water quantity and flows
ecosystems, habitats, and species.
Purpose of Our fresh water 2017 The Environmental Reporting Act 2015 (the Act) requires the Ministry for the Environment and
Stats NZ to report on the state of our environment, the pressures that affect the state, and
how this state influences aspects of the environment and our well-being. These aspects
include ecological integrity, public health, economy, te ao Māori (Māori world view), and
culture and recreation. We do not report on response under the Act due to the requirement to
be independent of the government of the day. Therefore, Our fresh water 2017 does not
include any recommendations for management or policy responses for freshwater issues.
The Environmental Reporting Regulations 2016 identify the topics we will report on for each of
the five ‘domains’ (fresh water, atmosphere and climate, land, air, and marine).
The Act requires data that are of sufficient quality for national-level reporting. We must be
satisfied that any statistics used follow best practice principles and protocols and that they
accurately represent the topic they aim to measure. We follow a similar quality assurance
process for environmental statistics as for all official statistics, while recognising the nuances of
environmental data. It will take time to refine the system and get all the reliable, accurate, and
relevant statistics we need. Limitations in the quality of available data mean there are gaps in
our information. In the absence of suitable data, we have supported our findings with
information from other reports and scientific literature, which we reference.
Our fresh water 2017 is the fourth environmental report produced in the spirit of the Act,
and the second to be produced under the Act (Our marine environment 2016 was the first).
While we report on each domain individually, the information will inform an interconnected
view of the environment in Environment Aotearoa 2019 (the synthesis report that we produce
every three years). We are still learning, and our environmental reports will continue to
evolve over time.
6 New Zealand’s Environmental Reporting Series: Our fresh water 2017
Changes since Environment Aotearoa 2015
This report focusses on adding breadth, rather than depth, of available information about our
fresh water since we reported on fresh water in Environment Aotearoa 2015. There are still
many gaps in our national reporting on our fresh water, so we chose to focus on filling some
of those gaps, rather than adding an additional year or two of data to our existing indicators
– environmental change is generally not seen in one or two years.
To support our findings and help improve understanding where there are gaps in our data, we
added references to peer-reviewed literature.
Some of the new information includes:
modelled river water quality data, to create a more complete national picture
trends in river water quality with sites grouped by land-cover class
a more in-depth analysis of urban water quality
pesticide concentrations in groundwater
ecological condition of lakes
trends of freshwater species and some of the physical changes that prevent migrations
and affect habitats.
For the first time in this environmental reporting series, you will find a national picture of the
cultural health of our rivers and lakes, where tangata whenua assessed and reported the
cultural health index of freshwater sites.
Our fresh water reports will continue to evolve over the next few reporting cycles as we build
the appropriate indicators needed to report on this domain.
Other products
Download our infographic for an overview of our findings
New Zealand’s fresh water at a glance is a visual representation of our key findings. Use this
resource if you want basic information about our fresh water.
Go to our webpages and data service for more detailed scientific information
Environmental indicators Te taiao Aotearoa: Fresh water – has graphs, maps, tables, and more
detailed scientific descriptions of our key findings.
Access the data service to conduct your own analysis of the data. The data service and the
publication section of the Ministry for the Environment’s website provide reports that explain
the methodologies we used in our analysis.
Give us your feedback
We welcome your feedback on this and future reports in New Zealand’s Environmental
Reporting Series. You can email your feedback to [email protected].
New Zealand’s Environmental Reporting Series: Our fresh water 2017 7
Data collection, analyses, and limitations For the analyses in this report, we collected information from many sources. This report would
not be possible without the ongoing support and contribution of a large number of people and
organisations.
The water quality information largely comes from regional and unitary councils, NIWA, and
GNS monitoring networks. For the regional council networks in particular, many monitored
sites tend to be in areas of known, or suspected, issues so that regional councils can make
management decisions; however, this potentially leads to a biased view of national water
quality. To overcome this issue, we used modelled water quality data to estimate water quality
in areas where we do not have data. We also use models to estimate nitrate leaching and
periphyton growth, to help us build the story around water quality pressures and impacts. We
currently have limited data on the pressures and impacts related to water quality, particularly
monitored data at a national scale.
The chapter on water quantity focuses on information about consents to take fresh water,
which was supplied by all 16 regional and unitary councils. We rely on consent information,
because actual data on water use is not yet available nationally. However, the water metering
regulations introduced in 2010, and which were fully in force in November 2016, will allow us
to report on more actual water use data over time. We currently have very little data in this
report on the state of freshwater flows compared with natural levels, and the impact any
altered flows are having on freshwater ecosystems and species.
In the ecosystems, habitats, and species chapter, information comes from a wide range of
sources including regional councils, Crown research institutes, Cawthron Institute, and
Department of Conservation. There is little national data, collected over a period of time, on
ecosystems, habitats, and species. Exceptions include the conservation status of plants, fish,
and invertebrates from the Department of Conservation, and the New Zealand Freshwater Fish
Database administered by NIWA. As with the other two chapters, data on the pressures and
impacts on our ecosystems, habitats, and species are limited.
Environmental issues, by their nature, are specific to catchments or regions. New Zealand has
a diverse range of river systems, lake types, wetlands, and groundwater systems. The state of
fresh water depends on, for example, the physical characteristics of the water body and
catchment, historical impacts, and how the land was used in the catchment (including the
extent or intensity of this use). Although some of New Zealand’s freshwater bodies and their
surrounding catchments were studied extensively, we know little about others. We aim to
continue to build on a national picture of the pressures on our fresh water, the state of fresh
water, and the impact the state is having on our ecosystems and our well-being.
8 New Zealand’s Environmental Reporting Series: Our fresh water 2017
Executive summary
Introduction Fresh water supports almost every aspect of life. We use fresh water to drink, enjoy it for
recreation, and use it to produce goods and services. Māori tribal identity is linked to fresh
water, for whom each water body has its own mauri (life force).
Ki uta ki tai (from the mountains to the sea) captures the movement of water through the
landscape and the many interactions it may have on its journey. Ki uta ki tai acknowledges the
connections between the atmosphere, surface water, groundwater, land use, water quality,
water quantity, and the coast (see Our marine environment 2016). It also recognises the
connections between people and communities, people and the land, and people and water.
As a society, we have seen a clearing of native vegetation, the draining of wetlands, farming,
forestry, and urbanisation, which have all placed increasing pressure on our water bodies and
their ecosystems. As our population and agriculture-based economy grow, our need for fresh
water is likely to increase in the future.
The way we use the land differs across New Zealand so the impacts on our fresh water,
whether positive or negative, are often specific to a catchment or region. This makes it
difficult to paint a national picture. It can also take decades for water (and any contaminants
it contains) to cycle from the earth’s surface through the ground to aquifers, and back to
surface water systems. This means some effects we see today are legacies of past activities,
and the impact of our activities today, both positive and negative, may not be seen in our
waters for a long time.
Summary of top findings Here is a selection of findings grouped by the three key themes of this report – Water quality;
Water quantity and flows; and Ecosystems, habitats, and species.
In some instances, we talk about areas we see as important, although we did not have access
to appropriate data. These gaps are where more work is needed, so that in future we could
provide a more complete understanding of the freshwater environment.
We used four principles to select our top findings:
spatial scale of impact to natural systems
magnitude of change
scale of impact on culture, recreation, health, and the economy
irreversibility or long-lasting effects of change.
New Zealand’s Environmental Reporting Series: Our fresh water 2017 9
The symbols show the amount of data we had to support a top finding:
A blue circle indicates we had a lot of data.
A circle, the bottom half blue and the upper half white, indicates we had limited data.
Water quality
Water quality relates to the condition of water and includes factors like how well it can
support plants and animals, and whether it is fit for us to use.
This summary focuses on two nutrients, nitrogen and phosphorus, which can tell us something
about the risks of algal blooms; and E.coli (an indication of faecal contamination), which can
tell us whether water bodies are safe for recreation.
Nutrients occur naturally and are necessary for plants to grow. However, high nutrient
concentrations can result in too much growth of algae in water (this algae is generally
periphyton in rivers and phytoplankton in lakes). Excessive algae in water can decrease
oxygen levels, prevent light from penetrating water, and change the composition of freshwater
plant and animal species that live there. High concentrations of nitrogen can be toxic to
species and make water unsafe to drink.
The activities we do on the land, mainly urban and agricultural activities, can cause excess
nutrients and E.coli to wash into our water bodies through run-off or filter through the land
into groundwater. Phosphorus often enters surface water attached to sediment.
In urban environments, contaminants enter water bodies mainly through stormwater
and wastewater networks, illegal connections to the networks, and leaky pipes, pumps,
and connections.
In agricultural areas, nutrients and pathogens (organisms that can cause disease) come from
animal waste and urine, and fertilisers. Since the late 1970s, agricultural practices have
intensified in some areas of New Zealand, indicated by higher stocking rates and yields,
increased use of fertiliser, pesticides, and food stocks, and moves to more intensive forms of
agriculture, such as dairying. Agricultural land use is the world’s greatest contributor to
diffuse pollution (run-off from the land or filtration through the soil). However, since diffuse
discharges are hard to measure, it is difficult to determine the relationship between specific
land use and water quality.
In our findings for nitrogen, we report on nitrate-nitrogen, which is highly soluble, leaches
through soils easily, and is available for plant and algal growth. For phosphorus, we report on
dissolved reactive phosphorus, which can be released from fertilisers or dissolved from soil or
sediment and becomes available for plant and algal growth.
10 New Zealand’s Environmental Reporting Series: Our fresh water 2017
Nitrate-nitrogen concentrations were worsening at more monitored river sites than improving. Dissolved reactive phosphorus concentrations were improving at more monitored river sites than worsening.
In monitored rivers, nitrate-nitrogen was worsening (55 percent) at more sites than improving
(28 percent), and dissolved reactive phosphorus was improving (42 percent) at more sites than
worsening (25 percent) between 1994 and 2013. However, the trends for nitrate-nitrogen and
dissolved reactive phosphorus vary across the country. For some monitored sites, nitrate-
nitrogen concentrations were improving and dissolved reactive phosphorus concentrations
were worsening. For some sites we could not determine a trend direction.
Both concentrations and ratios of nitrogen and phosphorus in a water body are important, as
there needs to be a supply of both nutrients for excessive algal growth to occur. We know that
concentrations of nitrogen and phosphorus are much higher in urban and pastoral areas than
in native areas, so the likelihood of algal growth is higher in these environments.
We lack information on how the impact of worsening nitrate-nitrogen concentrations is
affecting our fresh water, but it is estimated the vast majority of rivers do not have nitrate-
nitrogen levels high enough to be toxic to most freshwater species.
We do not know the direct cause of improving dissolved reactive phosphorus concentrations
in rivers. In rural areas, these may be due to improved farming practices and the targeting of
areas highly susceptible to phosphorus loss. In urban areas, it may be due to improvements in
treating wastewater.
Supporting findings
Nitrate-nitrogen concentration was 18 times higher in the urban land-cover class, and
10 times higher in the pastoral class compared with the native class for the period 2009–13.
We classify sites by land cover: pastoral, urban, exotic forest, and native.
Of 175 monitored river sites in the pastoral class, nitrate-nitrogen trends were worsening at
61 percent and improving at 22 percent of sites for the period 1994–2013. Similarly in the
exotic forest and native classes more sites were worsening than improving, but there were
few monitored sites in these classes.
Nitrogen leaching from agricultural soils was estimated to have increased 29 percent from
1990 to 2012.
More than 99 percent of total river length was estimated not to have nitrate-nitrogen
concentrations high enough to affect the growth of multiple sensitive freshwater species for
the period 2009–13.
Dissolved reactive phosphorus concentration was 3 times higher in the urban class and
2.5 times higher in the pastoral class compared with the native class (2009–13).
New Zealand’s Environmental Reporting Series: Our fresh water 2017 11
Of 145 monitored river sites in the pastoral class, trends in dissolved reactive phosphorus
were improving at 46 percent and worsening at 21 percent of sites for the period
1994–2013. Similarly, in the urban and native classes more sites were improving than
worsening, but there were few monitored sites in these classes.
Of total river segment length of large rivers, 83 percent was not expected to have regular
or extended algal blooms. This is because it was modelled to either meet the periphyton
national bottom line in the National Objectives Framework (60 percent) or had fine
sediment (23 percent) that does not usually support algal growth (2009–13).
E.coli concentrations affect our ability to swim in some rivers.
Animal or human faeces in fresh water can increase the risk of illness for swimmers in the
area. When Escherichia coli (E.coli), a group of bacteria usually found in the intestines of
mammals, is detected in rivers or lakes, this indicates that faecal matter is present in fresh
water. Concentrations of E.coli in a water body are used to measure risk to public health.
Of monitored sites, most had indeterminate trends for E.coli for the period 2004–13, meaning
we have insufficient data to determine a trend at those sites.
We do not have E.coli data for lakes. We also do not assess trends in E.coli for groundwater
sites because of the large number of values below detection limits.
Supporting findings
E.coli concentration was 22 times higher in the urban land-cover class and 9.5 times higher
in the pastoral class compared with the native class (2009–13). We classify sites by land
cover: pastoral, urban, exotic forest, and native.
Of 268 monitored river sites in the pastoral land-cover class, E.coli trends were
indeterminate at 65 percent, improving at 21 percent, and worsening at 14 percent of sites
for the period 2004–13. Sites in the urban, exotic forest, and native classes had similar
results, but there were few monitored sites in these classes.
Developing a national indicator for swimmability
We are assessing whether modelled E.coli data can be used as a suitable indicator to track over
time the risks of infection associated with swimming in water bodies. Although this is still in
development, we recognise this topic is an area of great public interest, so we are providing
some initial results of this work.
The Clean Water Package, launched by the Government in February 2017, proposed a new
approach to measuring the swimmability of water bodies. The package proposes a definition of
12 New Zealand’s Environmental Reporting Series: Our fresh water 2017
swimmable based on E.coli concentrations for rivers and cyanobacteria for lakes. For a river to
be swimmable under the new guidelines, the risk of getting sick from infection averaged across
time is between 1 and 3.5 percent. See Public health considerations for swimming in rivers for
more information.
Water quantity and flows
New Zealand has plenty of fresh water, but because the flow of our rivers varies naturally over
time and different water bodies, it is not always there where or when we need it. When the
flows of rivers are reduced, algae and fine sediment can build up, reducing the amenity and
recreational value of water resulting in a poor habitat for freshwater species. This can also
affect the mauri of water bodies in their ability to support abundance of life.
Our activities influence the quantity and flow of water, for example, when we take water or
physically alter water bodies. We take water for farming (irrigation and stock drinking water),
power generation, drinking water, and industrial uses. We physically alter water bodies when
we create diversions, build dams, and drill bores. Larger effects on water flow happen when
we take higher volumes of water from multiple locations, particularly in dry periods. Surface
water and groundwater are often connected, so taking water from one affects both.
Climate change is projected to increase the pressures on water flows and the availability of
water – in New Zealand, annual rainfall is expected to decrease in the east and north.
This summary focuses on how much water councils allow to be taken for various uses (which
are specified in consents to take water). This shows us how much water may be used, although
it does not necessarily match what is actually used.
More than half the water allocated (or consented) by councils is for irrigation, but we do not know how much of this is actually used.
Regional councils allocate water by giving consents for industrial, energy, agricultural, and
domestic use. It is called consumptive use when the water is not immediately returned to
water bodies, and non-consumptive use when water is returned to downstream water bodies
after use (such as in most hydroelectricity schemes).
In 2013–14, irrigation was the largest consented user of consumptive water by volume,
followed by household use and industry.
Data quality and the completeness of records on actual takes (as opposed to consented) is
mixed across the regions, so it was not possible to report on how much water is actually
taken at a national scale. In some cases, actual use is less than consented use for a number
of reasons, for example, when water flows drop below a certain level restrictions on use can
be applied.
From November 2016, legislation requires most water users to provide continuous records of
water takes each year. In future reports we aim to provide a more complete national picture of
how much water is actually used.
New Zealand’s Environmental Reporting Series: Our fresh water 2017 13
Supporting findings
In 2013–14, excluding hydroelectricity use, New Zealand’s total consented water volume
was allocated for irrigation (51 percent), followed by household consumption (14 percent),
and industry (13 percent).
Canterbury accounted for 64 percent of the total consented volume of water for irrigation.
Ecosystems, habitats, and species
The health and mauri of some of our freshwater ecosystems face multiple pressures, which
may compound one another. These pressures negatively affect biodiversity – many of our
freshwater species are threatened with, or at risk of, extinction.
Most of the pressures come from the way we are changing freshwater environments. Land-
based activities, infrastructure development, and the deliberate modification of water bodies,
such as draining wetlands or channelling rivers, contribute to the degradation and loss of
habitats. These activities can degrade cultural health, reduce water quality, increase sediment
yields, alter water flows, introduce pests, and modify or degrade habitats or the connections
to habitats.
This summary focuses on the conservation status of our freshwater biodiversity, the cultural
health of rivers and lakes, and some of the pressures affecting freshwater ecosystems.
Of the native species we report on, around three-quarters of fish, one-third of invertebrates, and one-third of plants are threatened with, or at risk of, extinction.
New Zealand is vulnerable to biodiversity loss as many of our native species are endemic
(found nowhere else in the world). Freshwater biodiversity supports opportunities for
recreational activities such as fishing, and customary activities such as mahinga kai.
Our freshwater environment supports approximately 53 known resident native freshwater fish
species, 630 known native freshwater invertebrate types, and 537 known native freshwater-
dependant plant and algae types. We report on the conservation status of our freshwater
species where we have sufficient information on taxonomy, distribution, and abundance.
Freshwater fish
More than half our known fish species migrate between the sea and fresh water to complete
their life cycles, meaning they can be severely affected by barriers to migration in rivers and
streams. Other pressures negatively affecting native fish include pests that outcompete and
prey on our fish, and habitat loss and deterioration.
We report on the conservation status of 39 of our native freshwater fish. However, long-term,
national level information on native fish is currently limited, but we have enough data to
report on the trends of eight fish species.
14 New Zealand’s Environmental Reporting Series: Our fresh water 2017
Supporting findings
Of the 39 native freshwater fish species we report on, 72 percent were either threatened
with (12 species), or at risk of (16 species), extinction in 2013.
Native freshwater fish threatened with, or at risk of, extinction include taonga species such
as inanga, shortjaw kōkopu, giant kōkopu, kōaro (all are whitebait species),
kanakana/piharau (lamprey), and one species of tuna (longfin eel).
Declines in conservation status were observed for four species between assessment periods
(2009 and 2013) – Central Otago roundhead galaxias, Canterbury galaxias, black mudfish,
and kanakana/piharau (lamprey).
Of eight native fish species, two were estimated to have increased in abundance (shortfin
eel and upland bully), and four decreased in abundance (longfin eel, kōaro, Canterbury
galaxias, and common bully) between 1977 and 2015.
Freshwater invertebrates
Freshwater invertebrates include many organisms such as crustaceans, molluscs, worms,
and freshwater insects. Invertebrates perform important ecosystem services – they graze on
periphyton (algae) and break down leaves and wood. They also provide food for native fish
and birds and some provide food for people. Our native invertebrates are negatively affected
by pests that prey on them for food, and other pressures that result in habitat deterioration.
Supporting findings
Of the 435 native freshwater invertebrate types we report on, 34 percent were either
threatened with (66 types), or at risk of (82 types), extinction in 2013.
Three of the freshwater invertebrate types experienced a decline in conservation status, and
none had an improvement between assessment periods (2005 and 2013).
The South Island kōura (freshwater crayfish) and all three species of kākahi/kāeo
(freshwater mussel) are included in the at-risk or threatened categories.
Freshwater plants
The habitats that support native freshwater plants only cover a small proportion of New
Zealand’s land area, but are rich in abundance of diverse freshwater plant species.
Plants dependent on fresh water include vascular plants, mosses, hornworts and liverworts,
and green algae that live in and around fresh water. These plants are negatively affected by
invasive weeds, drainage, and when vegetation is grazed, trampled on, and cleared.
New Zealand’s Environmental Reporting Series: Our fresh water 2017 15
Supporting finding
Of the 537 plant types we report on, 31 percent were either threatened with (71 types), or
at risk of (97 types), extinction in 2013.
Some water bodies have been physically changed, but we do not know the extent or the impact this is having.
Our rivers have changed because we placed structures in them (such as weirs and culverts),
and redefined river channels to prevent water from damaging infrastructure and houses.
Physically changing our rivers makes floodplains available for urban and agricultural
development and improves flood control and security. However, these changes have altered
the natural character of rivers, which can cause river banks to erode and more sediment to be
deposited downstream. The structures we place in rivers can also hinder fish migration (some
fish species move from fresh water to the sea as part of their lifecycle).
Physical changes to rivers reduce how floodplains (and associated lakes and wetlands) are
connected to rivers, which affects flood pulses. A flood pulse is the periodic flooding of a
river, and is considered to be good for a river’s ecosystem. It aids in dispersing seeds,
establishing plants, cycling nutrients, scouring, depositing sediments, and maintaining the
richness of species.
Changes to physical habitats have significant effects, but we currently have limited data on the
extent or impacts these changes are having on ecosystems.
Fine sediment deposited on riverbeds is estimated to have increased, but we don’t know the national extent or impact this is having.
Deposited sediment occurs naturally in the beds of rivers and streams, but too much fine
sediment (particles less than two millimetres in size) can severely degrade streambed
habitat, carry excess nutrients into surface water, and affect water clarity and recreational
activities. Fine sediment levels greater than 20 percent cover can have negative effects on
streambed life.
Our marine environment 2016 reported that some sediment can wash out to estuaries where
it smothers important nursery habitats of marine animals.
Our activities can affect the natural cycle of sediments by accelerating the delivery of sediment
to streams. Models suggest a significant increase in sediment cover has occurred since human
occupation. Over the past 800 years, the clearing of native forests, along with farming
practices and earthworks, resulted in sediment in rivers being deposited above natural levels.
There are not many sites across the country where fine sediment has been observed over time
using consistent methods. This makes it difficult for us to report on the status of deposited fine
sediment cover at a national level, so in this report we rely on modelled estimates.
16 New Zealand’s Environmental Reporting Series: Our fresh water 2017
Supporting findings
Modelled results suggested fine sediment would cover an average of 8 percent of riverbeds
in the absence of humans.
The same model suggested an average fine sediment cover of 29 percent of riverbeds
in 2011.
Wetland extent has greatly reduced and losses continue.
Wetlands perform many functions. They filter nutrients and sediment from water, absorb
floodwaters, and provide habitat for plants, fish, and other animals.
We have no national information on the health of our wetlands, but we do have information
on their extent. The vast draining of our wetlands due to the way we use our land has left only
a small portion of original wetland extent. This led to a loss of biodiversity and natural function
in some areas.
We are less clear on recent changes in national wetland extent, but we know that losses are
still occurring.
Supporting findings
In 2008, the extent of wetlands was only 10 percent of their original extent (before humans
settled New Zealand).
As an example of recent wetland loss, Southland’s wetlands not on conservation land were
reduced in area by 1,235 hectares, or 10 percent, between 2007 and 2014–15.
The West Coast has the greatest extent of wetlands (84,000 hectares), followed by
Southland (47,000 hectares), and Waikato (28,000 hectares).
Cultural health is rated moderate at most tested freshwater sites.
For Māori, fresh water is a taonga and essential to life and identity. Freshwater ecosystems
provide valuable resources, and support Māori values and practices including healing and
harvesting kai (food).
Cultural health indicators support kaitiakitanga (the cultural practice of guardianship) and how
Māori use the environment. These indicators provide a holistic understanding of the cultural
aspects of our freshwater environment to the benefit of all New Zealanders.
The cultural health index measures the factors that are of cultural importance to Māori. It
provides an overall indication of the cultural health of a site on a waterway. A cultural health
New Zealand’s Environmental Reporting Series: Our fresh water 2017 17
index score cannot be produced without local indigenous knowledge. Three components make
up the overall cultural health index score: site status, mahinga kai (customary food gathering)
status, and cultural stream health status.
Tangata whenua and hapū/rūnanga groups across the country determined cultural health
index scores at 41 sites between 2005 and 2016. As more tangata whenua monitor water
bodies for cultural health, we will incorporate these into future reports.
Supporting findings
Of the 41 sites assessed, 11 had a good or very good overall cultural health index rating.
Twenty-one sites had a moderate rating, and nine had a poor or very poor rating.
Of the 39 sites assessed, 28 had a poor or very poor mahinga kai status. Seven sites had a
moderate status, and four sites had a good or very good status.
Data gaps
We identified many gaps in available data and information that if (and when) they are filled
would improve future environmental reports. We want to build a fuller and more
representative picture of the pressures on our freshwater environment and the effects of
these pressures on the environment and our well-being.
Data and information we would like to get more information about include:
the extent of our rivers affected by excessive algal growth
how much water is actually being used and how it is affecting flows, water availability,
and habitats
the extent of physical change to water bodies
the amount of sediment deposition
the extent and impact of barriers to fish migration
a fuller understanding of the cultural health of our water bodies
the national abundance and distribution of many of our native species
the health of our wetlands and recent changes in extent.
Some of this information is being gathered now, such as recording freshwater takes. The next
steps for this programme are to work with others to prioritise and determine how we start to
fill these, and other, important gaps that may arise.
18 New Zealand’s Environmental Reporting Series: Our fresh water 2017
Introduction to our fresh water
Fresh water is present in many physical forms. These include fresh water in rivers, lakes,
streams, wetlands, aquifers, snow, and glaciers, and the animals, vegetation, processes,
and structures associated with them. For Māori, fresh water is a taonga essential to life
and identity.
This chapter covers:
Our freshwater environments
Why fresh water is important
Māori ways of knowing and monitoring the freshwater environment
Ki uta ki tai – from the mountains to the sea
The way we use our land creates legacy effects.
Our freshwater environments New Zealand is a relatively narrow country (450 kilometres at its widest point) dominated
by mountains, in which many of our rivers and streams originate. In total, New Zealand has
over 425,000 kilometres of rivers and streams, 249,776 hectares of wetlands, and more
than 50,000 lakes, about 4,000 of which are larger than one hectare in area. New Zealand’s
fresh water is also stored in reservoirs (artificial lakes, or natural lakes with raised water
levels) ranging from small-farm dams to the 7,500-hectare Lake Benmore in Canterbury.
A considerable amount of our fresh water is groundwater in aquifers. We do not cover glaciers
and snow in Our fresh water 2017 – we will do that in Our atmosphere and climate 2017, to be
published in October 2017.
In this report, we discuss the freshwater environments of the North and South islands. We
note that Stewart Island, the Chatham Islands, other outlying islands (eg Raoul and Campbell),
the Ross Dependency, and Tokelau, are all part of, or associated with, New Zealand. But due to
lack of data, or access to data from these outlying areas, we do not cover them in this report.
Why fresh water is important Fresh water underpins almost every aspect of life. Our freshwater environments provide a
range of ecosystem services (the benefits we get from the natural environment) that support
agriculture, industry, tourism, and the health and well-being of people and communities. The
quality and quantity of fresh water are linked to the ecosystem services our fresh water can
provide. For example, freshwater ecosystems can provide food, help control flooding, and
naturally filter contaminants from water (eg Schallenberg et al, 2013).
We rely on having clean and plentiful water for ceremonial, recreational, and cultural
activities, and for food gathering and drinking. Reduced water quality increases risks to public
New Zealand’s Environmental Reporting Series: Our fresh water 2017 19
health and affects our ability to use freshwater environments for recreational purposes
(McBride et al, 2002).
We value our fresh water for the aesthetics, spiritual associations, and sense of place we
experience (Land Environment & People, 2010). These values are often not well defined and
not easily measurable; some are also very localised. How a particular water body is valued will
vary by person and depends on each individual’s experience (Berkett et al, 2013).
Every iwi and hapū has associations with particular freshwater bodies – streams, springs,
rivers, lakes, wetlands, groundwater – that are reflected in their whakapapa (ancestral
lineage), waiata (song), and whaikorero tuku iho (stories of the past) (New Zealand
Government, 2014). Protecting the health and mauri (life force) of our freshwater ecosystems
is also important for food, materials, customary practices, te reo Māori (Māori language), and
overall well-being.
The varied freshwater ecosystems in New Zealand are rich in animal and plant biodiversity
and have complex ecosystem processes. Modified water bodies and reduced water quality and
quantity can have negative consequences for ecosystem function and species richness (Weeks
et al, 2016).
Our economy depends on having a plentiful supply of water. Many aspects of primary
industries, tourism, and hydroelectricity generation rely on the availability of fresh water.
Primary industries and tourism significantly contribute to our gross domestic product and form
a large part of our export market (Ministry of Business, Innovation and Employment, 2013;
Tourism New Zealand, 2015). Tourism’s contribution to total exports was $11.8 billion
(17.4 percent of exports) in 2015, just behind dairy products, which totalled $14.2 billion
(21 percent of exports) (Statistics NZ, 2015b). Primary industries and tourism are also among
our country’s largest employers, directly employing an estimated 136,500 and 155,502 people,
respectively, in 2012 (Statistics NZ, 2015b; Ministry for Primary Industries, 2014).
Māori ways of knowing and monitoring the freshwater environment Te ao Māori (the Māori world view) acknowledges the interconnectedness of all living things,
their dependence on each other, and the links between the life-supporting capacity of
healthy ecosystems and people’s well-being (Harmsworth & Awatere, 2013). Mātauranga
Māori (Māori systems of knowledge) have developed over hundreds of years since
Polynesian settlement and are intricately interwoven with te reo Māori and whakapapa
(ancestral lineage).
For Māori, the deep kinship between people and the natural world creates an obligation to
care for the environment and maintain it for future generations. This obligation is expressed as
kaitiakitanga – the cultural practice of guardianship and environmental management grounded
in mātauranga Māori (Royal, 2015).
20 New Zealand’s Environmental Reporting Series: Our fresh water 2017
Māori cultural heath indicators can support environmental decision-making
Māori communities are putting kaitiakitanga into practice around New Zealand to restore
environmental health and reclaim their traditional knowledge (Royal, 2015). Some iwi and
hapū/rūnanga (Māori tribes and sub-tribes) regularly monitor freshwater areas using cultural
health indicators to show trends or changes in the health of these areas. Cultural health
indicators support kaitiakitanga and the ways Māori use the environment, but they can also
benefit all New Zealanders by providing a deeper understanding of the freshwater
environment (see Kaitiakitanga of the Waikouaiti catchment).
We use information gathered by iwi and hapū to report on the cultural health index scores of
some freshwater bodies. We also tell the story of how one iwi is using a traditional fishing
method to monitor the abundance of kōura (freshwater crayfish) in Te Arawa Lakes.
We are committed to developing our programme to support Māori decision-making and well-
being through increased reporting on freshwater cultural health indicators in future reports.
Kaitiakitanga of the Waikouaiti catchment
Kaitiakitanga is the custodianship role tangata whenua have over their freshwater environments.
As kaitiaki (custodians) of the Waikouaiti river catchment in Otago, Kāti Huirapa ki Puketeraki
have focused on measuring the factors that affect their ability to access mahika kai (Ngāi Tahu
dialect for the term ‘mahinga kai’) from the river.
To assess the current state of the Waikouaiti river catchment, including important mahika kai
sites, Kāti Huirapa ki Puketeraki used a combination of mātauranga Māori (Māori systems of
knowledge) and other methods. Kaitiaki observations based on whakapapa and historical records
describe the native biodiversity and the river’s ecosystem within the Waikouaiti catchment and
how these have changed over time. Other methods rated four freshwater mahika kai sites in the
Waikouaiti River based on habitat, invertebrates, and periphyton (algae). Results showed the
overall health of two sites had a ‘moderate’ status, and two had ‘very poor’ status in 2015 (Kāti
Huirapa Rūnaka ki Puketeraki, 2016). For the Kāti Huirapa ki Puketeraki, the degradation of the
river and their reduced ability to access mahika kai sites have a negative effect on the mauri (life
force) of the river and the mana (prestige) of the hapū.
For more detail see Environmental indicators Te taiao Aotearoa: Kaitiakitanga of the Waikouaiti
catchment.
Note: Kāti Huirapa ki Puketeraki is the hapū who hold tangata whenua status over the river
catchment and is part of the Ngāi Tahu iwi. The hapū is one of 18 papatipa runanga that make up
the Ngāi Tahu iwi. Each papatipa runanga is responsible for upholding the mana of the people
and environment within their area (New Zealand Government, 1996).
New Zealand’s Environmental Reporting Series: Our fresh water 2017 21
Ki uta ki tai – from the mountains to the sea Freshwater bodies cannot be viewed in isolation because they are strongly interconnected
with land (rock and soils), coast, atmosphere, and living things (plants and animals, including
humans). These connections mean what happens in one can have flow-on effects in another.
Māori have emphasised the need to consider the environment in its entirety through a
concept referred to as ki uta ki tai (Tipa et al, 2016). Māori use this concept to describe their
holistic understanding of freshwater ecosystems and how the health and well-being of the
people are intrinsically linked to the natural environment.
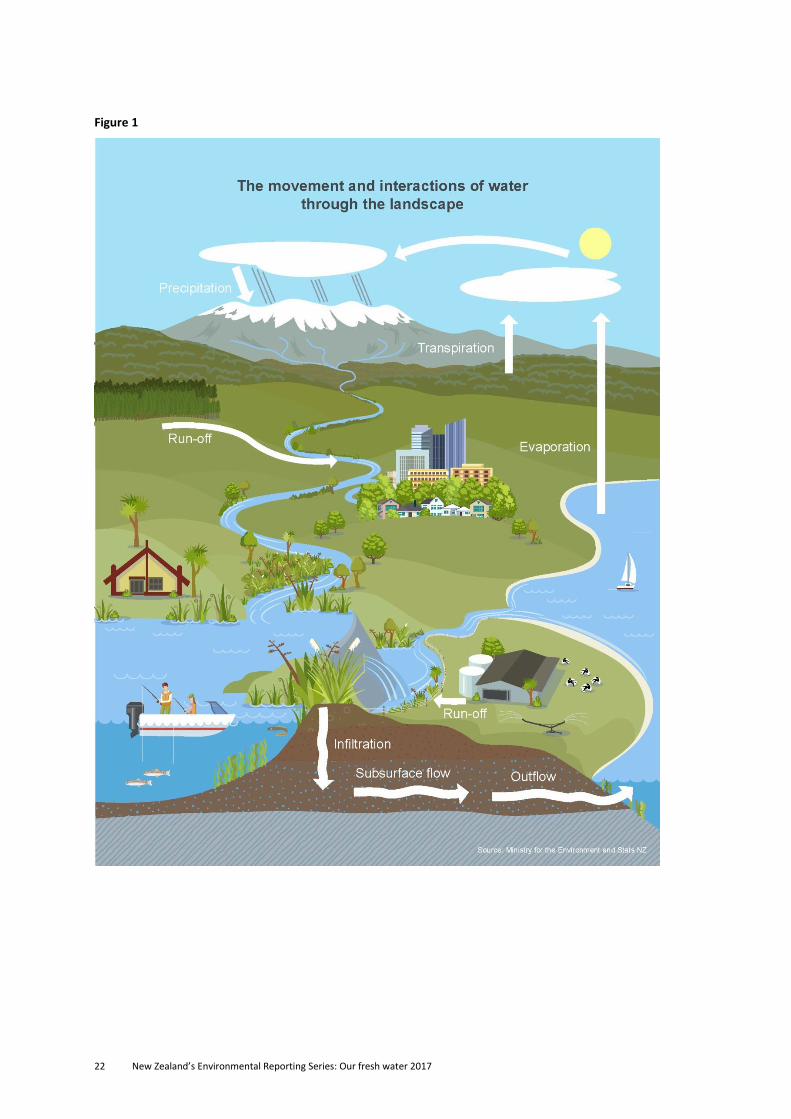
Ki uta ki tai (from the mountains to the sea) recognises the movement of water through the
landscape and the numerous interactions it may have on its journey (see figure 1). Ki uta ki tai
acknowledges the connections between the atmosphere, surface water, groundwater, land
use, water quality, water quantity, and the coast. It also acknowledges the connections
between people and communities, people and the land, and people and water.
The ki uta ki tai journey begins with precipitation falling on land, where the water flows over
the ground as surface water. A portion of surface water enters rivers and streams and flows
towards the oceans. Water emerging from the ground (groundwater) and some surface water
may be stored as fresh water in lakes. Some surface water will also soak into the ground
where it replenishes deep and shallow aquifers and seeps back into water bodies (and the
ocean). Along the way, water can be modified through human activities, such as when we take
water for power generation and irrigation, discharge contaminants to water bodies, and
channelize rivers. Surface water in rivers, along with the material it carries, eventually flows
into estuaries and the ocean. The journey ends with the water returning to the atmosphere
through evaporation and transpiration (moisture carried through plants from roots and then
evaporated from leaves).
22 New Zealand’s Environmental Reporting Series: Our fresh water 2017
Figure 1
New Zealand’s Environmental Reporting Series: Our fresh water 2017 23
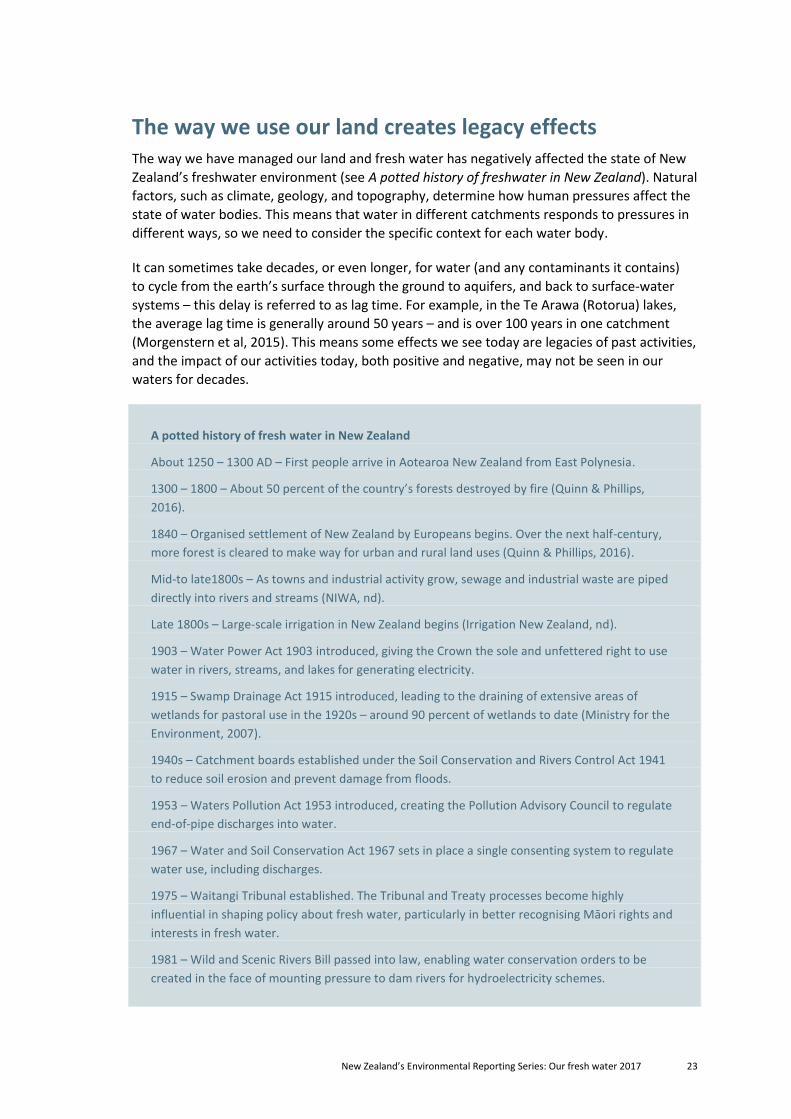
The way we use our land creates legacy effects The way we have managed our land and fresh water has negatively affected the state of New
Zealand’s freshwater environment (see A potted history of freshwater in New Zealand). Natural
factors, such as climate, geology, and topography, determine how human pressures affect the
state of water bodies. This means that water in different catchments responds to pressures in
different ways, so we need to consider the specific context for each water body.
It can sometimes take decades, or even longer, for water (and any contaminants it contains)
to cycle from the earth’s surface through the ground to aquifers, and back to surface-water
systems – this delay is referred to as lag time. For example, in the Te Arawa (Rotorua) lakes,
the average lag time is generally around 50 years – and is over 100 years in one catchment
(Morgenstern et al, 2015). This means some effects we see today are legacies of past activities,
and the impact of our activities today, both positive and negative, may not be seen in our
waters for decades.
A potted history of fresh water in New Zealand
About 1250 – 1300 AD – First people arrive in Aotearoa New Zealand from East Polynesia.
1300 – 1800 – About 50 percent of the country’s forests destroyed by fire (Quinn & Phillips,
2016).
1840 – Organised settlement of New Zealand by Europeans begins. Over the next half-century,
more forest is cleared to make way for urban and rural land uses (Quinn & Phillips, 2016).
Mid-to late1800s – As towns and industrial activity grow, sewage and industrial waste are piped
directly into rivers and streams (NIWA, nd).
Late 1800s – Large-scale irrigation in New Zealand begins (Irrigation New Zealand, nd).
1903 – Water Power Act 1903 introduced, giving the Crown the sole and unfettered right to use
water in rivers, streams, and lakes for generating electricity.
1915 – Swamp Drainage Act 1915 introduced, leading to the draining of extensive areas of
wetlands for pastoral use in the 1920s – around 90 percent of wetlands to date (Ministry for the
Environment, 2007).
1940s – Catchment boards established under the Soil Conservation and Rivers Control Act 1941
to reduce soil erosion and prevent damage from floods.
1953 – Waters Pollution Act 1953 introduced, creating the Pollution Advisory Council to regulate
end-of-pipe discharges into water.
1967 – Water and Soil Conservation Act 1967 sets in place a single consenting system to regulate
water use, including discharges.
1975 – Waitangi Tribunal established. The Tribunal and Treaty processes become highly
influential in shaping policy about fresh water, particularly in better recognising Māori rights and
interests in fresh water.
1981 – Wild and Scenic Rivers Bill passed into law, enabling water conservation orders to be
created in the face of mounting pressure to dam rivers for hydroelectricity schemes.
24 New Zealand’s Environmental Reporting Series: Our fresh water 2017
1987 – For the first time, dairy farming exceeds sheep farming as New Zealand’s highest-value
primary industry export (Te Ara, nd).
1991 – Resource Management Act 1991 introduced, creating an integrated consenting system for
land, water, and air, guided by the principle of ‘sustainable management’. Point sources of water
pollution become increasingly tightly controlled, sparking investment in upgrading wastewater
treatment.
2009 – Land and Water Forum established as a cross-sector collaborative with the objective of
developing a common direction for freshwater management in New Zealand and providing
advice to government.
2011 – National Policy Statement on Freshwater Management introduced, with the primary
objective of improving freshwater management by regional councils.
2014 – National Policy Statement (NPS) on Freshwater Management amended, and national
bottom lines for water quality established through the National Objectives Framework. Regional
councils have until 2025 to implement the NPS.
New Zealand’s Environmental Reporting Series: Our fresh water 2017 25
Water quality
Top findings
Nitrate-nitrogen concentrations were worsening (55 percent) at more monitored river sites
than improving (28 percent). Dissolved reactive phosphorus concentrations were improving
(42 percent) at more monitored river sites than worsening (25 percent).
E.coli concentrations affect our ability to swim in some rivers.
What is happening?
The main pressures on the quality of our fresh water result from land-based activities.
Water quality at sites where the upstream land cover is mainly urban and pastoral tends to be
poorer than sites where native land cover is dominant. Urban and pastoral sites have higher
nutrient (nitrate-nitrogen and dissolved reactive phosphorus) and E.coli concentrations, and
lower visual clarity and macroinvertebrate community index scores.
Nitrate leaching from agricultural soils has increased, which may be associated with the
worsening trends in nitrate-nitrogen at sites in catchments where pastoral land cover is
dominant. We are seeing improving trends in dissolved reactive phosphorus at many sites where
pastoral, urban, and exotic forest land cover are dominant.
Why does it matter?
When water quality declines, it influences the way people and communities use the water and
the water’s ability to support freshwater ecosystems and social and economic activities. High
nutrient concentrations can result in excessive plant and algal growth, which can reduce oxygen
levels and change the composition of plant and animal communities. Low visual clarity, toxic algal
blooms, and elevated E.coli concentrations negatively affect aesthetic values and our ability
to use fresh water for drinking or recreation. Heavy metals (such as mercury, arsenic, cadmium,
lead, copper, and zinc) can be toxic to freshwater fish and invertebrates and can accumulate in
food sources like fish and watercress, which may make them unsafe to eat. Many activities that
support our tourism industry also rely on good water quality.
Water quality is a complex concept related to the physical, chemical, and biological
characteristics of water. Water quality relates to the ‘condition’ of water as it affects a
range of water values, including biological habitat and human use (Davies-Colley, 2013).
This chapter covers:
Land-based activities are putting pressure on water quality
Modelled river water quality
Monitored water quality
Monitored river water quality
Monitored lake water quality
26 New Zealand’s Environmental Reporting Series: Our fresh water 2017
Monitored groundwater quality
Implications of deteriorating water quality
Data gaps.
Land-based activities are putting pressure on water quality What we do on the land can affect our fresh water (Parliamentary Commissioner for the
Environment, 2012). The clearing of native vegetation, New Zealand’s growing population,
urbanisation, and farming/forestry, the drainage of wetlands, and the damming and
modification of rivers and streams have all had significant effects on our land and placed
increasing pressure on our water bodies and their ecosystems.
Land-based activities can discharge nutrients to surface water and groundwater (see The
relationship between nutrients and algal growth in fresh water). The nutrients of most concern
in New Zealand’s fresh water are nitrogen and phosphorus, as they cause excessive algal
blooms and undesired plant growth (Davies-Colley, 2013). These nutrients occur naturally in
rivers, streams, lakes, and groundwater and are essential for plants to grow. However, high
nutrient concentrations can result in the excessive growth of freshwater plants and algae
(periphyton in rivers or phytoplankton in lakes), which can reduce oxygen levels and prevent
light from penetrating water, negatively affecting freshwater plant and animal species. Very
high concentrations of nitrogen, either as nitrate-nitrogen or ammoniacal nitrogen, can be
toxic to freshwater life; high nitrate-nitrogen concentrations can make water unsafe for
humans to drink.
As of 2012, pastoral land covered about 40 percent of New Zealand (Ministry for the
Environment and Statistics NZ, 2015). We assume pastoral land is used for livestock
production; however, we recognise some areas are used for other purposes, such as turf
production. In 2012, native forest land covered 24 percent, while exotic forest land covered
8 percent, cropping and horticulture land covered 2 percent, and urban land covered less than
1 percent of New Zealand. Even though agricultural land (pastoral, exotic forest, and cropping
and horticulture) covers around 50 percent of New Zealand, 87 percent of New Zealanders live
in urban areas so many people are potentially affected by degraded urban rivers.
The relationship between nutrients and algal growth in fresh water
Nitrogen and phosphorus come in many forms, which behave differently in water. This means
they have different effects when they move through the environment. Nitrate-nitrogen is a
soluble form of nitrogen and is highly mobile in water bodies. Once dissolved in water, nitrate-
nitrogen can travel across the land surface or leach through soil into groundwater, ending up in
rivers, lakes, and aquifers where it can affect water quality. Phosphorus tends to adhere to soil
particles. When these soil particles are transported to rivers and lakes, sediment-bound
phosphorus can accumulate on river and lake beds. Most phosphorus in water is bound to
sediment, but under certain conditions, it is transported in dissolved form and can be taken up by
plants and algae.
New Zealand’s Environmental Reporting Series: Our fresh water 2017 27
The concentrations and ratios of nitrogen and phosphorus in a water body are important. A
supply of both nutrients is needed for excessive algal growth to occur (generally exhibited
through periphyton in rivers and phytoplankton in lakes). An excess of nitrogen or phosphorus
alone will not lead to excessive algal growth – both need to be present in the right ratio. If a river
or lake has plenty of nitrogen to stimulate unwanted algal growth but not enough phosphorus, it
is said to be phosphorus-limited. Conversely, water bodies with plenty of phosphorus but not
enough nitrogen are nitrogen-limited. In theory, if a water body is phosphorus-limited, then
there is less need to control inputs of nitrogen to prevent excessive algal growth. However, in
many situations controlling one nutrient may be inadequate because the limiting nutrient in a
water body can be different at different times, and it can be different in different parts of the
same water body.
Periphyton is the algae found on the bed of streams and rivers. Healthy river ecosystems are
characterised by the presence of periphyton (Biggs, 2000), but high periphyton abundance can
reduce the diversity and productivity of invertebrates and fish, and erode recreational values
such as swimming and fishing. Maximum periphyton abundance is mainly determined by the
time available for biomass to accrue between floods (ie flow regime), and by nutrient (nitrogen
and phosphorus) concentrations, temperature, and light.
Source: Parliamentary Commissioner for the Environment, 2012
For more detail see Environmental indicators Te taiao Aotearoa: Land cover and Land use.
Agricultural practices have increased losses of contaminants to water bodies
New Zealand has one of the world’s highest rates of agricultural land intensification over
recent decades (but our agricultural practices have yet to reach the intensity of other areas,
such as the European Union) (OECD/Food and Agriculture Organization of the United Nations,
2015). Intensified agricultural practices put increasing pressure on our water bodies due to the
increased use of fertiliser; urine and faecal matter deposited by livestock; the taking of fresh
water for irrigation; accelerated erosion from forestry, livestock, and cultivated soils; and
infrastructure and housing development (Davies-Colley, 2013).
Agricultural intensification has been underway in parts of New Zealand since the late 1970s, as
indicated by increased stocking rates and yields; increased fertiliser, pesticides, and food stock
inputs; and conversion to more intensive forms of agriculture, such as dairying (MacLeod &
Moller, 2006). The rates of land-use change and the rates of intensification (both increasing
and decreasing) vary in different parts of New Zealand (Anastasiadis & Kerr, 2013).
As dairy products have become more profitable over recent decades, many farmers have
moved away from sheep farming to more intensive dairy farming (DairyNZ, 2013; see figure 2).
In 2015, New Zealand farmed about 29 million sheep, 10 million cattle (6.5 million for dairy),
and 900,000 deer. From 1994 to 2015, sheep numbers decreased 41 percent and dairy cattle
increased 69 percent (Statistics NZ, 2015a). The largest numbers of dairy cattle are in Waikato
(1.76 million), followed by Canterbury (1.25 million) and Southland (0.73 million). Canterbury
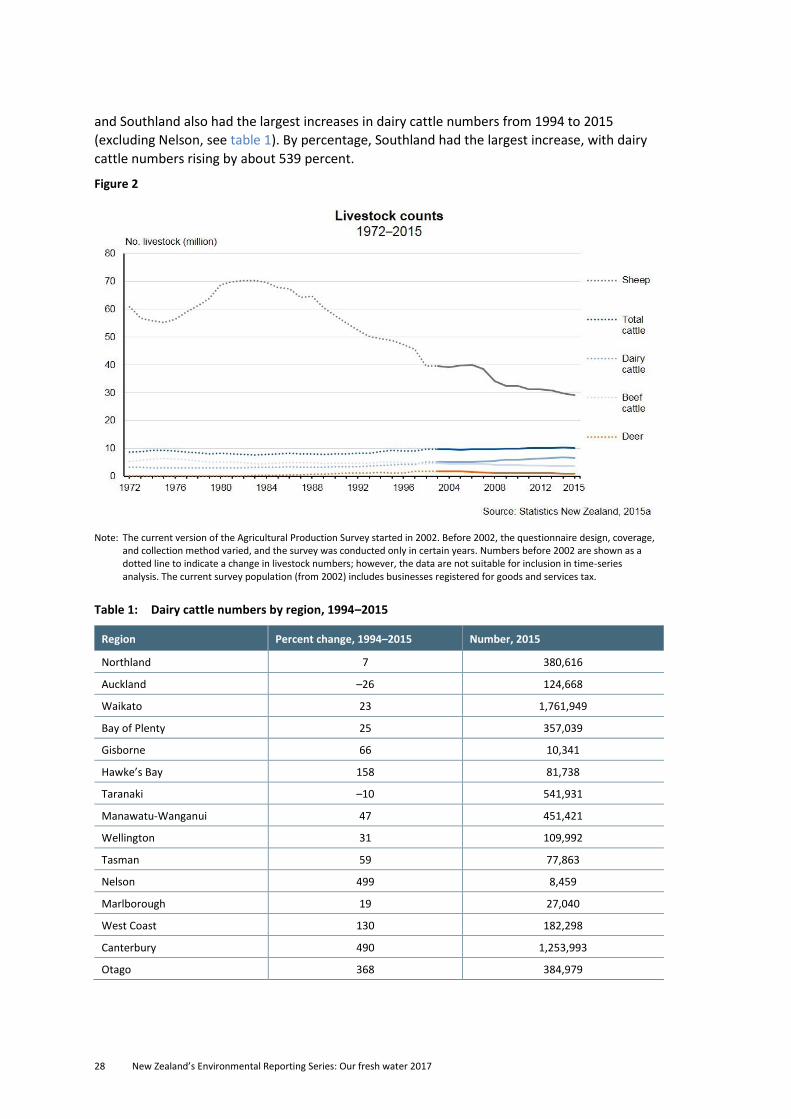
28 New Zealand’s Environmental Reporting Series: Our fresh water 2017
and Southland also had the largest increases in dairy cattle numbers from 1994 to 2015
(excluding Nelson, see table 1). By percentage, Southland had the largest increase, with dairy
cattle numbers rising by about 539 percent.
Figure 2
Note: The current version of the Agricultural Production Survey started in 2002. Before 2002, the questionnaire design, coverage,
and collection method varied, and the survey was conducted only in certain years. Numbers before 2002 are shown as a dotted line to indicate a change in livestock numbers; however, the data are not suitable for inclusion in time-series analysis. The current survey population (from 2002) includes businesses registered for goods and services tax.
Table 1: Dairy cattle numbers by region, 1994–2015
Region Percent change, 1994–2015 Number, 2015
Northland 7 380,616
Auckland –26 124,668
Waikato 23 1,761,949
Bay of Plenty 25 357,039
Gisborne 66 10,341
Hawke’s Bay 158 81,738
Taranaki –10 541,931
Manawatu-Wanganui 47 451,421
Wellington 31 109,992
Tasman 59 77,863
Nelson 499 8,459
Marlborough 19 27,040
West Coast 130 182,298
Canterbury 490 1,253,993
Otago 368 384,979
New Zealand’s Environmental Reporting Series: Our fresh water 2017 29
Region Percent change, 1994–2015 Number, 2015
Southland 539 731,209
Chatham Islands –100 0
Total New Zealand 69 6,485,535
Note: The current version of the Agricultural Production Survey started in 2002. Before 2002, questionnaire design, coverage, and collection method varied, and the survey was conducted only in certain years. The current survey population (from 2002) includes businesses registered for goods and services tax.
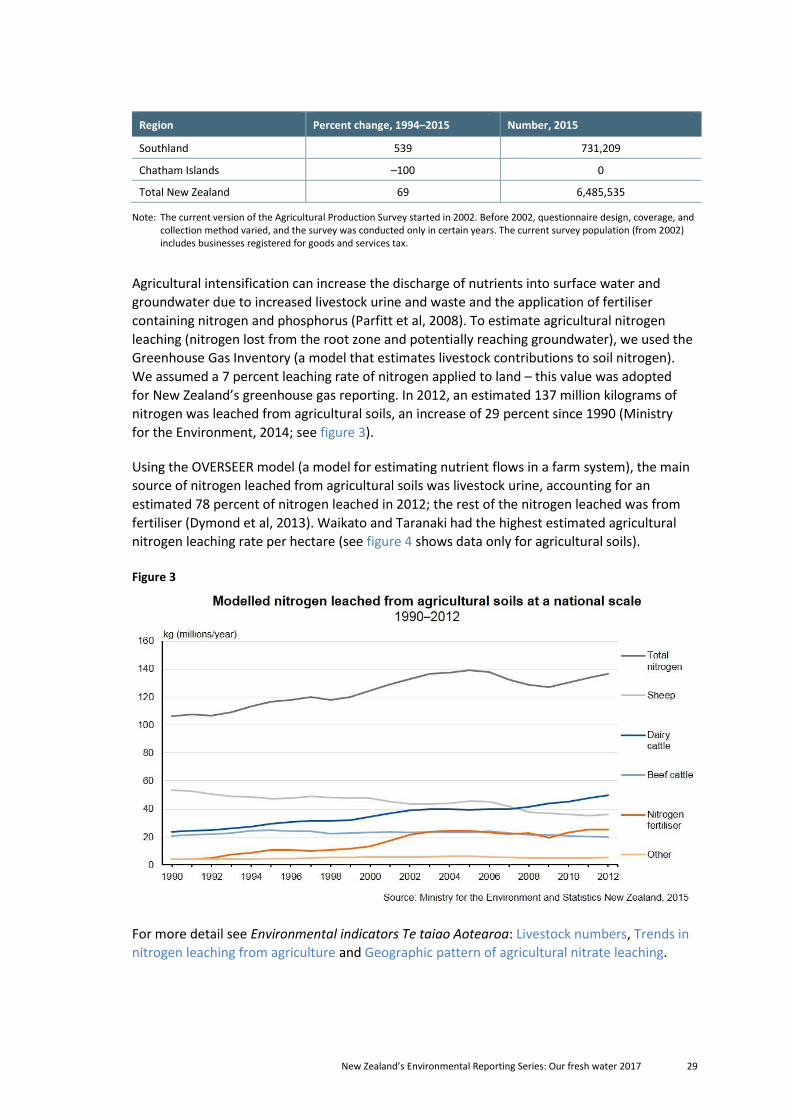
Agricultural intensification can increase the discharge of nutrients into surface water and
groundwater due to increased livestock urine and waste and the application of fertiliser
containing nitrogen and phosphorus (Parfitt et al, 2008). To estimate agricultural nitrogen
leaching (nitrogen lost from the root zone and potentially reaching groundwater), we used the
Greenhouse Gas Inventory (a model that estimates livestock contributions to soil nitrogen).
We assumed a 7 percent leaching rate of nitrogen applied to land – this value was adopted
for New Zealand’s greenhouse gas reporting. In 2012, an estimated 137 million kilograms of
nitrogen was leached from agricultural soils, an increase of 29 percent since 1990 (Ministry
for the Environment, 2014; see figure 3).
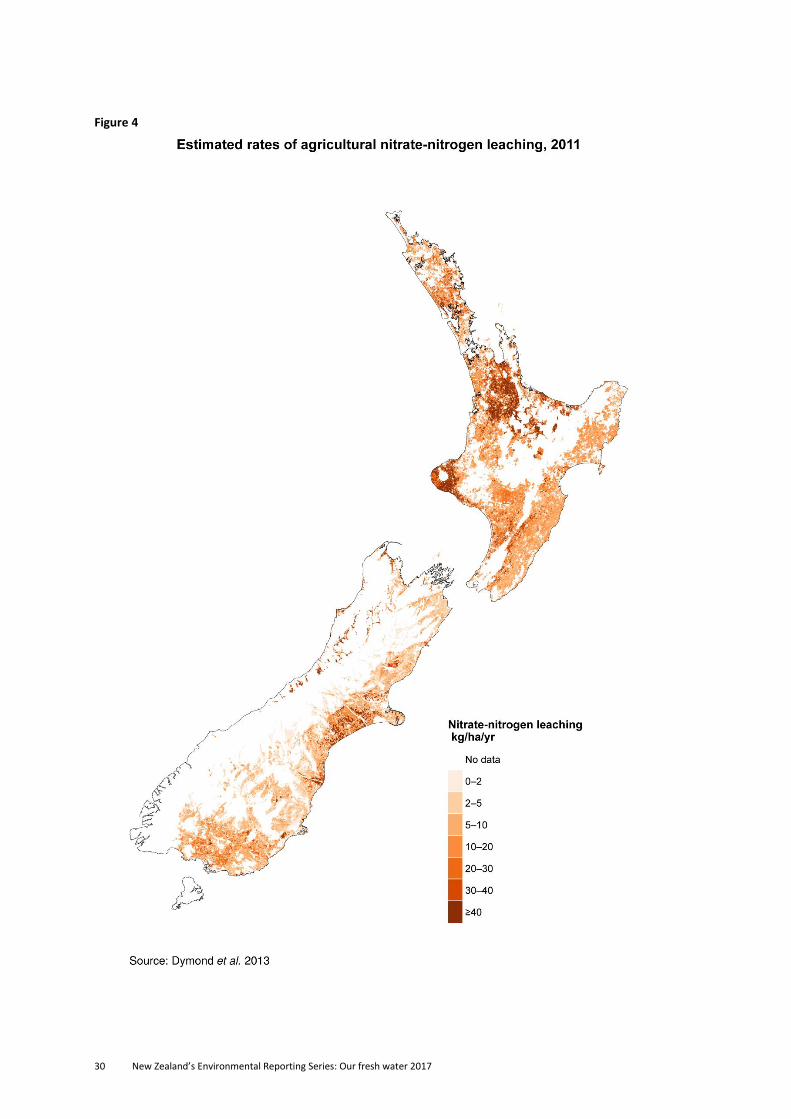
Using the OVERSEER model (a model for estimating nutrient flows in a farm system), the main
source of nitrogen leached from agricultural soils was livestock urine, accounting for an
estimated 78 percent of nitrogen leached in 2012; the rest of the nitrogen leached was from
fertiliser (Dymond et al, 2013). Waikato and Taranaki had the highest estimated agricultural
nitrogen leaching rate per hectare (see figure 4 shows data only for agricultural soils).
Figure 3
For more detail see Environmental indicators Te taiao Aotearoa: Livestock numbers, Trends in
nitrogen leaching from agriculture and Geographic pattern of agricultural nitrate leaching.
30 New Zealand’s Environmental Reporting Series: Our fresh water 2017
Figure 4
New Zealand’s Environmental Reporting Series: Our fresh water 2017 31
Urban run-off and modification of water bodies are degrading water quality
New Zealand’s population grew 17 percent from 1996 to 2013 (Statistics NZ, 2013) driving a
10 percent (20,922 hectares) increase in urban land area over a similar period from 1996 to
2012 (Ministry for the Environment and Statistics NZ, 2015).
Urban streams typically have flashy flows (rapid increases and decreases in peak flows),
elevated concentrations of nutrients and contaminants, highly modified channels, and
reduced biodiversity with more ‘tolerant’ species that can thrive in streams with poor water
quality (Walsh et al, 2005). These streams typically have increased bank erosion and sediment
transport, compared with native streams, which results in more sediments deposited in
estuaries (NIWA, nd).
Urban areas have three types of water infrastructure – stormwater (rainwater plus any
contaminants it picks up on surfaces and carriers through the system), wastewater (water
used in houses, businesses, or industrial processes), and potable water (for drinking water
supply). In this section we discuss the negative effects stormwater and wastewater can have
on urban streams.
Stormwater run-off can contain elevated concentrations of heavy metals (Lewis et al, 2015).
These metals come from sources such as vehicle wear (copper from brake pads and zinc
from tyres), metal roofing, and industrial yards (Kennedy & Sutherland, 2008). Metals are
transported by stormwater into urban streams (either by pipes or run-off from surfaces
directly into streams), and can accumulate in sediment and plant and animal tissue to
concentrations that are toxic to freshwater life. Nutrients can also enter urban streams
through the stormwater system, from spills, fertiliser used on lawns, and golf courses (eg
Webster & Timperley, 2004).
Urbanisation causes vegetation to be removed and soil to be covered by impervious surfaces
such as roofing, asphalt and concrete that do not absorb water. This leads to increased
stormwater volumes and peak flows (Suren & Elliot, 2004). The degree of contamination of
surface water is linked to the amount of impervious area, as impervious surfaces and pipes
sometimes direct stormwater run-off straight into urban streams (Lewis et al, 2015).
Permeable areas in urban environments (eg lawns and gardens) allow run-off to soak into the
ground rather than wash off hard, impervious areas, directly entering streams and stormwater
systems. Currently, we do not have national information on the extent of impervious surfaces
in New Zealand.
Wastewater networks carry waste from houses and businesses to treatment plants.
Wastewater can contain many contaminants, in particular nutrients and faecal pathogens
(indicated by E.coli).
Combined stormwater/wastewater networks, illegal connections to the network, and leaky
pipes, pumps, and connections in urban environments have caused nutrients and pathogens to
enter urban streams. Many combined stormwater/wastewater networks also have consented
overflows for storm periods, meaning that wastewater is permitted to overflow into
stormwater systems during storms (NIWA, nd). In some areas, we have moved away from
32 New Zealand’s Environmental Reporting Series: Our fresh water 2017
historic combined stormwater and wastewater systems to networks that only convey and treat
wastewater and minimise the risk of overflows.
Infrastructure not appropriately designed, maintained, and replaced when necessary can
have negative impacts on urban streams. The replacement value of the entire national
infrastructure network for wastewater and stormwater is $36.7 billion (Department of Internal
Affairs analysis of local authority annual reports). This does not include any new infrastructure,
only the replacement of existing infrastructure. From a national perspective, one-quarter of
wastewater assets are more than 50 years old, with between 10 and 20 percent of the graded
network requiring significant renewal or replacement (Local Government NZ, 2014). Some
councils have made recent investments (such as Tauranga), whereas other councils have much
older networks.
Modelled river water quality
River water quality guidelines
Having discussed the pressures on freshwater quality in New Zealand, we now examine the
current state of water quality.
New Zealand has compulsory values that regional councils must set objectives and limits for
– these values are for ‘ecosystem health’ and ‘human health for recreation’. The compulsory
values, and their associated water quality attributes, are in the National Objectives Framework
(NOF) that is part of the National Policy Statement for Freshwater Management (New Zealand
Government, 2014). The framework consists of ‘attribute states’ that describe different effects
pertaining to an attribute and a ‘bottom line’ for the minimum acceptable state, which should
not be exceeded. These are regulations set by the Government.
We also look at the macroinvertebrate community index, a water quality indicator that scores
a water sample in four groups from ‘poor’ to ‘excellent’. Macroinvertebrate taxa tolerate
contaminants in different ways – the composition of invertebrates at a site provides
information about the site’s water quality. This information is the basis for the
macroinvertebrate community index.
We compare river water quality results against the attribute states for the compulsory value in
the National Objectives Framework and the macroinvertebrate community index guidelines
(see table 2; New Zealand Government, 2014; Stark & Maxted, 2007).
New Zealand’s Environmental Reporting Series: Our fresh water 2017 33
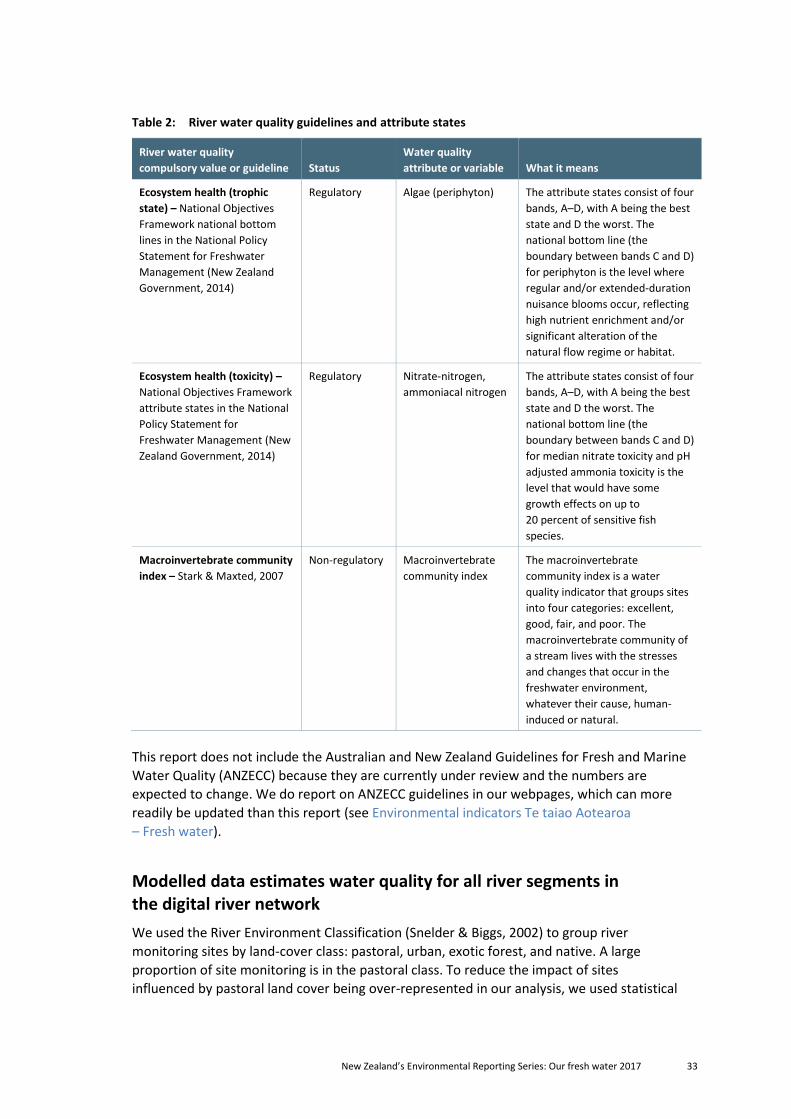
Table 2: River water quality guidelines and attribute states
River water quality
compulsory value or guideline Status
Water quality
attribute or variable What it means
Ecosystem health (trophic
state) – National Objectives
Framework national bottom
lines in the National Policy
Statement for Freshwater
Management (New Zealand
Government, 2014)
Regulatory Algae (periphyton) The attribute states consist of four
bands, A–D, with A being the best
state and D the worst. The
national bottom line (the
boundary between bands C and D)
for periphyton is the level where
regular and/or extended-duration
nuisance blooms occur, reflecting
high nutrient enrichment and/or
significant alteration of the
natural flow regime or habitat.
Ecosystem health (toxicity) –
National Objectives Framework
attribute states in the National
Policy Statement for
Freshwater Management (New
Zealand Government, 2014)
Regulatory Nitrate-nitrogen,
ammoniacal nitrogen
The attribute states consist of four
bands, A–D, with A being the best
state and D the worst. The
national bottom line (the
boundary between bands C and D)
for median nitrate toxicity and pH
adjusted ammonia toxicity is the
level that would have some
growth effects on up to
20 percent of sensitive fish
species.
Macroinvertebrate community
index – Stark & Maxted, 2007
Non-regulatory Macroinvertebrate
community index
The macroinvertebrate
community index is a water
quality indicator that groups sites
into four categories: excellent,
good, fair, and poor. The
macroinvertebrate community of
a stream lives with the stresses
and changes that occur in the
freshwater environment,
whatever their cause, human-
induced or natural.
This report does not include the Australian and New Zealand Guidelines for Fresh and Marine
Water Quality (ANZECC) because they are currently under review and the numbers are
expected to change. We do report on ANZECC guidelines in our webpages, which can more
readily be updated than this report (see Environmental indicators Te taiao Aotearoa
– Fresh water).
Modelled data estimates water quality for all river segments in the digital river network
We used the River Environment Classification (Snelder & Biggs, 2002) to group river
monitoring sites by land-cover class: pastoral, urban, exotic forest, and native. A large
proportion of site monitoring is in the pastoral class. To reduce the impact of sites
influenced by pastoral land cover being over-represented in our analysis, we used statistical
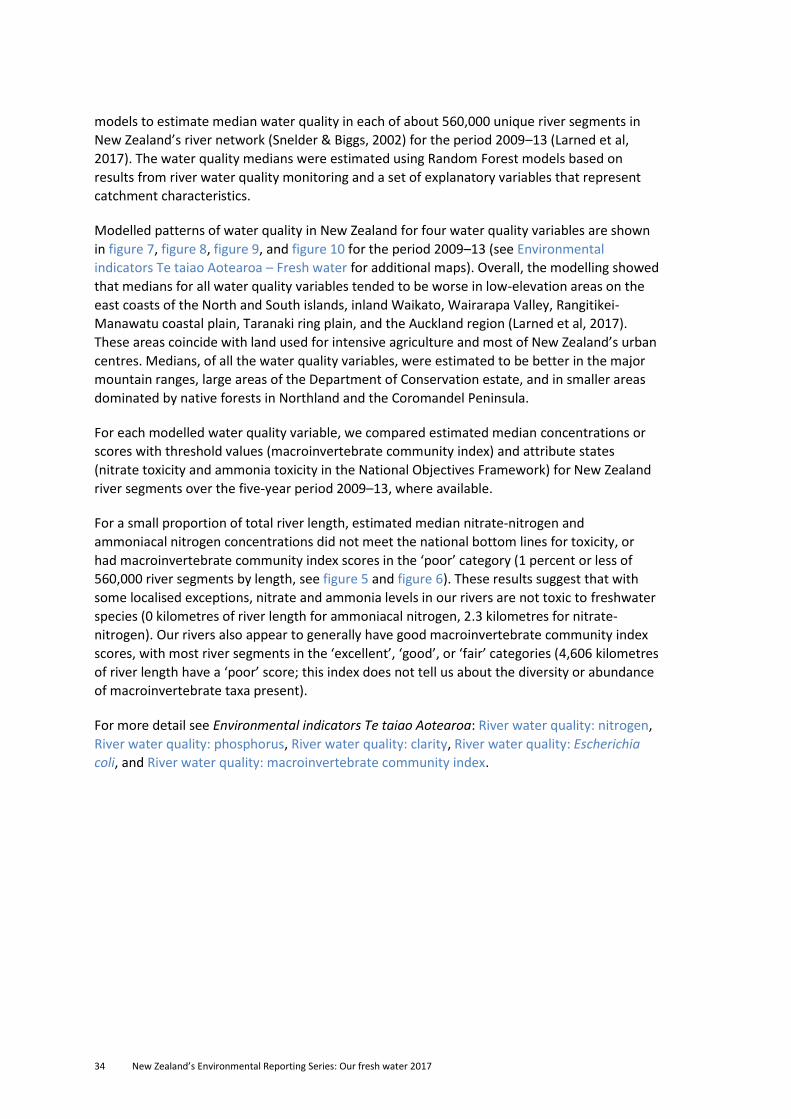
34 New Zealand’s Environmental Reporting Series: Our fresh water 2017
models to estimate median water quality in each of about 560,000 unique river segments in
New Zealand’s river network (Snelder & Biggs, 2002) for the period 2009–13 (Larned et al,
2017). The water quality medians were estimated using Random Forest models based on
results from river water quality monitoring and a set of explanatory variables that represent
catchment characteristics.
Modelled patterns of water quality in New Zealand for four water quality variables are shown
in figure 7, figure 8, figure 9, and figure 10 for the period 2009–13 (see Environmental
indicators Te taiao Aotearoa – Fresh water for additional maps). Overall, the modelling showed
that medians for all water quality variables tended to be worse in low-elevation areas on the
east coasts of the North and South islands, inland Waikato, Wairarapa Valley, Rangitikei-
Manawatu coastal plain, Taranaki ring plain, and the Auckland region (Larned et al, 2017).
These areas coincide with land used for intensive agriculture and most of New Zealand’s urban
centres. Medians, of all the water quality variables, were estimated to be better in the major
mountain ranges, large areas of the Department of Conservation estate, and in smaller areas
dominated by native forests in Northland and the Coromandel Peninsula.
For each modelled water quality variable, we compared estimated median concentrations or
scores with threshold values (macroinvertebrate community index) and attribute states
(nitrate toxicity and ammonia toxicity in the National Objectives Framework) for New Zealand
river segments over the five-year period 2009–13, where available.
For a small proportion of total river length, estimated median nitrate-nitrogen and
ammoniacal nitrogen concentrations did not meet the national bottom lines for toxicity, or
had macroinvertebrate community index scores in the ‘poor’ category (1 percent or less of
560,000 river segments by length, see figure 5 and figure 6). These results suggest that with
some localised exceptions, nitrate and ammonia levels in our rivers are not toxic to freshwater
species (0 kilometres of river length for ammoniacal nitrogen, 2.3 kilometres for nitrate-
nitrogen). Our rivers also appear to generally have good macroinvertebrate community index
scores, with most river segments in the ‘excellent’, ‘good’, or ‘fair’ categories (4,606 kilometres
of river length have a ‘poor’ score; this index does not tell us about the diversity or abundance
of macroinvertebrate taxa present).
For more detail see Environmental indicators Te taiao Aotearoa: River water quality: nitrogen,
River water quality: phosphorus, River water quality: clarity, River water quality: Escherichia
coli, and River water quality: macroinvertebrate community index.
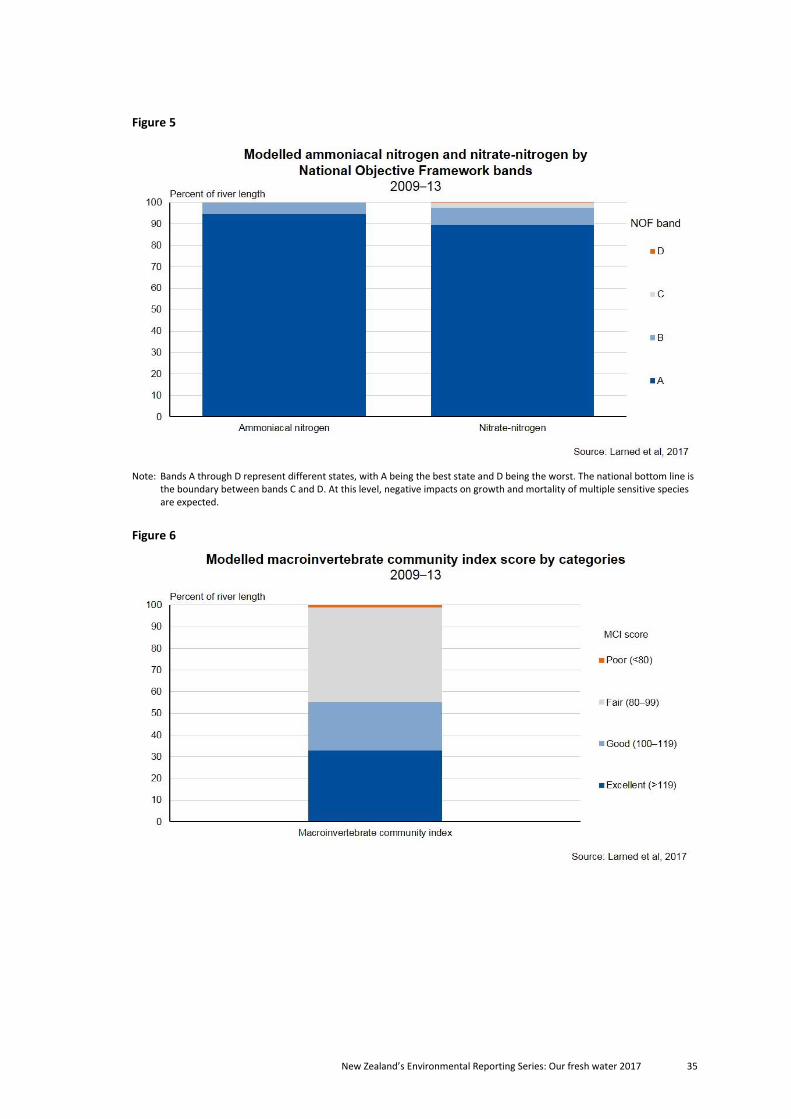
New Zealand’s Environmental Reporting Series: Our fresh water 2017 35
Figure 5
Note: Bands A through D represent different states, with A being the best state and D being the worst. The national bottom line is
the boundary between bands C and D. At this level, negative impacts on growth and mortality of multiple sensitive species are expected.
Figure 6
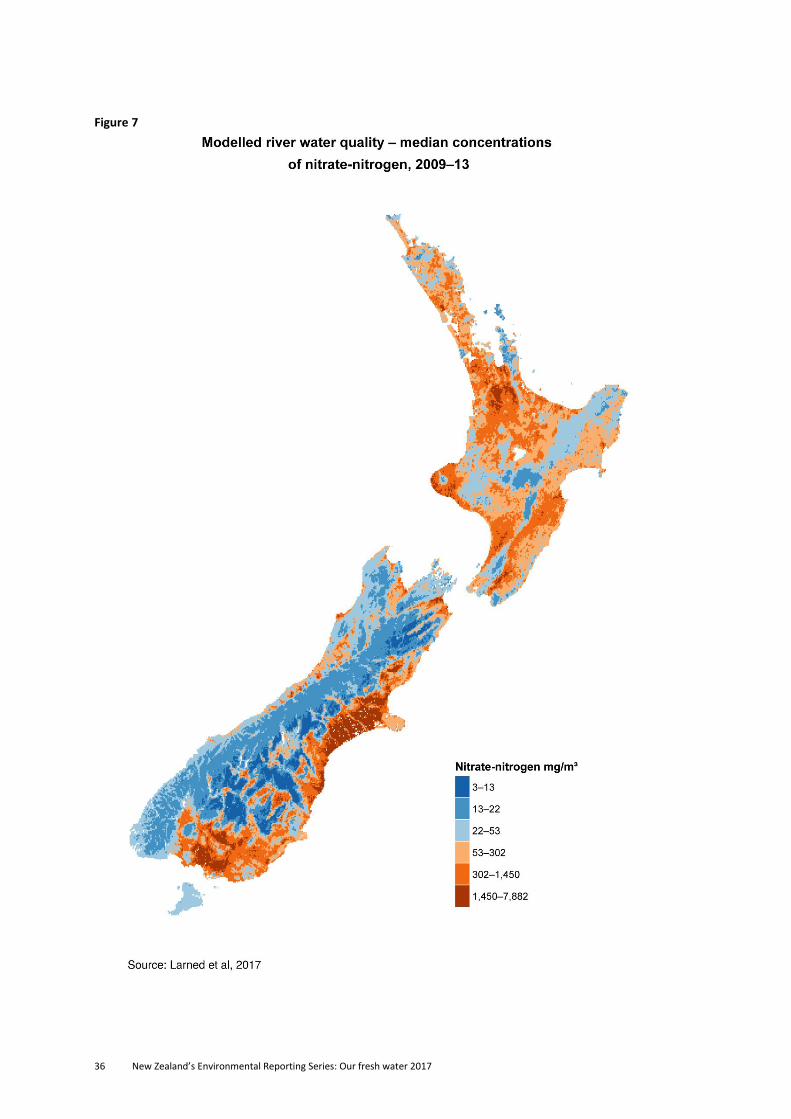
36 New Zealand’s Environmental Reporting Series: Our fresh water 2017
Figure 7
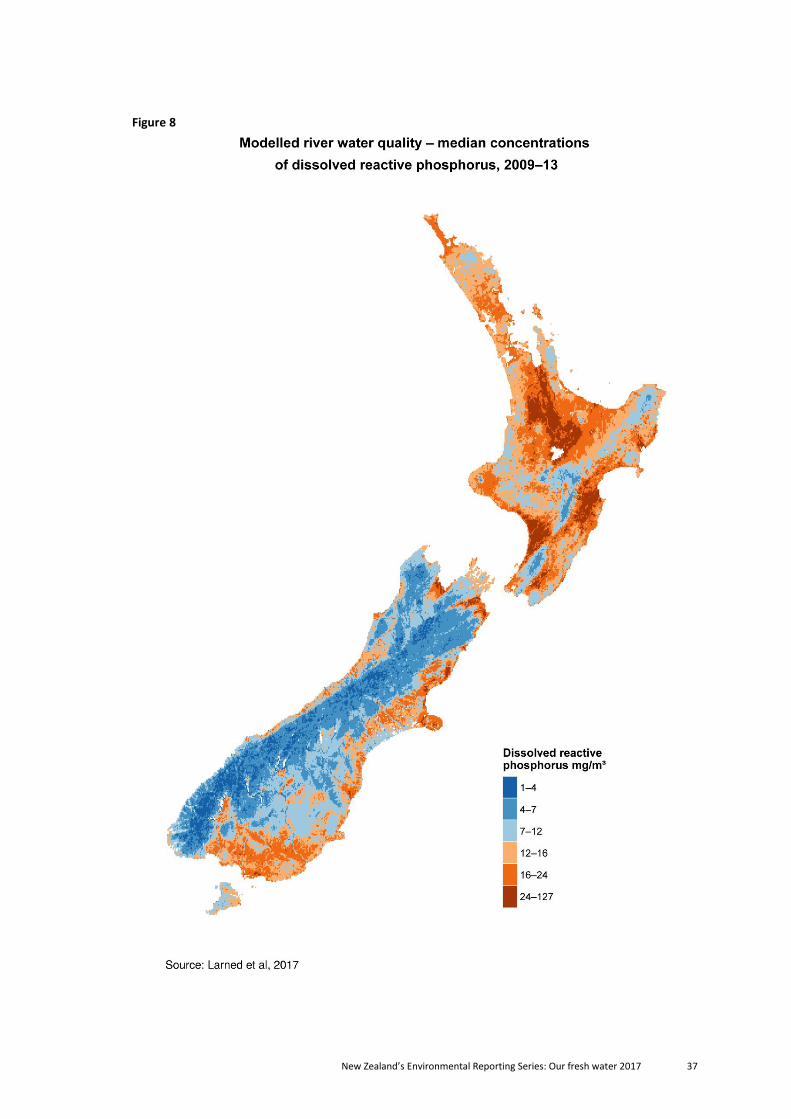
New Zealand’s Environmental Reporting Series: Our fresh water 2017 37
Figure 8
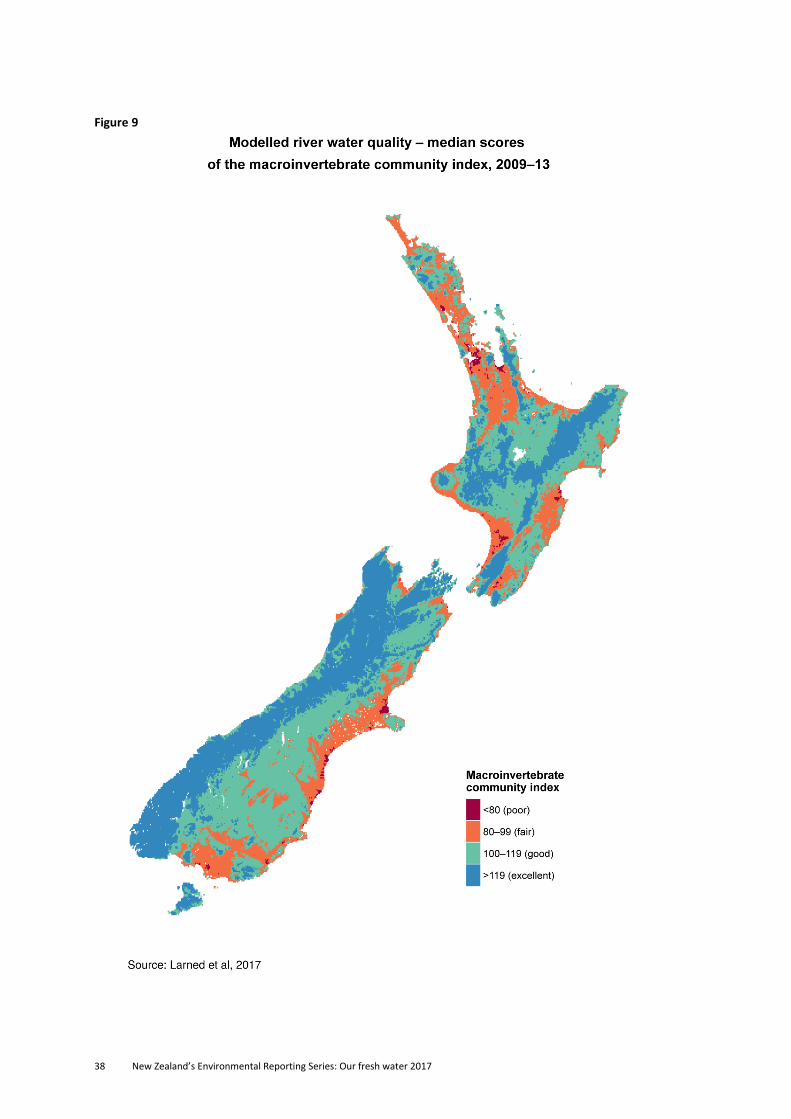
38 New Zealand’s Environmental Reporting Series: Our fresh water 2017
Figure 9
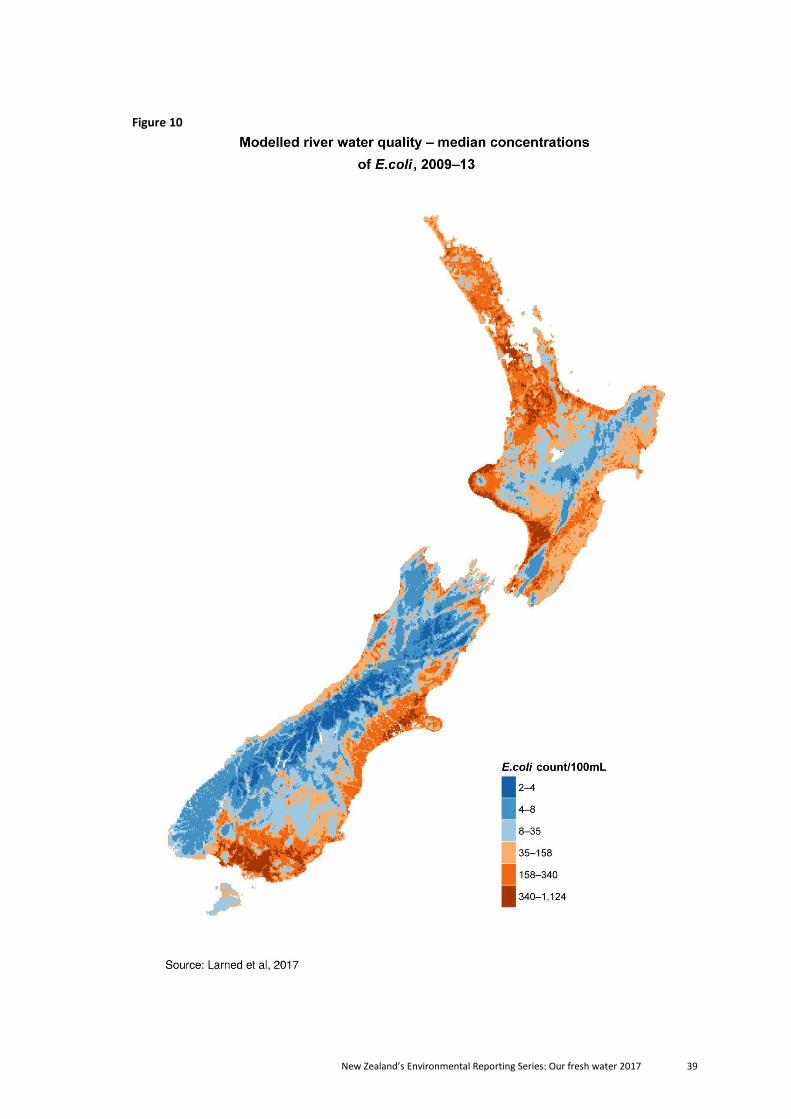
New Zealand’s Environmental Reporting Series: Our fresh water 2017 39
Figure 10
40 New Zealand’s Environmental Reporting Series: Our fresh water 2017
Models suggest 83 percent of total river length for large rivers was not expected to have regular or extended algal blooms
Many studies both nationally and internationally indicate that the responses of stream
periphyton to nutrients are complex and influenced by many factors such as light, flow history,
and species composition (Larned, 2010). Nutrient concentration thresholds to achieve
periphyton objectives are therefore always uncertain and must be considered along other
factors such as river flow regime and shading. In New Zealand, several guidelines and decision-
support systems help define nutrient thresholds to manage periphyton growth. The most
robust thresholds are specific to different stream types because of the strong influence that
variation in flow regime, substrate, and other factors have on periphyton abundance.
To quantify the geographic extent of potential nutrient-periphyton issues, this report
combined national nutrient thresholds with modelled nitrogen and phosphorus concentrations
(Larned et al, 2015). The resulting analysis estimates the extent of river segments by length
that do not achieve the national bottom line for periphyton in the National Objectives
Framework (New Zealand Government, 2014).
National scale models of periphyton abundance were derived using the method of Snelder
et al (2014) for the 77 National River Water Quality Network (NRWQN) sites. The models
predict periphyton abundance as a function of total nitrogen, dissolved reactive phosphorus,
hydrological indexes, measures of sunlight, and temperature. The model response variable
(periphyton cover) was converted to chlorophyll-a concentration using a correlation between
the two abundance measures described by Larned et al, (2015). The models were then used to
derive total nitrogen and dissolved reactive phosphorus concentration thresholds for each of
23 River Environment Classification (REC) ‘source of flow’ classes (source of flow distinguishes
different river types based on the catchment climate and topography) (Larned et al, 2015).
An assessment of every segment of the REC digital river network, stream order 3 and greater,
was made by comparing estimated total nitrogen and dissolved reactive phosphorus
concentrations (Larned et al, 2017) with the relevant total nitrogen and dissolved reactive
phosphorus criteria. Only segments of order 3 and greater were included, because the input
periphyton data to the model was from large river sites (NRWQN sites), so we do not have
confidence in the model for lower stream orders.
The assessment first considered whether the segment was able to support conspicuous
periphyton. This assessment classified bed substrate into fine or coarse using predicted bed
material grain size as described by Snelder et al (2013). Segments classified as having fine bed
substrate were assumed to not support conspicuous periphyton, so applying nutrient
concentration criteria to manage periphyton biomass is not warranted for these segments.
These segments occur in low gradient areas where fine sediments accumulate and stream
power is insufficient to move larger material (eg gravel and cobbles).
The models underlying this analysis are uncertain and the thresholds were derived from
periphyton and environmental data collected from a limited number of sites that are
representative of large New Zealand rivers. The resulting analysis is therefore uncertain and
should be considered as only indicative of periphyton issues nationally.
New Zealand’s Environmental Reporting Series: Our fresh water 2017 41
Of the total river length in New Zealand’s digital river network of stream order 3 and
greater, estimated periphyton abundance in 17 percent of total river length (approximately
1,708 kilometres) did not meet the national bottom line for periphyton. In 60 percent of the
modelled river length (5,988 kilometres) estimated periphyton abundance was estimated to be
less than the national bottom line. The remaining 23 percent of river length (2,355 kilometres)
has fine bed substrate, and are presumed to mean that periphyton growth is generally
not supported.
Regional council periphyton monitoring has expanded since the National Objectives
Framework in the National Policy Statement for Freshwater Management was released
in 2014. In future reports, we intend to report on the results of those periphyton
monitoring programmes.
Public health considerations for swimming in rivers
Animal and human faeces in fresh water can increase the risk of infection from faecal
pathogens for those who come in contact with the water.
E.coli is used as an indicator of faecal matter present in fresh water. High concentrations of
E.coli are associated with the risk of infection by Campylobacter (a gastrointestinal illness).
This section focuses on the public health risks for swimming in rivers , and not on other factors
that may affect the ability to swim in a water body. Although we have yet to develop an
indicator for tracking the change in risk from faecal contamination over time, we present the
results of our initial work on rivers. In future we will expand this work to include lakes.
See Technical note on the initial assessment of modelled E.coli data for details on the work
completed so far. This is an area where data collection and modelling practices are evolving, so
it will take time to develop an indicator.
Many factors determine the health risks from recreational activities in rivers. E.coli is one of
these. The concentration of E.coli varies over time in any given river. The exposure to risk is a
complex interaction between a specific activity and its duration, and the E.coli concentration of
the specific water body at the time of recreation. For example, the risk from E.coli would be
different if a person was immersed in the water (such as swimming, where water may be
swallowed) as opposed to being on the water (such as fishing), and whether it was a quick dip
or a longer session.
To provide information on the risk of exposure to E.coli during recreational activities in
rivers, it is necessary to define what we mean by ‘swimmable’ and how it relates to the risk of
infection from pathogens. Our analysis used the grade and category system outlined in the
Clean Water Package released in February 2017 (Ministry for the Environment, 2017), as
opposed to current attribute states in the National Objectives Framework 2014. The Clean
Water package assigns rivers to one of five grades (excellent, good, fair, poor, and very poor).
The top three grades combine to a swimmable category; the last two grades would not be
considered swimmable.
42 New Zealand’s Environmental Reporting Series: Our fresh water 2017
Snelder et al (2016) used statistical models to estimate E.coli concentrations in each of
approximately 560,000 unique river segments in New Zealand’s river network. We only looked
at river segments of stream order 4 and higher, as these are rivers considered large enough to
swim in. The dataset used to inform the model is based on E.coli data collected between 1990
and 2013 (monitoring longevity varies across sites).
There are a number of statistics which describe and quantify E.coli values. Snelder et al, (2016)
used four approaches for quantifying E.coli values:
median E.coli concentration (half the values are above/below this value)
E.coli concentration as a 95th percentile (95 percent of the numbers are below this value
– this is the statistic used in the National Objectives Framework)
percent exceedances of the current upper threshold of 540 E.coli
percent exceedances of the lower threshold of 260 E.coli.
The 95th percentile statistic was the most imprecisely modelled of all four statistics, so we
have excluded it from our results (see Technical note on the initial assessment of modelled
E.coli data for commentary on its statistical performance) (analysed by Stats NZ). The
remaining three statistics have such a high level of agreement that any combination will show
an estimated 65–70 percent of segments fall under the ‘swimmable’ category.
This differs from the 72 percent figure stated in the Clean Water Package which includes both
rivers and lakes, and takes into account adjustments made to reflect knowledge from regional
councils and other sources.
The overall health risk from the three statistics in the swimmable category averaged over time
is between 1 and 3.5 percent (Prime Minister’s Chief Science Advisor, 2017). The actual risk
depends on the E.coli concentration at the time of activity, which is why councils undertake
monitoring at popular swimming spots during summer. For the most up-to-date information
on your local swimming spot, see Land Air Water Aotearoa.
Along with pathogens from faecal contamination, many other factors affect the ability to swim
in a particular water body. These include low water clarity, fast currents, rocks, dense weed
beds, and toxic cyanobacteria (see Toxic cyanobacteria in Greater Wellington rivers).
Toxic cyanobacteria in Greater Wellington rivers
Toxic cyanobacteria in a water body is another public health concern when swimming. Toxic
cyanobacteria form distinctive black or brown to dark green mats, and have an earthy, musty
odour, especially when they break free from the riverbed and collect along the shoreline.
People should avoid contact with cyanobacteria mats, and dogs and livestock should be kept
away from them.
Many regional councils monitor cyanobacteria. Here we present a case study looking at the
Greater Wellington region.
When five dogs died in the summer of 2005/06 after consuming toxic cyanobacteria, the Greater
Wellington Regional Council began monitoring the abundance of cyanobacteria in its rivers and
New Zealand’s Environmental Reporting Series: Our fresh water 2017 43
streams. Cyanobacteria, sometimes called blue-green algae, are an important and naturally
occurring component of freshwater ecosystems. Some species produce toxins that can be
harmful if present in drinking water or if humans come into contact with them through activities
such as swimming. Dogs are particularly susceptible because they are drawn to the odour of
some river cyanobacteria, and more than 70 dog deaths have been reported across New Zealand
since 2006.
Monitoring and research by the Greater Wellington Regional Council showed large gravel-bed
rivers, such as the Hutt and Waipoua rivers, have the largest and most frequent toxic
cyanobacteria blooms. Combined low levels of dissolved reactive phosphorus and moderately
elevated nitrate-nitrogen concentrations appear to foster the growth of cyanobacteria blooms in
some Wellington rivers.
Source: Greater Wellington Regional Council, 2016
Monitored water quality The data we used for the state and trend analyses in this section come from regional councils
(data from monitored rivers, lakes, and groundwater sites), NIWA’s National River Water
Quality Network, and GNS Science’s National Groundwater Monitoring Programme.
Percentages may not add up to 100 percent, as they are rounded to the nearest percent.
Regional compared with national level reporting
Two issues affect national-level reporting of water quality, which is based on a collection of
data from regional councils.
Regional council monitoring networks in New Zealand are over-represented by sites in the 1.
pastoral class, and under-represented by sites in the native class (Larned & Unwin, 2012).
This is because most councils monitor areas with known or suspected issues for
management purposes. For example, rivers in low-lying and hilly areas in the North and
South islands are well represented, while mountainous areas in the South Island and parts
of the central North Island are not. This means our current monitoring networks do not
provide a representative picture of water quality for all New Zealand rivers.
Although our data are sourced from regional councils, we adjusted some datasets to 2.
ensure our reports are nationally consistent. The adjustments may include omitting
information produced by non-comparable methods. As a result, our evaluations may differ
from those based on the original data. If you want detailed regional-level information, we
recommend you review the relevant regional council’s environmental reports.
We have similar issues in our lake and groundwater quality data.
Very few lakes are monitored in a consistent way. In this report, we report on between 48 and
76 lake sites, depending on the water quality variable.
44 New Zealand’s Environmental Reporting Series: Our fresh water 2017
Inconsistencies in the monitoring of groundwater quality include different sampling methods
and frequencies of sampling that make it difficult to create a national picture of the state of,
and trends in, groundwater quality. The National Groundwater Monitoring Programme
network consists of 106 sites monitored quarterly by GNS Science using a consistent set of
variables. The number of sites sampled, sampling frequency (from monthly to annually),
sampling methods, and the variables measured for groundwater quality vary between regions.
Due to these issues, we do not show spatial results (ie on maps) of water quality from
monitoring sites. Instead, we use numbers and proportions of monitoring sites to report on
water quality at a national scale and rely on the water quality models in the previous section to
show spatial patterns. If you are interested in seeing spatial representations of water quality
from monitoring sites, see our dynamic maps at Environmental indicators Te taiao Aotearoa
– Fresh water.
Classification of water quality sites
We classified the results from the monitoring of river water quality by land-cover class
under the River Environment Classification (Snelder & Biggs, 2002). We used four land-cover
classes: pastoral, urban, exotic forest, and native. The River Environment Classification assigns
land-cover classes based on the land cover in the upstream catchment that is presumed to
dominate conditions in surface water. Monitoring sites assigned to a particular land-cover class
may have other land-cover classes upstream, and this variation in land cover can contribute to
variation in water quality between sites. The majority of the monitoring sites we report on for
river water quality are in the pastoral land-cover class. Because of this, the results we present
in the sections below are for sites in the pastoral class, with supporting graphs that show
results for all four land-cover classes.
We did not classify lake water quality sites in this report; we considered classifying them by
lake type but the small sample size in each class made the accuracy of this inter-class
comparison questionable.
We did not classify our groundwater quality sites in this report.
In future reports, we will explore options for classifying our river, lake, and groundwater sites.
Trend assessments
We used two trend-assessment methods for water quality: one for rivers and lakes, and
another for groundwater. We used different trend tests because we trialled a new approach
for river and lake water quality (Larned et al, 2015).
Trends for river and lake water quality variables were inferred with 95 percent confidence 1.
using the Relative Seasonal Sen Slope Estimator (Larned et al, 2015). A trend can either be
‘upwards’, ‘downwards’, or ‘insufficient data to determine trend direction’ (which we
refer to as ‘indeterminate’). Data used to determine the trends for river water quality
(except for macroinvertebrate community index) were adjusted for the influence of
variation in river flow, because values may be correlated with flow. Where flow
measurements were not available, flow was estimated using theTopNet national
hydrological model (Larned et al, 2015).
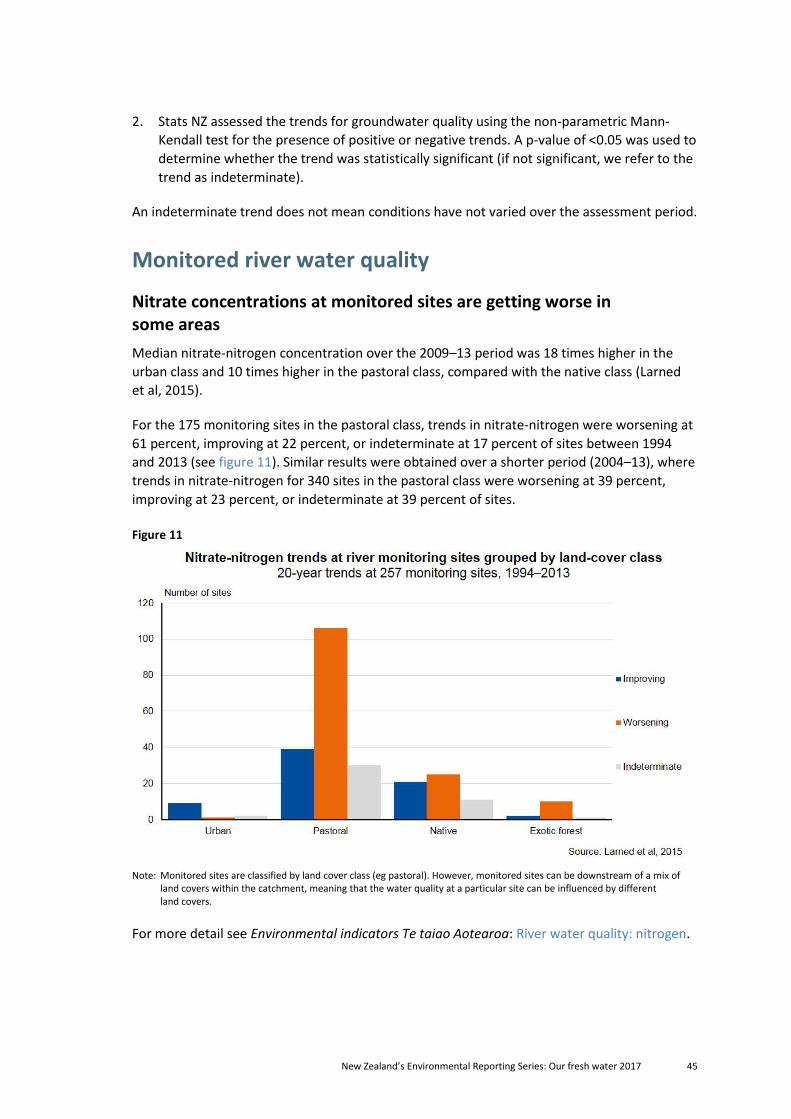
New Zealand’s Environmental Reporting Series: Our fresh water 2017 45
Stats NZ assessed the trends for groundwater quality using the non-parametric Mann-2.
Kendall test for the presence of positive or negative trends. A p-value of <0.05 was used to
determine whether the trend was statistically significant (if not significant, we refer to the
trend as indeterminate).
An indeterminate trend does not mean conditions have not varied over the assessment period.
Monitored river water quality
Nitrate concentrations at monitored sites are getting worse in some areas
Median nitrate-nitrogen concentration over the 2009–13 period was 18 times higher in the
urban class and 10 times higher in the pastoral class, compared with the native class (Larned
et al, 2015).
For the 175 monitoring sites in the pastoral class, trends in nitrate-nitrogen were worsening at
61 percent, improving at 22 percent, or indeterminate at 17 percent of sites between 1994
and 2013 (see figure 11). Similar results were obtained over a shorter period (2004–13), where
trends in nitrate-nitrogen for 340 sites in the pastoral class were worsening at 39 percent,
improving at 23 percent, or indeterminate at 39 percent of sites.
Figure 11
Note: Monitored sites are classified by land cover class (eg pastoral). However, monitored sites can be downstream of a mix of
land covers within the catchment, meaning that the water quality at a particular site can be influenced by different land covers.
For more detail see Environmental indicators Te taiao Aotearoa: River water quality: nitrogen.
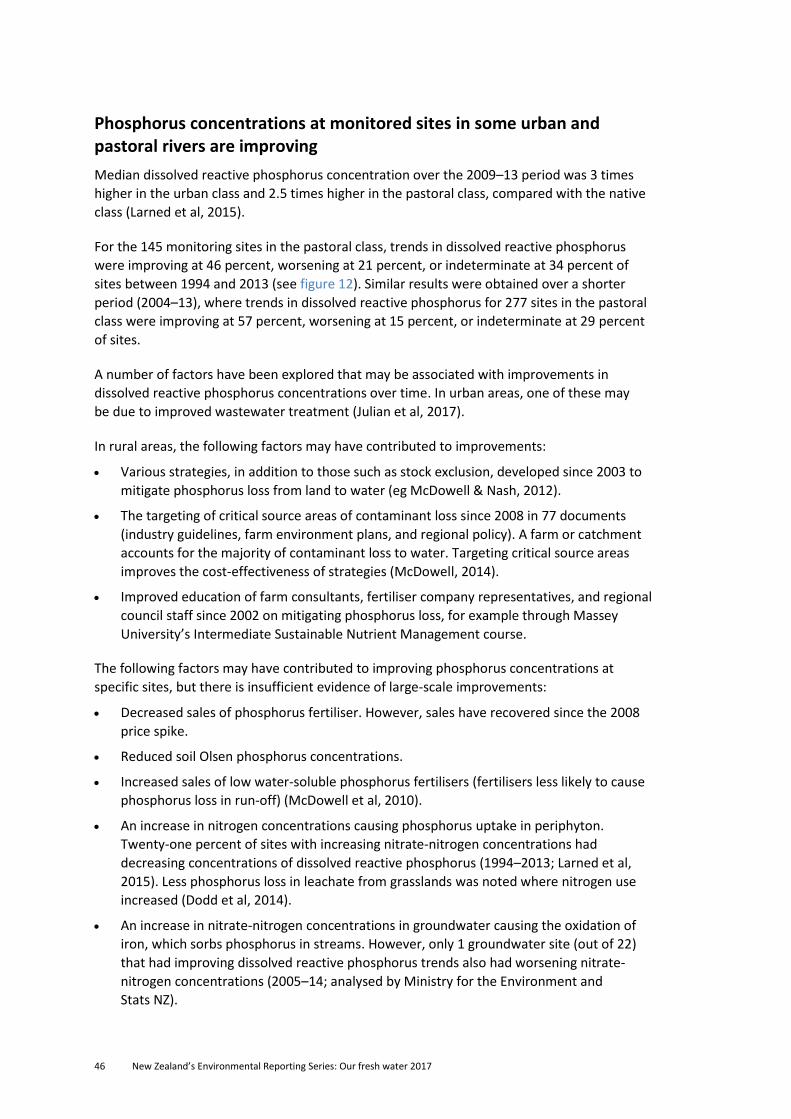
46 New Zealand’s Environmental Reporting Series: Our fresh water 2017
Phosphorus concentrations at monitored sites in some urban and pastoral rivers are improving
Median dissolved reactive phosphorus concentration over the 2009–13 period was 3 times
higher in the urban class and 2.5 times higher in the pastoral class, compared with the native
class (Larned et al, 2015).
For the 145 monitoring sites in the pastoral class, trends in dissolved reactive phosphorus
were improving at 46 percent, worsening at 21 percent, or indeterminate at 34 percent of
sites between 1994 and 2013 (see figure 12). Similar results were obtained over a shorter
period (2004–13), where trends in dissolved reactive phosphorus for 277 sites in the pastoral
class were improving at 57 percent, worsening at 15 percent, or indeterminate at 29 percent
of sites.
A number of factors have been explored that may be associated with improvements in
dissolved reactive phosphorus concentrations over time. In urban areas, one of these may
be due to improved wastewater treatment (Julian et al, 2017).
In rural areas, the following factors may have contributed to improvements:
Various strategies, in addition to those such as stock exclusion, developed since 2003 to
mitigate phosphorus loss from land to water (eg McDowell & Nash, 2012).
The targeting of critical source areas of contaminant loss since 2008 in 77 documents
(industry guidelines, farm environment plans, and regional policy). A farm or catchment
accounts for the majority of contaminant loss to water. Targeting critical source areas
improves the cost-effectiveness of strategies (McDowell, 2014).
Improved education of farm consultants, fertiliser company representatives, and regional
council staff since 2002 on mitigating phosphorus loss, for example through Massey
University’s Intermediate Sustainable Nutrient Management course.
The following factors may have contributed to improving phosphorus concentrations at
specific sites, but there is insufficient evidence of large-scale improvements:
Decreased sales of phosphorus fertiliser. However, sales have recovered since the 2008
price spike.
Reduced soil Olsen phosphorus concentrations.
Increased sales of low water-soluble phosphorus fertilisers (fertilisers less likely to cause
phosphorus loss in run-off) (McDowell et al, 2010).
An increase in nitrogen concentrations causing phosphorus uptake in periphyton.
Twenty-one percent of sites with increasing nitrate-nitrogen concentrations had
decreasing concentrations of dissolved reactive phosphorus (1994–2013; Larned et al,
2015). Less phosphorus loss in leachate from grasslands was noted where nitrogen use
increased (Dodd et al, 2014).
An increase in nitrate-nitrogen concentrations in groundwater causing the oxidation of
iron, which sorbs phosphorus in streams. However, only 1 groundwater site (out of 22)
that had improving dissolved reactive phosphorus trends also had worsening nitrate-
nitrogen concentrations (2005–14; analysed by Ministry for the Environment and
Stats NZ).
New Zealand’s Environmental Reporting Series: Our fresh water 2017 47
Figure 12
Note: Monitored sites are classified by land cover class (eg pastoral). However, monitored sites can be downstream of a mix of
land covers within the catchment, meaning that the water quality at a particular site can be influenced by different land covers.
For more detail see Environmental indicators Te taiao Aotearoa: River water quality:
phosphorus.
E.coli trends at monitored sites are largely indeterminate
Median E.coli concentration over the 2009–13 period was 22 times higher in the urban class
and 9.5 times higher in the pastoral class, compared with the native class (Larned et al, 2015).
For 268 monitoring sites in the pastoral class, trends in E.coli were indeterminate at
65 percent, improving at 21 percent, and worsening at 14 percent of sites between 2004
and 2013 (see figure 13).
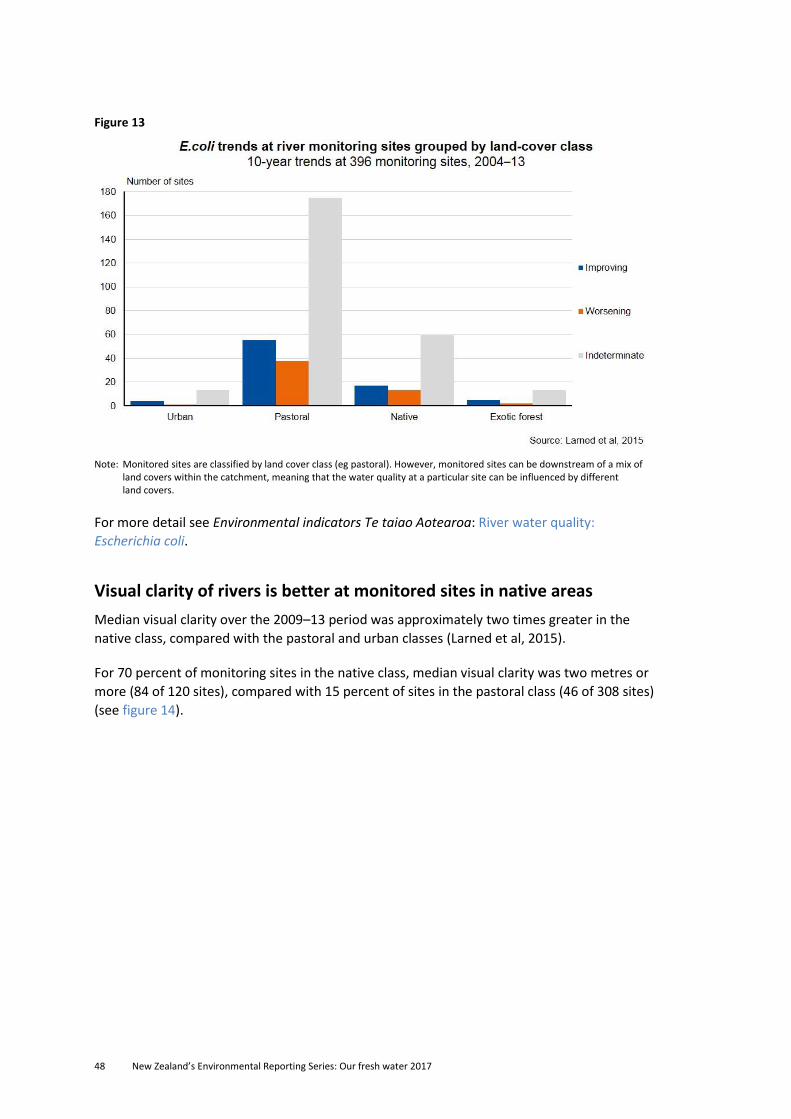
48 New Zealand’s Environmental Reporting Series: Our fresh water 2017
Figure 13
Note: Monitored sites are classified by land cover class (eg pastoral). However, monitored sites can be downstream of a mix of
land covers within the catchment, meaning that the water quality at a particular site can be influenced by different land covers.
For more detail see Environmental indicators Te taiao Aotearoa: River water quality:
Escherichia coli.
Visual clarity of rivers is better at monitored sites in native areas
Median visual clarity over the 2009–13 period was approximately two times greater in the
native class, compared with the pastoral and urban classes (Larned et al, 2015).
For 70 percent of monitoring sites in the native class, median visual clarity was two metres or
more (84 of 120 sites), compared with 15 percent of sites in the pastoral class (46 of 308 sites)
(see figure 14).
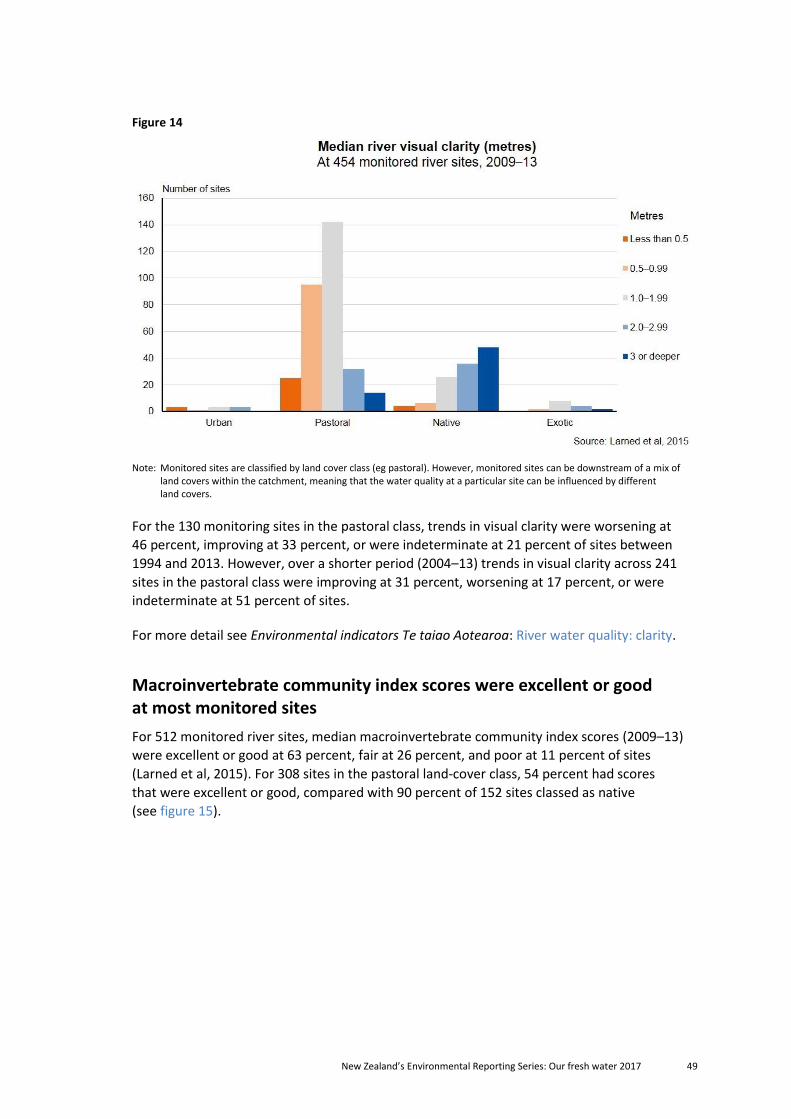
New Zealand’s Environmental Reporting Series: Our fresh water 2017 49
Figure 14
Note: Monitored sites are classified by land cover class (eg pastoral). However, monitored sites can be downstream of a mix of
land covers within the catchment, meaning that the water quality at a particular site can be influenced by different land covers.
For the 130 monitoring sites in the pastoral class, trends in visual clarity were worsening at
46 percent, improving at 33 percent, or were indeterminate at 21 percent of sites between
1994 and 2013. However, over a shorter period (2004–13) trends in visual clarity across 241
sites in the pastoral class were improving at 31 percent, worsening at 17 percent, or were
indeterminate at 51 percent of sites.
For more detail see Environmental indicators Te taiao Aotearoa: River water quality: clarity.
Macroinvertebrate community index scores were excellent or good at most monitored sites
For 512 monitored river sites, median macroinvertebrate community index scores (2009–13)
were excellent or good at 63 percent, fair at 26 percent, and poor at 11 percent of sites
(Larned et al, 2015). For 308 sites in the pastoral land-cover class, 54 percent had scores
that were excellent or good, compared with 90 percent of 152 sites classed as native
(see figure 15).
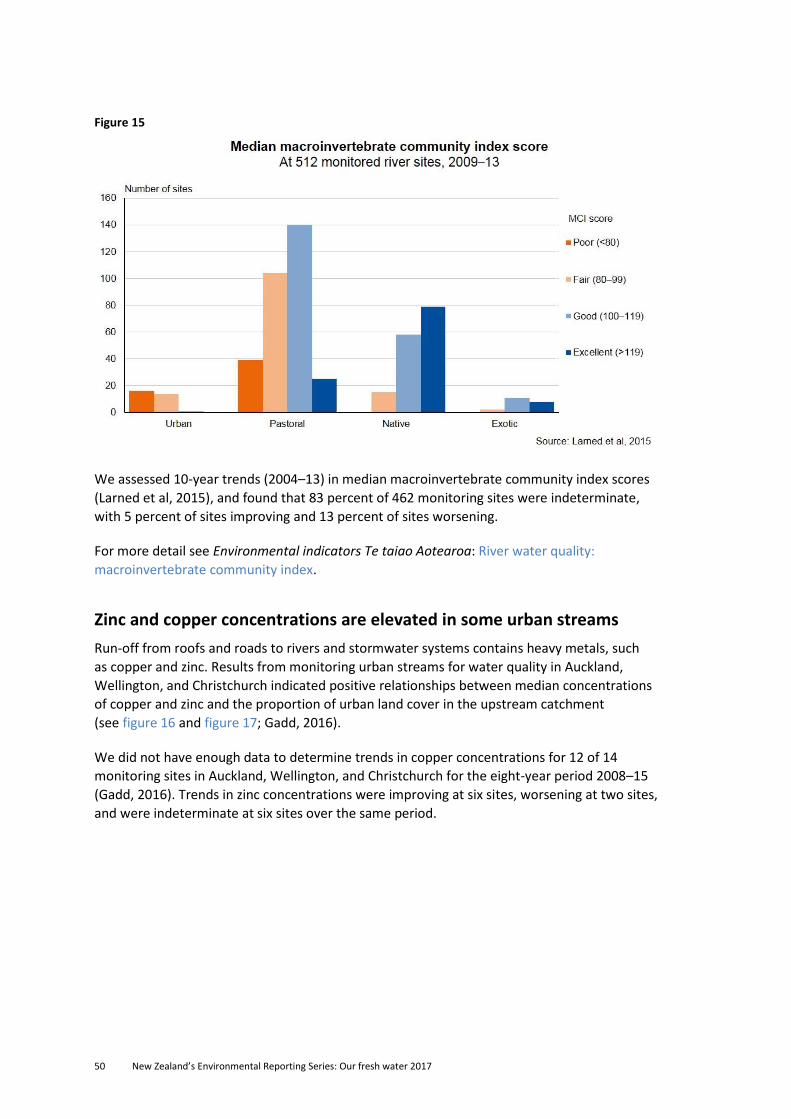
50 New Zealand’s Environmental Reporting Series: Our fresh water 2017
Figure 15
We assessed 10-year trends (2004–13) in median macroinvertebrate community index scores
(Larned et al, 2015), and found that 83 percent of 462 monitoring sites were indeterminate,
with 5 percent of sites improving and 13 percent of sites worsening.
For more detail see Environmental indicators Te taiao Aotearoa: River water quality:
macroinvertebrate community index.
Zinc and copper concentrations are elevated in some urban streams
Run-off from roofs and roads to rivers and stormwater systems contains heavy metals, such
as copper and zinc. Results from monitoring urban streams for water quality in Auckland,
Wellington, and Christchurch indicated positive relationships between median concentrations
of copper and zinc and the proportion of urban land cover in the upstream catchment
(see figure 16 and figure 17; Gadd, 2016).
We did not have enough data to determine trends in copper concentrations for 12 of 14
monitoring sites in Auckland, Wellington, and Christchurch for the eight-year period 2008–15
(Gadd, 2016). Trends in zinc concentrations were improving at six sites, worsening at two sites,
and were indeterminate at six sites over the same period.
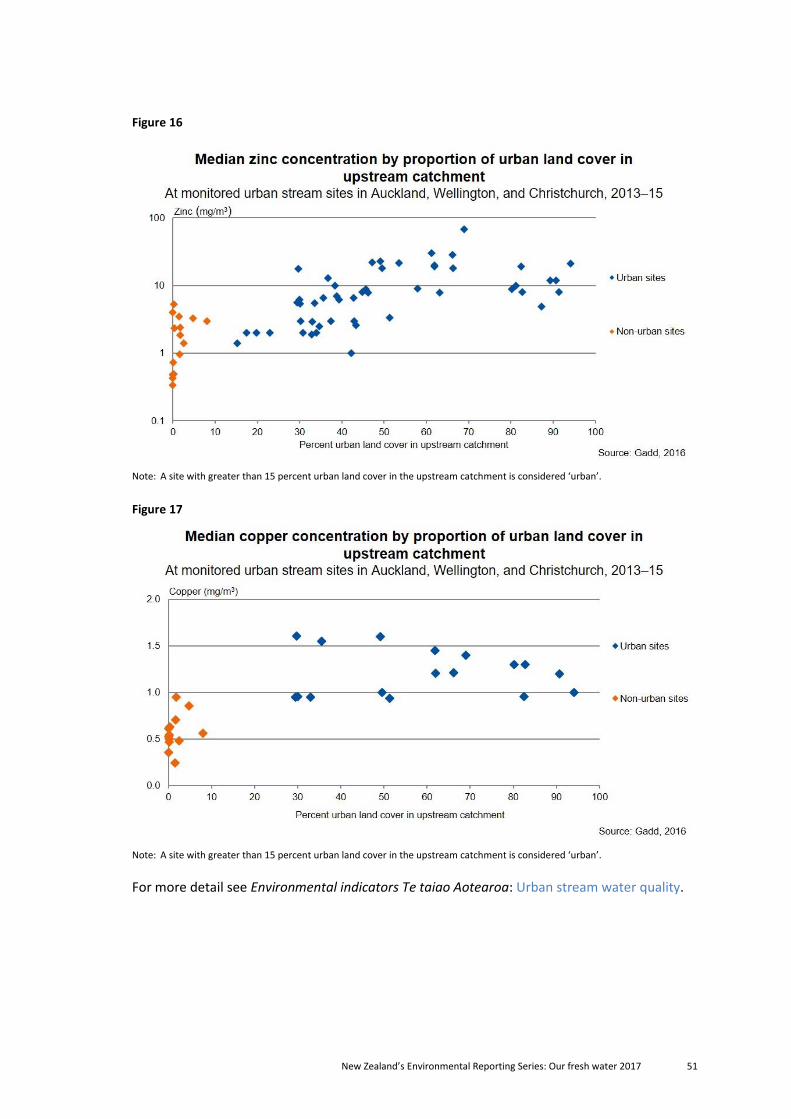
New Zealand’s Environmental Reporting Series: Our fresh water 2017 51
Figure 16
Note: A site with greater than 15 percent urban land cover in the upstream catchment is considered ‘urban’.
Figure 17
Note: A site with greater than 15 percent urban land cover in the upstream catchment is considered ‘urban’.
For more detail see Environmental indicators Te taiao Aotearoa: Urban stream water quality.
52 New Zealand’s Environmental Reporting Series: Our fresh water 2017
Monitored lake water quality New Zealand has more than 50,000 lakes, but only 3,821 of them are larger than one hectare
(10,000 m2). The different lake types, geology, topography, and human activities are factors
that contribute to lake water quality (see Land-based activities are putting pressure on
water quality).
Monitored lakes make up a small proportion (less than 5 percent) of all lakes in New Zealand
larger than one hectare. Due to the processing and filtering rules for creating a national
dataset, the data we used for this section were almost entirely restricted to the Northland,
Auckland, Waikato, Bay of Plenty, and Canterbury regions (Larned et al, 2015).
We compare results for lake water quality to attribute states for compulsory values in the
National Objectives Framework (New Zealand Government, 2014). These are described
in table 3.
Table 3: Lake water quality attribute states
Lake water quality
compulsory value Status Water quality attribute What it means
Ecosystem health (trophic
state) – National Objectives
Framework national bottom
lines in the National Policy
Statement for Freshwater
Management (New Zealand
Government, 2014)
Regulatory Algae (phytoplankton,
measured as chlorophyll-a),
total nitrogen, total
phosphorus
The attribute states consist of
four bands, A–D, with A being
the best state and D the worst.
The national bottom line for
phytoplankton is the level at
which lake ecological
communities have undergone or
are at high risk of a regime shift
to a persistent, degraded state.
Ecosystem health (toxicity) –
National Objectives
Framework national bottom
lines in the National Policy
Statement for Freshwater
Management (New Zealand
Government, 2014)
Regulatory Ammoniacal nitrogen The attribute states consist of
four bands, A–D, with A being
the best state and D the worst.
The bottom line for median
nitrate toxicity and pH adjusted
ammonia toxicity is the level
that would have some growth
effects on up to 20 percent of
sensitive fish species.
Trophic level index at lake sites varies
When nitrogen and phosphorus enter lakes (referred to as ‘nutrient enrichment’), they
stimulate algal growth, which can make lakes turbid and green. In New Zealand, the trophic
level index (TLI) is widely used to measure the nutrient status of lakes, and provides an
indication of the health of a lake.
Of 65 lake monitoring sites between 2009 and 2013, 24 sites had median TLI scores of very
good or good, 17 monitored sites had moderate scores, and 24 monitored sites had poor or
very poor scores (Larned et al, 2015). Lakes rated good or very good are clear (unless they
have natural turbidity, eg from glacial silt) and have low concentrations of nutrients and algae
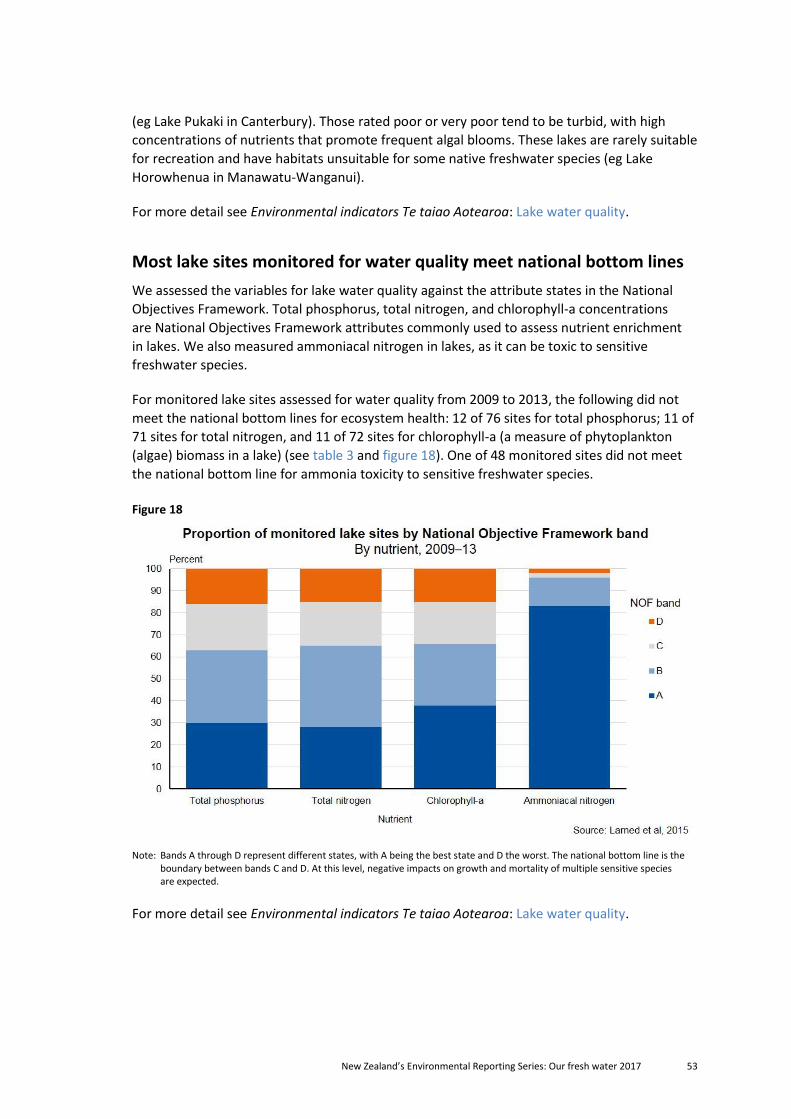
New Zealand’s Environmental Reporting Series: Our fresh water 2017 53
(eg Lake Pukaki in Canterbury). Those rated poor or very poor tend to be turbid, with high
concentrations of nutrients that promote frequent algal blooms. These lakes are rarely suitable
for recreation and have habitats unsuitable for some native freshwater species (eg Lake
Horowhenua in Manawatu-Wanganui).
For more detail see Environmental indicators Te taiao Aotearoa: Lake water quality.
Most lake sites monitored for water quality meet national bottom lines
We assessed the variables for lake water quality against the attribute states in the National
Objectives Framework. Total phosphorus, total nitrogen, and chlorophyll-a concentrations
are National Objectives Framework attributes commonly used to assess nutrient enrichment
in lakes. We also measured ammoniacal nitrogen in lakes, as it can be toxic to sensitive
freshwater species.
For monitored lake sites assessed for water quality from 2009 to 2013, the following did not
meet the national bottom lines for ecosystem health: 12 of 76 sites for total phosphorus; 11 of
71 sites for total nitrogen, and 11 of 72 sites for chlorophyll-a (a measure of phytoplankton
(algae) biomass in a lake) (see table 3 and figure 18). One of 48 monitored sites did not meet
the national bottom line for ammonia toxicity to sensitive freshwater species.
Figure 18
Note: Bands A through D represent different states, with A being the best state and D the worst. The national bottom line is the
boundary between bands C and D. At this level, negative impacts on growth and mortality of multiple sensitive species are expected.
For more detail see Environmental indicators Te taiao Aotearoa: Lake water quality.
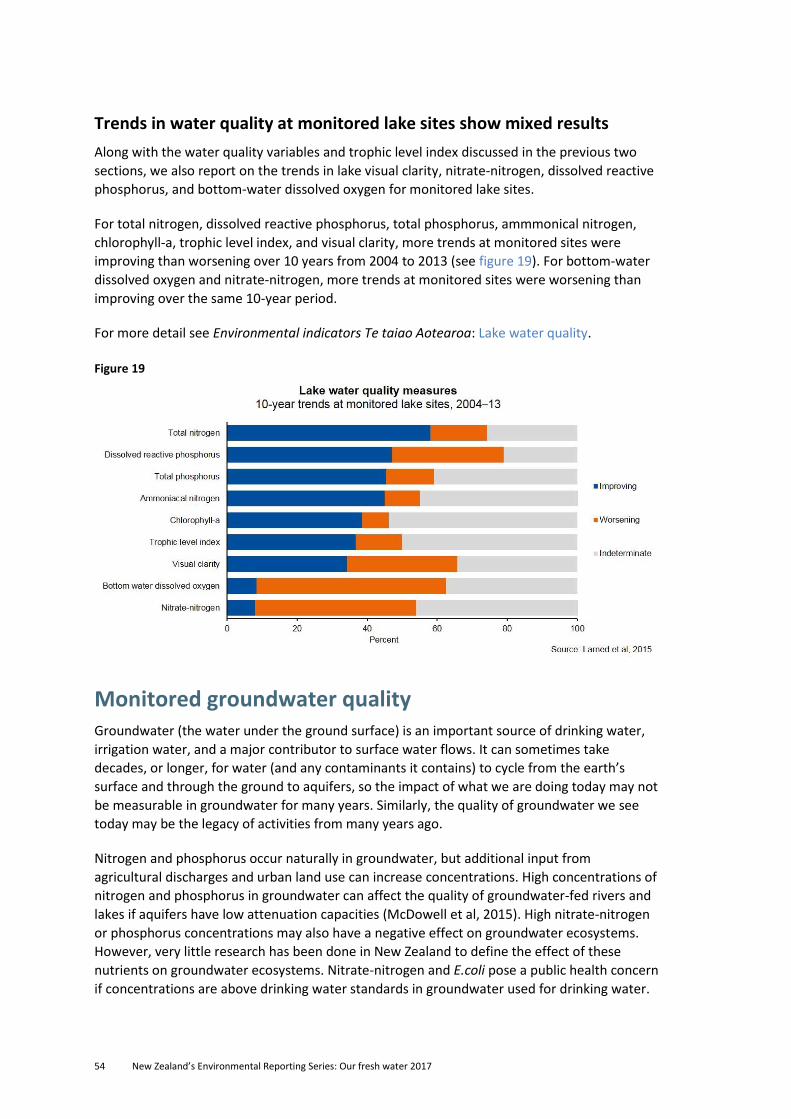
54 New Zealand’s Environmental Reporting Series: Our fresh water 2017
Trends in water quality at monitored lake sites show mixed results
Along with the water quality variables and trophic level index discussed in the previous two
sections, we also report on the trends in lake visual clarity, nitrate-nitrogen, dissolved reactive
phosphorus, and bottom-water dissolved oxygen for monitored lake sites.
For total nitrogen, dissolved reactive phosphorus, total phosphorus, ammmonical nitrogen,
chlorophyll-a, trophic level index, and visual clarity, more trends at monitored sites were
improving than worsening over 10 years from 2004 to 2013 (see figure 19). For bottom-water
dissolved oxygen and nitrate-nitrogen, more trends at monitored sites were worsening than
improving over the same 10-year period.
For more detail see Environmental indicators Te taiao Aotearoa: Lake water quality.
Figure 19
Monitored groundwater quality Groundwater (the water under the ground surface) is an important source of drinking water,
irrigation water, and a major contributor to surface water flows. It can sometimes take
decades, or longer, for water (and any contaminants it contains) to cycle from the earth’s
surface and through the ground to aquifers, so the impact of what we are doing today may not
be measurable in groundwater for many years. Similarly, the quality of groundwater we see
today may be the legacy of activities from many years ago.
Nitrogen and phosphorus occur naturally in groundwater, but additional input from
agricultural discharges and urban land use can increase concentrations. High concentrations of
nitrogen and phosphorus in groundwater can affect the quality of groundwater-fed rivers and
lakes if aquifers have low attenuation capacities (McDowell et al, 2015). High nitrate-nitrogen
or phosphorus concentrations may also have a negative effect on groundwater ecosystems.
However, very little research has been done in New Zealand to define the effect of these
nutrients on groundwater ecosystems. Nitrate-nitrogen and E.coli pose a public health concern
if concentrations are above drinking water standards in groundwater used for drinking water.
New Zealand’s Environmental Reporting Series: Our fresh water 2017 55
See Land-based activities are putting pressure on water quality for the pressures on
water quality.
We report on the results for groundwater quality against the drinking water standards (see
table 4), focusing on the variables that could affect public health.
Table 4: Drinking water standards
Drinking water standards Status Water quality variable What it means
Microbial variables –
drinking water quality
standards maximum
acceptable value
Regulatory, for
drinking water
supplies
E.coli Maximum concentration of E.coli in
water that, based on current
knowledge, constitute no significant
risk to the health of a person who
consumes two litres of that water a
day over their lifetime (usually
taken as 70 years).
Inorganic variables –
drinking water quality
standards maximum
acceptable value
Regulatory, for
drinking water
supplies
Nitrate-nitrogen Maximum concentration of nitrate-
nitrogen in water that, based on
current knowledge, constitute no
significant risk to the health of a
person who consumes two litres of
that water a day over their lifetime
(usually taken as 70 years).
Some monitored groundwater quality sites are not meeting drinking water standards
In this report, we compare results from monitored groundwater quality sites with the
drinking water standards (Ministry of Health, 2008), because there are no other standards for
groundwater (eg no standards are available for cultural values or ecosystem protection). We
assess the results from each groundwater sampling occasion against the drinking water
standards. The sites are those monitored by regional councils and GNS Science in their
environmental monitoring networks, which are not set up to monitor drinking water supply.
Therefore, these results are not representative of drinking water quality in New Zealand.
The Health (Drinking Water) Amendment Act 2007 requires drinking-water suppliers who
serve more than 500 people to implement a water safety plan for their water supply. However,
the drinking water standards apply to water intended for drinking by the public irrespective of
the water’s source, treatment, or distribution system, whether it is from a public or private
supply, or where it is used.
The assessment was limited to sites that were sampled on 12 dates or more in the period
2012–14. We determined how many times a site failed to meet the drinking water quality
standard. For E.coli, 50 of 70 groundwater sites (71 percent) did not meet the drinking water
standard at least once (see table 5; analysed by Ministry for the Environment and Stats NZ).
For nitrate-nitrogen, 47 of 361 sites (13 percent) did not meet the drinking water quality
standard at least once.
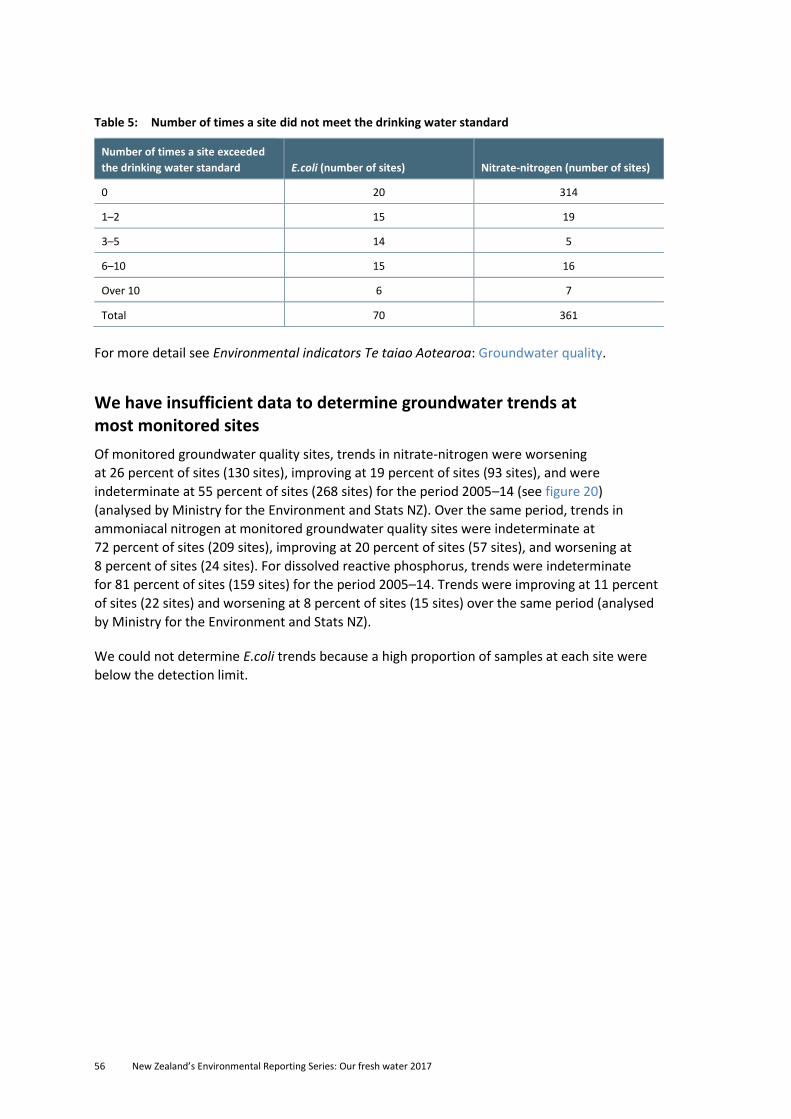
56 New Zealand’s Environmental Reporting Series: Our fresh water 2017
Table 5: Number of times a site did not meet the drinking water standard
Number of times a site exceeded
the drinking water standard E.coli (number of sites) Nitrate-nitrogen (number of sites)
0 20 314
1–2 15 19
3–5 14 5
6–10 15 16
Over 10 6 7
Total 70 361
For more detail see Environmental indicators Te taiao Aotearoa: Groundwater quality.
We have insufficient data to determine groundwater trends at most monitored sites
Of monitored groundwater quality sites, trends in nitrate-nitrogen were worsening
at 26 percent of sites (130 sites), improving at 19 percent of sites (93 sites), and were
indeterminate at 55 percent of sites (268 sites) for the period 2005–14 (see figure 20)
(analysed by Ministry for the Environment and Stats NZ). Over the same period, trends in
ammoniacal nitrogen at monitored groundwater quality sites were indeterminate at
72 percent of sites (209 sites), improving at 20 percent of sites (57 sites), and worsening at
8 percent of sites (24 sites). For dissolved reactive phosphorus, trends were indeterminate
for 81 percent of sites (159 sites) for the period 2005–14. Trends were improving at 11 percent
of sites (22 sites) and worsening at 8 percent of sites (15 sites) over the same period (analysed
by Ministry for the Environment and Stats NZ).
We could not determine E.coli trends because a high proportion of samples at each site were
below the detection limit.
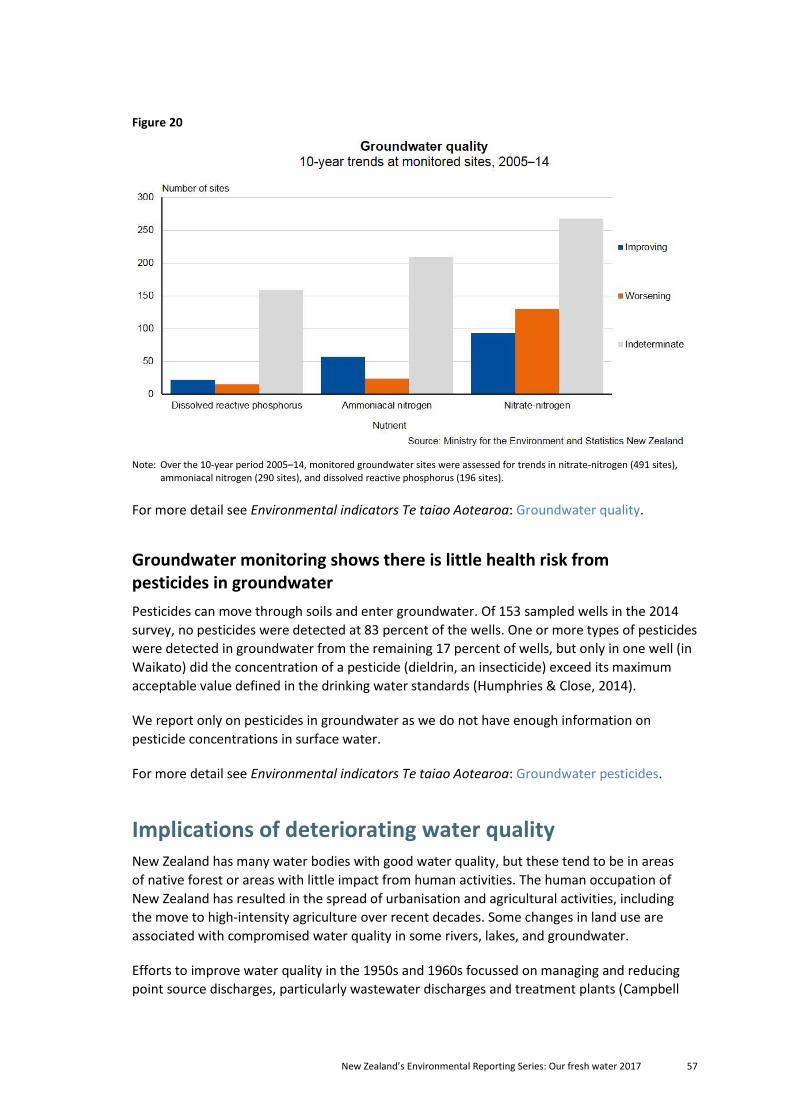
New Zealand’s Environmental Reporting Series: Our fresh water 2017 57
Figure 20
Note: Over the 10-year period 2005–14, monitored groundwater sites were assessed for trends in nitrate-nitrogen (491 sites),
ammoniacal nitrogen (290 sites), and dissolved reactive phosphorus (196 sites).
For more detail see Environmental indicators Te taiao Aotearoa: Groundwater quality.
Groundwater monitoring shows there is little health risk from pesticides in groundwater
Pesticides can move through soils and enter groundwater. Of 153 sampled wells in the 2014
survey, no pesticides were detected at 83 percent of the wells. One or more types of pesticides
were detected in groundwater from the remaining 17 percent of wells, but only in one well (in
Waikato) did the concentration of a pesticide (dieldrin, an insecticide) exceed its maximum
acceptable value defined in the drinking water standards (Humphries & Close, 2014).
We report only on pesticides in groundwater as we do not have enough information on
pesticide concentrations in surface water.
For more detail see Environmental indicators Te taiao Aotearoa: Groundwater pesticides.
Implications of deteriorating water quality New Zealand has many water bodies with good water quality, but these tend to be in areas
of native forest or areas with little impact from human activities. The human occupation of
New Zealand has resulted in the spread of urbanisation and agricultural activities, including
the move to high-intensity agriculture over recent decades. Some changes in land use are
associated with compromised water quality in some rivers, lakes, and groundwater.
Efforts to improve water quality in the 1950s and 1960s focussed on managing and reducing
point source discharges, particularly wastewater discharges and treatment plants (Campbell
58 New Zealand’s Environmental Reporting Series: Our fresh water 2017
et al, 2004). While reducing point-source discharges was beneficial, diffuse discharges of
sediment, nutrients, and other contaminants are still degrading water quality. Using land for
agriculture is the greatest contributor of diffuse discharges globally; however, since diffuse
discharges are hard to measure and trace, it is difficult to establish cause-and-effect
relationships between land use and water quality (Campbell et al, 2004).
New Zealand’s population and agriculture-based economy are growing, and it is expected that
high-intensity agriculture and urbanisation will continue to expand to new areas, potentially
affecting water quality in more water bodies. Climate change is also predicted to put additional
pressure on the quality of our fresh water, including increased water temperatures in some
areas, which may reduce levels of dissolved oxygen and potentially increase the occurrence of
algal blooms (Reisinger et al, 2014). Although substantial effort was directed at monitoring and
reducing diffuse sources of contaminants with some success (eg McDowell et al, 2013), the
legacy of contaminants from past land uses remain, meaning we may still see the impact of
previous land uses on our water bodies in the future (Morgenstern et al, 2015).
Data gaps We summarise some of many gaps in available data about water quality. We acknowledge that
information to fill some of these gaps may already exist, or research is underway. We intend to
provide information that will fill these gaps (if available) in our next report on fresh water.
Information on relationships between land use and water quality.
Information on the effect various land-use and land-management practices have on water
quality.
Information on the extent of impervious surfaces in urban areas and their impact on water
quality and quantity.
Information on water quality for Stewart Island, the Chatham Islands, and other outlying
islands.
Information on a larger number of lakes, with greater geographic distribution (lake water
quality results in this report are largely from the Northland, Auckland, Bay of Plenty, and
Canterbury regions).
Increased information on river, lake, and groundwater quality monitoring sites in native
and exotic forest areas, given that pastoral and urban sites are currently over-represented
in the monitoring network.
Consistent information on the monitoring of the quality of recreational water.
Information on biologically relevant variables such as deposited sediment, continuous
dissolved oxygen, periphyton, and benthic cyanobacteria.
Information on groundwater salinity.
Information on emerging contaminants.
New Zealand’s Environmental Reporting Series: Our fresh water 2017 59
Water quantity and flows
Top finding
More than half the water allocated (or consented) by councils is for irrigation, but we do not
know how much of this is actually used.
What is happening?
Humans have been taking water and modifying water bodies for agriculture and urbanisation,
and to produce energy and protect against flooding, which have resulted in altered flow regimes.
The most widespread cause of altered river flow from water takes appears to be irrigation,
although other uses such as hydroelectricity are important in some catchments. We currently do
not have national-scale data on water use, and have relied on consented information for this
analysis. Climate change is predicted to exacerbate pressures on water flows and the availability
of water.
Why does it matter?
Flow reductions result in less water available for ecosystems and human use. Our current
economic dependence on primary industries means we are relying on taking water for irrigation.
Altered flows can negatively affect the health and mauri (life force) of freshwater ecosystems by
negatively impacting on the habitats of freshwater species, landscape aesthetics, and the
suitability of our freshwater environments for recreation.
Water quantity refers to the amount of water present in rivers, streams, lakes, wetlands,
aquifers, and glaciers. Flow is the volume of water passing a point over a certain time, which
indicates the availability of water for people and the environment. There needs to be a balance
between providing water for public, industrial, and agricultural uses and ensuring the
protection of freshwater ecosystem functions.
The timing and volume of water (also known as ‘flow regime’) are components of a healthy
freshwater system and are linked to water quality. For example, if freshwater flows are low,
little water is available to dilute nutrients and other contaminants that negatively affect
water quality.
In this chapter we focus on how water flows are influenced by climate patterns. We also
discuss some human activities that influence the flows in our water bodies. Changes in glacier
volume will be covered in Our atmosphere and climate 2017, to be published in October 2017.
This chapter covers:
Climate patterns influence freshwater flows
Human activities are altering the natural flows in our water bodies
Implications of altered river flows
Data gaps.
60 New Zealand’s Environmental Reporting Series: Our fresh water 2017
Climate patterns influence freshwater flows Water flows vary naturally through time and between water bodies due to climate,
topography, land cover, and underlying geology. Natural variability in the flow of water is
important for the health and mauri of freshwater ecosystems, and the services they provide.
Climate is a natural driver of flow regimes, including the availability of water, which is
predicted to change in the future due to the effects of climate change (see Projected effects
of climate change).
Projected effects of climate change
New Zealand’s climate is projected to get warmer through the 21st century (Reisinger et al,
2014). This warming is expected to cause rising snow lines, reduced glacier volumes, increased
westerly winds, and changes in the frequency and severity of droughts, rainfall patterns, and
evaporation rates. Water flows and water availability are projected to change because of these
factors, consequently affecting our freshwater ecosystems and species (Robertson et al, 2016).
A warmer climate will lead to higher water temperatures, which have implications for water
quality, including reduced levels of dissolved oxygen and potential increases in algal blooms
(Hamilton et al, 2013). This may affect the number and distribution of many freshwater species.
In the South Island, annual rainfall is projected to increase in the west and south and decrease in
the northeast (Ministry for the Environment, 2016). In the North Island, annual rainfall is
projected to increase in the west, and decrease in the east and north (Ministry for the
Environment, 2016). Changing rainfall patterns and increasing evaporation rates may mean
irrigation demand will increase in some parts of the country. Water quality may deteriorate
because of lower flows (due to reduced rainfall) in areas that get dryer. Higher erosion rates may
ensue (due to increased rainfall) in wetter areas, although this will depend on other factors, such
as vegetation growth and cover. New Zealand’s hydroelectric power generation is also sensitive
to changes in rainfall patterns and the availability of water.
New Zealand has plenty of fresh water but it’s not always where and when we need it
Rainfall and snow melt influence the amount of water in our rivers, lakes, and aquifers. By
international standards, New Zealand has a plentiful supply of fresh water (OECD, 2007).
Our low average population density and high average rainfall mean the amount of fresh water
per person is higher than most countries. We have approximately 711 billion cubic metres
stored as groundwater in aquifers, 320 billion cubic metres in lakes, and 440 billion cubic
metres flowing through rivers and streams each year (Ministry for the Environment and
Statistics NZ, 2015).
Our rainfall varies year on year. On average, New Zealand receives 550 billion cubic metres
of precipitation a year – enough to fill Lake Taupo nine times over (Collins et al, 2015).
Rainfall replenishes our rivers, streams, lakes, and groundwater, but it is not uniform across
New Zealand’s Environmental Reporting Series: Our fresh water 2017 61
the country. Rainfall is generally much higher on the western side of the North and South
islands – the West Coast of the South Island received 26 percent of national precipitation
between 1994 and 2014 (Collins et al, 2015). After standardising for different catchment sizes,
natural river flows are higher in some catchments than others. For example, river flows are
naturally lower on the eastern side of the South Island compared with the western side, except
for the large rivers that flow east from the Southern Alps, such as Waitaki, Rakaia, and
Rangitata (Booker, 2015).
For more detail see Environmental indicators Te taiao Aotearoa: Geographic pattern of natural
river flows and Water physical stocks: precipitation and evapotranspiration.
Human activities alter the natural flows in our water bodies Taking water, creating diversions, dams, and bores, and using land are human activities that
influence water flows. We use water for farming (irrigation and stock drinking water), power
generation, drinking water, and industry. In some instances, our activities provide benefits in
addition to the supply of water – for example, artificial lakes created by dams have the
potential to create new recreation opportunities.
Flow regime influences a river’s physical form by affecting how sediment is transported and
deposited. A flow regime is important because flow combines with river topography to
influence the habitat available for freshwater species. Although ecological processes are
affected by many factors, flow is important because it influences food delivery, nutrient
transport, and channel connectivity. It has been argued that freshwater species have evolved
their life cycles in response to natural flow regimes (Bunn & Arthington, 2002). However,
examples where changes to natural flow regimes have maintained, or even improved, in-
stream values in some New Zealand rivers have also been reported (Jowett & Biggs, 2008).
Altered flows can potentially influence fish abundance (Jowett et al, 2005), fish migration
(Boubée et al, 2001), fish spawning (McDowall, 1990), the availability of physical habitat for
fish (Jowett & Richardson, 1995), and invertebrate communities (Greenwood & Booker, 2014).
If the flushing flows of rivers are reduced, algae and fine sediment can build up, reducing
amenity and recreation values and degrading the habitat of freshwater species (Biggs, 2000).
Māori assert their tribal identity in relation to water bodies, with each water body having its
own mauri. Altered flows and water levels can degrade the mauri and mahinga kai values of
water bodies (Tipa & Teirney, 2006).
Hydroelectricity and irrigation are the largest consented uses of freshwater takes
For more than a century, we have been using water resources for public use and agriculture,
and to produce energy. The number of water takes, together with their position in the river
network, rate of take, and timing, combine to determine the impact on flow regimes. Larger
impacts on flow occur when larger volumes of water are taken for consumption (meaning the
water is used and not returned to the site where the water was taken) from multiple locations,
particularly in dry periods.
62 New Zealand’s Environmental Reporting Series: Our fresh water 2017
Water can be taken directly from surface water or from the groundwater system by pumping.
Surface water and groundwater are often connected, so taking water from one affects both.
However, quantifying the timing and extent of connection between groundwater takes and
river flow depletion can be difficult. Resource consent data from all 16 regional and unitary
councils show that groundwater takes are particularly common in Canterbury, which accounts
for 56 percent of total consented groundwater volume (Booker et al, 2016a).
Hydroelectricity generation and irrigation are our largest consented uses of fresh water,
with the remainder allocated for industrial, drinking, stock water, and other minor purposes
(Booker et al, 2016a). Irrigation in New Zealand has allowed for the significant expansion of
a range of farming systems (New Zealand Institute of Economic Research (NZIER) & AgFirst
Consultants NZ, 2014). Irrigation gives a greater reliability of production, increased yields, and
improved quality of production (NZIER & AgFirst Consultants NZ, 2014).
Water taken for hydroelectricity production is generally non-consumptive, meaning the water
is returned to downstream water bodies after use (two notable exceptions are the South
Island’s Manapouri Power Station, which discharges directly to the ocean in Doubtful Sound
Fiordland, and augmentation of the Waikato River from adjacent catchments in the North
Island). However, water for hydroelectricity production is often stored behind dams, which
alter river flow patterns downstream (Duncan & Woods, 2004).
The hydroelectric potential of New Zealand was recognised in the early 1900s, when
construction of the first government scheme was completed in 1914 (Young et al, 2004).
New Zealand relies on a plentiful supply of water for its energy supply. Hydroelectricity is
our main source of renewable energy, accounting for more than 56 percent of electricity
generation in 2015, returning $586 million to hydroelectricity operators (Stats NZ, 2017).
Water consented for irrigation varies by region, with Canterbury accounting for nearly
65 percent of the total consented volume of water nationally (see figure 21). A further
9 percent of the consented volume is in Marlborough, followed by 7 percent in Otago
(although 53 percent of surface water consents in Otago had missing values for consented
volume, so Otago consented volumes may account for a higher proportion than is expressed
here) (Booker et al, 2016a).
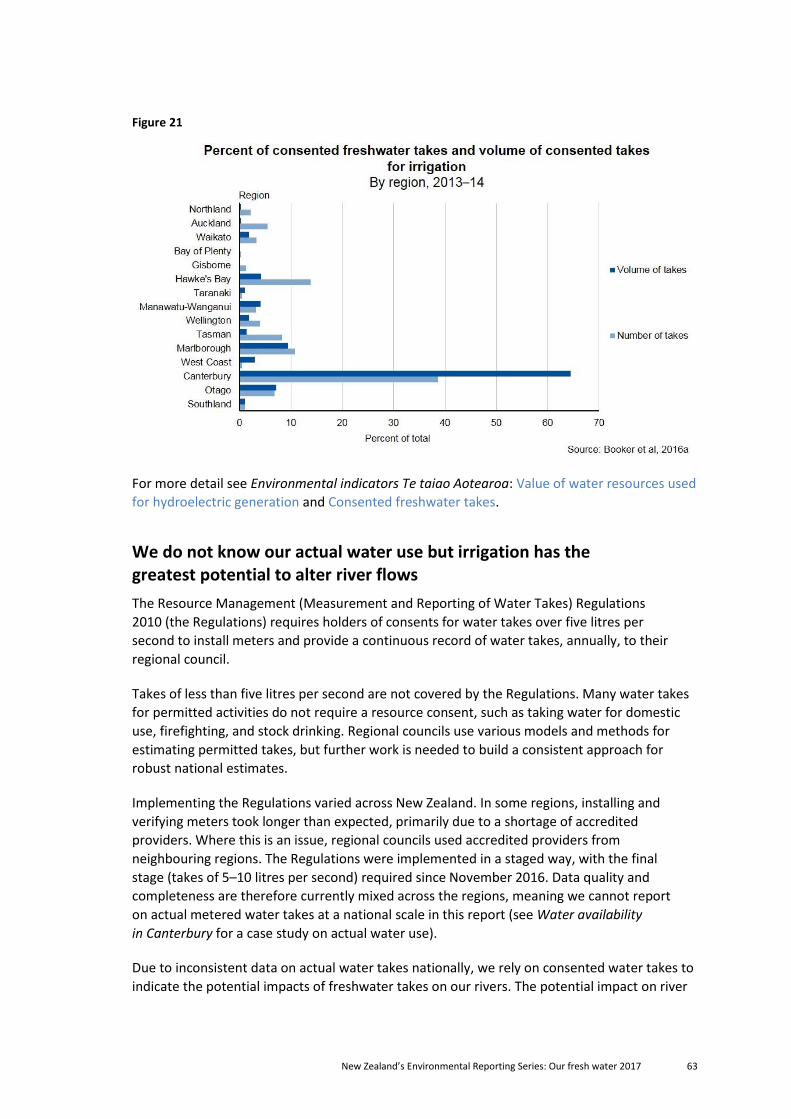
New Zealand’s Environmental Reporting Series: Our fresh water 2017 63
Figure 21
For more detail see Environmental indicators Te taiao Aotearoa: Value of water resources used
for hydroelectric generation and Consented freshwater takes.
We do not know our actual water use but irrigation has the greatest potential to alter river flows
The Resource Management (Measurement and Reporting of Water Takes) Regulations
2010 (the Regulations) requires holders of consents for water takes over five litres per
second to install meters and provide a continuous record of water takes, annually, to their
regional council.
Takes of less than five litres per second are not covered by the Regulations. Many water takes
for permitted activities do not require a resource consent, such as taking water for domestic
use, firefighting, and stock drinking. Regional councils use various models and methods for
estimating permitted takes, but further work is needed to build a consistent approach for
robust national estimates.
Implementing the Regulations varied across New Zealand. In some regions, installing and
verifying meters took longer than expected, primarily due to a shortage of accredited
providers. Where this is an issue, regional councils used accredited providers from
neighbouring regions. The Regulations were implemented in a staged way, with the final
stage (takes of 5–10 litres per second) required since November 2016. Data quality and
completeness are therefore currently mixed across the regions, meaning we cannot report
on actual metered water takes at a national scale in this report (see Water availability
in Canterbury for a case study on actual water use).
Due to inconsistent data on actual water takes nationally, we rely on consented water takes to
indicate the potential impacts of freshwater takes on our rivers. The potential impact on river
64 New Zealand’s Environmental Reporting Series: Our fresh water 2017
flows as a result of all upstream consented takes was calculated by summing the consented
rates of all upstream consented takes and then dividing by the estimated long-term natural
median flow (Booker et al, 2016a).
The cumulative effect of consented water takes on downstream river flows showed that water
takes for irrigation have the highest potential to cause widespread reductions in downstream
river flows, compared with other water uses (see figure 22 and figure 23) (Booker et al, 2016a).
This is especially noticeable in Canterbury and Hawke’s Bay where many consents are from
groundwater as well as surface water. Note that estimating river flow depletion resulting from
groundwater takes is uncertain. Limited evidence also suggests that not all consents are used
to their full allocation, and many consents include rules to limit the rate of take during low-
flow periods. The figures presented here show a worst-case scenario for river-flow depletion.
Water consented for hydroelectricity, industrial, and drinking uses may also have impacts on
downstream flows, but these are concentrated in a few catchments. For example, Auckland
experienced temporary drinking-water shortages in the past, and as its population continues
to grow, new sources of water are needed (Auckland Council, 2013).
Demand for irrigation is higher in summer and in drought years (Woodward et al, 2001),
which can exacerbate water availability issues. To protect the environment during periods of
naturally low flow and when there is the greatest demand for water, many councils have
restricted consents so that water cannot be taken when river flow at a control site falls below
a certain flow rate. These restrictions are complex, and are not accounted for in our estimates
of the impact of water takes on river flows. The natural timing of low flows also does not
always coincide with peak water demand – freezing creates low flows in winter for cold
catchments (eg Poyck et al, 2011).
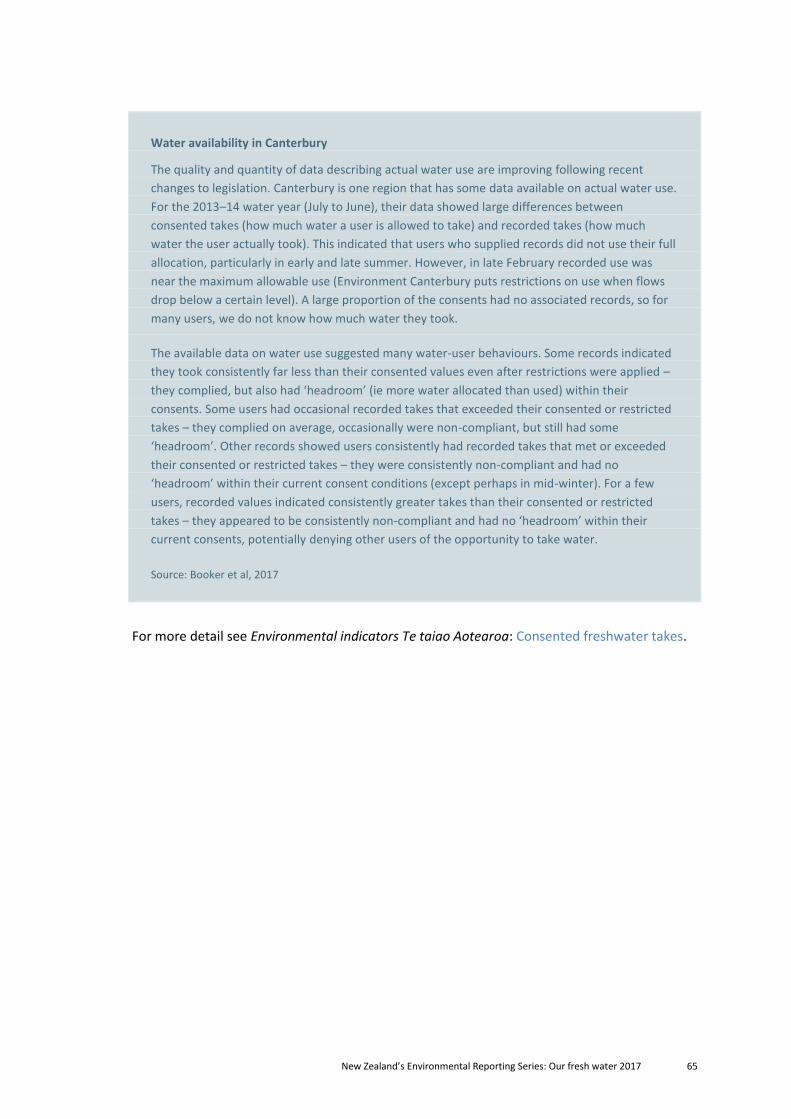
New Zealand’s Environmental Reporting Series: Our fresh water 2017 65
Water availability in Canterbury
The quality and quantity of data describing actual water use are improving following recent
changes to legislation. Canterbury is one region that has some data available on actual water use.
For the 2013–14 water year (July to June), their data showed large differences between
consented takes (how much water a user is allowed to take) and recorded takes (how much
water the user actually took). This indicated that users who supplied records did not use their full
allocation, particularly in early and late summer. However, in late February recorded use was
near the maximum allowable use (Environment Canterbury puts restrictions on use when flows
drop below a certain level). A large proportion of the consents had no associated records, so for
many users, we do not know how much water they took.
The available data on water use suggested many water-user behaviours. Some records indicated
they took consistently far less than their consented values even after restrictions were applied –
they complied, but also had ‘headroom’ (ie more water allocated than used) within their
consents. Some users had occasional recorded takes that exceeded their consented or restricted
takes – they complied on average, occasionally were non-compliant, but still had some
‘headroom’. Other records showed users consistently had recorded takes that met or exceeded
their consented or restricted takes – they were consistently non-compliant and had no
‘headroom’ within their current consent conditions (except perhaps in mid-winter). For a few
users, recorded values indicated consistently greater takes than their consented or restricted
takes – they appeared to be consistently non-compliant and had no ‘headroom’ within their
current consents, potentially denying other users of the opportunity to take water.
Source: Booker et al, 2017
For more detail see Environmental indicators Te taiao Aotearoa: Consented freshwater takes.
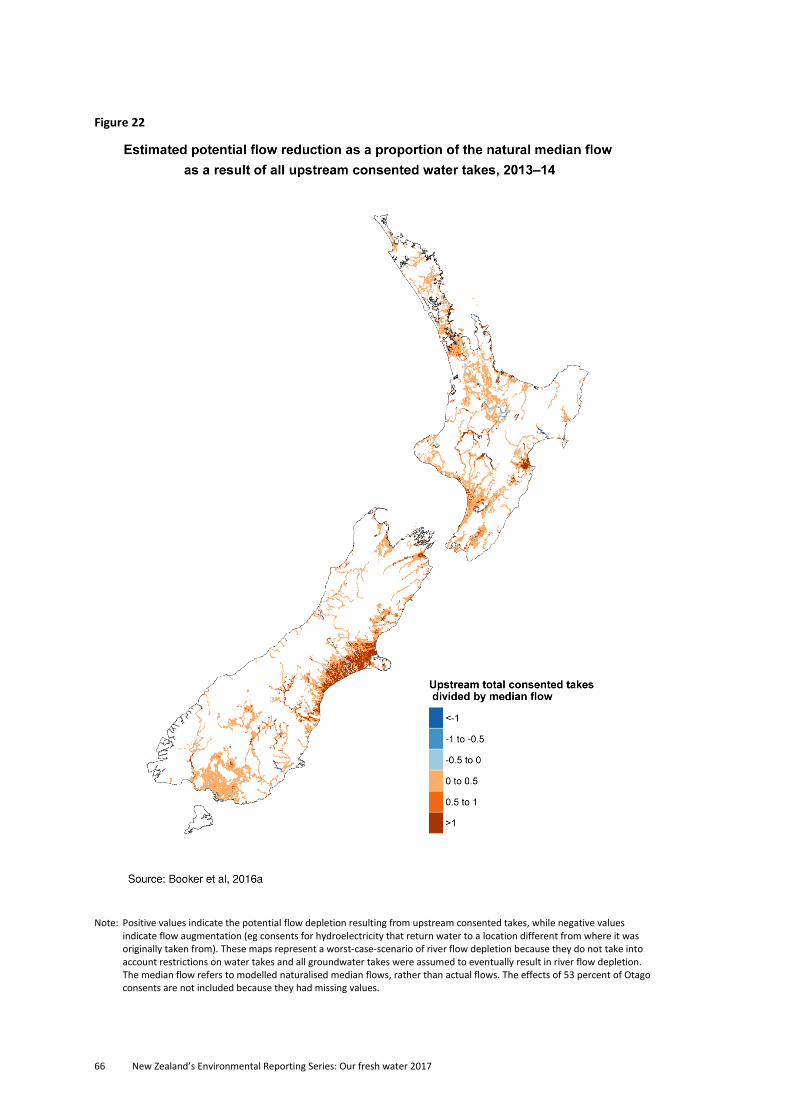
66 New Zealand’s Environmental Reporting Series: Our fresh water 2017
Figure 22
Note: Positive values indicate the potential flow depletion resulting from upstream consented takes, while negative values indicate flow augmentation (eg consents for hydroelectricity that return water to a location different from where it was originally taken from). These maps represent a worst-case-scenario of river flow depletion because they do not take into account restrictions on water takes and all groundwater takes were assumed to eventually result in river flow depletion. The median flow refers to modelled naturalised median flows, rather than actual flows. The effects of 53 percent of Otago consents are not included because they had missing values.
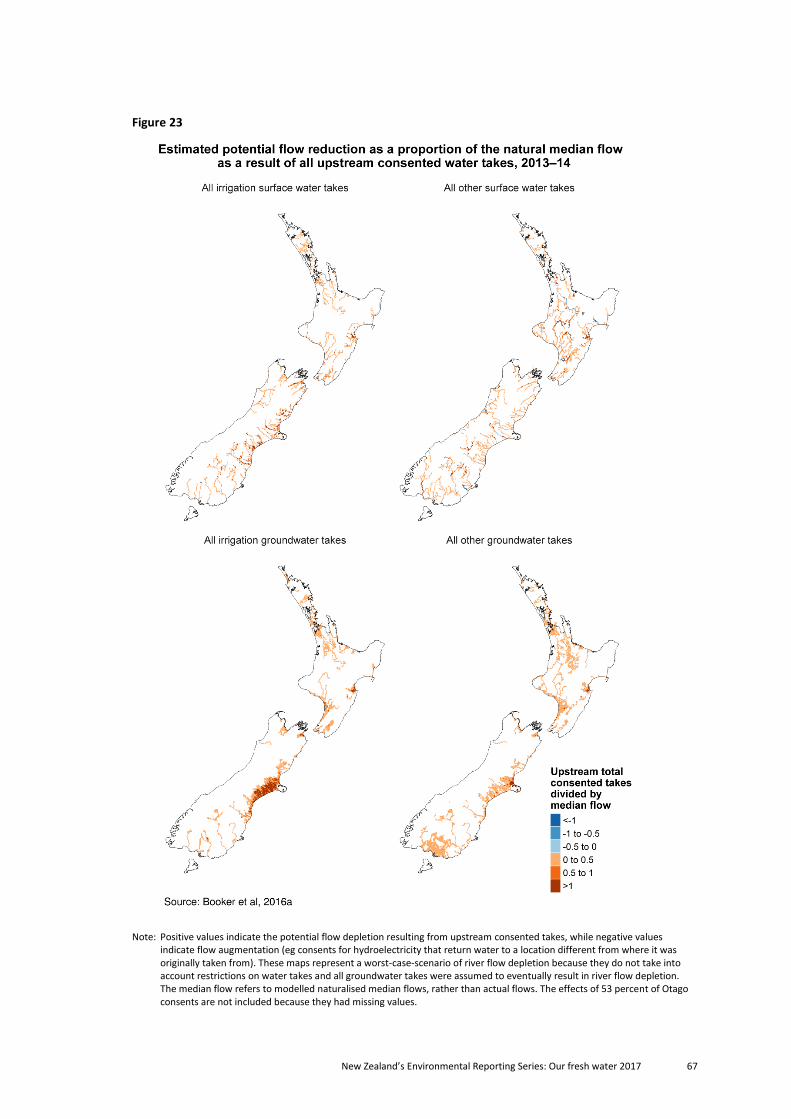
New Zealand’s Environmental Reporting Series: Our fresh water 2017 67
Figure 23
Note: Positive values indicate the potential flow depletion resulting from upstream consented takes, while negative values indicate flow augmentation (eg consents for hydroelectricity that return water to a location different from where it was originally taken from). These maps represent a worst-case-scenario of river flow depletion because they do not take into account restrictions on water takes and all groundwater takes were assumed to eventually result in river flow depletion. The median flow refers to modelled naturalised median flows, rather than actual flows. The effects of 53 percent of Otago consents are not included because they had missing values.
68 New Zealand’s Environmental Reporting Series: Our fresh water 2017
Implications of altered river flows Rainfall and snowmelt replenish our freshwater systems, and help determine natural river
and groundwater flows. New Zealand receives a plentiful supply of fresh water but it is not
uniform across the country, with rainfall generally much higher on the western side of both
the North and South islands. Climate change is predicted to affect rainfall patterns, which may
exacerbate pressures on freshwater quantity and flows in some areas of the country. Dams,
diversions, and water takes have changed the natural patterns of water flow.
Our reliance on irrigation, especially in drier regions, to support our economy, has the greatest
potential of all uses to cause altered flows downstream. Unnatural flow patterns can affect the
biodiversity, health, and mauri of freshwater ecosystems and many of the services they
provide (Booker et al, 2016b).
Data gaps We summarise some of many gaps in available data about water quality. We acknowledge that
information to fill some of these gaps may already exist, or research is underway. We intend to
provide information that will fill these gaps (if available) in our next report on fresh water.
Long-term water temperature and flow information.
The effects that pressures are having on flow regimes.
Information on actual water use and its impact on flow regimes.
Time series of how consented volumes have changed over time.
Information on the impact of human-made modifications, such as dams, piped sections of
rivers, and other channel modifications, on water flows.
Information on where and when restrictions on water takes are in place (eg consent
conditions may restrict water takes when the river flows fall below a certain flow rate) and
the impact of the restrictions on river flows.
The extent and volume of aquifers.
Information on how taking water from surface water bodies affects groundwater flows,
and vice versa.
Information on the effects of takes for permitted activities on flow regimes.
New Zealand’s Environmental Reporting Series: Our fresh water 2017 69
Ecosystems, habitats, and species
Top findings
Some water bodies have been physically changed, but we do not know the extent or the impact
this is having.
Fine sediment deposited on riverbeds is estimated to have increased, but we don’t know the
national extent or impact this is having.
Wetland extent has greatly reduced and losses continue.
Cultural health is rated moderate at most tested freshwater sites.
Of the native species we report on, around three-quarters of fish, one-third of invertebrates, and
one-third of plants are threatened with, or at risk of, extinction.
What is happening?
The health and mauri (life force) of some of our freshwater ecosystems declined because of
human activities that reduced water quality, increased sediment yields, altered water flows,
introduced pest species, and modified or lost habitats or the connections to habitats. These
changes resulted in a decline in the populations of freshwater species, and many of our native
freshwater plant, fish, and invertebrate species are now classified as threatened with or at risk
of extinction.
Why does it matter?
Many of these species are endemic (found nowhere else in the world) so our biodiversity is
nationally and internationally important. If the condition of freshwater ecosystems and habitats
declines, this affects the species within them, and the economic, recreational, and cultural
benefits we derive from them. The loss or decline in biodiversity can also have negative impacts
on other species and the functions of the wider ecosystem.
The condition of our freshwater habitats and species are influenced by human activities on
adjacent land, on river and lake margins, and within water bodies. Changes to flow regime,
degraded water quality, pest species, channel modification, presence of barriers to fish
migration, and increased sediment can also adversely affect biodiversity in these ecosystems.
This chapter covers:
Human activities are degrading some ecosystems
Status of the health and mauri of ecosystems and habitats
Status of our freshwater species
Implications of degrading ecosystems
Data gaps.
70 New Zealand’s Environmental Reporting Series: Our fresh water 2017
Human activities are degrading some ecosystems New Zealand has a long history of using river controls works, such as stop banks, weirs,
channel realignment, and streambank plantings (eg willow trees) to confine rivers to well-
defined channels and to protect nearby floodplains from floodwater that could damage
infrastructure and houses.
River channelling prevents river migration, makes floodplains available for infrastructure
development, increases agricultural efficiency, and improves flood control and security (Catlin
et al, 2017). However, river-control works alter the natural character of rivers including their
width, slope and depth, number of bends, and bed elevation/depth (Davies & McSaveney,
2011). These changes can erode river banks and increase deposition of sediments downstream
(Fuller et al, 2011).
River-control works reduce the ecological connectivity of floodplains (and associated lakes
and wetlands) within rivers by altering flood pulses into the floodplain. Flood pulses are an
important driver of connectivity within riverine floodplains – flood pulses aid in dispersing
seeds, establishing plants, cycling nutrients, scouring, depositing sediment, and maintaining
species richness (Catlin et al, 2017). This reduction in ecological connectivity of floodplains is
particularly important in rivers with low-gradient floodplains and prolonged floods, and less
important in rivers with steep gradients and flashy flows (Young et al, 2004).
Planting trees at the river edge or on banks is also a form of modifying physical habitats in
rivers. Riparian planting can be an effective way to quickly restore bank stability, improve
stream habitat, and control streambank erosion (Phillips & Daly, 2008). Willow trees are
commonly planted in New Zealand as they grow faster than native species. However, willow
can invade stream channels, causing stream diversions and blockages and disrupting habitats
for freshwater species (Phillips & Daly, 2008).
Deposited fine sediment can degrade freshwater habitats
Deposited sediment occurs naturally in the beds of rivers and streams, but too much fine
sediment (particles less than two millimetres in size) can severely degrade streambed habitat
(Davies-Colley et al, 2015). Excess fine sediment fills up the spaces between cobbles and gravel
used by fish and invertebrates and can alter food resources or make them difficult to consume
(Davies-Colley et al, 2015). Excess fine sediment can also affect the aesthetic appeal of rivers
and streams for human recreation.
Erosion from the land results in the deposition of sediment in rivers. For example, our fast-
eroding Southern Alps produce masses of sediment (eg boulders, rocks, cobbles, sand, silt, and
clay), most of which is initially displaced by landslides, large gullies (Fuller & Marden, 2008),
and earthflows (Glade, 1998). Sediment is then transported downstream by water and gravity;
during this time abrasion contributes to the creation of fine sediment. These processes of
transport and abrasion have contributed to the formation of our iconic braided river systems
and many of our flat land areas (like the Canterbury Plains) (Gray et al, 2016). Because
sediment is naturally transported longitudinally through a river network, its state at any given
point will be influenced by climate, geology, topography, and current velocity (Knighton, 1998).
New Zealand’s Environmental Reporting Series: Our fresh water 2017 71
Human activities can have a negative impact on the natural sediment cycle by accelerating the
delivery of sediment to streams and increasing the quantity of smaller particle sizes. Changes
in land cover are one factor that can alter rates of erosion (Dymond et al, 2010). Native forests
covered 85 to 90 percent of New Zealand before humans arrived around 1,000 years ago
(Quinn & Phillips, 2016). Polynesian settlers cleared the forests with fire, reducing the original
forest by half. Subsequent European colonisers further reduced forest cover to make way for
agricultural and urban land use (Quinn & Phillips, 2016). Accelerated erosion is still being
caused by human activities like earthworks, forest harvesting, livestock farming, and
cultivation practices. Basher (2013) suggested that annual sediment loads (the amount of
eroded sediment that makes its way into streams) from agriculture may have been declining
over the past 30 years. This is based on changes to land cover (eg an increase in plantation
forestry and scrubland), but does not take into account variations in weather or other factors
that may also be having an effect on sediment loads.
There are not many sites across the country where fine sediment deposition has been
observed over the long-term using consistent methods. This makes it challenging to report on
deposited fine sediment at a national level (Hicks et al, 2016; Clapcott et al, 2011).
A spatial model was developed using the sediment observations from the New Zealand
Freshwater Fish Database. The model estimated an average fine-sediment cover of 29 percent
for stream segments (Clapcott et al, 2011). The same model also estimated an average fine
sediment cover of 8 percent in the absence of human land use and land-cover change,
suggesting a significant increase in deposited fine sediment cover has occurred in New Zealand
rivers since human occupation. In future, collecting robust data is needed to validate such
estimations, as fine-sediment levels greater than 20 percent cover are known to have adverse
effects on streambed life (Clapcott et al, 2011; Burdon et al, 2013).
For more detail see Environmental indicators Te taiao Aotearoa: Streambed sedimentation.
Wetland habitats have been greatly reduced
Wetlands perform many functions. They filter nutrients and sediment from water, absorb
floodwaters, and provide habitat for plants, fish, and other animals. The draining of our
wetlands due to land-use change and farming practices has led to a loss of biodiversity and
natural function (Clarkson et al, 2013).
Although we have no national information on the health of our wetlands, we have
information on their extent. Before human habitation, wetlands covered approximately
2.5 million hectares of New Zealand’s land area. In 2008, the extent of wetlands reduced to
approximately 250,000 hectares – 10 percent of their original extent (Ausseil et al, 2008).
Wetland losses occurred historically through drainage and conversion to farmland (McGlone,
2009). Although we are less clear on contemporary patterns of national wetland extent, we
know that losses are still occurring today. For example, in Southland a loss of 1,235 hectares,
which equates to 10 percent of wetlands outside the area’s public conservation land, occurred
between 2007 and 2014–15 (Ewans, 2016).
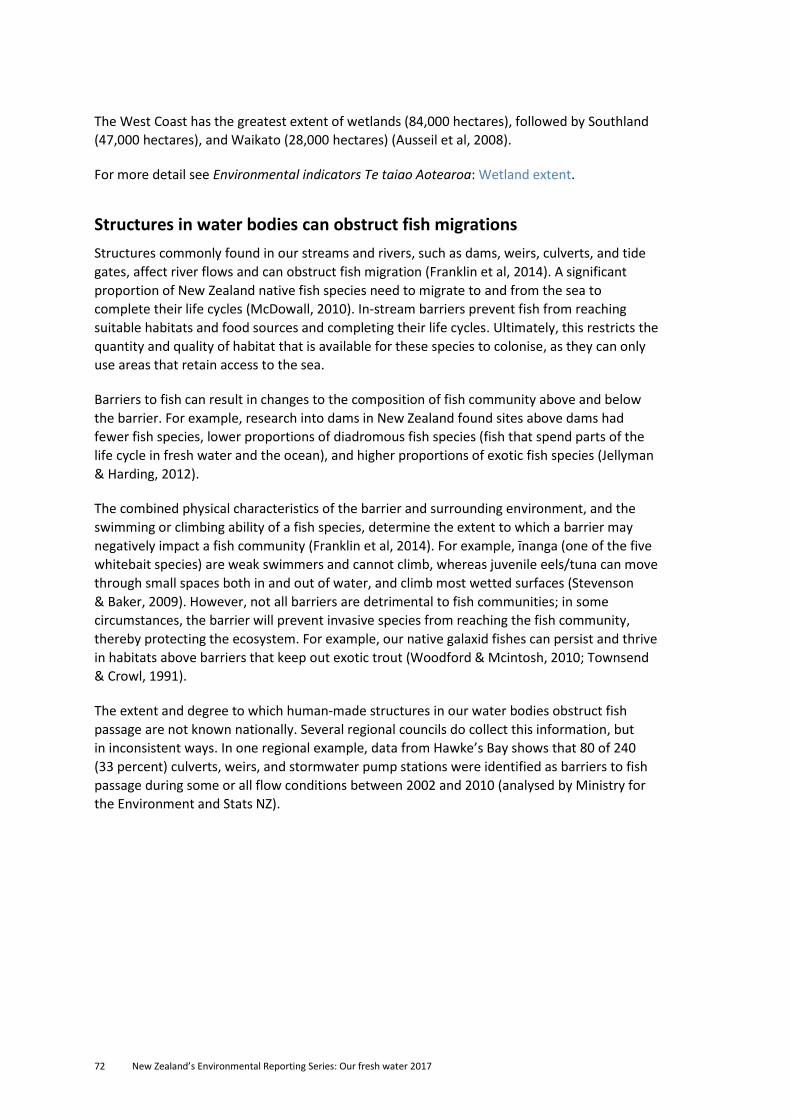
72 New Zealand’s Environmental Reporting Series: Our fresh water 2017
The West Coast has the greatest extent of wetlands (84,000 hectares), followed by Southland
(47,000 hectares), and Waikato (28,000 hectares) (Ausseil et al, 2008).
For more detail see Environmental indicators Te taiao Aotearoa: Wetland extent.
Structures in water bodies can obstruct fish migrations
Structures commonly found in our streams and rivers, such as dams, weirs, culverts, and tide
gates, affect river flows and can obstruct fish migration (Franklin et al, 2014). A significant
proportion of New Zealand native fish species need to migrate to and from the sea to
complete their life cycles (McDowall, 2010). In-stream barriers prevent fish from reaching
suitable habitats and food sources and completing their life cycles. Ultimately, this restricts the
quantity and quality of habitat that is available for these species to colonise, as they can only
use areas that retain access to the sea.
Barriers to fish can result in changes to the composition of fish community above and below
the barrier. For example, research into dams in New Zealand found sites above dams had
fewer fish species, lower proportions of diadromous fish species (fish that spend parts of the
life cycle in fresh water and the ocean), and higher proportions of exotic fish species (Jellyman
& Harding, 2012).
The combined physical characteristics of the barrier and surrounding environment, and the
swimming or climbing ability of a fish species, determine the extent to which a barrier may
negatively impact a fish community (Franklin et al, 2014). For example, īnanga (one of the five
whitebait species) are weak swimmers and cannot climb, whereas juvenile eels/tuna can move
through small spaces both in and out of water, and climb most wetted surfaces (Stevenson
& Baker, 2009). However, not all barriers are detrimental to fish communities; in some
circumstances, the barrier will prevent invasive species from reaching the fish community,
thereby protecting the ecosystem. For example, our native galaxid fishes can persist and thrive
in habitats above barriers that keep out exotic trout (Woodford & Mcintosh, 2010; Townsend
& Crowl, 1991).
The extent and degree to which human-made structures in our water bodies obstruct fish
passage are not known nationally. Several regional councils do collect this information, but
in inconsistent ways. In one regional example, data from Hawke’s Bay shows that 80 of 240
(33 percent) culverts, weirs, and stormwater pump stations were identified as barriers to fish
passage during some or all flow conditions between 2002 and 2010 (analysed by Ministry for
the Environment and Stats NZ).
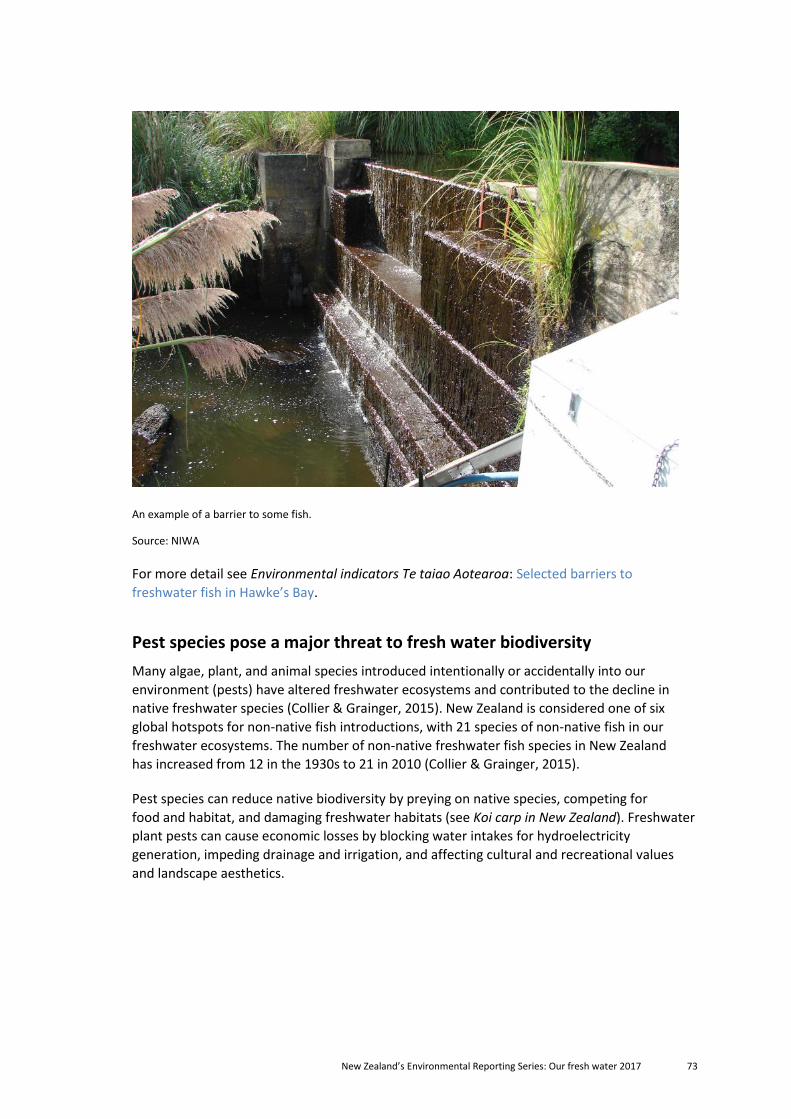
New Zealand’s Environmental Reporting Series: Our fresh water 2017 73
An example of a barrier to some fish.
Source: NIWA
For more detail see Environmental indicators Te taiao Aotearoa: Selected barriers to
freshwater fish in Hawke’s Bay.
Pest species pose a major threat to fresh water biodiversity
Many algae, plant, and animal species introduced intentionally or accidentally into our
environment (pests) have altered freshwater ecosystems and contributed to the decline in
native freshwater species (Collier & Grainger, 2015). New Zealand is considered one of six
global hotspots for non-native fish introductions, with 21 species of non-native fish in our
freshwater ecosystems. The number of non-native freshwater fish species in New Zealand
has increased from 12 in the 1930s to 21 in 2010 (Collier & Grainger, 2015).
Pest species can reduce native biodiversity by preying on native species, competing for
food and habitat, and damaging freshwater habitats (see Koi carp in New Zealand). Freshwater
plant pests can cause economic losses by blocking water intakes for hydroelectricity
generation, impeding drainage and irrigation, and affecting cultural and recreational values
and landscape aesthetics.
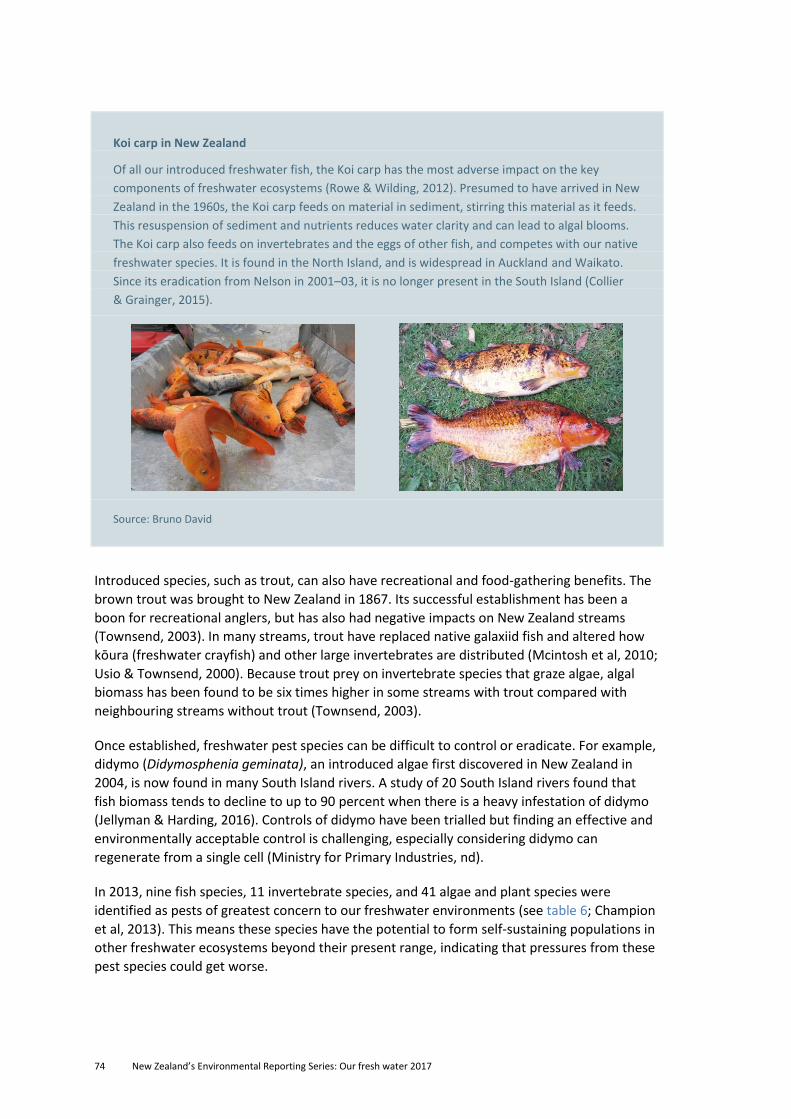
74 New Zealand’s Environmental Reporting Series: Our fresh water 2017
Koi carp in New Zealand
Of all our introduced freshwater fish, the Koi carp has the most adverse impact on the key
components of freshwater ecosystems (Rowe & Wilding, 2012). Presumed to have arrived in New
Zealand in the 1960s, the Koi carp feeds on material in sediment, stirring this material as it feeds.
This resuspension of sediment and nutrients reduces water clarity and can lead to algal blooms.
The Koi carp also feeds on invertebrates and the eggs of other fish, and competes with our native
freshwater species. It is found in the North Island, and is widespread in Auckland and Waikato.
Since its eradication from Nelson in 2001–03, it is no longer present in the South Island (Collier
& Grainger, 2015).
Source: Bruno David
Introduced species, such as trout, can also have recreational and food-gathering benefits. The
brown trout was brought to New Zealand in 1867. Its successful establishment has been a
boon for recreational anglers, but has also had negative impacts on New Zealand streams
(Townsend, 2003). In many streams, trout have replaced native galaxiid fish and altered how
kōura (freshwater crayfish) and other large invertebrates are distributed (Mcintosh et al, 2010;
Usio & Townsend, 2000). Because trout prey on invertebrate species that graze algae, algal
biomass has been found to be six times higher in some streams with trout compared with
neighbouring streams without trout (Townsend, 2003).
Once established, freshwater pest species can be difficult to control or eradicate. For example,
didymo (Didymosphenia geminata), an introduced algae first discovered in New Zealand in
2004, is now found in many South Island rivers. A study of 20 South Island rivers found that
fish biomass tends to decline to up to 90 percent when there is a heavy infestation of didymo
(Jellyman & Harding, 2016). Controls of didymo have been trialled but finding an effective and
environmentally acceptable control is challenging, especially considering didymo can
regenerate from a single cell (Ministry for Primary Industries, nd).
In 2013, nine fish species, 11 invertebrate species, and 41 algae and plant species were
identified as pests of greatest concern to our freshwater environments (see table 6; Champion
et al, 2013). This means these species have the potential to form self-sustaining populations in
other freshwater ecosystems beyond their present range, indicating that pressures from these
pest species could get worse.
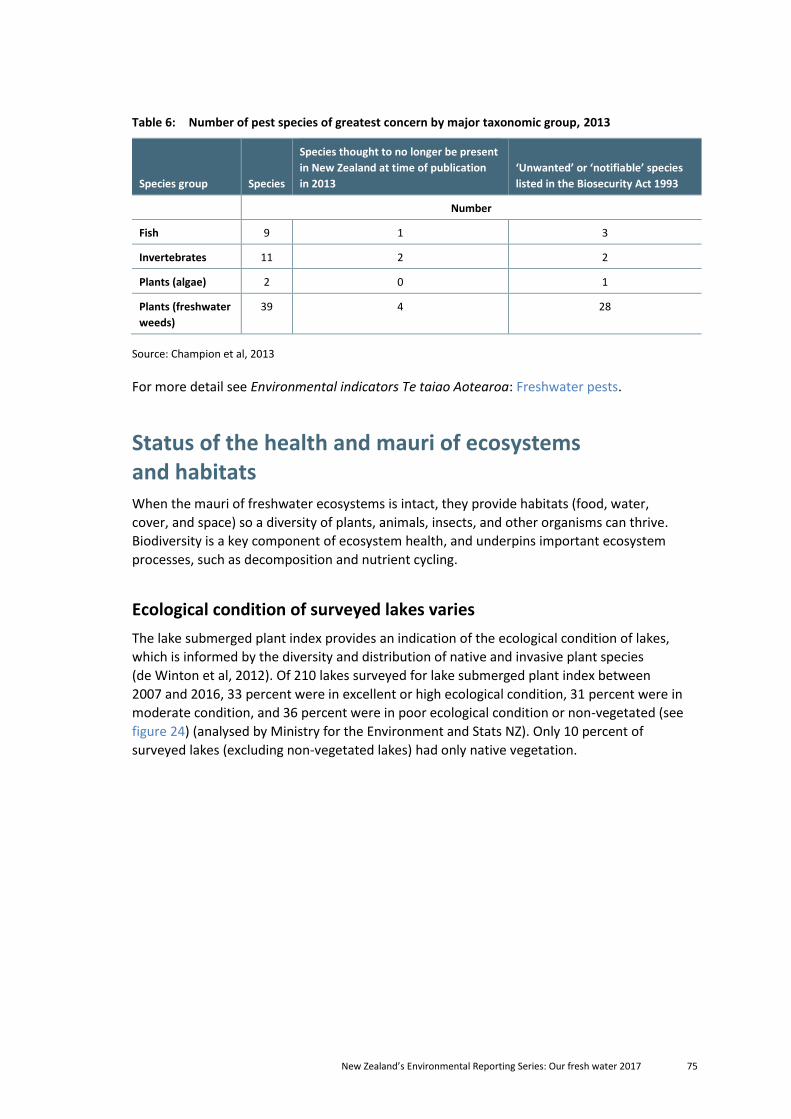
New Zealand’s Environmental Reporting Series: Our fresh water 2017 75
Table 6: Number of pest species of greatest concern by major taxonomic group, 2013
Species group Species
Species thought to no longer be present
in New Zealand at time of publication
in 2013
‘Unwanted’ or ‘notifiable’ species
listed in the Biosecurity Act 1993
Number
Fish 9 1 3
Invertebrates 11 2 2
Plants (algae) 2 0 1
Plants (freshwater
weeds)
39 4 28
Source: Champion et al, 2013
For more detail see Environmental indicators Te taiao Aotearoa: Freshwater pests.
Status of the health and mauri of ecosystems and habitats When the mauri of freshwater ecosystems is intact, they provide habitats (food, water,
cover, and space) so a diversity of plants, animals, insects, and other organisms can thrive.
Biodiversity is a key component of ecosystem health, and underpins important ecosystem
processes, such as decomposition and nutrient cycling.
Ecological condition of surveyed lakes varies
The lake submerged plant index provides an indication of the ecological condition of lakes,
which is informed by the diversity and distribution of native and invasive plant species
(de Winton et al, 2012). Of 210 lakes surveyed for lake submerged plant index between
2007 and 2016, 33 percent were in excellent or high ecological condition, 31 percent were in
moderate condition, and 36 percent were in poor ecological condition or non-vegetated (see
figure 24) (analysed by Ministry for the Environment and Stats NZ). Only 10 percent of
surveyed lakes (excluding non-vegetated lakes) had only native vegetation.
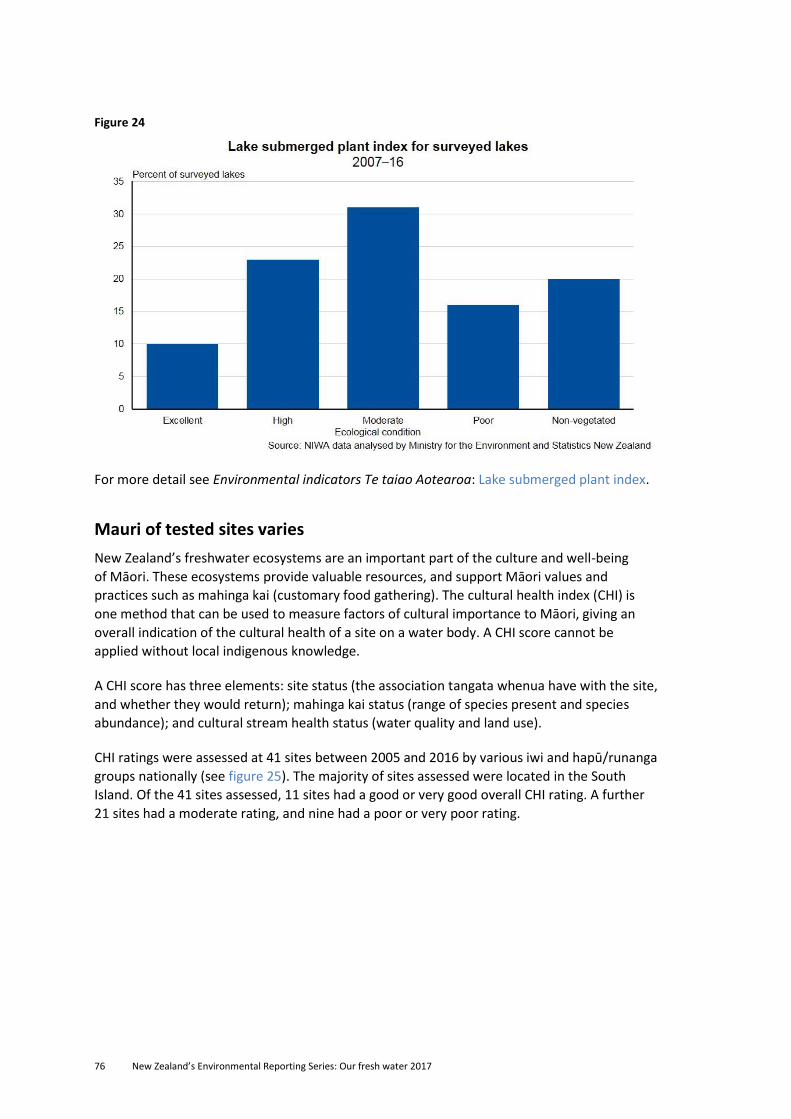
76 New Zealand’s Environmental Reporting Series: Our fresh water 2017
Figure 24
For more detail see Environmental indicators Te taiao Aotearoa: Lake submerged plant index.
Mauri of tested sites varies
New Zealand’s freshwater ecosystems are an important part of the culture and well-being
of Māori. These ecosystems provide valuable resources, and support Māori values and
practices such as mahinga kai (customary food gathering). The cultural health index (CHI) is
one method that can be used to measure factors of cultural importance to Māori, giving an
overall indication of the cultural health of a site on a water body. A CHI score cannot be
applied without local indigenous knowledge.
A CHI score has three elements: site status (the association tangata whenua have with the site,
and whether they would return); mahinga kai status (range of species present and species
abundance); and cultural stream health status (water quality and land use).
CHI ratings were assessed at 41 sites between 2005 and 2016 by various iwi and hapū/runanga
groups nationally (see figure 25). The majority of sites assessed were located in the South
Island. Of the 41 sites assessed, 11 sites had a good or very good overall CHI rating. A further
21 sites had a moderate rating, and nine had a poor or very poor rating.
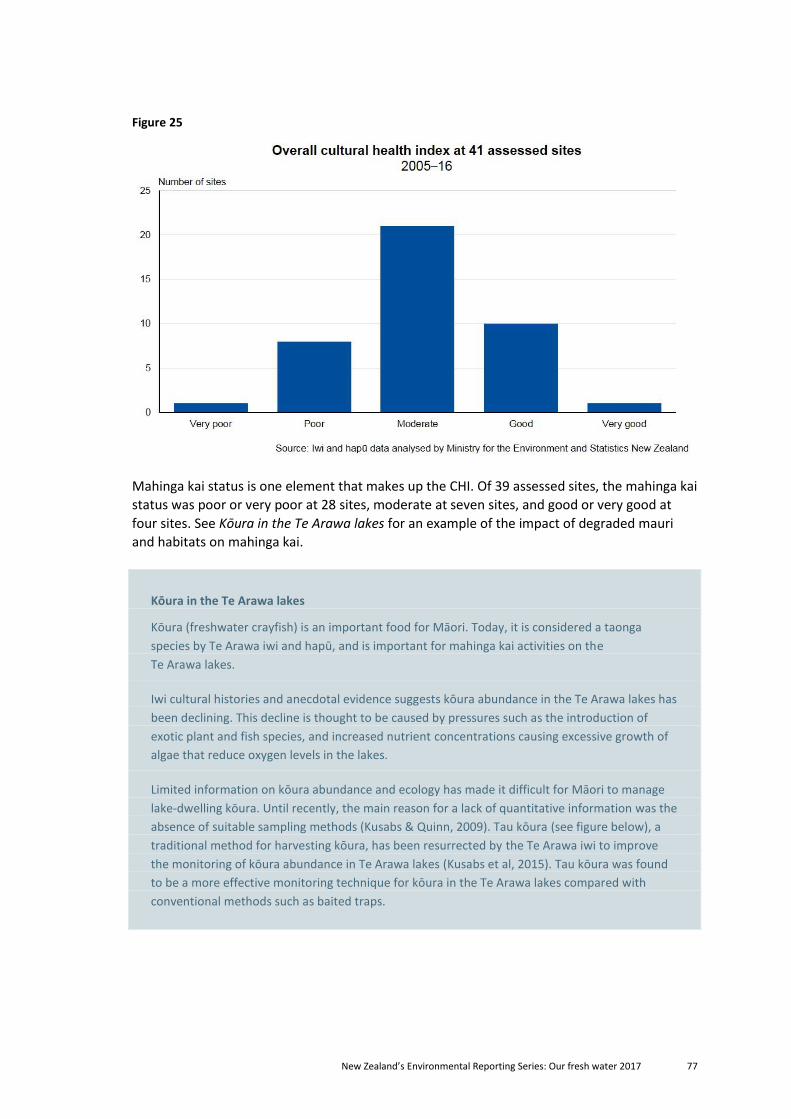
New Zealand’s Environmental Reporting Series: Our fresh water 2017 77
Figure 25
Mahinga kai status is one element that makes up the CHI. Of 39 assessed sites, the mahinga kai
status was poor or very poor at 28 sites, moderate at seven sites, and good or very good at
four sites. See Kōura in the Te Arawa lakes for an example of the impact of degraded mauri
and habitats on mahinga kai.
Kōura in the Te Arawa lakes
Kōura (freshwater crayfish) is an important food for Māori. Today, it is considered a taonga
species by Te Arawa iwi and hapū, and is important for mahinga kai activities on the
Te Arawa lakes.
Iwi cultural histories and anecdotal evidence suggests kōura abundance in the Te Arawa lakes has
been declining. This decline is thought to be caused by pressures such as the introduction of
exotic plant and fish species, and increased nutrient concentrations causing excessive growth of
algae that reduce oxygen levels in the lakes.
Limited information on kōura abundance and ecology has made it difficult for Māori to manage
lake-dwelling kōura. Until recently, the main reason for a lack of quantitative information was the
absence of suitable sampling methods (Kusabs & Quinn, 2009). Tau kōura (see figure below), a
traditional method for harvesting kōura, has been resurrected by the Te Arawa iwi to improve
the monitoring of kōura abundance in Te Arawa lakes (Kusabs et al, 2015). Tau kōura was found
to be a more effective monitoring technique for kōura in the Te Arawa lakes compared with
conventional methods such as baited traps.
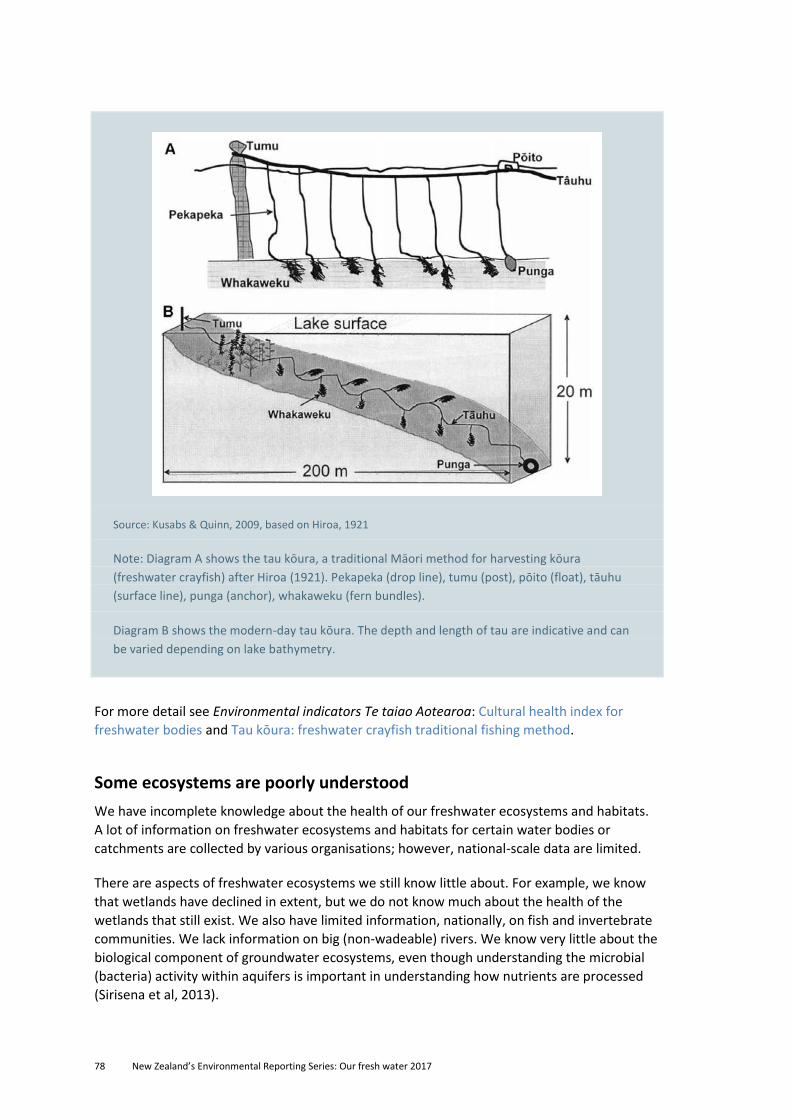
78 New Zealand’s Environmental Reporting Series: Our fresh water 2017
Source: Kusabs & Quinn, 2009, based on Hiroa, 1921
Note: Diagram A shows the tau kōura, a traditional Māori method for harvesting kōura
(freshwater crayfish) after Hiroa (1921). Pekapeka (drop line), tumu (post), pōito (float), tāuhu
(surface line), punga (anchor), whakaweku (fern bundles).
Diagram B shows the modern-day tau kōura. The depth and length of tau are indicative and can
be varied depending on lake bathymetry.
For more detail see Environmental indicators Te taiao Aotearoa: Cultural health index for
freshwater bodies and Tau kōura: freshwater crayfish traditional fishing method.
Some ecosystems are poorly understood
We have incomplete knowledge about the health of our freshwater ecosystems and habitats.
A lot of information on freshwater ecosystems and habitats for certain water bodies or
catchments are collected by various organisations; however, national-scale data are limited.
There are aspects of freshwater ecosystems we still know little about. For example, we know
that wetlands have declined in extent, but we do not know much about the health of the
wetlands that still exist. We also have limited information, nationally, on fish and invertebrate
communities. We lack information on big (non-wadeable) rivers. We know very little about the
biological component of groundwater ecosystems, even though understanding the microbial
(bacteria) activity within aquifers is important in understanding how nutrients are processed
(Sirisena et al, 2013).
New Zealand’s Environmental Reporting Series: Our fresh water 2017 79
Status of our freshwater species New Zealand has a diverse range of native freshwater plants, fish, and invertebrates, many
of which are endemic (found nowhere else in the world), while some have very localised
distributions.
Our freshwater environment supports approximately 53 known resident native freshwater fish
species (Goodman et al, 2014), and 630 known native freshwater invertebrate taxa (Grainger
et al, 2014), and 559 freshwater-dependant plant and algae taxa (Gerbeaux et al, 2016).
More than half our known fish species migrate between the sea and fresh water to complete
their life cycles, meaning they can be severely affected by barriers to migration in rivers and
streams (McDowall, 2010). In addition, 21 freshwater fish species, including trout and salmon,
have become naturalised after being deliberately or accidently introduced to New Zealand
through human activities (Collier & Grainger, 2015).
Many New Zealand bird species live around our wetlands, rivers, and lakes, including
threatened iconic and taonga species – kāki (black stilt), whio (blue duck), and the kōtuku
(white heron). Other native animals live in, or depend on, our freshwater ecosystems, such
as the at-risk Hochstetters frog. Wetland and riparian environments are also home to a
range of native plants – these include taonga species which Māori use in rongoa (medicine),
raranga/ahatu (weaving), and mahinga kai.
This section focuses on information we have on our freshwater fish, invertebrates, plants,
and algae.
Six of the 11 freshwater species for which we have data have declined in abundance over the past 39 years
The presence of a fish species at a site can be affected by changes in catchment land cover,
land use, in-stream habitat, fish passage (routes for moving up and down rivers and streams),
pests, and contaminants.
National-scale information on the abundance, distribution, and trends in freshwater fish is
currently limited. To overcome this limitation, trends in abundance of freshwater fish were
analysed using data from the New Zealand Freshwater Fish Database (NZFFD). However,
anyone can enter information in the NZFFD (ie there are no set sites or methods used for
capturing fish), which means there are sampling differences across sites and time.
To reduce the impact of sampling differences on the trends in the abundance of fish species
over time, NZFFD data was standardised using generalised linear models to take into account
the different number of samples between years and the differences in sampling (Crow et al,
2016). These models estimate the probability that a species will be present for each year of the
1977–2015 period.
There were enough data to assess trends in abundance for 10 fish species and for kōura
(freshwater crayfish). Of the 11 freshwater species, trends for six species were declining and
two were improving, over 39 years from 1977 to 2015 (Crow et al, 2016). The six fish species
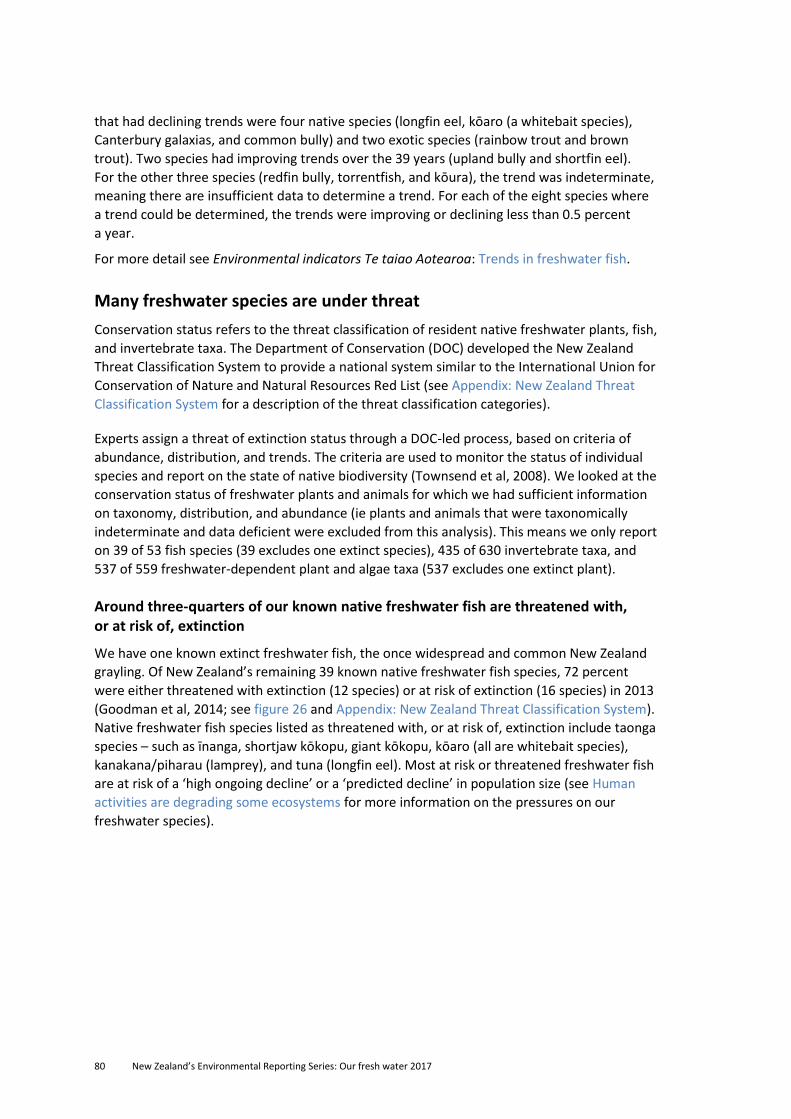
80 New Zealand’s Environmental Reporting Series: Our fresh water 2017
that had declining trends were four native species (longfin eel, kōaro (a whitebait species),
Canterbury galaxias, and common bully) and two exotic species (rainbow trout and brown
trout). Two species had improving trends over the 39 years (upland bully and shortfin eel).
For the other three species (redfin bully, torrentfish, and kōura), the trend was indeterminate,
meaning there are insufficient data to determine a trend. For each of the eight species where
a trend could be determined, the trends were improving or declining less than 0.5 percent
a year.
For more detail see Environmental indicators Te taiao Aotearoa: Trends in freshwater fish.
Many freshwater species are under threat
Conservation status refers to the threat classification of resident native freshwater plants, fish,
and invertebrate taxa. The Department of Conservation (DOC) developed the New Zealand
Threat Classification System to provide a national system similar to the International Union for
Conservation of Nature and Natural Resources Red List (see Appendix: New Zealand Threat
Classification System for a description of the threat classification categories).
Experts assign a threat of extinction status through a DOC-led process, based on criteria of
abundance, distribution, and trends. The criteria are used to monitor the status of individual
species and report on the state of native biodiversity (Townsend et al, 2008). We looked at the
conservation status of freshwater plants and animals for which we had sufficient information
on taxonomy, distribution, and abundance (ie plants and animals that were taxonomically
indeterminate and data deficient were excluded from this analysis). This means we only report
on 39 of 53 fish species (39 excludes one extinct species), 435 of 630 invertebrate taxa, and
537 of 559 freshwater-dependent plant and algae taxa (537 excludes one extinct plant).
Around three-quarters of our known native freshwater fish are threatened with, or at risk of, extinction
We have one known extinct freshwater fish, the once widespread and common New Zealand
grayling. Of New Zealand’s remaining 39 known native freshwater fish species, 72 percent
were either threatened with extinction (12 species) or at risk of extinction (16 species) in 2013
(Goodman et al, 2014; see figure 26 and Appendix: New Zealand Threat Classification System).
Native freshwater fish species listed as threatened with, or at risk of, extinction include taonga
species – such as īnanga, shortjaw kōkopu, giant kōkopu, kōaro (all are whitebait species),
kanakana/piharau (lamprey), and tuna (longfin eel). Most at risk or threatened freshwater fish
are at risk of a ‘high ongoing decline’ or a ‘predicted decline’ in population size (see Human
activities are degrading some ecosystems for more information on the pressures on our
freshwater species).
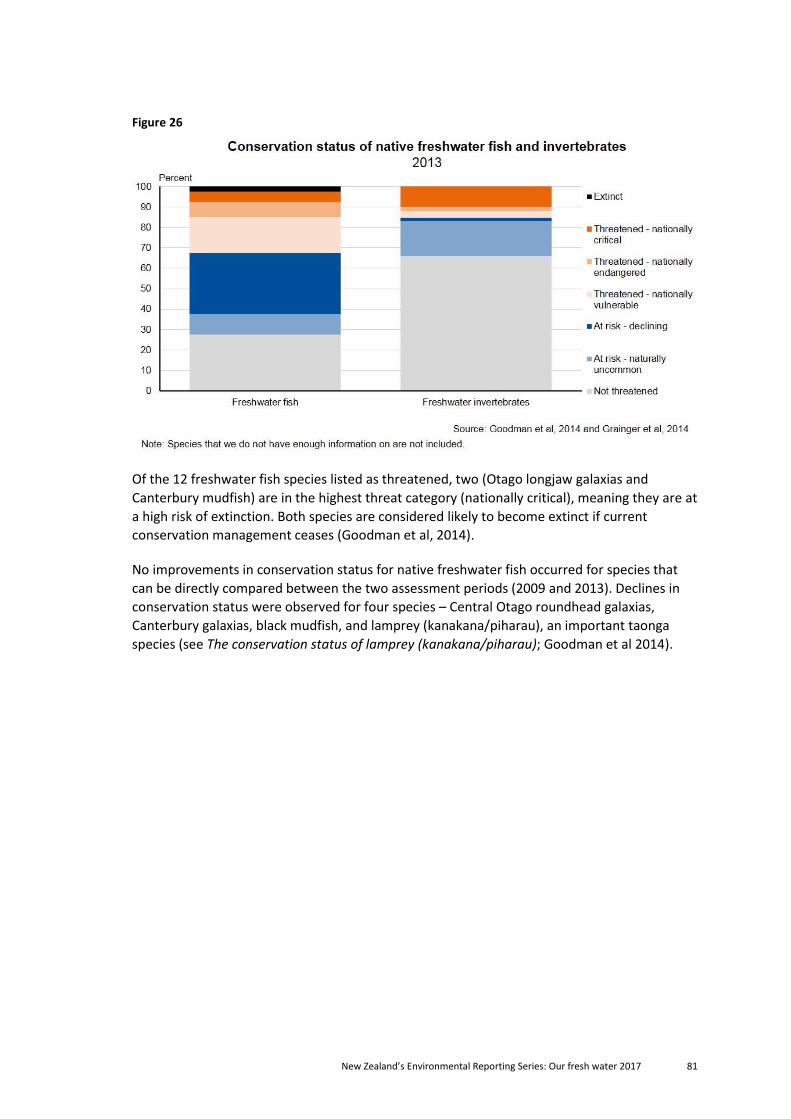
New Zealand’s Environmental Reporting Series: Our fresh water 2017 81
Figure 26
Of the 12 freshwater fish species listed as threatened, two (Otago longjaw galaxias and
Canterbury mudfish) are in the highest threat category (nationally critical), meaning they are at
a high risk of extinction. Both species are considered likely to become extinct if current
conservation management ceases (Goodman et al, 2014).
No improvements in conservation status for native freshwater fish occurred for species that
can be directly compared between the two assessment periods (2009 and 2013). Declines in
conservation status were observed for four species – Central Otago roundhead galaxias,
Canterbury galaxias, black mudfish, and lamprey (kanakana/piharau), an important taonga
species (see The conservation status of lamprey (kanakana/piharau); Goodman et al 2014).
82 New Zealand’s Environmental Reporting Series: Our fresh water 2017
The conservation status of lamprey (kanakana/piharau)
The lamprey (kanakana/piharau) is a unique freshwater fish species. Like the tuatara, it is often
described as a living fossil that has remained unchanged for hundreds of millions of years. It is a
jawless fish, with a distinctive sucking disk mouth. The lamprey migrates into rivers to spawn, and
the juvenile lamprey spends four years in rivers and streams before migrating out to sea. The
lamprey is a taonga, and is a traditionally important mahinga kai species. It is threatened with
extinction (Goodman et al, 2014).
Source: Robert Holdaway
For more detail see Environmental indicators Te taiao Aotearoa: Conservation status of
freshwater fish and invertebrates.
About one-third of our known native freshwater invertebrates are threatened with, or at risk of, extinction
Freshwater invertebrates include many organisms such as crustaceans, molluscs, worms,
and freshwater insects. In 2013, 34 percent of our known native freshwater invertebrates were
threatened with extinction (66 species of 435) or at risk of extinction (82 species) (Grainger
et al, 2014; see figure 26). The South Island kōura (freshwater crayfish) and all three species
of freshwater mussel (kākahi/kāeo) are included in the at risk or threatened categories.
Forty-two invertebrates (10 percent) are in the highest threat category (nationally critical).
Of the invertebrates that can be directly compared between assessment periods (2005–13),
three invertebrates had a decline in conservation status.
For more detail see Environmental indicators Te taiao Aotearoa: Conservation status of
freshwater fish and invertebrates.
New Zealand’s Environmental Reporting Series: Our fresh water 2017 83
Almost one-third of our known native freshwater-dependent plants are threatened with, or at risk of, extinction
Freshwater-dependent plants include vascular plants, mosses, hornworts and liverworts, and
green algae that live in and round freshwater. We have one known extinct plant, Stellaria
elatinoides, thought to have been naturally uncommon and succumbed to over-collection
and weed competition in its tussock and lake margin habitats (Norton et al, 1997). Of the
remaining 537 plant taxa, 71 plant taxa (13 percent) are threatened with extinction, of which
there are 34 plant taxa in the highest category, threatened – nationally critical (Gerbeaux et al,
2016). A further 97 plant taxa (18 percent) are at risk of extinction. None of the common
weaving plants (eg kiekie, pingao, raupo) are threatened with, or at risk of, extinction.
Our knowledge of our native freshwater biodiversity is limited
An additional 14 fish, 197 invertebrates, and 22 freshwater-dependant plants do not have
generally accepted or formalised taxonomy, or we lack sufficient information on their
distribution and abundance to assign a conservation threat classification. This means the
current number of species threatened with, or at risk of, extinction may be under-reported.
Biodiversity loss has wider ecosystem impacts
Declining ecosystem health and the resulting degradation and loss of habitat of some
freshwater bodies are affecting New Zealand’s freshwater biodiversity. Our freshwater algae,
plants, fish, and invertebrates interact resulting in complex ecosystems. Invertebrates perform
important ecosystem services such as grazing on periphyton (algae) and breaking down leaves
and wood (Mcintosh, 2000). They also provide food for our native fish and birds and some
provide food to humans (eg kōura (freshwater crayfish) and kākahi (freshwater mussel)).
Changes to invertebrate communities through habitat loss (eg when sediment clogs spaces
between pebbles) can affect the ability of our native fish to feed, and the availability of
freshwater resources for food, and recreational and customary uses.
The loss or decline of a single species can have detrimental effects on other species and the
wider ecosystem. For example, a decline in numbers of the at-risk kōaro may also negatively
affect the at-risk kākahi (freshwater mussel), which use the kōaro as a host during the parasitic
larval stage of their life cycle (Phillips et al, 2007). In turn, a decline in kākahi numbers could
potentially result in less nutrients and sediment being filtered from the water, which in turn
may alter the water quality and habitat for other freshwater species.
Implications of degrading ecosystems The health and mauri of some of our freshwater environments, and the habitats and species
they support, have declined because of multiple pressures from human activities. The changes
to our fresh water are due to increased contaminants and sediment, altered water levels and
flows, introduced invasive species, and the building of dams and other in-stream structures.
Habitat degradation and loss are some of the most pervasive threats to freshwater species,
both internationally and in New Zealand (Weeks et al, 2016). Habitat degradation has resulted
84 New Zealand’s Environmental Reporting Series: Our fresh water 2017
in a decline in freshwater species throughout the world (Dudgeon et al, 2006), and
New Zealand is no exception. In addition, New Zealand is vulnerable to biodiversity loss,
as many of our native species are endemic (found nowhere else in the world). Our tourism
industry leverages on our reputation as a country with relatively unspoiled nature and unique
fauna. Freshwater ecosystems also provide opportunities and resources for recreational
activities such as fishing, and customary activities such as mahinga kai.
Data gaps We summarise some of the many gaps in available data about water quality. We acknowledge
that information to fill some of these gaps may already exist, or research is underway. We
intend to provide information that will fill these gaps (if available) in our next report on
fresh water.
Ecological and cultural health of wetlands.
The national extent and severity of barriers to fish migration.
Information on how the freshwater network is connected and the impact of modifications
to rivers on the connectivity of the network, including changes in physical habitat.
Nationally consistent deposited fine sediment data, and the impact of human-induced
accelerated erosion on freshwater habitats.
Freshwater habitat quality and quantity.
The linkages among biodiversity, ecosystem function, and environmental stress, including
stress improved by pest plant and animal species.
The health of taonga species and the impact this has on te ao Māori, including mahinga kai
practices.
Cultural health information on a larger number and geographic distribution of water
bodies.
The sensitivity and vulnerability of freshwater ecosystems to climate change.
Increased information on the taxonomy, distribution, and abundance of freshwater plants,
wading birds, amphibians, and freshwater fish, invertebrates and microorganisms.
National distribution and abundance data for freshwater fish, invertebrates, and plants.
New Zealand’s Environmental Reporting Series: Our fresh water 2017 85
Acknowledgements
We would like to thank the following people and organisations for their invaluable
contribution to this report.
Data providers
In New Zealand, environmental monitoring is shared across central government agencies,
Crown research institutes, and local government. Regional and unitary councils are obliged to
monitor our fresh water under the Resource Management Act 1991. Much of the information
in this report comes from the data regional councils and other agencies collect.
We would like to thank the following organisations for providing data for this report.
Auckland Council, Bay of Plenty Regional Council, Christchurch City Council, Department of
Conservation, Environmental Science and Research (ESR), Environment Canterbury,
Environment Southland, Gisborne District Council, GNS Science International, Hawke’s Bay
Regional Council, Horizons Regional Council, Landcare Research, Marlborough District Council,
MetService, Ministry for the Environment, Ministry for Primary Industries, Nelson City Council,
National Institute of Water and Atmospheric Research (NIWA), Northland Regional Council,
Otago Regional Council, Pukekiteraki Papatipu Runanga, Stats NZ, Taranaki Regional Council,
Tasman District Council, Te Arawa Lakes Trust, Waikato Regional Council, Wellington Regional
Council, West Coast Regional Council.
Peer reviewers
We would like to thank the following people and organisations for reviewing Our fresh water
2017.
Gary Brierley – University of Auckland Roger Young – Cawthron Institute
Technical advisors
We would like to thank our technical advisors for reviewing drafts of this report. Technical
advisors encompass a range of individuals from various organisations who have expertise in
technical matters related to the freshwater domain. The role of technical advisers is to
support freshwater reporting by providing advice on strategic and technical details of
environmental reporting of the Freshwater Domain.
Chris Daughney – GNS Science Clive Howard-Williams – NIWA David Hamilton – University of Waikato David West – Department of Conservation Dominique Noiton – Waikato Regional Council Doug Booker – NIWA Erica Williams – NIWA
86 New Zealand’s Environmental Reporting Series: Our fresh water 2017
Graham Sevicke-Jones – Environment Southland Joanne Clapcott – Cawthron Institute Ken Taylor – AgResearch Richard McDowell – AgResearch Rosemary Miller – Department of Conservation Scott Larned – NIWA Tim Davie – Environment Canterbury Ton Snelder – LWP Ltd
New Zealand’s Environmental Reporting Series: Our fresh water 2017 87
Glossary
agricultural intensification An increase in agricultural production per unit of inputs
(which may be labour, land, time, fertiliser, seed, feed
or cash).
agriculture The cultivation and breeding of animals, plants and fungi for
food, fiber, biofuel, medicinal plants, and other products
used to sustain and enhance human life.
aquifer An underground layer of water-bearing rock or sand from
which groundwater can be extracted.
biodiversity The variability among living organisms, and the ecological
systems they are part of. Includes the diversity within
species, between species, and of ecosystems.
catchment Area of land in which rainfall drains toward a common
stream, river, lake, or estuary.
climate change Change in global or regional climate patterns, evident over
an extended period (typically decades or longer). May be
due to natural factors or human activities.
E.coli (Escherichia coli) Bacteria normally found in the gut of warm-blooded
animals and people. Some types can cause illness, such as
Campylobacter, which can be transmitted through
contaminated water or food, or through contact with
infected animals or people.
ecosystem A community of plants, animals, and microorganisms in a
particular place or area, interacting with the non-living
components of their environment (like air, water, and
mineral soil).
endemic A plant or animal that occurs naturally only in one place
or region.
groundwater Water located beneath earth’s surface in pore spaces (the
spaces within a rock body that are not occupied by solid
material) and fractures of rock formations.
habitat A combination of environmental factors that provides food,
water, cover, and space that a living thing needs to survive
and reproduce.
indeterminate For river and lake water quality analyses, indeterminate
means there is not enough data to determine trend
direction (Larned et al, 2015). For groundwater quality,
indeterminate means the trend was not significant at a
p-value < 0.05.
88 New Zealand’s Environmental Reporting Series: Our fresh water 2017
indigenous Belonging naturally to a given region or ecosystem, as
opposed to an animal or plant that is exotic or introduced.
Also referred to as ‘native’.
invertebrate An animal without a backbone or spinal column. Insects,
spiders, worms, slaters, and many marine animals such as
corals, sponges, and jellyfish are examples of invertebrates.
macroinvertebrate Small animal that has no backbone and can be seen with
the naked eye (eg insects, freshwater crayfish, snails, and
worms).
mahinga kai Customary food gathering. Mahinga kai also refers to the
native freshwater species of plants, fish, and animals that
have traditionally been used as food, tools, and other
resources.
mātauranga Māori The knowledge, comprehension, or understanding of
everything visible and invisible existing in the universe, and
often used to mean ‘wisdom’. Often includes present-day,
historic, local, and traditional knowledge; systems for
transferring and storing knowledge; and goals, aspirations,
and issues from an indigenous perspective.
mauri Mauri means life force. It is the spark of life, the active
component that indicates life. Mauri is found in all living
things on earth, forests, rivers, gardens, lakes, the sea, and
the air. For Māori, all parts of the environment – animate
and inanimate – are infused with mauri (life force) and are
connected to one another.
median The midpoint of a series when the data are listed in
ascending order. Half the numbers or values are above the
midpoint, and half are below it.
monitoring site Site where equipment is deployed to sample and/or
measure the quality of water.
native Belonging naturally to a given region or ecosystem, as
opposed to an animal or plant that is exotic or introduced.
Also referred to as ‘indigenous’.
pastoral Land use for keeping and grazing livestock.
riparian Relating to, or situated on, the bank of a river or other
water body.
species A basic unit of biological classification, comprising individual
organisms that are very similar in appearance, anatomy,
physiology, and genetics, due to having relatively recent
common ancestors. Species can interbreed.
New Zealand’s Environmental Reporting Series: Our fresh water 2017 89
stream order Strahler stream order is used to define stream size based on
a hierarchy of streams from the source (or headwaters)
downstream. When two first-order streams come together,
they form a second-order stream. When two second-order
streams come together, they form a third-order stream,
and so on. At a confluence, if the two streams are not of the
same order, then the highest numbered order is maintained
on the downstream segment.
taxonomy The description, identification, naming, and classification of
organisms.
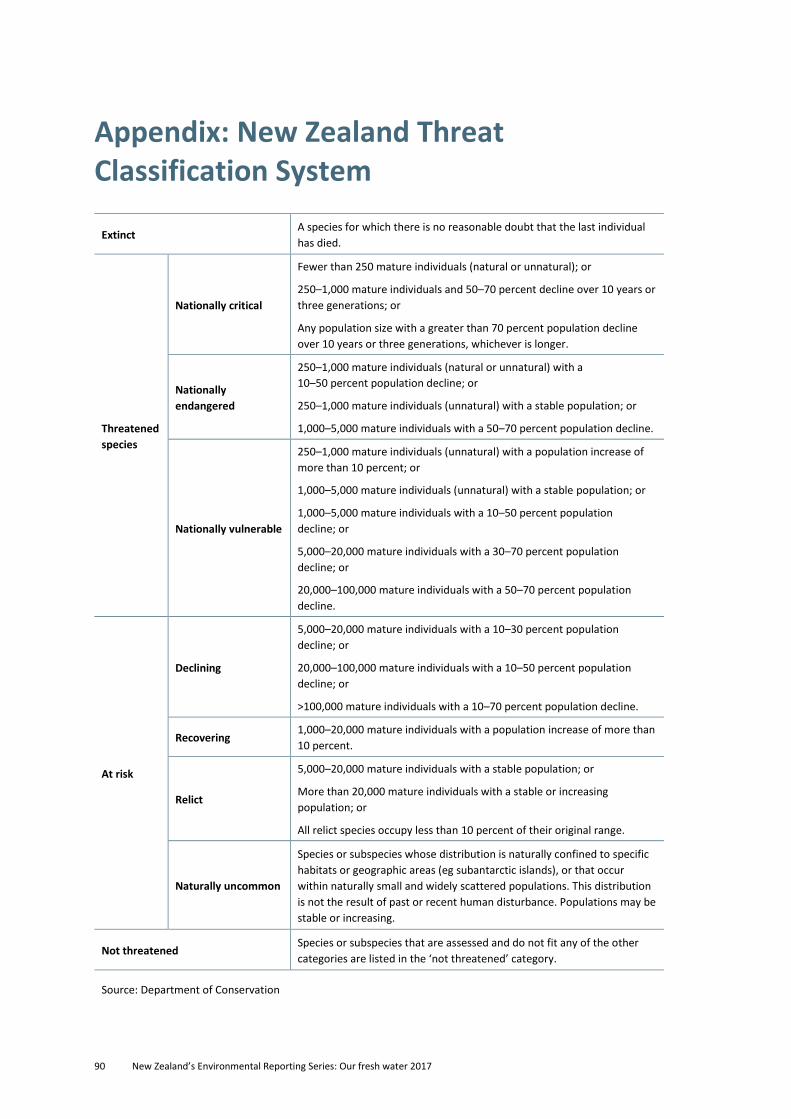
90 New Zealand’s Environmental Reporting Series: Our fresh water 2017
Appendix: New Zealand Threat Classification System
Extinct A species for which there is no reasonable doubt that the last individual
has died.
Threatened
species
Nationally critical
Fewer than 250 mature individuals (natural or unnatural); or
250–1,000 mature individuals and 50–70 percent decline over 10 years or
three generations; or
Any population size with a greater than 70 percent population decline
over 10 years or three generations, whichever is longer.
Nationally
endangered
250–1,000 mature individuals (natural or unnatural) with a
10–50 percent population decline; or
250–1,000 mature individuals (unnatural) with a stable population; or
1,000–5,000 mature individuals with a 50–70 percent population decline.
Nationally vulnerable
250–1,000 mature individuals (unnatural) with a population increase of
more than 10 percent; or
1,000–5,000 mature individuals (unnatural) with a stable population; or
1,000–5,000 mature individuals with a 10–50 percent population
decline; or
5,000–20,000 mature individuals with a 30–70 percent population
decline; or
20,000–100,000 mature individuals with a 50–70 percent population
decline.
At risk
Declining
5,000–20,000 mature individuals with a 10–30 percent population
decline; or
20,000–100,000 mature individuals with a 10–50 percent population
decline; or
>100,000 mature individuals with a 10–70 percent population decline.
Recovering 1,000–20,000 mature individuals with a population increase of more than
10 percent.
Relict
5,000–20,000 mature individuals with a stable population; or
More than 20,000 mature individuals with a stable or increasing
population; or
All relict species occupy less than 10 percent of their original range.
Naturally uncommon
Species or subspecies whose distribution is naturally confined to specific
habitats or geographic areas (eg subantarctic islands), or that occur
within naturally small and widely scattered populations. This distribution
is not the result of past or recent human disturbance. Populations may be
stable or increasing.
Not threatened Species or subspecies that are assessed and do not fit any of the other
categories are listed in the ‘not threatened’ category.
Source: Department of Conservation
New Zealand’s Environmental Reporting Series: Our fresh water 2017 91
References
Anastasiadis, S, & Kerr, S (2013). Land use and farming intensity: for 1996, 2008 and 2020. Prepared for the Parliamentary Commissioner for the Environment. Retrieved from www.pce.parliament.nz.
Auckland Council (2013). Auckland regional plan: Air land and water. Retrieved from www.aucklandcouncil.govt.nz.
Ausseil, A-GE, Gerbeaux, P, Chadderton, WL, Stephens, T, Brown, DJ, & Leathwick, J (2008). Wetland ecosystems of national importance for biodiversity: Criteria, methods and candidate list of nationally important inland wetlands. Landcare Research Contract Report LC0708/158 for the Department of Conservation.
Australian and New Zealand Environmental and Conservation Council (ANZECC) (2000). Australian and New Zealand Guidelines for Fresh and Marine Water Quality 2000. Townsville: Environment Australia. Retrieved from www.mfe.govt.nz.
Basher, L (2013). Erosion processes and their control in New Zealand. Retrieved from www.landcareresearch.govt.nz.
Berkett, N, Challenger, I, Sinner, J, & Tadaki, M (2013). Values, collaborative processes and indicators for freshwater planning. Report No. 2353. Cawthron Institute, Nelson, New Zealand. Retrieved from www.landcareresearch.co.nz.
Biggs, BJF (2000). New Zealand periphyton guidelines: detecting, monitoring and managing of enrichment of streams: background and guidelines. Ministry for the Environment, Wellington, New Zealand. Retrieved from www.mfe.govt.nz.
Booker, DJ (2015). Hydrological indices for national environmental reporting. Prepared for Ministry for the Environment. NIWA client report no. CHC2015-015. Retrieved from www.data.mfe.govt.nz.
Booker, DJ, Cattoen-Gilbert, C, Dudley, B, Henderson, RD, McMillan, H, & Yang, J (2017). A pressure-state-impact model for freshwater flows: with example application to Canterbury. Prepared for the Ministry for the Environment. NIWA Client Report no. 2017071CH. Retrieved from www.mfe.govt.nz.
Booker, D, Henderson, R, & Whitehead, A (2016a). National water allocation statistics for environmental reporting. Prepared for the Ministry for the Environment. NIWA Client Report no. 2017065CH. Retrieved from www.mfe.govt.nz.
Booker, DJ, Hayes, JW, Wilding, T, & Larned, ST (2016b). Advances in environmental flows research. In Jellyman, PG, Davie, TJA, Pearson, CP, & Harding, JS (Eds) Advances in Freshwater Research. New Zealand Freshwater Sciences Society & New Zealand Hydrological Society, 445–468.
Boubée, JA, Mitchell, CP, Chisnall, BL, West, DW, Bowman, EJ, & Haro, A (2001). Factors regulating the downstream migration of mature eels (Anguilla spp.) at Aniwhenua Dam, Bay of Plenty, New Zealand. New Zealand Journal of Marine and Freshwater Research, 35, 121–134.
Bunn, SE, & Arthington, AH (2002). Basic principles and ecological consequences of altered flow regimes for aquatic biodiversity. Environmental management 30(4), 492–507. Retrieved from www.deltacouncil.ca.gov.
Burdon FJ, McIntosh AR, & Harding, JS (2013). Habitat loss drives threshold response of benthic invertebrate communities to deposited sediment in agricultural streams. Ecological Applications, 23(5), 1036–1047.
Campbell, N, D’Arcy, B, Frost, A, Novotny, V, & Sansom, A (2004). Diffuse pollution. An introduction to the problems and solutions. London: IWA publishing, London.
Catlin, AK, Collier, KJ, & Duggan, IC (2017). Zooplankton generation following inundation of floodplain soils: Effects of vegetation type and riverine connectivity. Marine and Freshwater Research, 68, 76–86.
92 New Zealand’s Environmental Reporting Series: Our fresh water 2017
Champion, P, Rowe, D, Smith, B, Wells, R, Kilroy, C, & de Winton, M (2013). Freshwater pests of New Zealand. Retrieved from www.niwa.co.nz.
Clapcott, JE, Young, RG, Harding, JS, Matthaei, CD, Quinn, JM, & Death, RG (2011). Sediment assessment methods: Protocols and guidelines for assessing the effects of deposited fine sediment on in-stream values. Retrieved from www.cawthron.org.nz.
Clarkson, BR, Ausseil, AE, & Gerbeaux, P (2013). Wetland Ecosystem Services. In Dymond J (Ed), Ecosystem Services in New Zealand. Lincoln, New Zealand: Manaaki Whenua Press.
Crow, S, Snelder, T, Jellyman, P, Greenwood, M, & Dunn, A (2016). Temporal trends in the relative abundance of New Zealand freshwater fishes: Analysis of New Zealand Freshwater Fish Database records. Prepared for the Ministry for the Environment. NIWA Client Report No CHC2016-049. Retrieved from www.mfe.govt.nz.
Collier, KJ, & Grainger, NPJ (2015). Invasive fish management handbook. Lake Ecosystem Restoration New Zealand (LERNZ; The University of Waikato) and Department of Conservation, Hamilton, New Zealand. Retrieved from www.doc.govt.nz.
Collins, D, Zammit, C, Willsman, A, & Henderson, R (2015). Surface water components of New Zealand’s national water accounts, 1995–2014. Prepared for the Ministry for the Environment. Retrieved from www.data.mfe.govt.nz.
DairyNZ (2013). Making dairy farming work for everyone: strategy for sustainable dairy farming 2013–2020. Retrieved from www.dairynz.co.nz/dairystatistics.
Davies, T, & McSaveney, M (2011). Bedload sediment flux and flood risk management in New Zealand. Journal of Hydrology (NZ), 50(1), 181–190. Retrieved from www.hydrologynz.co.nz.
Davies-Colley, RJ (2013). River quality in New Zealand: An introduction and overview. In Dymond, JR (Ed), Ecosystem services in New Zealand – conditions and trends. Manaaki Whenua Press, Lincoln, New Zealand, pp 432–447.
Davies-Colley, R, Hicks, M, Hughes, A, Clapcott, J, Kelly, D, & Wagenhoff, A (2015). Fine sediment effects on freshwaters, and the relationship of environmental state to sediment load: A literature review. Prepared for the Ministry for the Environment. NIWA client report no: HAB2015-104. Retrieved from www.mfe.govt.nz.
de Winton, MD, Clayton, JS, & Edwards, T (2012). Incorporating invasive weeds into a plant indicator method (Lake SPI) to assess lake ecological condition. Hydrobiologia, 691(1), 47–58.
Dodd, RJ, McDowell, RW, & Condron, LM (2014). Manipulation of fertiliser regimes in phosphorus enriched soils can reduce phosphorus loss to leachate through an increase in pasture and microbial biomass production. Agriculture, Ecosystems and Environment, 185, 65–76.
Dudgeon, D, Arthington, AH, Gessner, MO, Kawabata, ZI, Knowler, DJ, Leveque, C, Naiman, RJ, Prieur-Richard, AH, Soto, D, Stiassny, MLJ, & Sullivan, CA (2006). Freshwater biodiversity: Importance, threats, status and conservation challenges. Biological Reviews, 81, 163–182.
Duncan, MJ, & Woods, RA (2004). Flow regimes. In Harding, JS, Mosely, MP, Pearson, CP, &Sorrell, BK (Eds), Freshwaters of New Zealand. Christchurch, New Zealand: New Zealand Hydrological Society Inc and New Zealand Limnological Society Inc . ISBN 0-476-00708-9.
Dymond, JR, Aussiel, A-GE, Parfitt, RL, Herzig, A, & McDowell, RW (2013). Nitrate and phosphorus leaching in New Zealand: A national perspective. New Zealand Journal of Agricultural Research, 56(1), 49–59, doi: 10.1080/00288233.2012.747185.
Dymond, JR, Betts, HD, & Schierlitz, CS (2010). An erosion model for evaluating regional land-use scenarios. Environmental modelling and software, 25(3), 289–298.
Ewans, R (2016). Environment Southland wetland inventory project: Monitoring wetland extent on non-public conservation land in the Southland region - Interim report for 2016. Prepared for Environment Southland. Retrieved from www.es.govt.nz.
New Zealand’s Environmental Reporting Series: Our fresh water 2017 93
Franklin, P, Bowie, S, & Bocker E (Eds) (2014). 2013 National Fish Passage Management Symposium. Proceedings of a Two Day Workshop (PDF, 1.37MB). Wellington, 26–27 November 2013. Retrieved from www.doc.govt.nz.
Fuller, IC, & Marden, M (2008). Connectivity in steep-land environments: Gully-–fan coupling in the Tarndale system, Waipaoa Catchment, New Zealand. No. 325. IAHS Publication. 275–282. Retrieved from www.iahs.info.
Fuller, IC, Richardson, JM, Basher, L, Dykes, RC, & Vale, SS (2011). Responses to river management? Geomorphic change over decadal and annual timescales in two gravel-bed rivers in New Zealand. In D Molina (Ed), River channels: Types, dynamics and changes. Nova Science Publishers, Inc.
Gadd, J (2016). Urban streams water quality state and trends. Prepared for Ministry for the Environment. Retrieved from www.mfe.govt.nz.
Gerbeaux, P, Champion, P, & Dunn, N (2016). Conservation of freshwaters. In Jellyman, PG, Davie, TJA, Pearson, CP, & Harding, JS (Eds), Advances in freshwater research. New Zealand Freshwater Sciences Society & New Zealand Hydrological Society.
Glade, T (1998). Establishing the frequency and magnitude of landslide-triggering rainstorm events in New Zealand. Environmental Geology 35, 160–174. Retrieved from www.univie.ac.at.
Goodman, JM, Dunn, NR, Ravenscroft, PJ, Allibone, RM, Boubee, JAT, David, BO, … Rolfe, JR (2014). Conservation status of New Zealand freshwater fish, 2013. Retrieved from www.doc.govt.nz.
Grainger, N, Collier, K, Hitchmough, R, Harding, J, Smith, B, & Sutherland, D (2014). Conservation status of New Zealand freshwater invertebrates, 2013. New Zealand Threat Classification Series 8. Retrieved from www.doc.govt.nz.
Gray, DP, Hicks, M, & Greenwood, MJ (2016). Advances in geomorphology and aquatic ecology of braided rivers. In Jellyman, PG, Davie, TJA, Pearson, CP, & Harding, JS (Eds), Advances in New Zealand freshwater science. New Zealand Freshwater Sciences Society & New Zealand Hydrological Society.
Greater Wellington Regional Council (2016). Toxic algae in Wellington region rivers. Retrieved from www.gwrc.govt.nz.
Greenwood, MJ, & Booker, DJ (2014). The influence of antecedent floods on aquatic invertebrate diversity, abundance and community composition. Ecohydrology, 8, 188–203.
Hamilton, DP, McBride, CG, Özkundakci, D, Schallenberg, M, Verburg, P, de Winton, M, Kelly, D, Hendy, CH, & Ye, W (2013). Effects of climate change on New Zealand lakes. In Goldman, CR (Ed), Climatic change and global warming of inland waters: impacts and mitigation for ecosystems and societies. Chichester, UK: John Wiley & Sons, Ltd.
Harmsworth, GR, & Awatere, S (2013). Indigenous Māori knowledge and perspectives on ecosystems (PDF, 652kB). In Dymond, JR (Ed), Ecosystem services in New Zealand – conditions and trends. Retrieved from www.landcareresearch.co.nz.
Hicks, DM, Greenwood, M, Clapcott, J, Davies-Colley, R, Dymond, J, Hughes, A, Shankar, U, & Walter, K (2016). Sediment attributes Stage 1. Prepared for Ministry for the Environment. NIWA client report no. CHC2016-058. Retrieved from www.mfe.govt.nz.
Hiroa, TR (1921). Māori food supplies of Lake Rotorua, with methods of obtaining them, and usages and customs appertaining thereto. Transactions of the New Zealand Institute, 26, 429–451.
Humphries, B, & Close, M (2014). National survey of pesticides in groundwater 2014. Prepared for the regional councils. ESR report number CSC 15003.
Irrigation New Zealand (nd). History of irrigation. Retrieved on 3 March 2017 from www.irrigationnz.co.nz.
Jellyman, PG, & Harding, JS (2012). The role of dams in altering freshwater fish communities in New Zealand. New Zealand Journal of Marine and Freshwater Research, 46 (4), 475–489.
94 New Zealand’s Environmental Reporting Series: Our fresh water 2017
Jellyman, PG, & Harding, JS (2016). Disentangling the stream community impacts of Didymosphenia geminate: How are higher trophic levels affected? J.S. Biol Invasions, 18, 3419.
Jowett, IG, & Biggs, BJF (2008). Application of the ‘natural flow paradigm’ in a New Zealand context. River Research and Applications. DOI: 10.1002/rra.1208.
Jowett, IG, Richarson, J, & Bonnett, ML (2005). Relationship between flow regime and fish abundances in a gravel-bed river, New Zealand. Journal of Fish Biology, 66 (5), 1419–1436.
Jowett, IG, & Richardson, J (1995). Habitat preferences of common, riverine New Zealand native fishes and implications for flow management. New Zealand Journal of Marine and Freshwater Research, 29, 1, 13–23.
Julian, JP, de Beurs, KM, Owsley, B, Davies-Colley, RJ, & Ausseil, A-GE (2017). River water quality changes in New Zealand over 26 years: Response to land use intensity. Hydrology and Earth System Sciences, 21, 1149–1171.
Kāti Huirapa Rūnaka ki Puketeraki (2016). He Pātaka Wai Ora Project (Waikouaiti River, Otago). Prepared for the Ministry for the Environment. Wellington: Ministry for the Environment.
Kennedy, P, & Sutherland, S (2008). Urban sources of copper, lead and zinc (PDF, 3.35MB). Prepared for Auckland Regional Council. Auckland Regional Council Technical Report 2008/023. Retrieved from www.aucklandcity.govt.nz.
Knighton, D (1998). Fluvial Forms and Processes: A New Perspective. London: Hodder Headline Group.
Kusabs, IA, Hicks, BJ, Quinn, JM, & Hamilton, DP (2015). Sustainable management of freshwater crayfish (kōura, Paranephrops planifrons) in Te Arawa (Rotorua) lakes, North Island, New Zealand. Fisheries Research, 168, 35–46.
Kusabs, IA, & Quinn, JM (2009). Use of a traditional Māori harvesting method, the tau kōura, for monitoring kōura (freshwater crayfish, Paranephrops planifrons) in Lake Rotoiti, North Island, New Zealand. New Zealand Journal of Marine and Freshwater Research, 43, 713–722. Retrieved from www.niwa.co.nz.
Land Environment & People (2010). The river values assessment system. Retrieved from www.envirolink.govt.nz.
Larned, ST (2010). A Prospectus for periphyton: recent and future ecological research. Journal of the North American Benthological Society, 29,182–206. Retrieved from www.bioone.org.
Larned, S, Snelder, T, Unwin, M, McBride, G, Verburg, P, & McMillan, H (2015). Analysis of water quality in New Zealand lakes and rivers: Data sources, data sets, assumptions, limitations, methods and results. Prepared for the Ministry for the Environment. NIWA Client Report no. CHC2015-033. Retrieved from https://data.mfe.govt.nz.
Larned, S, Snelder, T, & Unwin M (2017). Water quality in New Zealand rivers: Modelled water quality state. Prepared for the Ministry for the Environment. NIWA Client Report no. tbd. Wellington: NIWA. Retrieved from www.mfe.govt.nz.
Larned, S, & Unwin, M (2012).Representativeness and statistical power of the New Zealand river monitoring network. Prepared for the Ministry of the Environment. NIWA Client Report no. CHC2012-079. Retrieved from www.mfe.govt.nz.
Lewis, M, James, J, Shaver, E, Blackbourn, S, Leahy, A, Seyb, R, Simcock, R, Wihongi, P, Sides, E, & Coste, C (2015). Water sensitive design for stormwater. Auckland Council Guideline Document GD2015/004. Prepared by Boffa Miskell for Auckland Council. Retrieved from www.aucklanddesignmanual.co.nz.
Local Government New Zealand (2014). Exploring the issues facing New Zealand’s water, wastewater and stormwater sector: An issues paper prepared for LGNZ by Castalia Strategic Advisors. Retrieved from www.lgnz.co.nz.
New Zealand’s Environmental Reporting Series: Our fresh water 2017 95
McBride, G, Till, D, Ryan, T, Ball, A, Lewis, G, Palmer, S, & Weinstein, P (2002). Freshwater microbiological research programme project: Pathogen occurrence and human health risk assessment analysis. Retrieved from www.mfe.govt.nz.
MacLead, CJ, & Moller, H (2006). Intensification and diversification of New Zealand agriculture since 1960: An evaluation of current indicators of land use change. Agriculture, Ecosystems & Environment, 115(1-4), 201–218.
McBride, G, Till, D, Ryan, T, Ball, A, Lewis, G, Palmer, S, & Weinstein, P (2002). Freshwater microbiological research programme: Pathogen occurrence and human health risk assessment analysis. Prepared for the Ministry for the Environment. Wellington: Ministry for the Environment.
McDowall, RM (1990). New Zealand freshwater fishes; a natural history and guide. Wellington: Heinemann Reed.
McDowall, RM (2010). New Zealand freshwater fishes: An historical and ecological biogeography. New York: Springer.
McDowell, RW (2014). Estimating the mitigation of anthropogenic loss of phosphorus in New Zealand grassland catchments. Science of the Total Environment, 458-469, 1178–1186.
McDowell, RW, Cox, N, Daughney, CJ, Wheeler, D, Moreau, M (2015). A national assessment of the potential linkage between soil, and surface and groundwater concentrations of phosphorus. Journal of the American Water Resources Association, 51, 992–1002.
McDowell, RW, Littlejohn, RP, Blennerhassett, JD (2010). Phosphorus fertiliser form affects phosphorus loss to waterways: A paired catchment study. Soil Use and Management, 26, 365–373.
McDowell, RW, & Nash, D (2012). A review of the cost-effectiveness and suitability of mitigation strategies to prevent phosphorus loss from dairy farms in New Zealand and Australia. Journal of Environmental Quality, 41, 680–693.
McDowell, RW, Wilcock, B, & Hamilton, DP (2013). Assessment of strategies to mitigate the impact or loss of contaminants from agricultural land to fresh waters. Prepared for Ministry for the Environment. RE500/2013/066. Retrieved from www.mfe.govt.nz.
Mcintosh, AR (2000). Aquatic predator-prey interactions. In Collier, KJ, & Winterbourn MJ (Eds), New Zealand Stream Invertebrates: Ecology and implications for management. New Zealand Limnological Society.
Mcintosh, AR, McHugh, PA, Dunn, NR, Goodman, JM, Howard, SW, Jellyman, PG, O’Brien, LK, Nyström, P, & Woodford, DJ (2010). The impact of trout on galaxiid fishes in New Zealand. New Zealand Journal of Ecology, 34, 195–206.
McGlone, MS (2009). Postglacial history of New Zealand wetlands and implications for their conservation. New Zealand Journal of Ecology, 33(1) 1–23.
Ministry for Primary Industries (nd). Protection and response. Accessed on 24 April 2017.
Ministry for Primary Industries (2014). Future capability needs for the primary industries in New Zealand. Retrieved from www.mpi.govt.nz.
Ministry for the Environment (2007). Environment New Zealand 2007. Retrieved from www.mfe.govt.nz.
Ministry for the Environment (2014). New Zealand’s greenhouse gas inventory 1990–2012. Retrieved from www.mfe.govt.nz.
Ministry for the Environment (2016). Climate projections for New Zealand. Snapshot June 2016. Retrieved from www.mfe.govt.nz
Ministry for the Environment (2017). Clean water: 90 percent of rivers and lakes swimmable by 2040. Retrieved from www.mfe.govt.nz.

96 New Zealand’s Environmental Reporting Series: Our fresh water 2017
Ministry for the Environment and Statistics NZ (2015). Environment Aotearoa 2015. Retrieved from www.mfe.govt.nz.
Ministry for the Environment & Statistics New Zealand (2016). New Zealand’s Environmental Reporting
Series: Our marine environment 2016. Retrieved from www.mfe.govt.nz.
Ministry of Health (2008). Drinking-water standards for New Zealand 2005 (revised 2008). Retrieved from www.health.govt.nz.
Ministry of Business, Innovation and Employment (2013). Chart 18 – New Zealand’s top exports – percentage contribution by sector, 2013. Retrieved from www.mbie.govt.nz.
Morgenstern, U, Daughney, CJ, Leonard, G, Gordon, D, Donath, FM, & Reeves, R (2015). Using groundwater age and hydrochemistry to understand sources and dynamics of nutrient contamination through the catchment into Lake Rotorua, New Zealand. Hydrology and Earth System Sciences, 19(2), 803–822. Retrieved from www.hydrol-earth-syst-sci.net.
New Zealand Government (1996). Te Runanga o Ngai Tahu Act 1996. Retrieved from www.legislation.govt.nz.
New Zealand Government (2014). National policy statement for freshwater management 2014. Retrieved from www.mfe.govt.nz.
New Zealand Institute of Economic Research (NZIER) & AgFirst Consultants NZ Ltd (2014). Value of irrigation in New Zealand. Prepared for the Ministry for Primary Industries. Retrieved from www.mpi.govt.nz.
NIWA (nd). Stormwater – an introduction. Accessed 24 February 2017 from www.niwa.co.nz.
Norton, DA, Lord, JM, Given, DR, & de Lange, P (1997) Over-collecting: an over-looked factor in the extinction of plant taxa. Taxon, 43, 181–5.
O'Brien, JM, Lessard, JL, Plew, D, Graham, SE, & McIntosh, AR (2014) Aquatic macrophytes alter metabolism and nutrient cycling in lowland streams. Ecosystems, 17(3), 405–417.
OECD/Food and Agriculture Organization of the United Nations (2015). OECD-FAO Agricultural Outlook 2015-2024. Retrieved from www.fao.org.
Organisation for Economic Co-operation and Development (OECD) (2007). OECD Environmental performance reviews: New Zealand. Paris: OECD publishing.
Parfitt, RL, Baisden, WT, Schipper, AD, Mackay, AD (2008). Nitrogen inputs and outputs for New Zealand at national and regional scales: Past, present and future scenarios. New Zealand Journal of the Royal Society of New Zealand, 38(2), 71–87. Retrieved from www.tandfonline.com.
Parliamentary Commissioner for the Environment (2012). Water quality in New Zealand: Understanding the science. Retrieved from www.pce.parliament.nz.
Phillips, C, & Daly, C (2008). Use of willows or natives for stream bank control in New Zealand: a survey of regional councils. Prepared for stakeholders of the Motueka Integrated Catchment Management Programme. Retrieved from www.landcareresearch.co.nz.
Phillips, N, Parkyn, S, Kusabs, I, & Roper, D (2007). Taonga and mahinga kai species of the Te Arawa lakes: a review of current knowledge – kakahi. Prepared for Te Arawa Lakes Trust. NIWA client report HAM2007-022. Retrieved from www.niwa.co.nz.
Poyck, S, Hendrikx, J, McMillan, H, Hreinsson, EO, & Woods, R (2011). Combined snow and streamflow modelling to estimate impacts of climate change on water resources in the Clutha River, New Zealand. Journal of Hydrology (NZ), 50(2), 293–312.
Prime Minister’s Chief Science Advisor (2017). New Zealand’s fresh waters: values, state, trends and human impacts. Retrieved from www.pmcsa.org.nz.
New Zealand’s Environmental Reporting Series: Our fresh water 2017 97
Quinn, J, & Phillips, C (2016). Production forestry. In Jellyman, PG, Davie, TJA, Pearson, CP, & Harding, JS (Eds), Advances in New Zealand Freshwater Science. New Zealand Freshwater Sciences Society & New Zealand Hydrological Society.
Reisinger, A, Kitching, RL, Chiew, F, Hughes, L, Newton, PCD, Schuster, SS,… Whetton, P (2014). Australasia. In Field, CB, Barros, VR, Dokken, DJ, Mach, KJ, Mastrandrea, MD, Bilir, TE, … White, LL (Eds), Climate change 2014: Impacts, adaptation, and vulnerability. Part B: Regional aspects. Contribution of Working Group II to the Fifth Assessment Report of the Intergovernmental Panel on Climate Change (pp 1371–1438, table 25–1). Retrieved from https://ipcc.ch.
Robertson, H, Bowie, S, Death, R, Collins, D (Eds) (2016). Freshwater conservation under a changing climate. Proceedings of a workshop hosted by the Department of Conservation, 10–11 December 2013, Wellington. Department of Conservation, Christchurch. Retrieved from www.doc.govt.nz.
Rowe, DK, & Wilding, T (2012). Risk assessment model for the introduction of non-native freshwater fish into New Zealand. Journal of Applied Ichthyology, 28(4), 582–589.
Royal, TC (updated 17 February 2015). Te ao Mārama – the natural world. Te Ara – the Encyclopaedia of New Zealand. Retrieved from www.teara.govt.nz.
Schallenberg, M, de Winton, MD, Verburg, P, Kelly, DJ, Hamill, KD, & Hamilton, DP (2013). Ecosystem Services of Lakes. In: Dymond JR (Ed.), Ecosystem services in New Zealand: conditions and trends. Lincoln, New Zealand: Manaaki Whenua Press. pp. 203–225. Retrieved from www.landcareresearch.co.nz.
Sirisena, KA, Daughney, CJ, Moreau-Fournier, M, Ryan, KG, & Chambers, GK (2013). National survey of molecular bacterial diversity of New Zealand groundwater: Relationships between biodiversity, groundwater chemistry and aquifer characteristics. FEMS Microbiology. Ecology., 86, 490–504.
Snelder, T, & Biggs, B (2002). Multiscale river environment classification for water resources management. Journal of the American Water Resources Association, 38(5), 1225–1239.
Snelder, T, Biggs, B, Kilroy, C, & Booker, D (2013). National Objective Framework for periphyton. NIWA Client Report no. CHC2013-122. Retrieved from www.mfe.govt.nz.
Snelder, TH, Booker, DJ, Quinn, JM, & Kilroy, C (2014). Predicting periphyton cover frequency distributions across New Zealand’s rivers. JAWRA Journal of the American Water Resources Association 50, 111–127.
Snelder, T, Wood, S, & Atalah, J (2016). Strategic assessment of New Zealand’s freshwaters for recreational use: A human health perspective. Escherichia coli in rivers and planktonic cyanobacteria in lakes. Prepared for Ministry for the Environment. LWP Client report no. 2016-011.
Stark, JD, & Maxted, JR (2007). A user guide for the macroinvertebrate community index. Retrieved from www.mfe.govt.nz.
Statistics NZ (2013). 2013 Census. Retrieved from www.stats.govt.nz/Census.
Statistics NZ (2015a). Agricultural production statistics: June 2015 (final). Retrieved from www.stats.govt.nz.
Statistics NZ (2015b). Tourism satellite account: 2015. Retrieved from www.stats.govt.nz.
Stats NZ (2017). Asset value of water and other renewables for electricity generation: 2007–15. Wellington: Stats NZ.
Stevenson, C, & Baker, C (2009). Fish passage in the Auckland Region – a synthesis of current research. Prepared by NIWA for Auckland Regional Council. Auckland Regional Council Technical Publication 2009-084. Retrieved from www.aucklandcity.govt.nz.
Suren, A, & Elliot, S (2004). Impact of urbanisation on streams. In Harding, J, Mosley, P, Pearson, C, & Sorrell, B (Eds), Freshwaters of New Zealand. Christchurch, New Zealand: The Caxton Press, 35.1–35.17
Te Ara (nd). Story: sheep farming. Accessed 3 March 2017 from www.teara.govt.nz.
98 New Zealand’s Environmental Reporting Series: Our fresh water 2017
Tipa, G, Harmsworth, GR, Williams, E, & Kitson, JC (2016). Integrating mātauranga Māori into freshwater management, planning and decision making. In Jellyman, PG, Davie, TJA, Pearson, CP, & Harding, JS (Eds), Advances in New Zealand Freshwater Science. New Zealand Freshwater Sciences Society & New Zealand Hydrological Society.
Tipa, G, & Teirney, L (2006). A cultural health index for streams and waterways: A tool for nationwide use (PDF, 721kB). Retrieved from www.mfe.govt.nz.
Tourism New Zealand (2015). International visitor experience 2015. Retrieved from www.tourismnewzealand.com.
Townsend, CR (2003). Individual, population, community, and ecosystem consequences of a fish invader in New Zealand Streams. Conservation Biology, 17, 37–47.
Townsend, CR, & Crowl, TA (1991). Fragmented population structure in a native New Zealand fish: An effect of introduced Brown Trout. Nordic Society Oikos. 61(3), 347–354.
Townsend AJ, de Lange PJ, Duffy CAJ, Miskelly CM, Molloy J, & Norton DA (2008). New Zealand Threat Classification System manual. Wellington, Department of Conservation.
Usio, N, & Townsend, C (2000). Distribution of the New Zealand crayfish Paranephrops zealndicus in relation to stream physico-chemistry, predatory fish, and invertebrate prey. New Zealand Journal of Marine and Freshwater Research, 34(3), 557–567.
Walsh, CJ, Roy, AH, Feminella, JW, Cottinghan, PD, Groffman, PM, & Raymond, PM (2005). The urban stream syndrome: current knowledge and the search for a cure. Journal of the North American Benthological Society 24(3), 706–723. Retrieved from www.auburn.edu.
Webster, K, & Timperley, M (2004). Wastewater overflow monitoring: Cox's Bay catchment. MWR02215, MWR03220. Hamilton: NIWA, Hamilton.
Weeks, ES, Death, RG, Foote, K, Anderson-Lederer, R, Joy, MK, & Boyce, P (2016). Conservation science statement 1. The demise of New Zealand’s freshwater flora and fauna: a forgotten treasure. Pacific Conservation Biology (22)2, 110–115. Retrieved from www.publish.csiro.au.
Woodford, DJ, Mcintosh, AR. 2010. Evidence of source-sink metapopulations in a vulnerable native galadiid fish driven by introduced trout. Ecological Applications 20(4), 967–977.
Woodward, SJR, Barker, DJ, & Zyskowski, RF (2001). A practical model for predicting soil water deficit in New Zealand pastures. New Zealand Journal of Agricultural Research, 44(1), 91–109, DOI: 10.1080/00288233.2001.9513464.
Young, R, Smart, G, & Harding, J (2004). Impacts of hydro-dams, irrigation schemes and river control works. Chapter 37 in Harding, JS, Mosley, P, Pearson, C, & Sorrell, B (Eds), Freshwaters of New Zealand. New Zealand Hydrological Society and New Zealand Limnological Society. Retrieved from www.canterbury.ac.nz.