Embed Size (px)
Citation preview
Issues paper
ActewAGL electricity distribution regulatory proposal
2014–15 to 2018–19
July 2014
ActewAGL electricity distribution determination 2014–19 | Issues paper 1

© Commonwealth of Australia 2014This work is copyright. In addition to any use permitted under the Copyright Act
1968, all material contained within this work is provided under a Creative Commons Attribution 3.0 Australia licence, with the exception of:
the Commonwealth Coat of Arms
the ACCC and AER logos
any illustration, diagram, photograph or graphic over which the Australian Competition and Consumer Commission does not hold copyright, but which may be part of or contained within this publication.
The details of the relevant licence conditions are available on the Creative Commons website, as is the full legal code for the CC BY 3.0 AU licence.
Requests and inquiries concerning reproduction and rights should be addressed to the Director, Corporate Communications, ACCC, GPO Box 3131, Canberra ACT 2601, or [email protected] .
Inquiries about this decision should be addressed to:Australian Energy RegulatorGPO Box 520Melbourne Vic 3001Tel: (03) 9290 1444Fax: (03) 9290 1457
Email: [email protected]
AER reference: 52254 D14/92549
ActewAGL electricity distribution determination 2014–19 | Issues paper 2

Request for submissionsInterested parties are invited to make written submissions regarding ActewAGL's
regulatory proposal to us, the Australian Energy Regulator (AER), by close of business, 22 August 2014.
We prefer that all submissions sent in an electronic format are in Microsoft Word or other text readable document form. Submissions should be sent electronically to:
Alternatively, submissions can be sent to:
Mr Warwick AndersonGeneral ManagerAustralian Energy RegulatorGPO Box 3131Canberra ACT 2601Email: [email protected]
We prefer that all submissions be publicly available to facilitate an informed and transparent consultative process. Submissions will be treated as public documents unless otherwise requested. Parties wishing to submit confidential information are requested to:
clearly identify the information that is the subject of the confidentiality claim
provide a non-confidential version of the submission in a form suitable for publication.
All non-confidential submissions will be placed on our website at www.aer.gov.au. For further information regarding our use and disclosure of information provided to us, see the ACCC/AER Information Policy, October 2008 available on our website.
Enquires about this paper, or about lodging submissions, should be directed to our Network Finance and Reporting branch on (02) 6243 4933.
Next stepsWe will consider and respond to submissions on ActewAGL's regulatory proposal
in the context of our draft determination. We expect to publish our draft decision in November 2014.
ActewAGL electricity distribution determination 2014–19 | Issues paper 3

ContentsRequest for submissions................................................................................3
Shortened forms...........................................................................................5
Introduction..................................................................................................6
1 Our initial observations............................................................................7
2 Consumer engagement...........................................................................14
2.1 Consumer engagement in the rules....................................................................142.2 Our consumer engagement guideline.................................................................142.3 Consumer engagement to date...........................................................................15
3 Your submission and key dates...............................................................16
Attachments...............................................................................................18
1 Background to our assessment...............................................................19
1.1 The Australian Energy Regulator.........................................................................191.2 Who is ActewAGL?...............................................................................................191.3 The regulatory framework...................................................................................20
2 Capital expenditure................................................................................24
2.1 ActewAGL's capital expenditure proposal............................................................242.2 Key drivers of ActewAGL's capital expenditure proposal.....................................25
3 Operating expenditure...........................................................................27
3.1 ActewAGL's operating expenditure proposal.......................................................273.2 Key drivers of ActewAGL's operating expenditure proposal................................283.3 Forecast EBSS carryover amounts.......................................................................293.4 Cost pass throughs..............................................................................................29
4 Rate of return........................................................................................30
4.1 ActewAGL's proposed overall rate of return........................................................304.2 Return on equity..................................................................................................314.3 Return on debt....................................................................................................324.4 Imputation credits...............................................................................................33
5 Interrelationships between components of our decision...........................34
5.1 The building block model.....................................................................................34
ActewAGL electricity distribution determination 2014–19 | Issues paper 4
5.2 Interrelationships between building block components.......................................35
ActewAGL electricity distribution determination 2014–19 | Issues paper 5

Shortened formsShortened form Extended form
ACCC Australian Competition & Consumer Commission
ActewAGL ActewAGL Distribution
AEMC Australian Energy Market Commission
AER Australian Energy Regulator
capex capital expenditure
CCP consumer challenge panel
CPI consumer price index
distributor distribution network service provider
DUoS distribution use of system
EBSS efficiency benefit sharing scheme
NEL National Electricity Law
NEM National Electricity Market
NEO national electricity objective
NER, rules National Electricity Rules
opex operating expenditure
RAB regulatory asset base
RIN regulatory information notice
WACC, rate of return weighted average cost of capital
The key terms and their shortened forms, listed above, are largely derived from the National Electricity Rules (the rules). The shortened forms used here are commonly used by us, industry participants and other stakeholders.
ActewAGL electricity distribution determination 2014–19 | Issues paper 6
IntroductionActewAGL Distribution (ActewAGL) is an electricity network supply business servicing the Australian Capital Territory (ACT). It is a joint venture between the ACT Government and Jemena Ltd. ActewAGL has submitted to us for assessment its regulatory proposal for the next five year period (2014–19). This proposal will have a significant bearing on the price of electricity in the ACT until July 2019. If we, the Australian Energy Regulator (AER), were to accept this proposal without change, consumers could expect distribution network prices to increase by, on average, around 2.5 per cent each year. Whether or not the proposal should be accepted or revised is our responsibility. However, we are keen to hear the views of electricity consumers and other stakeholder as these views will form a critical part of our assessment.
We encourage consumers and stakeholders to tell us what you think about ActewAGL's proposal. This paper aims to draw to your attention to some of the issues we think are likely to be important. However, we will consider your submissions on any aspect of the proposal. In the first part of this paper, we provide a high level perspective on ActewAGL's proposal and our initial observations. In the attachments we provide more detail and background on our assessment.
There have been significant changes to the regulatory framework we administer. The Australian Energy Market Commission (AEMC) finalised changes to the National Electricity Rules (rules) in November 2012. These changes resulted in a renewed emphasis on the long term interests of consumers. The appeal process relating to our determinations was also amended so that any appeal by ActewAGL must demonstrate that the changes sought would leave consumers better off. And the revised rules led us to develop new guidelines that set out how we propose to approach important aspects of our review.1
ActewAGL's regulatory proposal is available on our website (www.aer.gov.au). The attachments to this paper provide more detailed discussion of ActewAGL's regulatory proposal. This detailed material examines the main components of ActewAGL's regulatory proposal—capital expenditure (capex), operating expenditure (opex) and the rate of return. See section 3 below for more details on what to include in your submission and key dates in our assessment process.
1 Our new guidelines are available on our website (www.aer.gov.au) under the 'Better Regulation' tab.
ActewAGL electricity distribution determination 2014–19 | Issues paper 7

1 Our initial observationsThe following sections set out our initial observations on ActewAGL's proposal. We
have included this material to guide stakeholders to the key issues that have initially caught our attention.
Why is ActewAGL proposing to increase prices?ActewAGL has proposed to increase its revenues compared to the revenues it was allowed to earn in the previous (2009–14) period. The effect of its proposal is an average annual distribution price increase of around 2.5 per cent.2
We will examine whether ActewAGL's proposed prices adequately reflect current circumstances. ActewAGL's asset base is larger than five years ago. This investment base needs to be funded and this is adding to the cost of running its network. However, other factors could be reducing pressure on ActewAGL's required revenue and therefore on prices. These include reduced demand for electricity and lower financing costs. We are interested to hear consumers' views on these factors.
Figure 1 shows the price path expected from ActewAGL's regulatory proposal. To the left of the vertical line are ActewAGL's previously approved and actual average distribution prices. On the right are ActewAGL's proposed average distribution prices for the 2014–19 period. The dip in prices in 2014–15 reflects our one year transitional determination, including changes to the way the costs of transmission assets are being recovered.3
2 $nominal. Calculated on a per MWh basis. Sourced from ActewAGL's submitted regulatory information notice (RIN) for this reset.
3 The revenue difference between our transitional determination and full determination will be smoothed out over the remaining four years of the 2014–19 period. From 1 July 2014, we have classified certain assets in ActewAGL's network to be transmission. These transmission assets and the associated revenue requirements for ActewAGL will be determined separately from distribution. These matters are discussed in more detail in attachment 1 to this paper.
ActewAGL electricity distribution determination 2014–19 | Issues paper 8
Figure 1 ActewAGL – price path ($nominal)
20.00
30.00
40.00
50.00
60.00
70.00
80.00
2009-10 2011-12 2013-14 2015-16 2017-18
$nominal,per MWh
Approved price ($/MWh) Actual price ($/MWh) Proposed price ($/MWh)
Source: Proposed average annual prices are sourced from ActewAGL's submitted PTRM for this reset. Historical actual average prices are sourced from ActewAGL's submitted annual regulatory information notices (RINs).
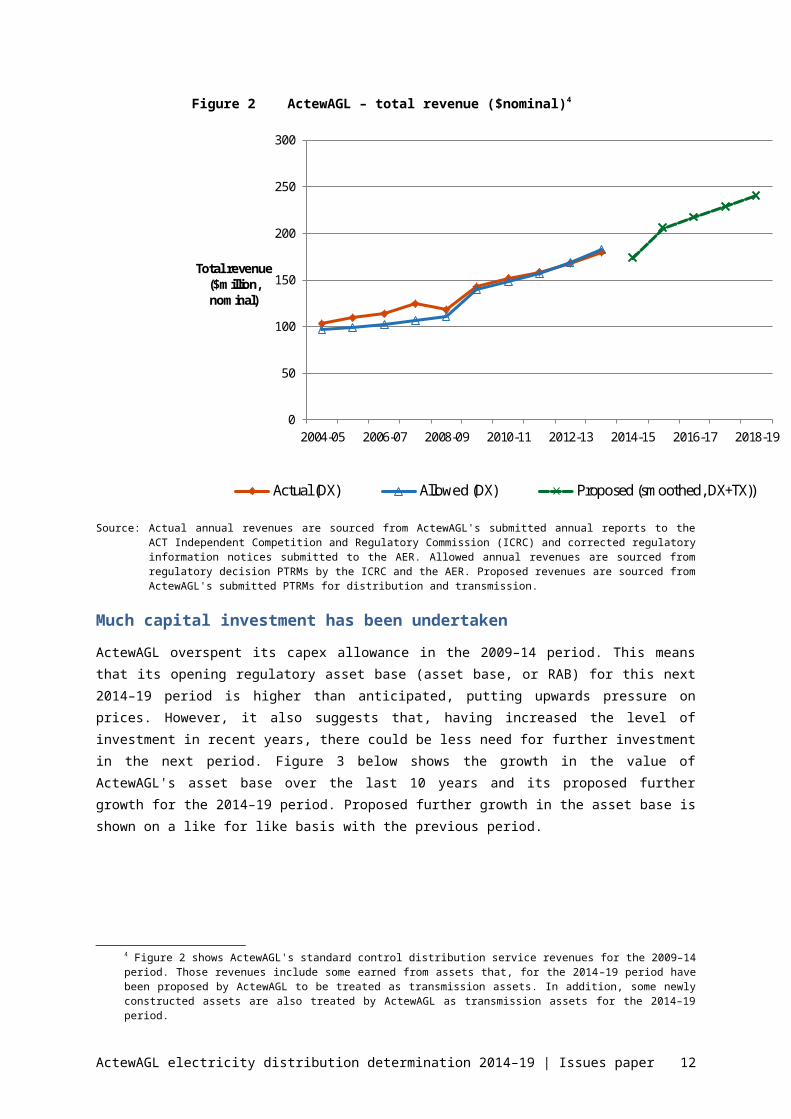
Figure 2 below shows ActewAGL's current and proposed annual revenues. The solid lines show the revenues we have previously approved and the revenues actually collected by ActewAGL. The dashed line shows ActewAGL's proposed revenues for the 2014–19 period, including its proposed transmission revenues for comparability with the 2009–14 period.
ActewAGL electricity distribution determination 2014–19 | Issues paper 9

Figure 2 ActewAGL – total revenue ($nominal)4
0
50
100
150
200
250
300
2004-05 2006-07 2008-09 2010-11 2012-13 2014-15 2016-17 2018-19
Total revenue($million, nominal)
Actual (DX) Allowed (DX) Proposed (smoothed, DX+TX))
Source: Actual annual revenues are sourced from ActewAGL's submitted annual reports to the ACT Independent Competition and Regulatory Commission (ICRC) and corrected regulatory information notices submitted to the AER. Allowed annual revenues are sourced from regulatory decision PTRMs by the ICRC and the AER. Proposed revenues are sourced from ActewAGL's submitted PTRMs for distribution and transmission.
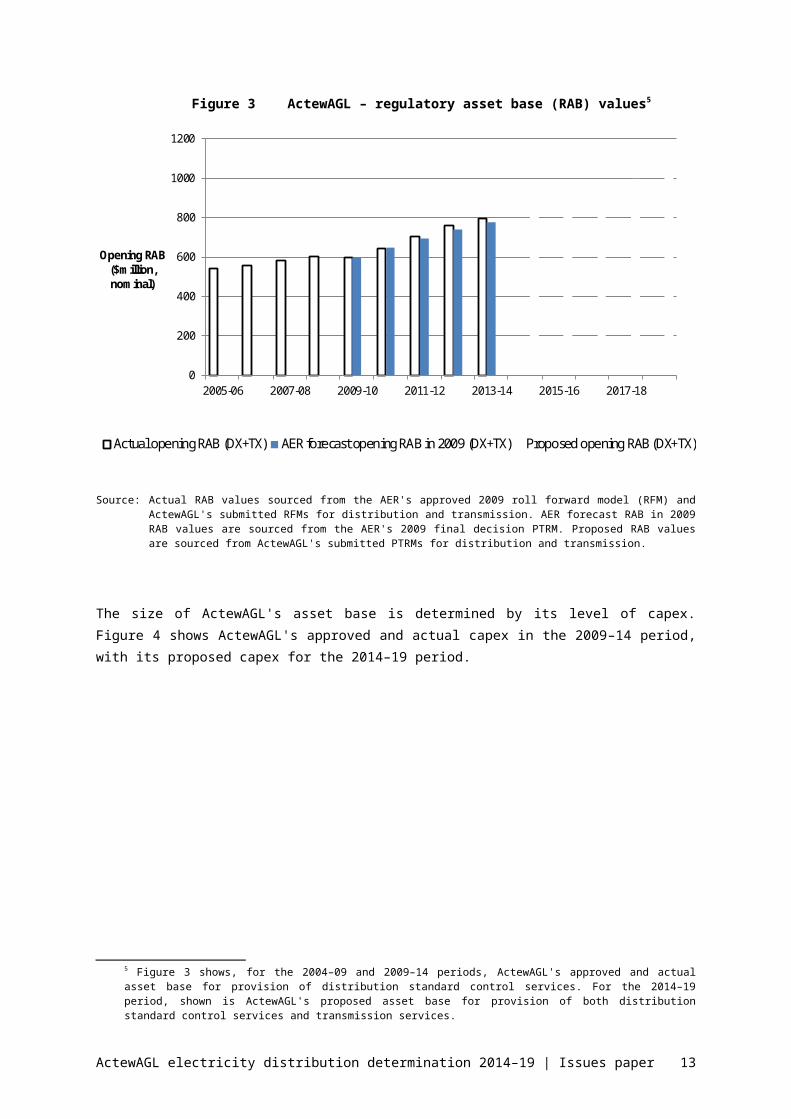
Much capital investment has been undertakenActewAGL overspent its capex allowance in the 2009–14 period. This means that its opening regulatory asset base (asset base, or RAB) for this next 2014–19 period is higher than anticipated, putting upwards pressure on prices. However, it also suggests that, having increased the level of investment in recent years, there could be less need for further investment in the next period. Figure 3 below shows the growth in the value of ActewAGL's asset base over the last 10 years and its proposed further growth for the 2014–19 period. Proposed further growth in the asset base is shown on a like for like basis with the previous period.
4 Figure 2 shows ActewAGL's standard control distribution service revenues for the 2009–14 period. Those revenues include some earned from assets that, for the 2014–19 period have been proposed by ActewAGL to be treated as transmission assets. In addition, some newly constructed assets are also treated by ActewAGL as transmission assets for the 2014–19 period.
ActewAGL electricity distribution determination 2014–19 | Issues paper 10

Figure 3 ActewAGL – regulatory asset base (RAB) values5
0
200
400
600
800
1000
1200
2005-06 2007-08 2009-10 2011-12 2013-14 2015-16 2017-18
Opening RAB ($million, nominal)
Actual opening RAB (DX+TX) AER forecast opening RAB in 2009 (DX+TX) Proposed opening RAB (DX+TX)
Source: Actual RAB values sourced from the AER's approved 2009 roll forward model (RFM) and ActewAGL's submitted RFMs for distribution and transmission. AER forecast RAB in 2009 RAB values are sourced from the AER's 2009 final decision PTRM. Proposed RAB values are sourced from ActewAGL's submitted PTRMs for distribution and transmission.
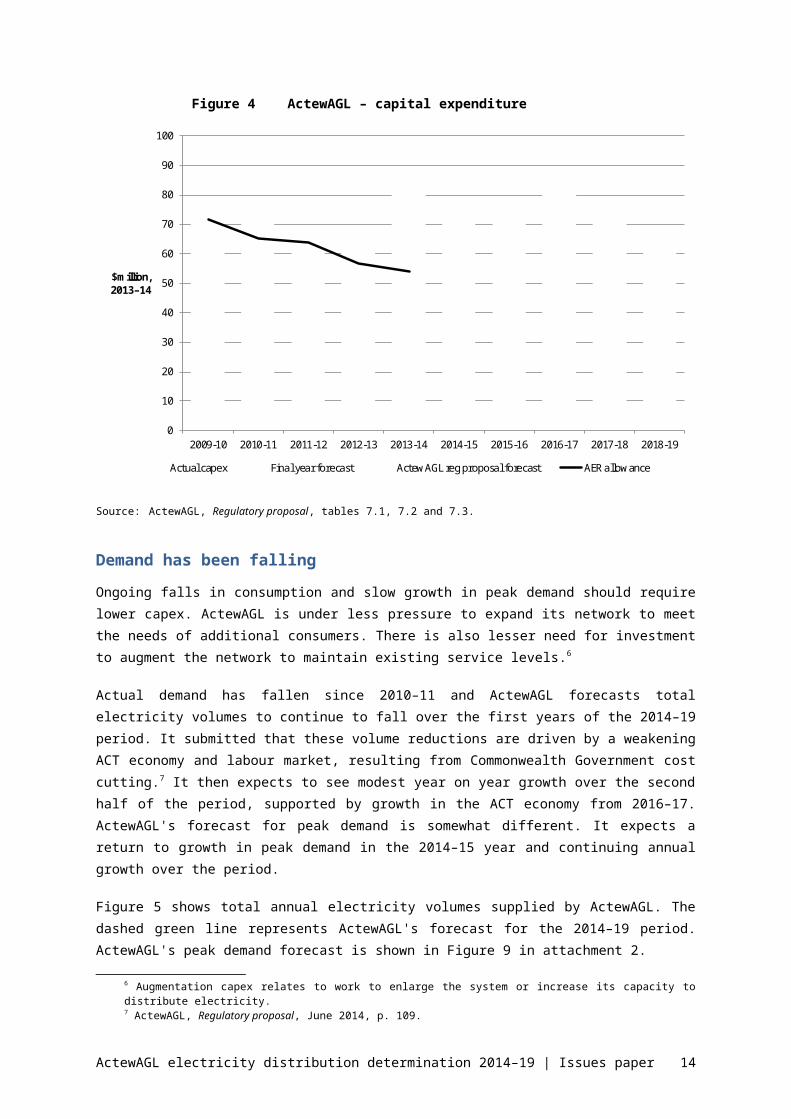
The size of ActewAGL's asset base is determined by its level of capex. Figure 4 shows ActewAGL's approved and actual capex in the 2009–14 period, with its proposed capex for the 2014–19 period.
Figure 4 ActewAGL – capital expenditure
Source: ActewAGL, Regulatory proposal, tables 7.1, 7.2 and 7.3.
Demand has been fallingOngoing falls in consumption and slow growth in peak demand should require lower capex. ActewAGL is under less pressure to expand its network to meet the needs of additional consumers. There is also lesser need for investment to augment the network to maintain existing service levels.6
Actual demand has fallen since 2010–11 and ActewAGL forecasts total electricity volumes to continue to fall over the first years of the 2014–19 period. It submitted that these volume reductions are driven by a weakening ACT economy and labour market, resulting from Commonwealth Government cost cutting.7 It then expects to see modest year on year growth over the second half of the period, supported by growth in the ACT economy from 2016–17. ActewAGL's forecast for peak demand is somewhat different. It 5 Figure 3 shows, for the 2004–09 and 2009–14 periods, ActewAGL's approved and actual asset base for
provision of distribution standard control services. For the 2014–19 period, shown is ActewAGL's proposed asset base for provision of both distribution standard control services and transmission services.
ActewAGL electricity distribution determination 2014–19 | Issues paper 11
expects a return to growth in peak demand in the 2014–15 year and continuing annual growth over the period.
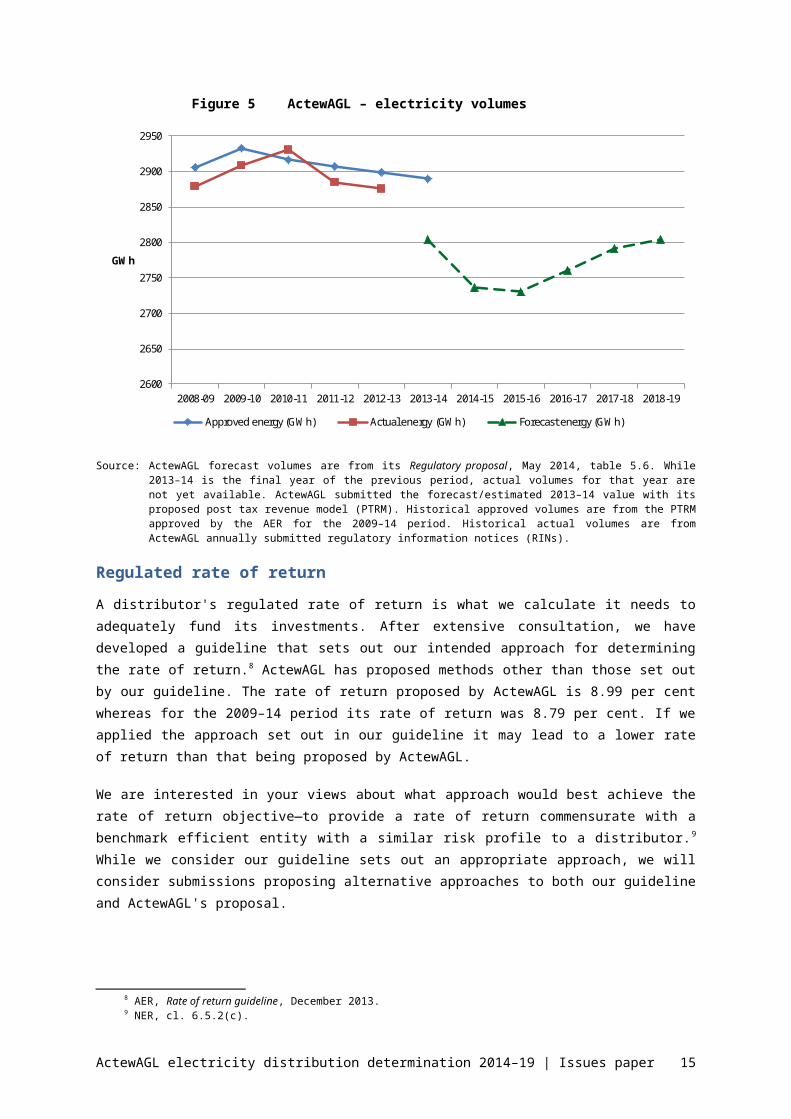
Figure 5 shows total annual electricity volumes supplied by ActewAGL. The dashed green line represents ActewAGL's forecast for the 2014–19 period. ActewAGL's peak demand forecast is shown in Figure 9 in attachment 2.
Figure 5 ActewAGL – electricity volumes
2600
2650
2700
2750
2800
2850
2900
2950
2008-09 2009-10 2010-11 2011-12 2012-13 2013-14 2014-15 2015-16 2016-17 2017-18 2018-19
GWh
Approved energy (GWh) Actual energy (GWh) Forecast energy (GWh)
Source: ActewAGL forecast volumes are from its Regulatory proposal, May 2014, table 5.6. While 2013–14 is the final year of the previous period, actual volumes for that year are not yet available. ActewAGL submitted the forecast/estimated 2013–14 value with its proposed post tax revenue model (PTRM). Historical approved volumes are from the PTRM approved by the AER for the 2009–14 period. Historical actual volumes are from ActewAGL annually submitted regulatory information notices (RINs).
Regulated rate of returnA distributor's regulated rate of return is what we calculate it needs to adequately fund its investments. After extensive consultation, we have developed a guideline that sets out our intended approach for determining the rate of return.8 ActewAGL has proposed methods other than those set out by our guideline. The rate of return proposed by ActewAGL is 8.99 per cent whereas for the 2009–14 period its rate of return was 8.79 per cent. If we applied the approach set out in our guideline it may lead to a lower rate of return than that being proposed by ActewAGL.
We are interested in your views about what approach would best achieve the rate of return objective—to provide a rate of return commensurate with a benchmark efficient entity with a similar risk profile to a distributor.9 While we consider our guideline sets out an appropriate approach, we will consider submissions proposing alternative approaches to both our guideline and ActewAGL's proposal.
6 Augmentation capex relates to work to enlarge the system or increase its capacity to distribute electricity.
7 ActewAGL, Regulatory proposal, June 2014, p. 109.8 AER, Rate of return guideline, December 2013.9 NER, cl. 6.5.2(c).
ActewAGL electricity distribution determination 2014–19 | Issues paper 12
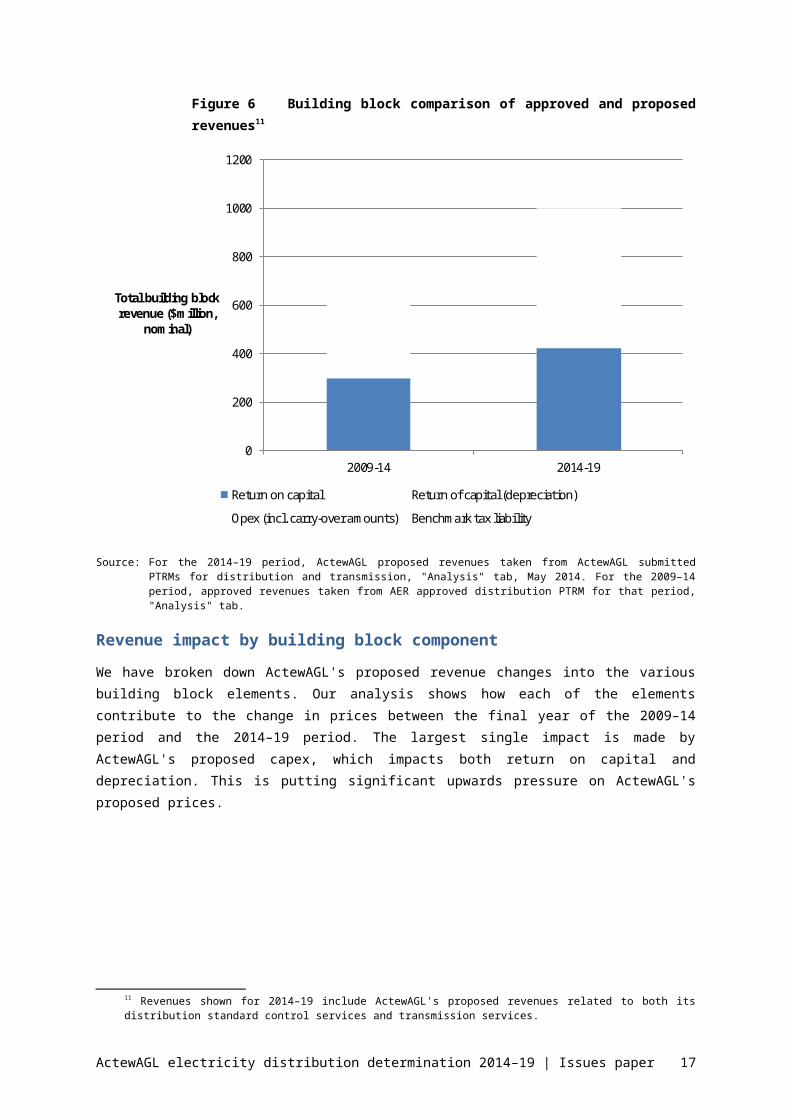
How do the different components of revenue interrelate?The building block components of ActewAGL's total revenue proposal, compared
to its approved revenues for the 2009–14 period, are shown in Figure 6 below. Shown are:
the return on capital—determined by the size/value of a distributor's asset base, multiplied by its rate of return
the return of capital (depreciation)—an allowance for asset depreciation
opex—an allowance for the costs of operating the network
tax—an allowance to cover the distributors' benchmark tax liability.
Our assessment of ActewAGL's proposal will consider each of the building blocks. However, we must decide its revenue as a whole. This leads us to consider the interrelationships between the components. In addition, the National Electricity Law (NEL) requires us to describe how the components of our decision relate to each other. 10 We must also describe how we have taken those interrelationships into account.
We are interested in your views on how the building block components, including capex, opex and the rate of return, relate to each other. What trade-offs do you consider are possible. What dependencies are there. We discuss this further in attachment 5 to this paper.
Figure 6 Building block comparison of approved and proposed revenues11
0
200
400
600
800
1000
1200
2009-14 2014-19
Total building block revenue ($million,
nominal)
Return on capital Return of capital (depreciation)
Opex (incl. carry-over amounts) Benchmark tax liability
10 NEL, s. 16(1)(c).11 Revenues shown for 2014–19 include ActewAGL's proposed revenues related to both its distribution
standard control services and transmission services.
ActewAGL electricity distribution determination 2014–19 | Issues paper 13
Source: For the 2014–19 period, ActewAGL proposed revenues taken from ActewAGL submitted PTRMs for distribution and transmission, "Analysis" tab, May 2014. For the 2009–14 period, approved revenues taken from AER approved distribution PTRM for that period, "Analysis" tab.
Revenue impact by building block componentWe have broken down ActewAGL's proposed revenue changes into the various building block elements. Our analysis shows how each of the elements contribute to the change in prices between the final year of the 2009–14 period and the 2014–19 period. The largest single impact is made by ActewAGL's proposed capex, which impacts both return on capital and depreciation. This is putting significant upwards pressure on ActewAGL's proposed prices.
ActewAGL electricity distribution determination 2014–19 | Issues paper 14
2 Consumer engagementConsumer engagement is a key issue for our distribution determination. When
assessing regulatory proposals we will have regard to how a distributor engaged with its consumers and accounted for their long term interests.
2.1 Consumer engagement in the rulesUnder the rules, consumer engagement is a factor we can consider when making
our revenue determinations.12 We will examine whether and how well a distributor considered and responded to consumer views, equipped consumers to participate in consultation, made issues tangible and obtained a cross–section of views. We will make our assessment on a case–by–case basis, considering whether it would have been reasonable to engage on a particular issue. We will monitor consumer engagement activities through our consumer challenge panel (CCP) and by our ongoing engagement with stakeholders. We may publicly comment on any shortcomings in a distributor's consumer engagement that we identify from a regulatory proposal.
2.2 Our consumer engagement guidelineOur consumer engagement guideline for network service providers sets out a
framework for electricity and gas network service providers to better engage with consumers.13 It aims to guide businesses to develop strategies to engage systematically, consistently and strategically with consumers on issues that are significant to both parties. The guideline sets out our expectations when considering service provider consumer engagement activities:
12 NER, cl. 6.8.2(c1).13 AER, Consumer engagement guideline for network service providers, November 2013;
www.aer.gov.au/Better-regulation-reform-program
ActewAGL electricity distribution determination 2014–19 | Issues paper 15
Questions
1. Please provide your comments on the consumer engagement conducted by ActewAGL in preparing its regulatory proposal, particularly with respect to:
accessibility of information provided
clarity about your role and the objectives of the engagement activity or activities
how much time was provided between the engagement activity and submission to us of ActewAGL's regulatory proposal?
2. If you were part of ActewAGL's consumer engagement, were you given options for expenditure? If yes, for each option were you asked to give preferences? For each option were you given cost and price information? Did the options cover operating expenditure and capital expenditure?
3. Please provide your comments on how effective you believe the consumer engagement conducted by ActewAGL was in responding to consumer concerns, with examples where possible.

Priorities—we expect service providers to identify consumer cohorts and the current views of those cohorts and their service provider; outline their engagement objectives; and discuss the processes to best achieve those objectives.
Delivery—we expect service providers to address the identified priorities via robust and thorough consumer engagement.
Results—we expect service providers to articulate the outcomes of their consumer engagement processes and how they measure the success of those processes in reporting back to us, their business and to consumers.
Evaluation and review—we expect service providers to periodically evaluate and review the effectiveness of their consumer engagement processes.
Below, we summarise ActewAGL's submitted approach to consumer engagement. For details, we encourage readers to review ActewAGL's regulatory proposal and supporting documentation. As a guide, we have referenced below where ActewAGL has included consumer engagement content in its regulatory proposal.
ActewAGL described its major consumer engagement initiative to date as having been to periodically undertake customer willingness to pay studies. ActewAGL also described having undertaken focussed consumer engagement during the planning and construction phases of major capital investment projects. ActewAGL submitted that it is developing a consumer engagement strategy, to be rolled out over the 2014–19 period.14
ActewAGL submitted that in the first stage of its consumer engagement strategy it intends to focus on better understanding its customers and on changing its own culture to further emphasise consumer engagement. ActewAGL submitted that its current consumer engagement activities will inform stage one of its new consumer engagement strategy. In turn, its stage one activities will inform its stage two priorities.15
2.3 Consumer engagement to dateSince early 2012, we have been engaging with consumers and other stakeholder groups about the forthcoming electricity determination. Most recently, our CCP has been advising us on issues relevant to consumers. The purpose of the CCP is to challenge both the AER and ActewAGL in terms of whether the National Electricity Objective (NEO) is being achieved.
14 ActewAGL, Regulatory proposal, June 2014, p. 46.15 ActewAGL, Regulatory proposal, June 2014, p. 50.
ActewAGL electricity distribution determination 2014–19 | Issues paper 16
3 Your submission and key datesWe are keen to hear your opinions and experiences. But it is important that your submission is, as much as possible, supported by reasons and analysis. If you consider a certain aspect of ActewAGL's regulatory proposal is not justified, you should state why you consider it is not justified, with reference to reasons that support your views. You should also state what further information you consider ActewAGL should provide to justify that aspect of its proposal.
When considering the questions on which we would like feedback, it is useful to keep in mind that we must comply with the NEL and rules. The capex and opex forecasts of a distribution business must be aimed at meeting expected demand and all regulatory obligations as well as maintaining the safety of the system. If there are no regulatory obligations in relation to quality, reliability and security of supply, a business is to maintain existing levels.16
We are primarily interested in receiving submissions on ActewAGL's proposed approaches to consumer engagement, opex, capex and the expected rate of return. However, we will consider submissions on any aspect of ActewAGL's proposal. Key dates for our assessment process are set out in Table 1Error: Reference source not found below.
Table 1 Key dates for the ACT distribution determination process
Task Date
ActewAGL regulatory proposal submitted to AER 2 June 2014
AER found proposal non-compliant 17 June 2014
ActewAGL resubmitted its regulatory proposal 10 July
AER published resubmitted regulatory proposal and supporting documents & called for submissions
11 July 2014
AER public forum 30 July 2014
Stakeholder submissions on resubmitted regulatory proposal close
22 August 2014
AER issues draft decision 30 November 2014
ActewAGL submits revised regulatory proposal 16 January 2015*
Stakeholder submissions on draft decision/revised regulatory proposal close
27 February 2015*
AER issues final decision 30 April 2015
16 NER, cll. 6.5.6(a)(3) and 6.5.7(a)(3).
ActewAGL electricity distribution determination 2014–19 | Issues paper 17
*Note: Dates are indicative only and will be confirmed as process progresses.
AER annual benchmarking reportThe rules require us to publish our first benchmarking report for transmission and distribution network service providers by 30 September 2014. The purpose of this report is to describe, in plain language, the relative efficiency of each network service provider over a 12 month period. We will consult on the annual benchmarking report in a separate process. We will take into account the results and analysis in this report as part of our draft and final decisions on ActewAGL's regulatory proposals for 2014–19.
ActewAGL electricity distribution determination 2014–19 | Issues paper 18
Attachments
ActewAGL electricity distribution determination 2014–19 | Issues paper 19

1 Background to our assessmentThis attachment provides information about us, ActewAGL and the regulatory
framework that we administer.
1.1 The Australian Energy RegulatorWe are Australia's national energy market regulator and an independent statutory
authority. Our functions, set out in the NEL and rules, mostly relate to energy markets in eastern and southern Australia. Specific to this review, we are responsible for the economic regulation of all electricity distribution networks in eastern and southern Australia.
We are required to exercise our functions in a manner that will advance the National Electricity Objective (NEO). The NEO in turn is supported through the revenue and pricing principles and the various objectives, criteria and elements within the rules. The NEO is:17
…to promote efficient investment in, and efficient operation and use of, electricity services for the long term interests of consumers of electricity with respect to—
(a) price, quality, safety, reliability and security of supply of electricity; and
(b) the reliability, safety and security of the national electricity system.
We consider that the NEO is most likely to be advanced where consumers are offered a reasonable level of service at the lowest sustainable price. In most industries, this outcome is achieved through the operation of competition. However, in the electricity network industry the usual competitive disciplines do not operate. Electricity network businesses are natural monopolies and the products they offer are essential services for most consumers. Consequently, consumers have little choice but to accept the service quality and price offered by a distributor.
The NEL and rules aim to reflect the competitive process by empowering us, as regulator, to make determinations that are in the long term interests of consumers. In short, we may require a distributor to offer its services at a higher quality and lower price than it would choose itself. This requires the exercise of careful judgement. We must form a view after considering the interests of all parties. Further, there is no single precise answer.
There are potentially a range of outcomes that might advance the NEO. However, there are also a range of outcomes that are unlikely to advance the NEO to a satisfactory extent. For example, we do not consider that the NEO would be advanced if prices are so high that large numbers of consumers are unable to afford the service, nor if prices are so low that investors are unwilling to supply the service. We are also mindful that electricity supply is an important input for downstream economic activity. We would like to hear views on how the NEO is best reflected in our decision.
17 NEL, s.7.
ActewAGL electricity distribution determination 2014–19 | Issues paper 20
1.2 Who is ActewAGL?The electricity supply chain begins with a wholesale market in which generators
produce electricity and sell it through a central dispatch process. The high voltage transmission network transfers electricity over long distances from where it is generated to where consumers need it. ActewAGL's distribution network of poles, wires and transformers connects the high voltage transmission network to customers. Distribution networks criss-cross urban and regional areas to provide electricity to every electricity consumer.
ActewAGL is equally owned by the ACT Government and Jemena Ltd. In turn, Jemena is jointly owned by Singapore Power and State Grid Corporation of China. ActewAGL services around 177,000 homes and businesses in the ACT. ActewAGL's sister company, ActewAGL Retail, is a different joint venture entity, providing energy retail services. ActewAGL Retail is not the subject of this reset.
1.3 The regulatory frameworkWe must assess ActewAGL's regulatory proposal under version 58 the rules as
modified. This version is available at the Australian Energy Market Commission (AEMC) website.18 This version of the rules is the result of significant changes made by the AEMC in November 2012. Under our Better Regulation program, during 2013 we developed, through an extensive process, a number of guidelines.19 The objective of this program was to refine our approach to regulation and to accommodate changes to the NEL and the rules. The result was a suite of guidelines that set out approaches we consider are most likely to advance the NEO:
Expenditure forecast assessment guideline
Assessing expenditure proposals from businesses.
Rate of return guideline
Determining the allowed rate of return businesses earn on their investments.
Expenditure incentives guideline
Creating the right incentives to encourage efficient spending by businesses.
Consumer engagement guideline for network service providers
Implementing consumer engagement strategies that are effective for all stakeholders.
Shared asset guideline
Sharing the revenue networks earn from shared assets with consumers.
Confidentiality guideline
Managing confidential information for an effective regulatory determination process.
18 www.aemc.gov.au/Australias-Energy-Market/Market-Legislation/Relevant-Legislation-Electricity 19 See our website: www.aer.gov.au/Better-regulation-reform-program
ActewAGL electricity distribution determination 2014–19 | Issues paper 21

We consulted extensively in developing the guidelines. This was very important for testing our views and hearing from a range of interested parties. In particular, we made a special effort to engage consumers in the process through our Consumer Reference Group.20 We consider the guidelines provide a solid foundation for our decision making.
One of the themes that emerged from our consultation was a desire from stakeholders for clarity about the approach we would take in our decisions. In particular, many stakeholders observed that greater clarity would aid investment in the sector. To address this issue we set out our intended approaches in detail in the guidelines.
In the process established by the rules, a distributor has the first opportunity to propose a price/service offering. The distributor's application, or regulatory proposal, starts a process often referred to as a revenue reset, or simply a 'reset'. We will assess that proposal against the NEO and the rules to form a view on whether a distributor's proposal is in the long term interests of consumers. Where it is not, we will not accept the proposal, and instead impose our own decision.
Because this is an intrusive process we exercise our role with care and diligence. We consult widely and test our views, employing approaches that are widely accepted and carefully considered, such as those articulated in our guidelines.
1.3.1 The transitional regulatory yearOur revenue determination process for ActewAGL was due to be completed in 2014. However, the process was delayed so the revised rules could be applied and we could focus on developing and applying the Better Regulation guidelines. Consequently, the AEMC separated the ACT regulatory control period into:
the transitional regulatory control period (1 July 2014 to 30 June 2015)
the subsequent regulatory control period (1 July 2015 to 30 June 2019).
Our transitional decision set out the placeholder revenue allowance and application of the regulatory framework for ActewAGL for the transitional period.
1.3.2 Our transitional determination On 16 April 2014, we issued our transitional determinations for ActewAGL for the 2014–15 transitional period. This decision determined distribution prices for ACT consumers in this one year period. Ultimately, the placeholder revenue allowance will be replaced by the revenue allowance we approve in our full determination to be published by 30 April 2015. Any discrepancies between our transitional determination and our full determination will be balanced up over the remaining four years of the 2014–19 period.
Our transitional decision provides, for the 2014–15 period, that ActewAGL will be able to recover $145 million ($nominal), which is 6.9 per cent lower than it proposed.21
20 See our website for our assessment of the Consumer Reference Group: www.aer.gov.au/node/19166 21 www.aer.gov.au/node/11483
ActewAGL electricity distribution determination 2014–19 | Issues paper 22

1.3.3 Our framework and approach We released our Stage 1 Framework and Approach (F&A) in March 2013.22 This set out our intended approach to parts of the regulatory framework, such as service classification. In terms of our classification decisions, in summary we may:
classify a service so that the distributor may recover related costs from all customers (standard control)
classify a service so that the user benefiting from the service pays (alternative control)
allow customers and distributors to negotiate the provision and price of some services—we will arbitrate should negotiations stall (negotiated distribution service)
not classify a service—we have no regulatory control over this service or the prices charged by the distributor (unclassified service).
Standard control services represent a large majority of a distributor's revenue, reflecting the integrated nature of an electricity supply network. ActewAGL recovers the cost of providing standard control services from all electricity customers through standard network charges—known as Distribution Use of System (DUoS) charges. It is the total cost of providing standard control services that this issues paper predominantly relates to. Services classified as alternative control are separately billed to individual electricity customers.
Figure 7 shows our proposed service classifications for the 2014–19 period. We may only change our proposed classifications if we consider unforeseen circumstances arise.23 Our classifications are consistent with those for the 2009–14 period, with the exception of:
ancillary network services—reclassified as alternative control, from (predominantly) standard control.
These changes mean the costs of providing these services will now be excluded from the distributors' DUoS charges. In future they will be recovered from specific customers requiring those services, rather than from all customers.
22 AER, Stage 1 Framework and approach paper – Ausgrid, Endeavour Energy and Essential Energy, March 2013; www.aer.gov.au/node/11482
23 NER, cl. 6.12.3(b).
ActewAGL electricity distribution determination 2014–19 | Issues paper 23
Figure 7 AER proposed 2014–19 service classifications for ActewAGL
Transmission assetsActewAGL was obliged by the ACT Government to construct a new link, or
interconnector, between its ACT distribution network and the transmission network supplying its electricity, owned by TransGrid. These assets are referred to as 'dual function assets', in that they are operated by a distributor, ActewAGL, but would usually be operated by a transmission company.24 As part of this reset process, we will determine the regulated revenues ActewAGL may earn from charging for the use of these new assets.25 ActewAGL has proposed that some of its pre-existing assets should now also be treated as transmission assets.
Because the treatment of some of ActewAGL's assets as transmission assets is new, throughout this issues paper we frequently include transmission assets when comparing revenues and expenditures across the 2009–14 and 2014–19 regulatory periods. Not doing so would understate ActewAGL's proposed future costs and revenues. However, the cost of ActewAGL's transmission services will be recovered separately to those of its distribution services. Around half of the transmission costs will be paid by TransGrid's full customer base (all of NSW), while around half will be paid by electricity customers in the local region (ACT). In contrast, all of ActewAGL's costs related to provision of its distribution services will be paid by its ACT customers.
24 NER, cl. 6.24.25 AER, Stage 1 framework and approach paper ActewAGL–- transitional regulatory control period 1 July
2014 to 30 June 2015 – subsequent regulatory control period 1 July 2015 to 30 June 2019, March 2013, p. 43.
ActewAGL electricity distribution determination 2014–19 | Issues paper 24
2 Capital expenditureCapital expenditure (capex) is added to ActewAGL's asset base and so forms part of the capital costs of the building blocks used to determine its total revenue requirement. We must accept ActewAGL's proposed forecast of total capex if we are satisfied it reasonably reflects the capex criteria.26 We must have regard to the capex factors in the rules when making that decision.27
If we are not satisfied ActewAGL's capex proposal reasonably reflects the capex criteria, we must not accept the forecast. In that case, we must estimate the total required capex that, in our view, does reasonably reflect the capex criteria taking into account the capex factors. The approach we will adopt to assess ActewAGL's total capex is outlined in our expenditure forecast assessment guideline.28
Question
4. Do you think that ActewAGL's capital expenditure proposal is appropriate?
2.1 ActewAGL's capital expenditure proposalTable 2 summarises ActewAGL's proposed forecast capex for both its standard control distribution assets and transmission assets. ActewAGL has proposed capex levels broadly consistent with its actual capex spending for the 2009–14 period, but significantly higher than its allowance for that period. ActewAGL overspent its capex allowance for the 2009–14 period.
Table 2 ActewAGL — total capital expenditure proposal
2014–19 total capex proposal ($million, 2013–14)
Change from 2009–14 actual capex (per cent)
Change from 2009–14 total capex allowance (per cent)
$372.2 +1.5 +19.5
Source: ActewAGL, Regulatory proposal, tables 7.1, 7.2 and 7.3; AER analysis.
ActewAGL submitted that its capex spending in the 2009–14 period was driven by stronger than expected growth in connections, unforeseen spending on construction of new warehousing and systems replacement and unexpectedly high costs of augmentation and building the new interconnector.
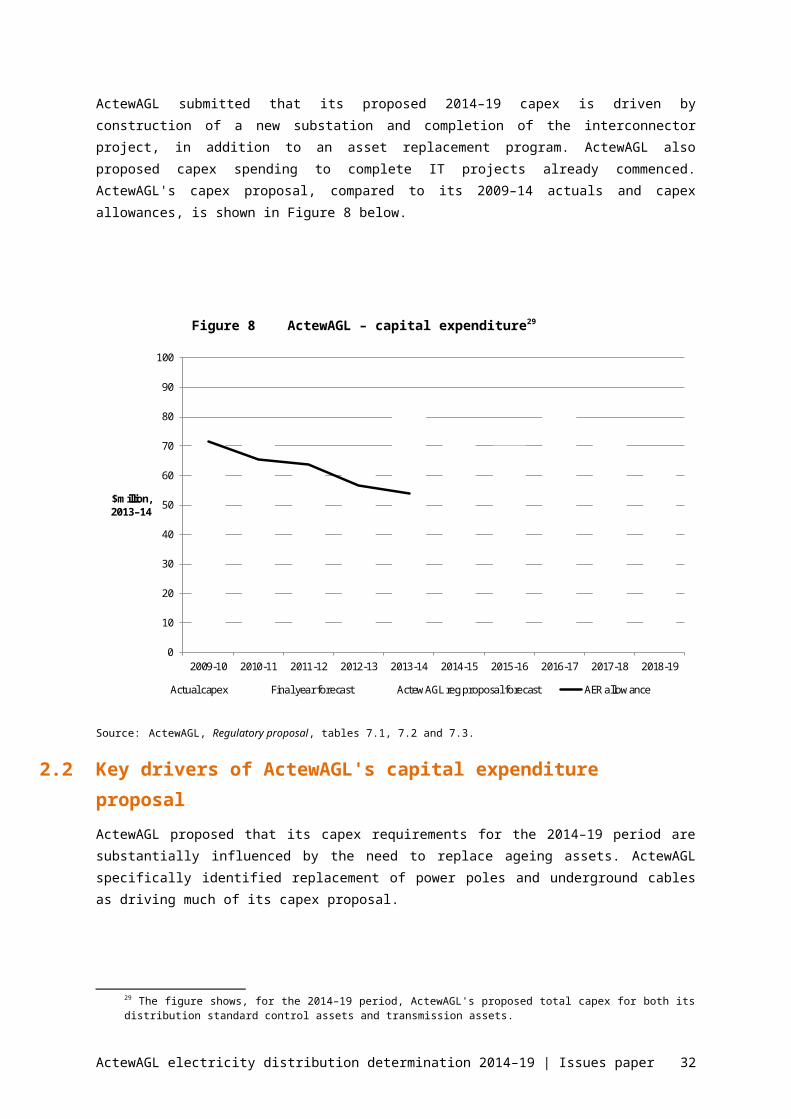
ActewAGL submitted that its proposed 2014–19 capex is driven by construction of a new substation and completion of the interconnector project, in addition to an asset replacement program. ActewAGL also proposed capex spending to complete IT projects already commenced. ActewAGL's capex proposal, compared to its 2009–14 actuals and capex allowances, is shown in Figure 8 below.
26 NER, cl. 6.5.7(c).27 NER, cl. 6.5.7(e).28 AER, Expenditure forecast assessment guideline, November 2013.
ActewAGL electricity distribution determination 2014–19 | Issues paper 25
Figure 8 ActewAGL – capital expenditure29
0
10
20
30
40
50
60
70
80
90
100
2009-10 2010-11 2011-12 2012-13 2013-14 2014-15 2015-16 2016-17 2017-18 2018-19
$million, 2013–14
Actual capex Final year forecast ActewAGL reg proposal forecast AER allowance
Source: ActewAGL, Regulatory proposal, tables 7.1, 7.2 and 7.3.
2.2 Key drivers of ActewAGL's capital expenditure proposalActewAGL proposed that its capex requirements for the 2014–19 period are substantially influenced by the need to replace ageing assets. ActewAGL specifically identified replacement of power poles and underground cables as driving much of its capex proposal.
Asset renewal/replacementTable 3 summarises the total replacement capex forecast proposed by ActewAGL for the 2014–19 period. This represents a 46 per cent increase compared to its actual replacement capex in the 2009–14 period. Replacement capex represents over one third of its total capex proposal. In justifying this expenditure, ActewAGL proposed that its poles and underground cables require replacement in order to meet its safety, reliability and security of supply obligations.30
Table 3 ActewAGL — proposed replacement capital expenditure31
2014–19 regulatory control period ($million, 2013–14)
Change from 2009–14 actual capex
Proportion of ActewAGL's total 2014–19 capex proposal
372.2 +46 per cent 36 per cent
Source: ActewAGL, Regulatory submission, May 2014, tables 7.2 and 7.3; AER analysis.
29 The figure shows, for the 2014–19 period, ActewAGL's proposed total capex for both its distribution standard control assets and transmission assets.
30 ActewAGL, Regulatory proposal, June 2014, p. 160.31 Excludes overheads.
ActewAGL electricity distribution determination 2014–19 | Issues paper 26
Responding to growthAlthough there has been a decline in growth in electricity volumes provided through its network during the 2009–14 period, ActewAGL has proposed a material amount of growth related capex in the 2014–19 period. Table 4 shows ActewAGL's proposed augmentation expenditure for the 2014–19 period.
Table 4 ActewAGL — proposed augmentation capital expenditure
2014–19 period ($million, 2013–14) Change from 2009–14 actual capex Proportion of ActewAGL's total
2014–19 capex proposal
104.3 +10 per cent 28 per cent
Source: ActewAGL, Regulatory proposal, May 2014 tables7.14 and 7.15; AER analysis.
ActewAGL has indicated that its proposed augmentation investment is driven by construction of a new substation to service new suburbs, transformer installation and completion of the new interconnector project.32
While ActewAGL has submitted forecasts for total electricity volumes that reflect recent declines, it submitted forecasts for growth in peak demand from 2014–15. Figure 9 below shows ActewAGL's actual peak demand over 2009–14 (to the left of the vertical line) and its forecast peak demand for the 2014–19 period (to the right).
Figure 9 ActewAGL – proposed peak demand33
400
450
500
550
600
650
700
750
2008/09 2009/10 2010/11 2011/12 2012/13 2013/14 2014/15 2015/16 2016/17 2017/18 2018/19
MW
Raw peak demand Weather corrected peak demand forecast
Source: ActewAGL, submitted Regulatory information notice (RIN) for this reset, table 5.3, June 2014.
32 ActewAGL, Regulatory proposal, June 2014, p. 183.33 ActewAGL did not submit a consistent time series for peak demand. Rather, it submitted a combination of
raw peak demand actuals and weather corrected peak demand forecasts. Weather corrected forecasts are 10 per cent POE, network coincident maximum demand.
ActewAGL electricity distribution determination 2014–19 | Issues paper 27
3 Operating expenditureOperating expenditure (opex) refers to the operating, maintenance and other non-capital expenditure incurred in the provision of network services. It is one of the building blocks used to determine ActewAGL's total revenue requirement. We must accept ActewAGL's forecast of total opex if we are satisfied it reasonably reflects the opex criteria.34 We must have regard to the opex factors when making that decision.35
If we are not satisfied ActewAGL's opex proposal reasonably reflects the opex criteria, we must not accept it.36 We must estimate the total required opex that, in our view, reasonably reflects the opex criteria taking into account the opex factors. The approach we will adopt to assess the distributor's forecast of total opex is outlined in our expenditure forecast assessment guideline.37
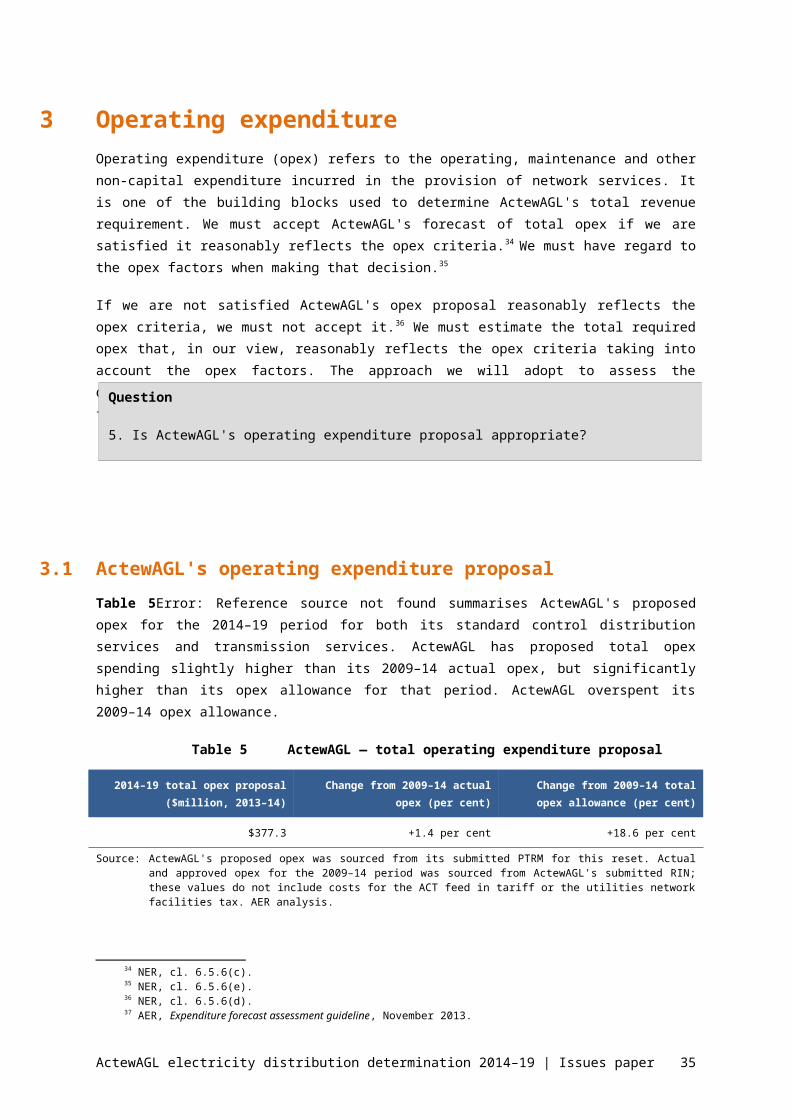
3.1 ActewAGL's operating expenditure proposalTable 5Error: Reference source not found summarises ActewAGL's proposed opex for the 2014–19 period for both its standard control distribution services and transmission services. ActewAGL has proposed total opex spending slightly higher than its 2009–14 actual opex, but significantly higher than its opex allowance for that period. ActewAGL overspent its 2009–14 opex allowance.
Table 5 ActewAGL — total operating expenditure proposal
2014–19 total opex proposal ($million, 2013–14)
Change from 2009–14 actual opex (per cent)
Change from 2009–14 total opex allowance (per cent)
$377.3 +1.4 per cent +18.6 per cent
Source: ActewAGL's proposed opex was sourced from its submitted PTRM for this reset. Actual and approved opex for the 2009–14 period was sourced from ActewAGL's submitted RIN; these values do not include costs for the ACT feed in tariff or the utilities network facilities tax. AER analysis.
ActewAGL submitted that its opex spending in the 2009–14 period was driven by increased regulatory obligations, improving safety, organisational and network performance and tighter than expected labour market conditions.38
ActewAGL submitted that its proposed opex for the 2014–19 period is driven by proposed step changes for a range of costs. It submitted that this additional opex spending is required to address regulatory requirements and to strengthen its own safety culture.39
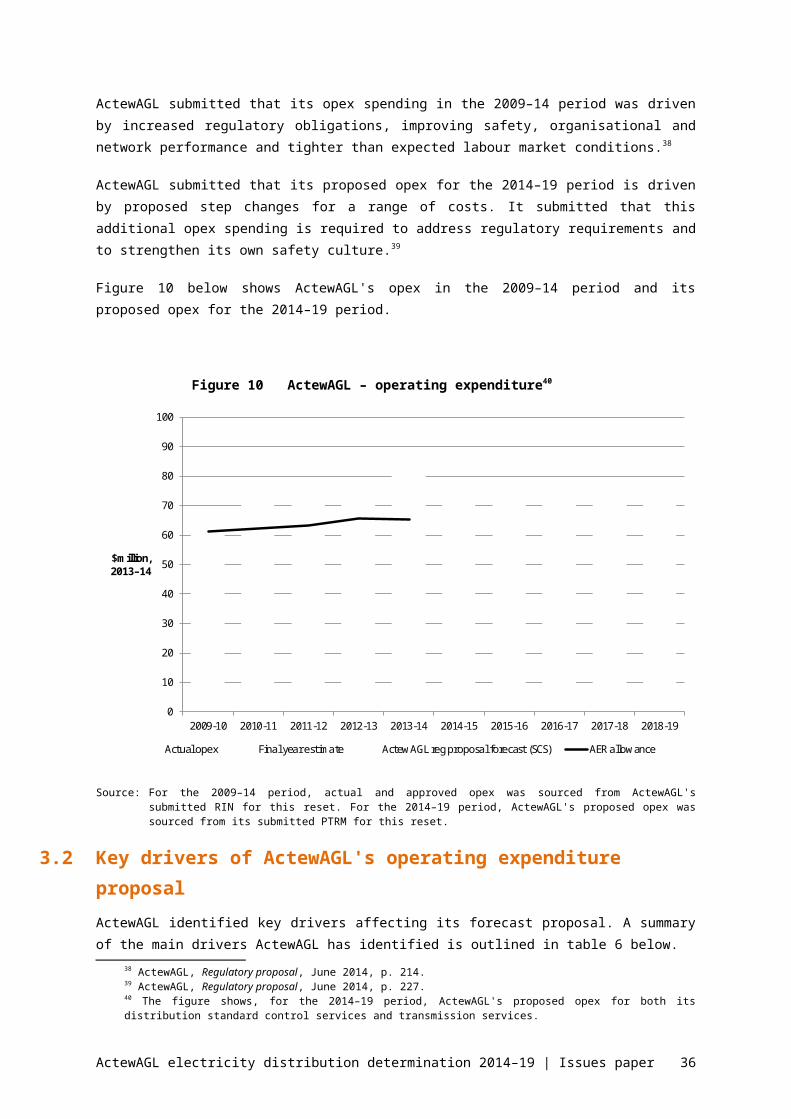
Figure 10 below shows ActewAGL's opex in the 2009–14 period and its proposed opex for the 2014–19 period.34 NER, cl. 6.5.6(c).35 NER, cl. 6.5.6(e).36 NER, cl. 6.5.6(d).37 AER, Expenditure forecast assessment guideline, November 2013. 38 ActewAGL, Regulatory proposal, June 2014, p. 214.39 ActewAGL, Regulatory proposal, June 2014, p. 227.
ActewAGL electricity distribution determination 2014–19 | Issues paper 28
Question
5. Is ActewAGL's operating expenditure proposal appropriate?
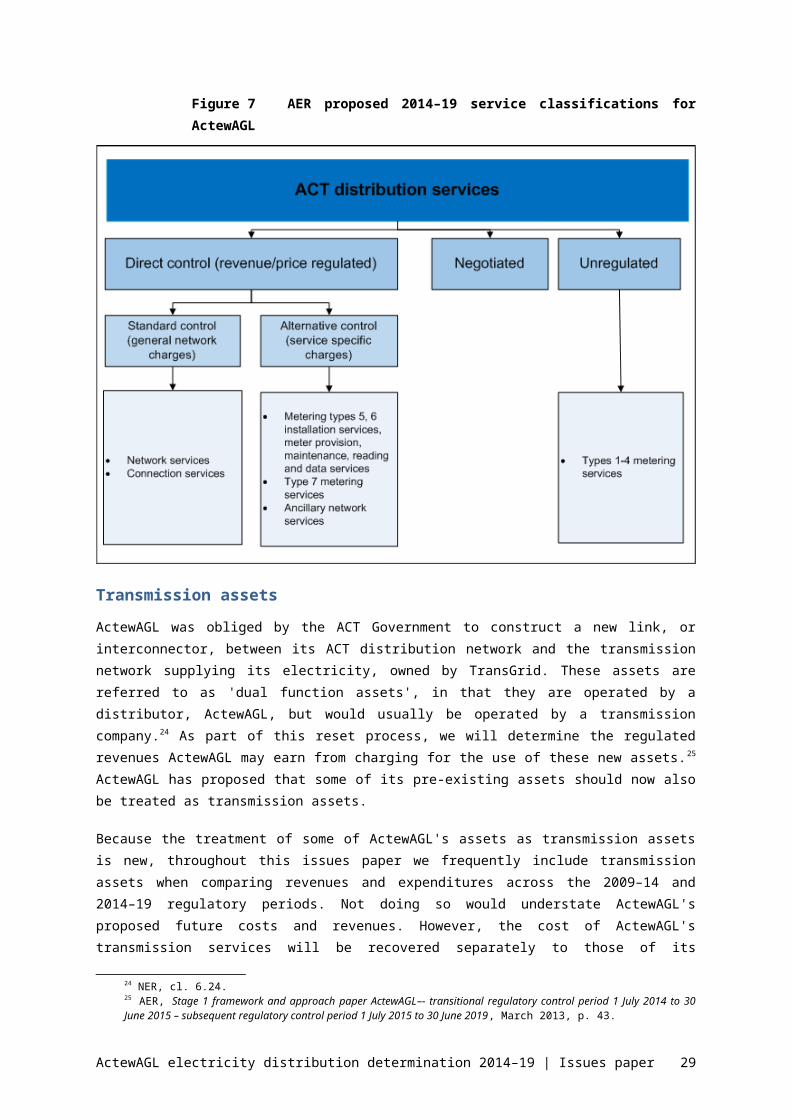
Figure 10 ActewAGL – operating expenditure40
0
10
20
30
40
50
60
70
80
90
100
2009-10 2010-11 2011-12 2012-13 2013-14 2014-15 2015-16 2016-17 2017-18 2018-19
$million, 2013–14
Actual opex Final year estimate ActewAGL reg proposal forecast (SCS) AER allowance
Source: For the 2009–14 period, actual and approved opex was sourced from ActewAGL's submitted RIN for this reset. For the 2014–19 period, ActewAGL's proposed opex was sourced from its submitted PTRM for this reset.
3.2 Key drivers of ActewAGL's operating expenditure proposalActewAGL identified key drivers affecting its forecast proposal. A summary of the main drivers ActewAGL has identified is outlined in table 6 below.
Table 6 ActewAGL — drivers of operating expenditure proposal
Cost driver Description
Step changes ActewAGL has identified a number of step changes which it considered are not included in its base opex. In total it forecast this contributes $35 million to its forecast opex. It considered these step changes are driven by both changes in regulatory obligations and changes in ActewAGL’s policies and strategies.41
Implementation of new cost allocation method
ActewAGL forecast its new cost allocation method (CAM) will lead to a reduction in standard control services opex. It has made an adjustment to its base year as a result of this change. This reduces its forecast of standard control services opex by $27 million over the 2014–19 period.42
Cost escalation ActewAGL forecast cost escalation will increase its forecast opex by $6 million over the
40 The figure shows, for the 2014–19 period, ActewAGL's proposed opex for both its distribution standard control services and transmission services.
41 ActewAGL, Regulatory proposal, June 2014, p. 227.42 ActewAGL, Regulatory proposal, June 2014, p. 224.
ActewAGL electricity distribution determination 2014–19 | Issues paper 29

2014–19 period.43 This impact primarily relates to labour cost escalation above CPI.44
3.3 Forecast EBSS carryover amountsTo encourage a distributor to become more efficient we typically apply an efficiency benefit sharing scheme (EBSS). The EBSS rewards ActewAGL for efficiency gains achieved during a regulatory control period and penalises it for efficiency losses. ActewAGL is allowed to retain such efficiency gains for a period of time but in the longer term its allowances are reduced, meaning lower prices for customers. In the 2009–14 period ActewAGL operated under a transitional EBSS released in February 2008. ActewAGL will receive any rewards or penalties gained during 2009–14 in the 2014–19 period.
ActewAGL has included in its forecast revenue, carryover amounts that relate to the EBSS that applied during the 2009–14 period. The proposed carryover amount is set out in table 7 below.
Table 7 ActewAGL — proposed EBSS carryover amount ($million, 2013–14)
Distributor Forecast carryover amount
ActewAGL -$19.6
Source: ActewAGL PTRM.
3.4 Cost pass throughsThe rules permit ActewAGL to apply to us, during a regulatory period, for its prices
to be adjusted because an unexpected and material cost arises or, in some cases, if actual costs are materially different to the allowances included in our original determination
Pass throughs are only permitted if they are for events listed in our distribution determination or defined in the rules. Once a distribution determination has been finalised, we are required to approve a cost pass through application from a distributor if it satisfies the relevant requirements. The rules already define pass through events for regulatory changes, service standard changes, tax changes or electricity retailer insolvency.45 For the 2014–19 regulatory period, ActewAGL has proposed additional pass throughs for:
a general pass through event
insurer's credit risk event
insurance cap event
demand management and embedded generation connection incentive scheme event.
43 ActewAGL, Regulatory proposal, June 2014, p. 234.44 ActewAGL, Regulatory proposal, June 2014, p. 226.45 NER, cl. 6.6.1(a1).
ActewAGL electricity distribution determination 2014–19 | Issues paper 30
We seek your views on the pass through events nominated by ActewAGL. In particular, should costs for these be recovered as part of a cost pass through if such events occur, or is it more appropriate for these potential impacts to be reflected in ActewAGL's allowances.
ActewAGL electricity distribution determination 2014–19 | Issues paper 31
4 Rate of return The allowed rate of return is the forecast of the cost of funds a distributor requires to make investments in its network. To estimate this cost, we consider the cost of the two sources of funds for investments—equity and debt. The return on equity is the return shareholders of the business will require to attract new investment. The return on debt is the interest rate a distributor pays when it borrows money to invest in capex. We consider that efficient distributors would fund their investments by borrowing 60 per cent of the required funds, while raising the remaining 40 per cent from equity.
When a distributor spends money on an asset, for example a new substation, the value of that substation is added to its asset base. The value of the asset base is multiplied by the allowed rate of return to determine the total return on capital the distributor can charge customers. By setting a rate of return based on a benchmark, rather than the actual costs of individual businesses, distributors have incentives to finance its business as efficiently as possible.
We published our rate of return guideline in December 2013.46 It sets out the method we propose to estimate the allowed rate of return for electricity and gas network businesses. The guideline is not binding on us in determining the allowed rate of return or on service providers in proposing their allowed rate of return as part of their revenue proposals. However, should we decide to depart from the guideline we must provide reasons for doing so. Equally, while it is open to network businesses to move away from the guideline within their specific revenue proposals, the rules require that they provide reasons for a proposal to depart from the approach set out in the guideline.
4.1 ActewAGL's proposed overall rate of returnTable 8 summarises ActewAGL's rate of return proposal. The first row shows the
overall rate of return, or weighted average cost of capital (WACC), proposed by ActewAGL. The following rows show ActewAGL's proposed values for the individual components that, when combined, make up the WACC. These are the return on equity, return on debt, gearing ratio and level of imputation credits.
46 AER, Rate of return guideline, December 2013.
ActewAGL electricity distribution determination 2014–19 | Issues paper 32
Question
6. Do you consider that any departures from our rate of return guideline are justified?
7. In particular, do you have any comments on the departures proposed by ActewAGL?
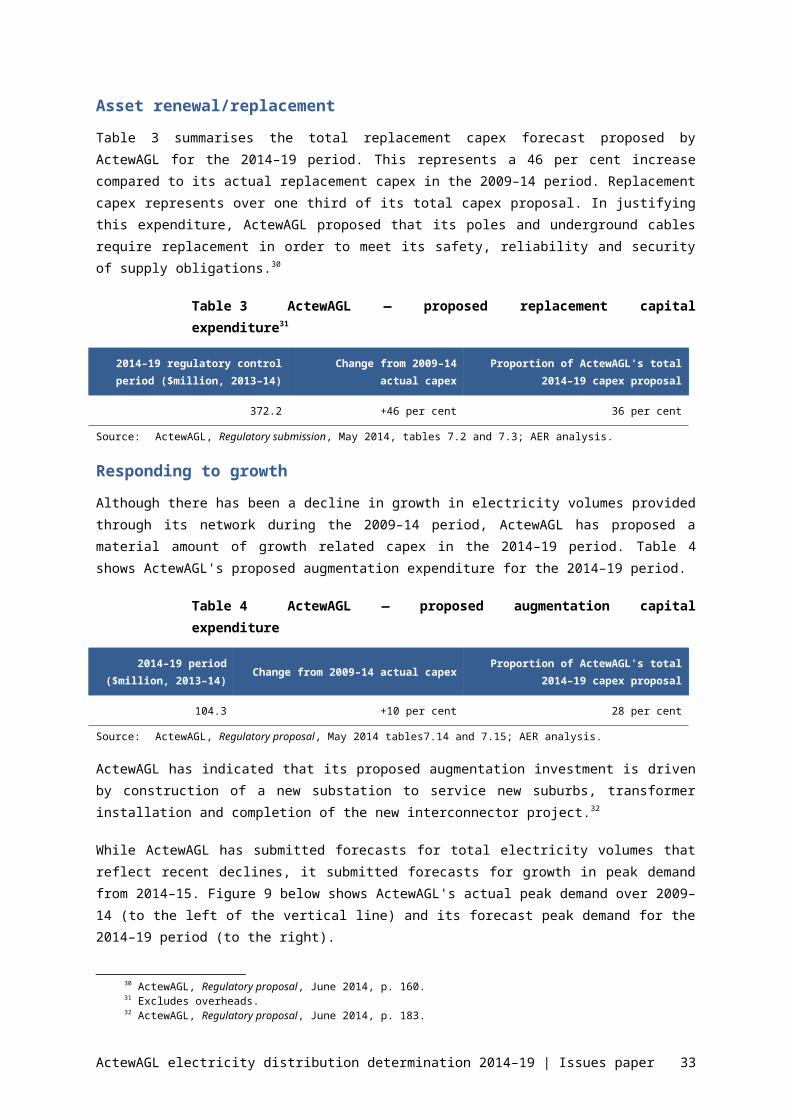
Table 8 ActewAGL's proposed rates of return (per cent)
Per cent
Overall WACC 8.99
Return on equity 10.71
Return on debt 7.85
Gearing 60
Imputation credits 0.25
Source: ActewAGL, Regulatory proposal, June 2014, table 10.1.
The return on debt number applies only for the first regulatory year (2014–15). ActewAGL has proposed to annually update the return on debt for the remaining years of the period, consistent with the rate of return guideline. However, the guideline states distributors should nominate, in their regulatory proposal (or during the F&A process), the averaging periods to be used in the annual updating for all five years of the regulatory period. In contrast, ActewAGL has nominated in its regulatory proposal the averaging periods for only the first two years and proposed to nominate during the 2014–19 period the averaging periods for the remaining years.
4.2 Return on equity Recognising there is not one perfect model to estimate the return on equity, our rate of return guideline approach draws on a variety of models and information which we have assessed as relevant. Our starting point is the standard capital asset pricing model (CAPM)—our ‘foundation model.’ We then use a range of models, methods, and information to inform our return on equity estimate. We use this information to either set the range of inputs into the CAPM foundation model or assist in determining a point estimate within the range of estimates of overall return on equity resulting from the CAPM foundation model.
We propose to use the Sharpe–Lintner capital asset pricing model (SLCAPM) as the foundation model, which runs as follows:
The SLCAPM is estimated by adding to the risk free rate the product of the equity beta and market risk premium (MRP).
Our approach is to estimate the risk free rate based on market conditions that prevail as close as possible to the commencement of the regulatory control period.
Our point estimate for equity beta is 0.7.
ActewAGL electricity distribution determination 2014–19 | Issues paper 33
As at December 2013, our point estimate for MRP is 6.5.
The range and point estimate for the expected return on equity is calculated based on the range and point estimates from the corresponding input parameters. For example, the lower bound of the expected return on equity range is calculated by applying the point estimate for the risk free rate and the lower bound estimates of the equity beta and MRP. A probability will not be assigned to values within the range, but it will not be assumed that all values within the range are equally probable.
ActewAGL did not use the approach set out in our guideline to calculate its proposed return on equity. While ActewAGL did use the SLCAPM, it combined this with the output of other models to derive an estimate of the return on equity that is higher than it likely would be if our guideline approach were applied. Table 9 summarises the models used by ActewAGL, their outputs and the weighting given by ActewAGL to each of the models in deriving its proposed return on equity of 10.71 per cent.
Table 9 ActewAGL's proposed return on equity
Return on equity (per cent) Weighting
Sharpe–Lintner CAPM 10.01 12.5
Black CAPM 10.62 25.0
Fama–French model 10.87 37.5
Dividend discount model 10.92 25.0
Weighted average10.71 100
Source: ActewAGL, Regulatory proposal, June 2014, table 10.5.
4.3 Return on debtApproach
To estimate the return on debt, our rate of return guideline proposes a ten year trailing average portfolio approach, with annual updates, after a period of transition. Our proposed transitional arrangement recognises the importance of transitioning from one benchmark approach to another benchmark approach. Under our proposed transitional arrangement, we would set 100 per cent of the allowed return on debt for the first year of the 2014–19 period based on current observed corporate bond yields (as reflected in the data series of a third party data service provider). For the second year (2015–16), we would set 90 per cent of the allowed return on debt based on then-current corporate yields. For the third year we would set 80 per cent of the allowed return based on then-current corporate yields. And so on.
Over the ten year transition period, progressively more of the allowed return on debt would be based on our proposed ten year trailing average portfolio approach. After the ten year transition period, 100 per cent of the allowed return on debt would be based on the ten year trailing average portfolio.
ActewAGL electricity distribution determination 2014–19 | Issues paper 34
ActewAGL has proposed an immediate transition to a ten year trailing average portfolio approach. That is, ActewAGL has not adopted our proposed transitional arrangement. The implementation of transitional arrangements is therefore one of the key issues for this reset on return on debt.
ImplementationIn our rate of return guideline we proposed to apply the published yields from an
independent third party data service provider for estimating the prevailing return on debt for each service provider during the averaging period. The options currently available are published debt yield data series from Bloomberg, the Reserve Bank of Australia (RBA), or a combination of these series. ActewAGL adopted a benchmark 10 year term of debt and then proposed to use published yields from the RBA. On 7 April 2014, we released an issues paper47 seeking submissions on which third party data service provider distributors should use to estimate the return on debt. We will consider and respond to submissions on this separate issues paper in the context of our reset determinations. Stakeholders should read the April issues paper for more details on this topic.
Our guideline also sets a benchmark credit rating of BBB+, based on the median credit rating for a sample of Australian utilities from 2002 to 2012. ActewAGL has departed from our guideline in regard to the benchmark credit rating. It has proposed to apply a benchmark credit rating of BBB instead of BBB+. It is not clear what impact (if any) the proposed change in credit rating would have, given the two possible data series' providers (the RBA and Bloomberg) both publish broad BBB rated data series.
4.4 Imputation creditsUnder the Australian taxation system, investors can receive an 'imputation credit' for income tax paid at the company level. For investors that meet certain eligibility criteria, this credit can be used to offset their tax liabilities. Imputation credits are a benefit to investors in addition to any cash dividend or capital gains from owning shares.
The rules account for the value of imputation credits through an adjustment to the company income tax building block allowance. The lower the value of imputation credits, the larger the revenue allowance for the distributor. Our guideline proposes that the value of imputation credits would be estimated as a market-wide parameter, rather than estimating this on an industry or business specific basis. Under our guideline, it would be determined as the product of:
a payout ratio, which represents the proportion of imputation credits generated by the benchmark entity that are distributed to investors
a utilisation rate, which is the extent to which investors can use the imputation credits they receive to reduce their tax or to get a refund.
The payout ratio would be estimated using the cumulative payout ratio approach. This approach uses ATO tax statistics to calculate the proportion of imputation credits generated (via tax payments) that have been distributed by companies since the start of the imputation system. At the time of our guideline's publication, this approach produced an estimate of 0.7 for the payout ratio.
47 AER, Return on debt: Choice of third party data service provider – Issues paper, April 2014.
ActewAGL electricity distribution determination 2014–19 | Issues paper 35
The utilisation rate would be estimated using the body of relevant evidence with regards to its strengths and limitations, checked against a range of supporting evidence. In the guideline, our assessment of this evidence produced an estimate of 0.7 for the utilisation rate. Our guideline therefore proposed an estimate of 0.5 for the value of imputation credits, based on a payout ratio of 0.7 and a utilisation rate of 0.7.
ActewAGL has supported a payout ratio of 0.7, but it has not supported our approach to interpreting and estimating the utilisation rate.48 It proposed instead that the utilisation rate should be 0.35. Combining a payout ratio of 0.7 with a utilisation rate of 0.35, gives ActewAGL's proposed imputation credit rate of 0.25.49
48 ActewAGL, Regulatory proposal, June 2014, p. 289.49 ActewAGL, Regulatory proposal, June 2014, p. 290.
ActewAGL electricity distribution determination 2014–19 | Issues paper 36
5 Interrelationships between components of our decisionIn considering our overall decision on ActewAGL's regulatory proposal, we must take account of the interrelationships between the separate components such as capex, opex and the rate of return. In our decision, we must describe those interrelationships and how we have accounted for them. We consider your views on these interrelationships will be valuable to our assessment of ActewAGL's regulatory proposal.
To assist you in providing us with submissions on the interrelationships inherent in ActewAGL's regulatory proposal, this attachment describes the building block model and outlines some of the interrelationships we are likely to take into account.
5.1 The building block modelIf we do not accept ActewAGL's revenue proposal, we must ourselves determine the efficient cost of providing distribution services, subject to the requirements of the rules. To do this, we assess the total revenue required to provide distribution services for each year of the period.50 In accordance with the rules, we use a building block approach to determine the annual revenue requirement. The key cost elements include:
a return on the regulatory asset base (return on capital)
depreciation of the regulatory asset base (return of capital)
opex
increments or decrements resulting from the efficiency benefit sharing scheme (EBSS)
the estimated cost of corporate income tax.
Our assessment of capex directly affects the size of a distributor's asset base and therefore the return on capital and return of capital building blocks.
Figure 11 below illustrates the building block approach.
50 We will also determine ActewAGL's transmission revenue.
ActewAGL electricity distribution determination 2014–19 | Issues paper 37
Question
8. How should we balance the interrelationships between building block components when making our decision on ActewAGL's regulatory proposal?
Return on capital (forecast RAB × cost of capital)
Regulatory depreciation (depreciation [net of indexation] applied RAB)
Corporate income tax (net of value of imputation credits)
Capital costs
Operating expenditure (opex)
Efficiency benefit sharing scheme (EBSS) (increment or decrement)
Total revenue
5.2 Interrelationships between building block componentsIn some cases, some costs may be substitutes, so that increasing one may lead to decreasing another. In other cases, increasing one component will increase another. For example, increasing the rate of return on equity increases both the return on capital and tax allowances. Below, we describe some of the interrelationships we consider may be important to our assessment of ActewAGL's proposal.
Repair or replace assetsMaintaining existing assets incurs opex costs. The size of these costs is related to the age or condition of the assets. If assets are replaced instead of maintained, the distributor incurs capex costs, but there should also be a drop in ongoing opex related to repairs and maintenance.
Building assets increases the return on capital and depreciationThe more capex investment undertaken by ActewAGL, the larger its future return on capital and depreciation allowance.51 This is because capex contributes to the size (value) of a distributor's asset base. The return on capital is equal to the rate of return multiplied by the value of the distributor's asset base. So the larger the asset base, the larger the dollar amount return on capital and therefore how much revenue they are allowed to recover. In the same way, the distributor's depreciation allowance typically becomes larger as the asset base becomes larger.
51 There is also a secondary impact on the tax allowance.
ActewAGL electricity distribution determination 2014–19 | Issues paper 38
Figure 11 The building block approach to determining total revenue
More assets require more maintenanceDepending on the type of capex investments made by ActewAGL, additional investment may create need for more opex spending. This is because, in principle, more assets require more maintenance. This effect may be offset by capex investment that creates operational efficiencies, or avoids increasing opex required to extend the operating life of ageing assets, as described above.
Incentive schemes and revenue allowancesSchemes to provide ActewAGL with incentives to become more efficient, such as the EBSS, affect the revenue allowances we determine for capex and opex. For example, by seeking to maximise its EBSS payment, a distributor may uncover efficiencies in its maintenance activities. In the short term, the distributor is allowed to retain the savings it achieved. But in the longer term, the savings reduce the distributors' opex allowance, reducing prices. Because capex spending can either increase or decrease the need for opex costs to be incurred, the EBSS incentive may also influence both short and long term capex allowances. Other incentive schemes, such as the service target performance incentive scheme, target capex more directly.
A range of further interrelationships exist within the building block elements, where our decision on technical variables influence one or more of the building blocks themselves. These include:
the economic life of assets — affects the asset base, depreciation, return on capital, capex, opex
opex step changes — affects capex, opex, incentive schemes, pass throughs
opex base year adjustments — affects opex, capex, incentive schemes
forecast inflation — affects all forecasts in nominal terms
related party transactions — affects capex, RAB, depreciation, return on capital, opex.
ActewAGL electricity distribution determination 2014–19 | Issues paper 39


![[47] Strain wave gearing design system wave gearing...167 AMTEC [47] Strain wave gearing design system Fig.47.1 Strain wave gearing design system 47.1 Overview Strain wave gearing](https://img.pdfslide.net/doc/110x75/5e356487029e073cbd586fdc/47-strain-wave-gearing-design-wave-gearing-167-amtec-47-strain-wave-gearing.jpg)