Embed Size (px)
Citation preview
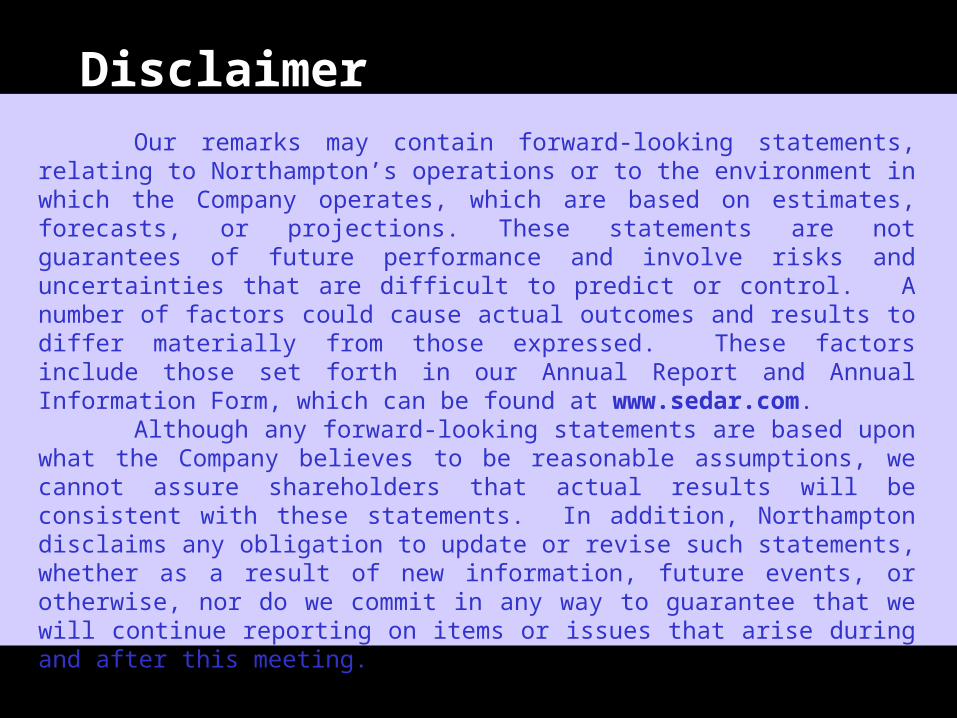
Our remarks may contain forward-looking statements, relating to Northampton’s operations or to the environment in which the Company operates, which are based on estimates, forecasts, or projections. These statements are not guarantees of future performance and involve risks and uncertainties that are difficult to predict or control. A number of factors could cause actual outcomes and results to differ materially from those expressed. These factors include those set forth in our Annual Report and Annual Information Form, which can be found at www.sedar.com.
Although any forward-looking statements are based upon what the Company believes to be reasonable assumptions, we cannot assure shareholders that actual results will be consistent with these statements. In addition, Northampton disclaims any obligation to update or revise such statements, whether as a result of new information, future events, or otherwise, nor do we commit in any way to guarantee that we will continue reporting on items or issues that arise during and after this meeting.
DisclaimerDisclaimer
Northampton’s ProfileNorthampton’s Profile
• 2,064 rooms in 16 hotels in the GTA, Montreal, Ottawa, Princeton
• Great accommodation in the mid-price range
• Most hotels franchised through major chains
• Excellent operations; great management
Hospitality BusinessHospitality Business
• Challenging and competitive market
• Reduced tourism from the US
• More players of all sizes
• REITs are in acquisition mode
• New builds despite quiet market
QuickTime™ and aTIFF (Uncompressed) decompressor
are needed to see this picture.
CompetitionCompetition
• All players pushed to control costs -- decreasing NHG’s historical edge
• Margins lower, forcing leaner operations
• Increasingly difficult to get 35% operating profit margins, NHG’s traditional goal
Northampton’s Strategy Northampton’s Strategy
• Good business model, great track record, excellent operators
• Improve and upgrade portfolio constantly, including management systems
• Create individual marketing programs for each hotel
• Implement plan to realize intrinsic value
• Market may be right to sell; some assets may have matured enough to divest
HighlightsHighlights
• Well financed • Consistently profitable with dividend• Continuous property improvement• Increasing occupancy rates• Focus on cash flow• Executing strong strategy• Systematic acquisition template• Award-winning management
• Value players
AwardsAwards• Pinnacle Award - twice consecutively
• Gold Standards Award from Country Inns by Carlson -- Country Inn & Suites Kanata
• Choice Hotel International Gold Hospitality Award -- Quality Inn Airport West
• Gold Standards Award, Sales Growth Award, 100% Stay-Again Rating -- Country Inn Oakville
• Excellent Quality Performer by InterContinental -- Holiday Inn Whitby
• Directors’ Awards at Best Western Brampton and Best Western Cambridge (3rd consecutive time)
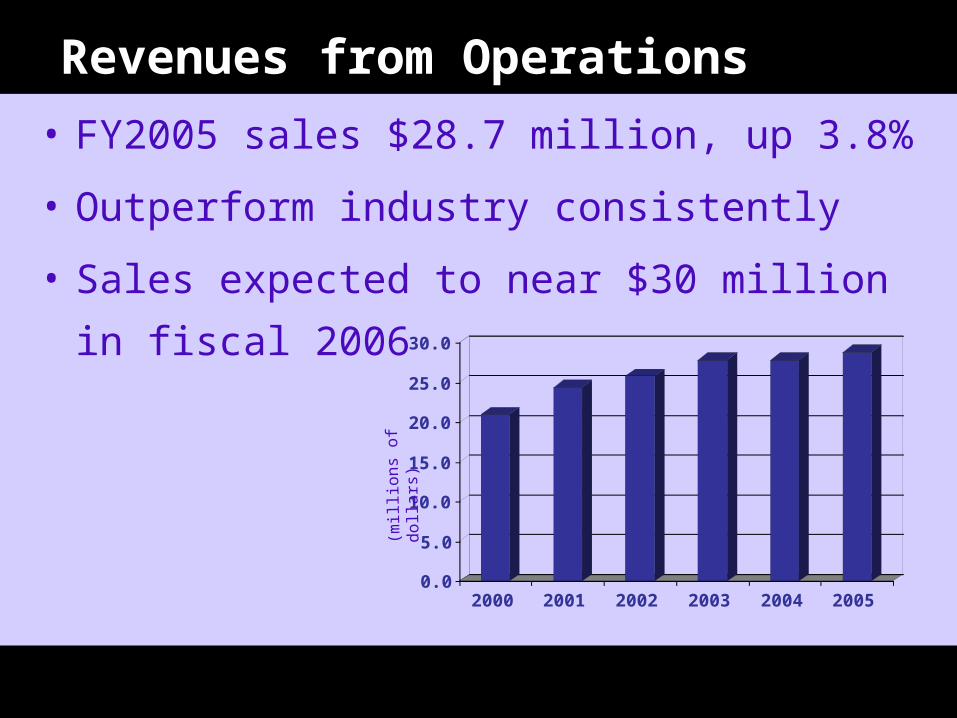
Revenues from OperationsRevenues from Operations
• FY2005 sales $28.7 million, up 3.8%
• Outperform industry consistently
• Sales expected to near $30 million in
fiscal 2006
0.0
5.0
10.0
15.0
20.0
25.0
30.0
2000 2001 2002 2003 2004 2005
(mill
ions
of
dolla
rs)
EBITA, Margins, Cash Flow in ‘05EBITA, Margins, Cash Flow in ‘05
• EBITA increased in FY2005 to $7.8mm
• Income from operations up 22.1%
• Gross margins relatively constant - 27.0% • We continue to target the 35% range for gross
margins by FY2006• Non-cash charges affected bottom line• Posted cash flow of $3.4 million, retained
earnings up to $9.7 million from $9.0 million, and long-term debt reduced by 5.8%
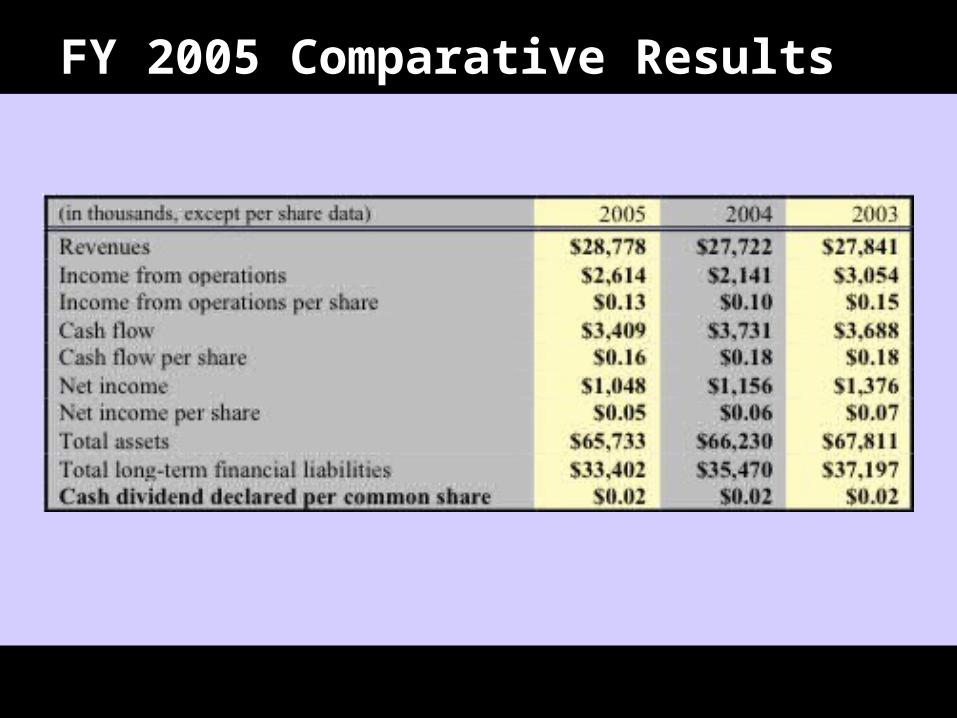
FY 2005 Comparative ResultsFY 2005 Comparative Results
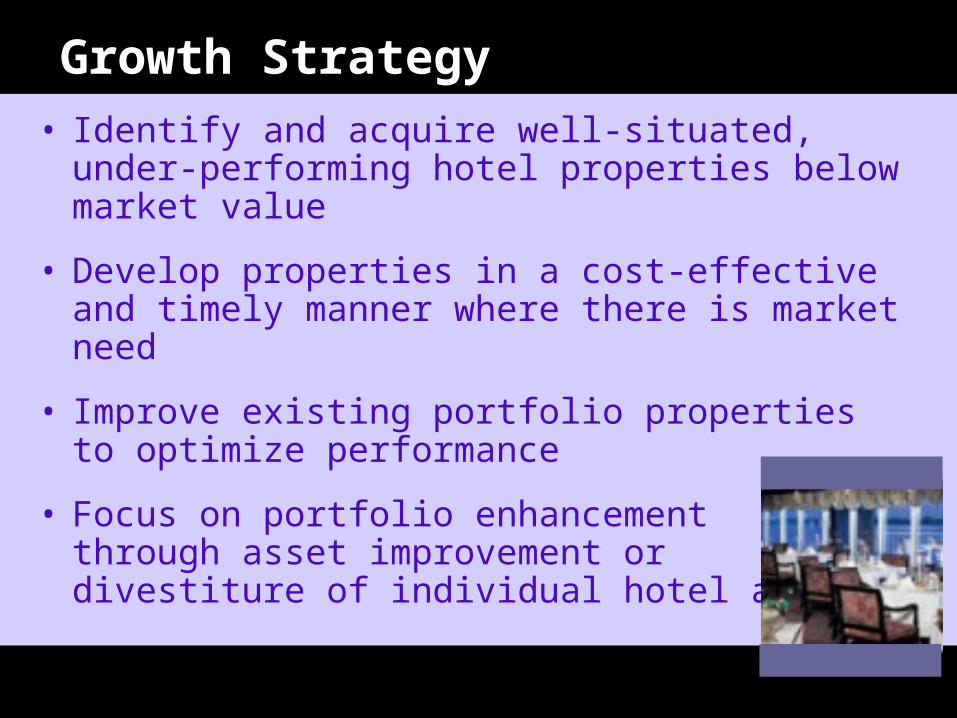
Growth StrategyGrowth Strategy• Identify and acquire well-situated, under-
performing hotel properties below market value
• Develop properties in a cost-effective and timely manner where there is market need
• Improve existing portfolio properties to optimize performance
• Focus on portfolio enhancement through asset improvement or divestiture of individual hotel assets
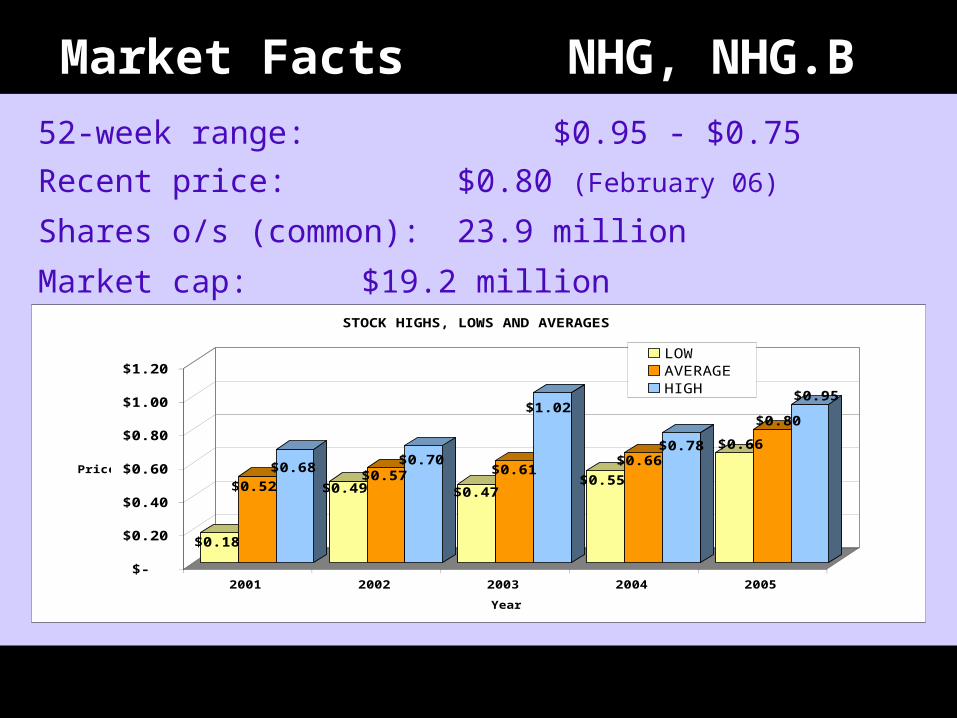
Market FactsMarket Facts NHG, NHG.B NHG, NHG.B
52-week range: $0.95 - $0.75
Recent price: $0.80 (February 06)
Shares o/s (common): 23.9 million
Market cap: $19.2 million
$0.18
$0.52$0.68
$0.49$0.57
$0.70
$0.47
$0.61
$1.02
$0.55
$0.66$0.78 $0.66
$0.80
$0.95
$-
$0.20
$0.40
$0.60
$0.80
$1.00
$1.20
Price
2001 2002 2003 2004 2005
Year
STOCK HIGHS, LOWS AND AVERAGES
LOWAVERAGEHIGH
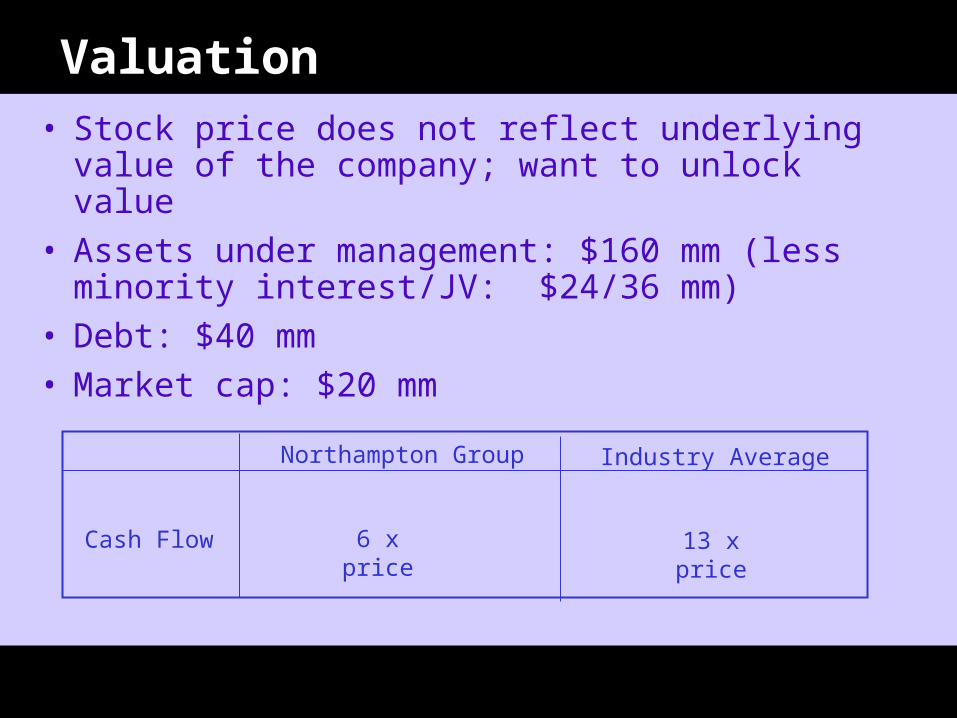
ValuationValuation
Northampton Group Industry Average
Cash Flow 6 x price 13 x price
• Stock price does not reflect underlying value of the company; want to unlock value
• Assets under management: $160 mm (less minority interest/JV: $24/36 mm)
• Debt: $40 mm• Market cap: $20 mm
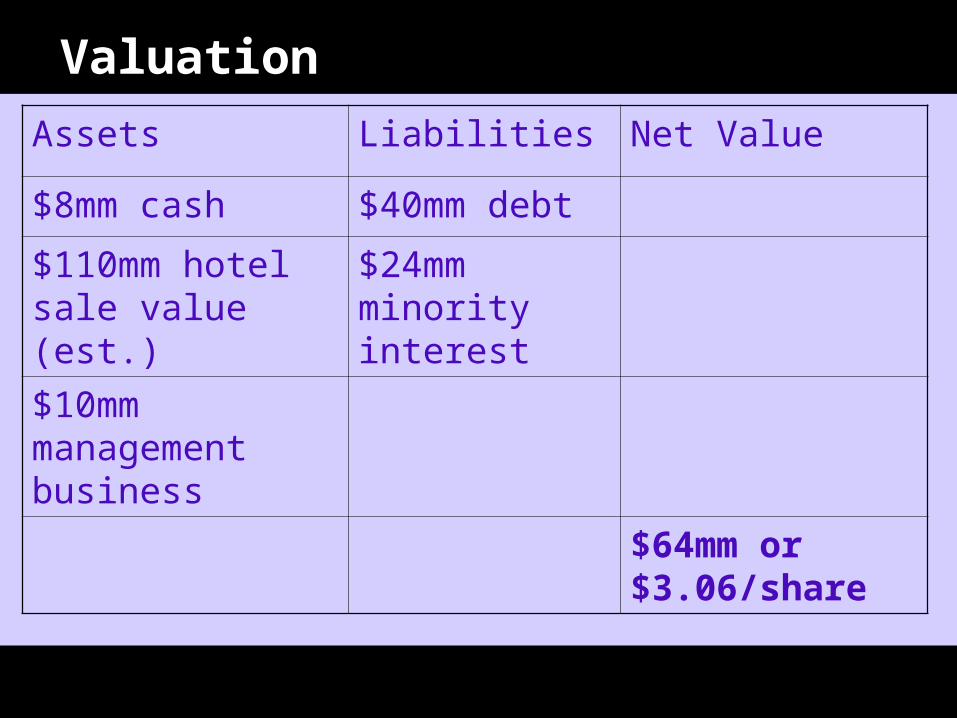
ValuationValuation
Assets Liabilities Net Value
$8mm cash $40mm debt
$110mm hotel sale value (est.)
$24mm minority interest
$10mm management business
$64mm or $3.06/share