Embed Size (px)
Citation preview
OURWETLANDS,OURWORLD
A High School Activity Guideto Upper Newport Bay

Our Wetlands, Our World2
OURWETLANDS,OURWORLD
A High School Activity Guideto Upper Newport Bay
A Project of the Community-Based Restoration and Education Program
Our Wetlands, Our World 3
Our Wetlands, Our World4
Foreword
Located in the heart of coastal Orange County, Upper Newport Bay (UNB) comprises approximately1,000 acres of open space—representing the largest remaining intact estuary in southern California,where an estimated 97 percent of historic wetlands has been lost. Known as one of the best birdingsites in North America, UNB is a refuge for migrating birds and also supports a wide array of plantand animal life, including several endangered species. Upper Newport Bay’s vegetation filters andcleans degraded water coming from a 154 square-mile watershed stretching from Santiago Oaks tothe Pacific Ocean.
Unfortunately, this rich ecosystem has been seriously degraded. The area surrounding the wetlandhas been disturbed and converted by grazing, development, species introductions, and other humanactivities. Without our attention, invasive plants, which currently make up 48 percent of the Bay’sflora, will out-compete and displace native species that once provided habitat. Protecting and improv-ing the vitality of Upper Newport Bay’s wetland ecosystem requires educating the Orange Countycommunity and restoring the endangered habitats.
The California Coastal Commission, whose mission is to preserve and restore the biodiversity andhealth of California’s coastal and marine ecosystems, initiated the Marine Education Project in 2002.This project, now its own entity relying entirely on outside funding, operates the Community-BasedRestoration and Education Program (CBREP) at Upper Newport Bay, a collaborative effort involvinglandowners and other stakeholders, including the County of Orange, the Department of Fish andGame, the City of Newport Beach, and the Newport Bay Naturalists and Friends.
The primary goal of CBREP is to protect and restore coastal habitats while creating an avenue forcommunity involvement and education. The Our Wetlands, Our World activity guide for high schoolclassrooms is part of the program’s effort to promote wetlands education and restoration throughhands-on learning. Our Wetlands, Our World is based on CBREP’s premise that if people develop apersonal relationship with an environment, they will be more motivated to protect it.
We invite you to share the commitment to conservation, education, appreciation, and stewardship ofwetland habitats. It is critical to the viability of Upper Newport Bay that future generations under-stand the value of coastal habitats and participate in their protection and restoration.
For more information, or to order copies of this activity guide, contact:California Coastal Commission
45 Fremont Street, Suite 2000, San Francisco, CA, 94105(415) 904-5200
Copyright 2004 The California Coastal Commission. Student pages may be reproduced without permission.
Our Wetlands, Our World is printed on recycled paper.
Our Wetlands, Our World 5
AcknowledgmentsCurriculum Advisory Committee
Maureen Allen Orange County Department of EducationDennis Baker Newport Bay Naturalists and FriendsStephanie Barger Earth Resource FoundationFrances Cummings Rio Hondo UniversityKristina Finstad California Coastal CommissionAnnie Kohut Frankel California Coastal CommissionSarah James Department of Fish and GameJayne Lindauer Santa Ana High SchoolChristiane M.R. Parry California Coastal CommissionChris Raisbeck Sage Hill High SchoolRoger Reinke Newport Bay Naturalists and FriendsJohn Scholl Department of Fish and GameEben Schwartz California Coastal CommissionMike Starkweather Corona Del Mar High SchoolGrace Yick Orange County Harbors, Beaches, and Parks
Curriculum Development and AdaptationKay IceEducational Development Specialists
EditorsKristina FinstadAnnie Kohut FrankelChristiane M.R. ParryEben Schwartz
DesignMark ShepardShepard Associates
Our Wetlands, Our World6
Appreciation is expressed to the following organizations and individuals that granted permission foruse of their activities and/or artwork in this publication:
Acorn Naturalists, 155 El Camino Real, Tustin, CA 92780, (714) 838-4888,www.acornnaturalists.com
Cabrillo Marine Aquarium, 3720 Stephen White Drive, San Pedro, CA 90731, (310) 548-7562Artwork on pages 144 (bottom); 145 (top).
Frank M. Roberts, Jr., Artwork on pages 144 (top); 147 (bottom).
International Project WET, 201 Culbertson Hall, Montana State University, P.O. Box 17057,Bozeman, MT 59717-0575, (406) 994-5392, [email protected], www.projectwet.org
National Park Service at the Golden Gate Recreation Area,Golden Gate National Recreation Area, (415) 561-4757
National Science Teachers Association,1840 Wilson Boulevard, Arlington, Virginia 22201-3000, www.nsta.org
Save The Bay, 350 Frank Ogawa Plaza, Suite 900, Oakland, CA 94612, (510) 452-9261, [email protected], www.saveSFbay.org
Newport Bay Naturalists and Friends, Artwork on pages 147 (top); 148 (bottom); 149 (top); 153 (top and bottom); 154 (top and bottom); 155 (top)
State of California, California Coastal Commission, California Coastal Access Guide, Sixth Edition,Copyright 2003: Artwork on pages 146 (top and bottom); 155 (bottom); 156 (bottom).
State of California, California Coastal Commission, California Coastal Resource Guide, Copyright 1987: Artwork on pages 145 (bottom); 148 (top); 158 (top).
U. S. Fish and Wildlife Service/Bob Savannah, Artwork on page 151 (top).
University of Oklahoma, Sam Nobel Oklahoma Museum of Natural History,Artist Zenith Marsh: Artwork on page 150 (bottom).
Zack Zdinak, Copyright 1999: Artwork on page 151 (bottom).
Our Wetlands, Our World 7
Our Wetlands, Our World8
Our Wetlands,Our World
A High School Activity Guide to Upper Newport Bay
Our Wetlands, Our World provides information and activities to help high school students learn aboutthe importance of wetlands and to become involved in restoration of these valuable, unique environ-ments. It also helps bring State Content Standards to life by linking science concepts to localresources. The focus of the guide is on Upper Newport Bay in Orange County; however, much of theinformation is applicable to other wetland sites.
Organization
The guide is divided into three sections:I. Watersheds and Wetlands
II. Human ImpactsIII. Taking Action
Each section begins with information on that topic written for the student. This information providesthe background for many of the activities within the section.
Following the text in each section are activities to provide students with classroom and sometimesfield experience to bring concepts to life. The activities were chosen based on several criteria, includ-ing inquiry-based learning, hands-on instruction, relation to Upper Newport Bay’s specific habitatsand issues, adaptability to various classroom settings, interest to students, ease of use, and correlationwith State Standards.
The appendices at the end of the guide include:
• UNB Inhabitant Cards. These cards provide information on 30 inhabitants of UpperNewport Bay. There are six cards in each of the following categories: plants, birds, land ani-mals, fish, and other marine animals. The cards are used in many activities throughout theguide. It is suggested that you photocopy the cards onto cardstock and laminate them, espe-cially if they will be used in field studies.
• Species Common to Upper Newport Bay. This list shows some of the plants, birds, landanimals, fish, and other marine animals common to the region. Students may see thesespecies on a field trip to the Bay; and they can use this list to make other UNB InhabitantCards.
• Resources. The lists of organizations, wetlands, and websites can help both the studentsand the teacher in pursuing further knowledge and involvement opportunities available atUpper Newport Bay and other wetlands.
Our Wetlands, Our World 9
Activity Format
Each activity is organized as follows:
Summary. Provides an overview of the lesson and its intent.
California State Content Standards. Lists the Standards addressed in each curricular area(Science, History/Social Science, Math, English/Language Arts).
Objectives. States the goals; that is, what students will learn to do in the activity.
Materials. Specifies the materials needed to conduct the activity, such as worksheets that areincluded and any other materials (e.g., chart paper, soil samples, test tubes).
Preparation. Describes the steps that need to be taken prior to conducting the activity (e.g.,copy worksheets, obtain water samples, set up testing stations).
Time Required. Gives the approximate amount of time needed to conduct the activity.
Procedures. Provides a step-by-step guide to conducting the activity.
Follow-up. Includes discussion questions and/or culminating actions to review students’ work,highlight what students have learned, and provide closure.
Extensions. Suggests further activities to expand the study, to specifically meet your curricu-lum framework, and/or to apply the knowledge directly to students’ community.
Field Studies
Several of the activities are labeled “Field Study” (or “Optional Field Study” or “Partial Field Study”).• Explore a Wetland (page 35)• Wetland Soil (page 43)• Measuring Decomposition (page 51)• Water Quality (page 79)• Space for Species (page 90)• Seed Experiments (page 116)• Plant Monitoring (page 124) Monitoring is done March-June.• Stewardship (page 138) Planting is done September-February;
seed collecting is done May-August.
Our Wetlands, Our World10
These activities incorporate a field trip to Upper Newport Bay or other wetland or, perhaps, anothernatural site. If your class takes a field trip to a wetland site, you may want to conduct some or all ofthe above activities while at the site.
Some activities require samples of soil, water, or seeds from a wetland or other natural site. You canuse a class field trip to Upper Newport Bay to collect samples in preparation for these activities, or ifyou are not planning a class field trip, you can collect all the necessary samples yourself during onevisit to a wetland site. See the materials lists and preparation steps for the following activities requir-ing samples:
• Wetlands Soil (page 43)• Measuring Decomposition (page 51)• Water Quality (page 79)• Seed Experiments (page 116)
Suggestions for Use
The three sections of this guide are sequential, progressing from an overview of wetlands, to theeffects humans have had on these habitats, and then finally to the steps being taken to restore wet-lands. Though each section is self-contained, presenting the information in this order will providestudents a more complete picture.
It is suggested that you photocopy the informational text in each section for students to read and todiscuss prior to conducting activities in that section. The activities are also presented in a sequentialorder, but each activity is a separate lesson that can be used independently. Choose those activities—and extensions—that fit your curriculum and the level and interest of your class to move studentsfrom awareness to experience and action.
A field trip to Upper Newport Bay, or other wetland, is strongly encouraged though not required forstudents to understand and appreciate the importance of wetlands. The first field trip activity, Explorea Wetland, will give students first-hand knowledge of the chosen site and will serve to engender asense of stewardship. Taking this field trip toward the beginning of your wetlands study will also allowyou to collect samples to be used in other activities.
Correlations with California State Content Standards
All activities have been correlated with California State Content Standards in Science, History/SocialScience, Math, and English/Language Arts for grades 9-12. The Standards addressed by each activityare listed at the beginning of the activity. They are also presented in matrix format for quick referencein the appendix.
Our Wetlands, Our World 11
Our Wetlands, Our World12
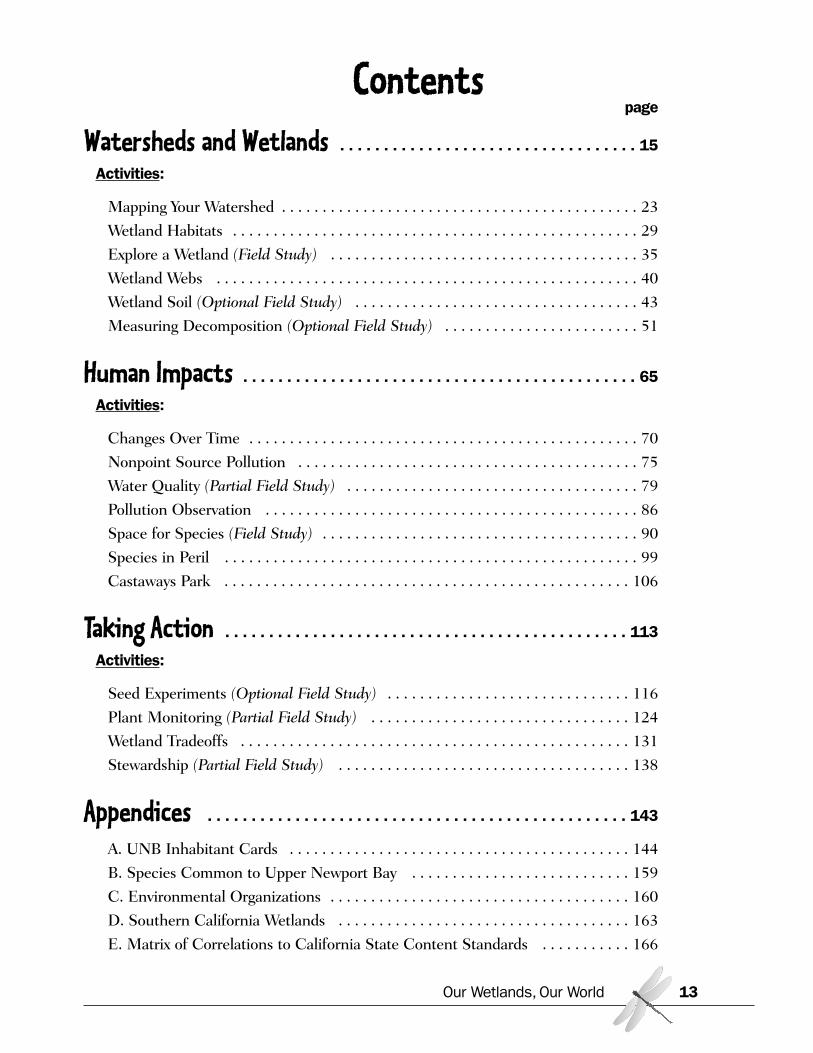
Contentspage
Watersheds and Wetlands . . . . . . . . . . . . . . . . . . . . . . . . . . . . . . . . . . 15
Activities:
Mapping Your Watershed . . . . . . . . . . . . . . . . . . . . . . . . . . . . . . . . . . . . . . . . . . . . 23
Wetland Habitats . . . . . . . . . . . . . . . . . . . . . . . . . . . . . . . . . . . . . . . . . . . . . . . . . . 29
Explore a Wetland (Field Study) . . . . . . . . . . . . . . . . . . . . . . . . . . . . . . . . . . . . . . 35
Wetland Webs . . . . . . . . . . . . . . . . . . . . . . . . . . . . . . . . . . . . . . . . . . . . . . . . . . . . 40
Wetland Soil (Optional Field Study) . . . . . . . . . . . . . . . . . . . . . . . . . . . . . . . . . . . 43
Measuring Decomposition (Optional Field Study) . . . . . . . . . . . . . . . . . . . . . . . . 51
Human Impacts . . . . . . . . . . . . . . . . . . . . . . . . . . . . . . . . . . . . . . . . . . . . . 65
Activities:
Changes Over Time . . . . . . . . . . . . . . . . . . . . . . . . . . . . . . . . . . . . . . . . . . . . . . . . 70
Nonpoint Source Pollution . . . . . . . . . . . . . . . . . . . . . . . . . . . . . . . . . . . . . . . . . . 75
Water Quality (Partial Field Study) . . . . . . . . . . . . . . . . . . . . . . . . . . . . . . . . . . . . 79
Pollution Observation . . . . . . . . . . . . . . . . . . . . . . . . . . . . . . . . . . . . . . . . . . . . . . 86
Space for Species (Field Study) . . . . . . . . . . . . . . . . . . . . . . . . . . . . . . . . . . . . . . . 90
Species in Peril . . . . . . . . . . . . . . . . . . . . . . . . . . . . . . . . . . . . . . . . . . . . . . . . . . . 99
Castaways Park . . . . . . . . . . . . . . . . . . . . . . . . . . . . . . . . . . . . . . . . . . . . . . . . . . 106
Taking Action . . . . . . . . . . . . . . . . . . . . . . . . . . . . . . . . . . . . . . . . . . . . . . 113
Activities:
Seed Experiments (Optional Field Study) . . . . . . . . . . . . . . . . . . . . . . . . . . . . . . 116
Plant Monitoring (Partial Field Study) . . . . . . . . . . . . . . . . . . . . . . . . . . . . . . . . 124
Wetland Tradeoffs . . . . . . . . . . . . . . . . . . . . . . . . . . . . . . . . . . . . . . . . . . . . . . . . 131
Stewardship (Partial Field Study) . . . . . . . . . . . . . . . . . . . . . . . . . . . . . . . . . . . . 138
Appendices . . . . . . . . . . . . . . . . . . . . . . . . . . . . . . . . . . . . . . . . . . . . . . . . 143
A. UNB Inhabitant Cards . . . . . . . . . . . . . . . . . . . . . . . . . . . . . . . . . . . . . . . . . . 144
B. Species Common to Upper Newport Bay . . . . . . . . . . . . . . . . . . . . . . . . . . . 159
C. Environmental Organizations . . . . . . . . . . . . . . . . . . . . . . . . . . . . . . . . . . . . . 160
D. Southern California Wetlands . . . . . . . . . . . . . . . . . . . . . . . . . . . . . . . . . . . . 163
E. Matrix of Correlations to California State Content Standards . . . . . . . . . . . 166
Our Wetlands, Our World 13
Our Wetlands, Our World14
WATERSHEDS AND WETLANDSWatersheds
When rain falls or when snow melts, where does the water go? Where does water from your hose orsprinklers end up? Some of it soaks into the ground, but the excess water, called runoff, flows fromhigh points to low points, eventually draining into a body of water. This drainage basin—the areathrough which all water flows from its highest source to a lake or ocean—is called a watershed.
Where It All BeginsA watershed starts at mountain peaks and hilltops. Snowmelt and rainfall run into mountain streams.As tributaries connect, the streams get bigger, eventually becoming rivers. As the rivers leave themountains and reach flatter ground, the water slows and looks for the path of least resistance acrossthe land. This path may be along a concrete channel provided for flood control. Eventually the riversflow into a lake or ocean.
All land is part of a watershed, and the characteristics of the land greatly affect how water flowsthrough the watershed. On heavily vegetated, relatively flat terrain, runoff is slow, and percolation—seepage—into the ground is great. In steep, bare terrain, runoff flows rapidly. Human-made features,such as dams or large paved areas, can also affect the water flow.
It’s Not Just WaterWater flows downstream, taking with it whatever it picks up. For example, if a creek flows through anagricultural area, it can pick up fertilizer, manure, and pesticides from farming operations. In urbanand suburban areas, it might gather fertilizers that wash off lawns, untreated sewage from failingsewer pipes, illegal wastewater discharges from industrial facilities, sediment from construction sites,lawn clippings and branches from yard maintenance, and oil from roads and parking lots. These pol-lutants may be deposited on river floodplains, may concentrate in coastal estuaries, or may draindirectly into the ocean.
All land areas—agricultural, suburban, urban, and coastal—can have an impact on our fresh andmarine waters. Water quality is affected by everything that goes on within the watershed.
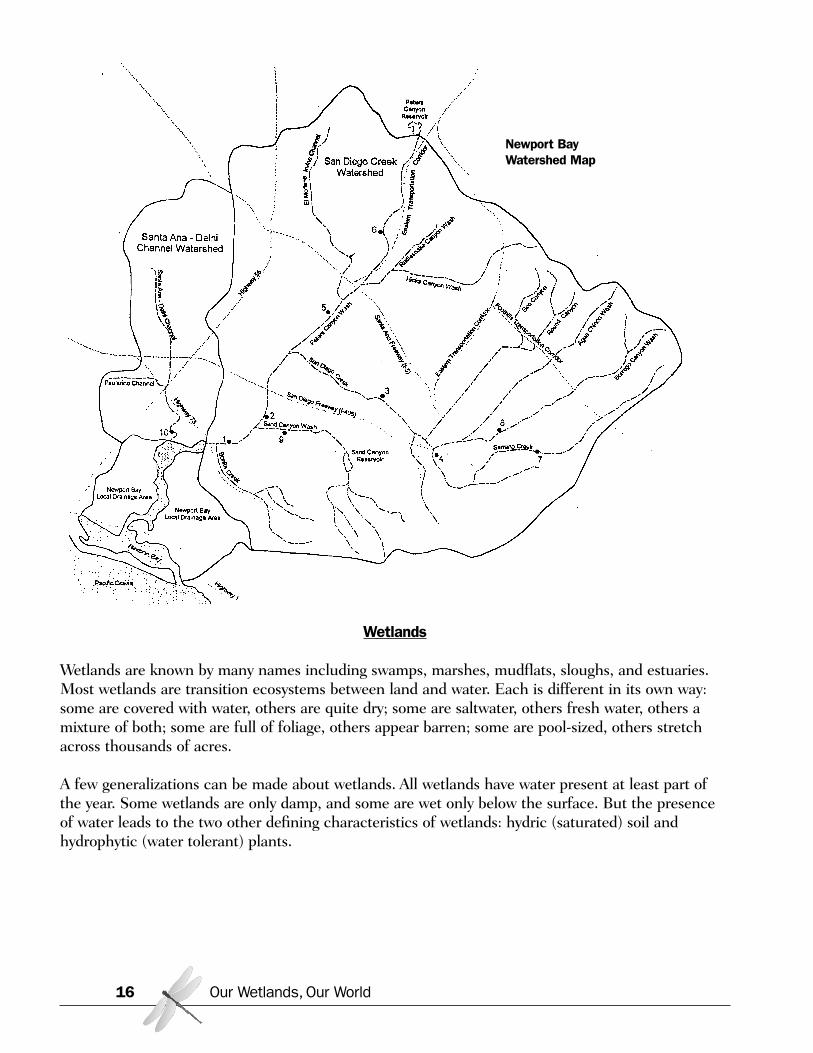
Your WatershedOrange County has 13 watersheds, all of them ending in the Pacific Ocean. In one of them, waterdrains into Upper Newport Bay from an area of approximately 154 square miles of land. This water-shed extends from the Bay to the Santiago Hills and includes parts of Costa Mesa, Irvine, LakeForest, Laguna Hills, Newport Beach, Orange, Santa Ana, and Tustin. Most of the water enters theBay via San Diego Creek.
Our Wetlands, Our World 15
Wetlands
Wetlands are known by many names including swamps, marshes, mudflats, sloughs, and estuaries.Most wetlands are transition ecosystems between land and water. Each is different in its own way:some are covered with water, others are quite dry; some are saltwater, others fresh water, others amixture of both; some are full of foliage, others appear barren; some are pool-sized, others stretchacross thousands of acres.
A few generalizations can be made about wetlands. All wetlands have water present at least part ofthe year. Some wetlands are only damp, and some are wet only below the surface. But the presenceof water leads to the two other defining characteristics of wetlands: hydric (saturated) soil andhydrophytic (water tolerant) plants.
Our Wetlands, Our World16
Newport BayWatershed Map
Where In the World Are They?Wetlands are found everywhere—along coastlines, in land-locked areas, in rural territory, and in themiddle of urban areas. Precipitation and topography play key roles in the formation of a wetland.Generally, wetlands are found:
- along rivers and lakes- near coasts and bays- in depressions where land is lower than the surrounding landscape- in places where groundwater seeps out of the ground- in broad, flat areas that receive significant rainfall.
EstuariesMany coastal wetlands, including most wetlands along the southern California coast, are estuaries.Estuaries are areas where freshwater streams meet the sea along the shores of bays and river mouths.They are the drainage point for the area’s watershed. Upper Newport Bay is just such a wetland.
Estuaries like Upper Newport Bay are particularly rich, productive ecosystems for several reasons:
• The freshwater sources deposit nutrient-rich sediments into the estuary.
• The ebb and flow of the tide cause a continual mixing of the water, distributing food andnutrients throughout the Bay and maintaining a relatively high level of oxygen in the water.
• The amount of sunlight in areas like southern California coupled with the shallow water inthe estuary provides ideal conditions for photosynthesis by microscopic algae.
With shifting boundaries that change with the tides, estuaries contain many habitats, from sub-merged marshland, to thick mudflats, to dry scrub brush. Each area accommodates the needs of dif-ferent species of plants and animals, many of them adapted to the exact conditions of that habitat.
The Value of Wetlands
They used to be called swamplands and were thought to be useless. As a result, many wetlands, par-ticularly those near population centers, were destroyed—diked, drained, and filled with soil to createbuildable land. Others were converted to farmland. In California, only 9 percent of our historic wet-land acreage remains. It is only recently that humans have recognized the immense value of preserv-ing wetlands. Wetlands are now considered to be among the most productive ecosystems in theworld.
Wetlands provide many benefits within a watershed, from decreasing flooding and erosion to increas-ing wildlife and water quality. The benefits from the wetlands in Upper Newport Bay include:
• water filtration• habitat for animals• recreation for people• economic contribution.
Our Wetlands, Our World 17
Water FiltrationWetlands act as filters to improve water quality. The water that flows through the watershed into wet-lands contains sediment and pollutants—fertilizers, soaps, pesticides, and lawn clippings, to name afew. As water enters a wetland, it slows, which causes sediment in the water to settle out, trappingthe pollutants before they reach the ocean.
Wetlands handle the pollutants in several ways. Some are buried in layers of wetland soil. Others areabsorbed by plants. Within the plants and soil, biological processes can break down and convert pol-lutants into less harmful substances. Without the wetland, the sediment and pollutants would draindirectly into the ocean. Ocean pollution as a result of runoff from land is a major environmentalproblem, threatening marine wildlife and human health. In recent years, polluted runoff has beenresponsible for numerous beach closures in southern California and elsewhere. In Orange County,education and regulations have paid off; in 2003, there were 81 beach closures—down from 137 in2002.
HabitatAcre for acre, there is more life in a healthy wetland than there is in almost any other kind of ecosys-tem, even matching the high productivity of rainforests and coral reefs. Wetlands support a tremen-dous variety of fish, birds, amphibians, mammals, reptiles, insects, and other animals—providing foodand shelter for them all.
Wetland waters are nutrient-rich with phytoplankton, zooplankton, and the organic debris of decayingplants. Many species of juvenile and small fish, as well as insects and small crustaceans, feed onthese nutrients. In turn, larger fish, mammals, birds, reptiles, and amphibians have a plentiful foodsupply. In the rich mud of a mudflat, many small animals—shrimp, crabs, snails, clams, andworms—live in a submerged city of tunnels and burrows.
Wetlands are havens for birds. They wade among the grasses, probing the mud for food. They swimin the open waters, scooping up fish. They soar overhead, searching the land and water for their nextmeal. It is estimated that 75 percent of all North American birds depend on wetlands. Migratorybirds from around the world stop at wetlands to feed and breed.
Many animal species use wetlands as nurseries. Fish and shellfish such as halibut, croaker, whiteseabass, and shrimp return to wetlands annually to spawn. Larval and juvenile fish develop in thewetlands until they grow strong enough to venture out into the ocean. Many birds build their nestsamong marsh plants, and in the wetlands chicks learn to fly and to forage for food. The thick vegeta-tion and shallow water found in wetlands provide good places to hide from predators, and the richsources of food provide energy for young animals to grow.
Many species that depend on wetlands to survive have suffered great losses over the years as wet-lands have disappeared. More than one-third of endangered and threatened species in the U.S. spendat least a portion of their lives in a wetland ecosystem.
Our Wetlands, Our World18
RecreationWetlands aren’t beneficial just for wildlife. These areas provide wonderful recreational opportunities.People come to wetlands to:
• bird watch• photograph wildlife• draw or paint• walk or bike• kayak or canoe• fish
Besides providing a site for such activities, wetlands are available to anyone who simply wants toenjoy the wonders of nature.
EconomicsOur nation’s fishing and shellfishing industries harvest many species that depend on wetlands fortheir survival. This catch is valued at $15 billion a year.
Coastal wetlands are critical to human food supplies. These areas produce millions of tons of organicmatter that provide the food for large commercial fish. And many fish consumed by people—forexample halibut and seabass—use wetlands as nurseries for their young.
The Southern California Beach Valuation Project estimated that beaches in Orange and Los AngelesCounties accounted for more than $1 billion of revenues during summer 2000. Approximately106,130 people visited Orange County beaches during this three-month period. Beaches are enginesfor coastal economies and cannot afford closures. Policies to improve water quality, such as wetlandprotection, could result in large economic gains through beach-tourism.
Our Wetlands, Our World 19
Upper Newport Bay
Upper Newport Bay in Newport Beach is the largest remaining estuary in southern California. It pro-vides habitat for hundreds of species of plants and animals, including humans.
For the BirdsUpper Newport Bay is home for nearly 200 species of birds, including several rare, threatened, orendangered species, such as the Light-footed Clapper Rail, Belding’s Savannah Sparrow, CaliforniaLeast Tern, and California Brown Pelican. The Bay is also an important stopover for migrating birdson the Pacific Flyway. During the winter months, up to 30,000 birds can be seen here on any day. Itis one of the few remaining places where migrating ducks and other waterfowl can rest.
From Fish to Furry CreaturesRoughly 80 species of fish have been identified in Upper Newport Bay. Most numerous are the smallfishes, such as the silvery mullet that is frequently seen jumping out of the water. Of course thesesmall fish provide food for predators, such as the gray smoothhound shark and round stingrays. Somefish are only seasonal, using the Bay as a nursery. Some species of fish have adapted to life in themud. Gobies and killifish seek out small pools, waiting for the tide to come back in. The long-jawedmudsucker actually burrows into the mud, where it can survive under extreme conditions of reducedoxygen and elevated temperature.
Various invertebrates live in the wetlands—bay mussels, snails, worms, shrimp, clams, and crabs, toname a few. Several species of amphibians, reptiles, and mammals can also be found in UpperNewport Bay. Frogs, snakes, lizards, squirrels, rabbits, raccoons, coyotes—all play their part in thefood chain and in the ecosystem of Upper Newport Bay.
Life as a PlantPlants are an extremely important part of a wetland ecosystem, providing both shelter and food forthe animals that live there. Many of the plants in Upper Newport Bay, as in any estuary, have devel-oped specialized ways of living in an environment that has changing levels of moisture and salinity.These plants, called halophytes, include cordgrass, pickleweed, and saltgrass—each with features thatallow the plant to survive in this environment. For example, saltgrass has specialized glands that serveas saltshakers to get rid of extra salt.
Along with the marsh plants in the Bay are rare riparian and scrub communities that include willowsand sages. Upper Newport Bay is home to many native California species, which provide food andshelter for native animals. Victims of habitat loss, several of the Bay plants are protected by theEndangered Species Act.
Our Wetlands, Our World20
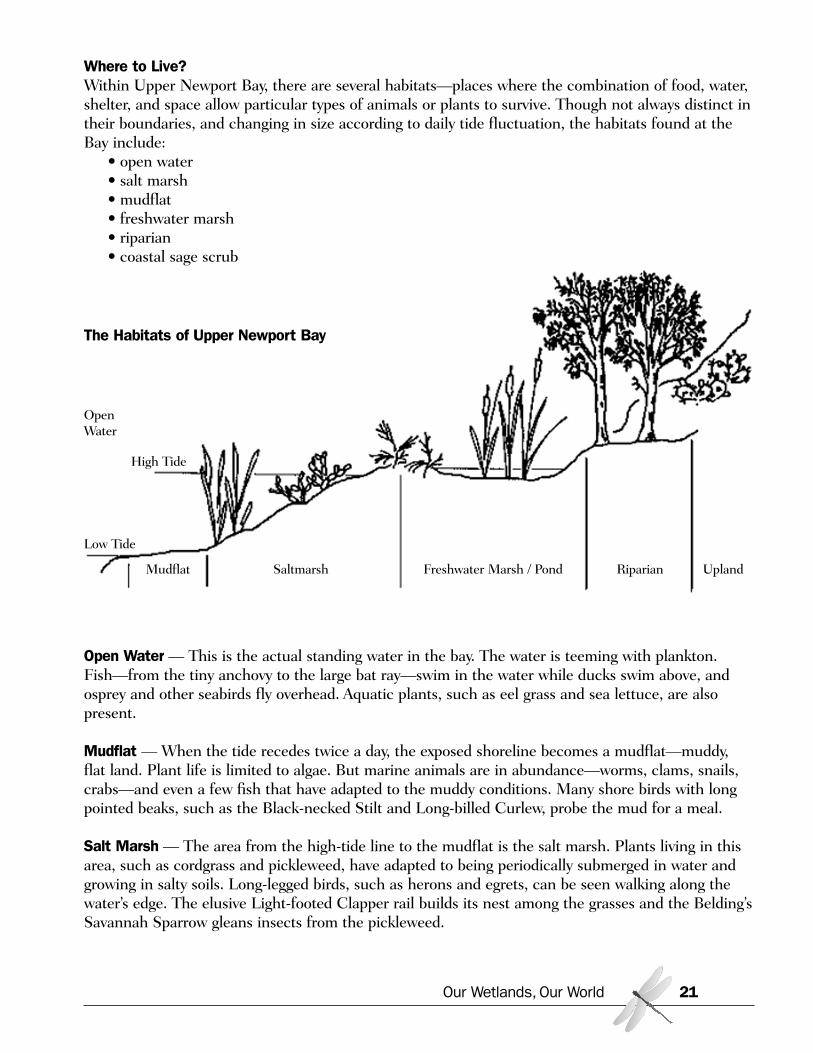
Where to Live?Within Upper Newport Bay, there are several habitats—places where the combination of food, water,shelter, and space allow particular types of animals or plants to survive. Though not always distinct intheir boundaries, and changing in size according to daily tide fluctuation, the habitats found at theBay include:
• open water• salt marsh• mudflat• freshwater marsh• riparian• coastal sage scrub
Open Water — This is the actual standing water in the bay. The water is teeming with plankton.Fish—from the tiny anchovy to the large bat ray—swim in the water while ducks swim above, andosprey and other seabirds fly overhead. Aquatic plants, such as eel grass and sea lettuce, are alsopresent.
Mudflat — When the tide recedes twice a day, the exposed shoreline becomes a mudflat—muddy,flat land. Plant life is limited to algae. But marine animals are in abundance—worms, clams, snails,crabs—and even a few fish that have adapted to the muddy conditions. Many shore birds with longpointed beaks, such as the Black-necked Stilt and Long-billed Curlew, probe the mud for a meal.
Salt Marsh — The area from the high-tide line to the mudflat is the salt marsh. Plants living in thisarea, such as cordgrass and pickleweed, have adapted to being periodically submerged in water andgrowing in salty soils. Long-legged birds, such as herons and egrets, can be seen walking along thewater’s edge. The elusive Light-footed Clapper rail builds its nest among the grasses and the Belding’sSavannah Sparrow gleans insects from the pickleweed.
Our Wetlands, Our World 21
The Habitats of Upper Newport Bay
OpenWater
High Tide
Low Tide
Mudflat Saltmarsh Freshwater Marsh / Pond Riparian Upland
Freshwater Marsh — Water-loving plants such as cattails and sedges grow in this area, near freshwa-ter inputs such as storm drains or creeks. Introduced species, such as the African clawed frog andmosquito fish, dominate these areas now. Dragonflies, ducks, and egrets are among the species thatenjoy the marsh.
Riparian — The land alongside the creeks and other fresh water drainage points is called riparian.(Riparian is derived from the Latin word "ripa" meaning "streambank.") The plants here, commonlywillows and cottonwood trees, like moist soil. Songbirds can be seen and heard among the foliage.
Coastal Sage Scrub — The bluffs and undeveloped mesas around the Bay provide the upland habi-tat. The drier slopes are home to coastal sage scrub and drought-resistant succulents such as pricklypear cactus. Snakes, lizards, coyote, rabbits, squirrels, and other critters live and hunt here. Red-tailed Hawks and Turkey Vultures often soar on the currents of warm air that arise from the bluffs.
Our Wetlands, Our World22
Activity: Mapping Your Watershed
Summary: In this activity, students will become familiar with the geography of California as it relatesto Upper Newport Bay’s watershed by examining various types of maps. Students will travel aroundthe classroom in small groups, visiting different map “stations” and working together to answerquestions about each map.
Our Wetlands, Our World 23
California State Content Standards
SCIENCE
Biology/Life Sciences• Ecology 6b. Students know how to analyze
changes in an ecosystem resulting fromchanges in climate, human activity,introduction of nonnative species, or changes inpopulation size.
Earth Sciences• California Geology 9a. Students know the
resources of major economic importance inCalifornia and their relation to California’sgeology.
• California Geology 9c. Students know theimportance of water to society, the origins ofCalifornia’s fresh water, and the relationshipbetween supply and need.
Investigation & Experimentation• 1h. Students will read and interpret
topographic and geologic maps.
Objectives:Students will be able to:
• Read a variety of maps and present theinformation they gather from the maps
• Describe the geography of California andUpper Newport Bay
Materials:Some or all of the following maps:
✓ Local area road map✓ Newport Bay/San Diego Creek Watershed
Map (from “Watershed and Wetlands”background information)
✓ Orange County Wetlands map(http://www.ocwatersheds.com/watersheds/intro_wetlands.asp)
✓ Aerial maps of Newport Bay and SanDiego Creek Watershed(http://www.ocwatersheds.com/watersheds/intro_aerial.asp; 714-973-6694
✓ Note: San Diego Creek Watershed drainsinto Newport Bay Watershed)
✓ Nautical charts of Newport Bay Area(http://maptech.com)
✓ Topographical map of local area(http://mapping.usgs.govhttp://maptech.com)
✓ Orange County Green Map (www.ocfohbp.org; 949-399-3669)
HandoutMap Questions
Preparation:Make a copy of the questions for each map.Place maps around the classroom; tape theappropriate list of questions next to each map.Number each map station.
Time Required:Approximately 1 hour
Procedures:
1. Divide the class into equal groups according to the number of map stations you have andinstruct each group to stand by a station.
2. Explain that each group will have a few minutes at each station to use the map(s) to answerthe questions posted at that station. Instruct each group to record its answers.
3. Tell students to stay at their station until you signal them to go to the next station.
4. Judge the amount of time at each station according to the number of stations and students’abilities. Continue the activity until every group has visited every map station.
5. Have each group present one of the maps and discuss their findings. Compare their answerswith those of the rest of the class.
Alternative Procedure (generally for more advanced students):
1. Instead of placing questions next to each map, select questions from the Map Questionshandout and make your own list of questions for each student or group.
2. Explain that students are to answer each of the questions by finding the appropriate map.Review the types of maps displayed.
3. Allow students time to circulate around the room and write answers to their questions.
4. When all students have finished, read through all the map questions, having students sharetheir answers.
Follow-up:
Use the following questions to ask students what they learned from the maps.
1. What area constitutes the watershed for Upper Newport Bay?(The entire San Diego Creek Watershed drains into Upper Newport Bay.)
2. Is the watershed primarily “green” areas or “developed” areas? What makes up each of theseareas?(The watershed is primarily developed, including houses, businesses, schools, streets andhighways.)
Our Wetlands, Our World24
3. How does water flowing through the watershed create problems in the Bay?(All of the water that runs off into San Diego Creek, and all of the pollutants that the runoffcollects, end up in Upper Newport Bay. That includes all kinds of litter and debris, fertilizer,animal wastes, pesticides, oil, detergent, paint, and anything else that finds its way into the runoff.These pollutants disturb the food web and ecosystem balance in the Bay.)
4. What can you do to help improve the Upper Newport Bay watershed?(For example:Keep cars well maintained and free of leaks.Recycle used motor oil.Do not pour chemicals on the ground or down storm drains.Properly dispose of trash in garbage cans.Pick up pet waste.Don’t dispose of leaves or grass clippings in the storm drain; try composting yard waste.Landscape yards with native, drought-tolerant plants that do not require fertilizer .Prevent runoff by not over-watering.Avoid allowing even clean water to run off into gutters.Try “natural” [non-toxic] pest control.)
Extensions:
1. Demonstrate the sources of pollution in a watershed using an interactive, tabletop model. See http://www.ocwatersheds.com/PublicEducation/EnviroScape.asp or call the Orange CountyStormwater Program at (714) 567-363 to learn more about the EnviroScape Model.
2. Have students view a PowerPoint slide show on Watershed Science athttp://www.ocwatersheds.com/PublicEducation/pe_other_materials.asp.
Adapted from “Mapping Your Watershed” from Save San FranciscoBay Watershed Education Program, www.saveSFbay.org
Our Wetlands, Our World 25
Map Questions
Local Area Road Map
1. Locate your school on the map. What is the shortest route to Upper Newport Bay on roads andhighways?
2. How many miles would you need to travel along roads from your school to the Bay? How manymiles would it be if you could go straight “as the crow flies”?
3. Locate parks, wildlife refuges, and preserves on the map. Which ones have you visited? Aboutwhat percentage of the map contains these “green” areas? What percentage is “developed,” thatis, with houses, business, schools, streets, highways?
4. Locate the Orange County Airport on the map. Why do you think the airport is built on anhistoric wetland site? What effects do you think the airport has on the Bay?
Orange CountyTopographical Map
1. What do the contour lines on the map represent? Where are the highest and lowest points onthe map?
2. Locate the creeks and channels that flow into Upper Newport Bay.
3. What is the length of San Diego Creek?
4. A creek’s “watershed” is the area of land that sheds water to the creek. The watershed for acreek is defined by the ridge lines (highest points) that separate it from another creek’swatershed. What areas drain into San Diego Creek?
5. Can you find any roads on the map? How are these different from and similar to the creeks?
6. Where would pollutants running off your school parking lot flow?
Our Wetlands, Our World26
Newport Bay/San Diego Creek Watershed Map
1. What cities’ runoff drains into Newport Bay?
2. Is your home located in the Newport Bay/San Diego Creek watershed?
3. Where might pollutants that drain into the Bay, including sediment, originate?
Nautical Chart of Newport Bay
1. Maps can be made to highlight different features. For example, some maps highlight landformswhile others highlight roads and highways. What does this map highlight? Why would youneed a Nautical Chart?
2. What do the small black numbers on this map represent? Why do you think these numbersmight change? How frequently, and in what locations, do you think these numbers vary?
3. Locate the Pacific Coast Highway Bridge, Shellmaker Island, Big Canyon, the Salt Dike, LeastTern Island, and the San Diego Creek drainage point.
4. What is the average depth of Upper Newport Bay? Where are the maximum and minimumdepths?
5. How do you think the depth has changed over time?
6. How might global climate change affect the habitat distribution at Upper Newport Bay?
Orange County Wetlands Map
1. How many wetlands are there in Orange County?
2. What percentage of wetlands are estuaries—where the land meets the ocean?
3. Which wetlands are largest?
4. Which estuaries drain the largest watershed?
Our Wetlands, Our World 27
Aerial Map of Newport Bay Areaor
Detailed Road Maps
1. Where does fresh water enter Newport Bay?
2. What might be picked up by water on its way into the Bay? What problems might this runoffcause?
3. Where does salt water come into Newport Bay?
4. What kind of water would you expect to find in the Bay?
Orange County Green Map
1. Find the following waterways:Aliso CreekCarbon CreekCoyote CreekSan Gabriel RiverSan Juan CreekSanta Ana RiverSantiago CreekTrabuco Creek
Where does each creek or river eventually lead?
2. Locate the San Diego Creek Watershed. Where is San Diego Creek (Peter’s Canyon Corridor)in the watershed?
3. Are the areas that drain into San Diego Creek mainly “green” or “developed”?
4. Where does San Diego Creek flow into?
5. If a watershed is compared to a bathtub, what part of the bathtub is the Bay?
Our Wetlands, Our World28
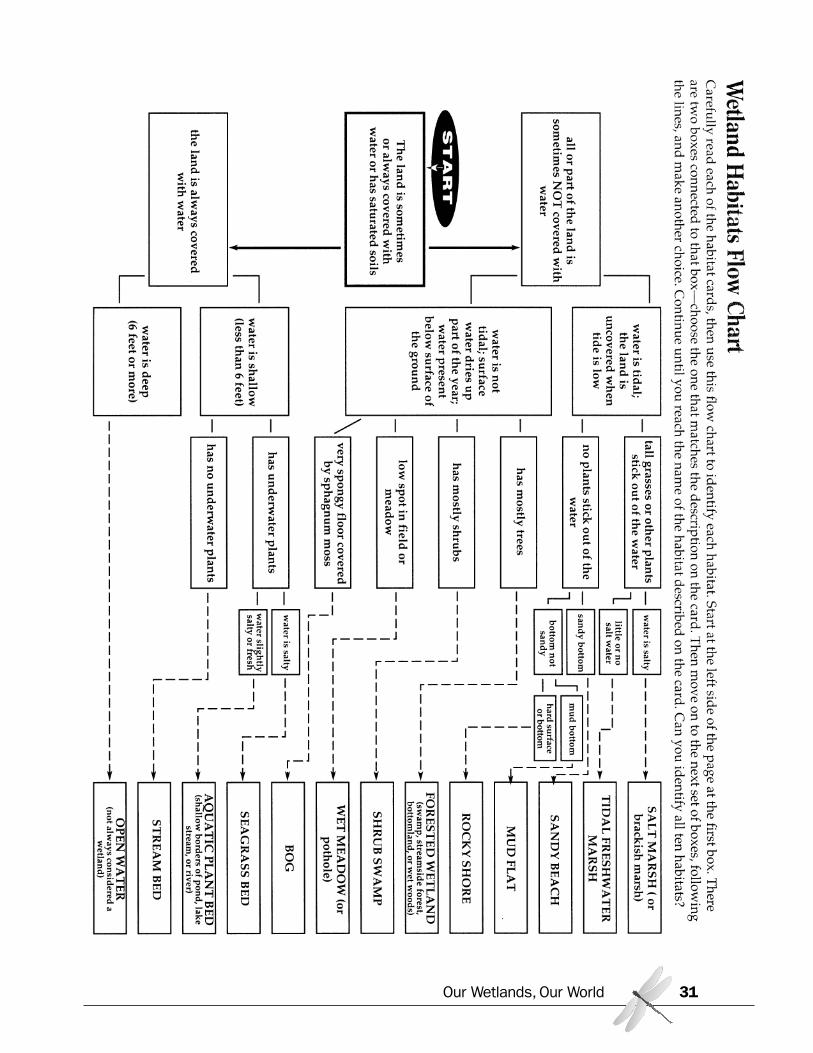
Activity: Wetland HabitatsSummary: This activity uses a flow chart and habitat cards to introduce and classify common types ofwetlands.
Our Wetlands, Our World 29
California State Content Standards
SCIENCE
Biology/Life Sciences• Ecology 6e. Students know a vital part of an
ecosystem is the stability of its producers anddecomposers.
Investigation & Experimentation• 1g. Students will recognize the usefulness and
limitations of models and theories as scientificrepresentations of reality.
Objectives:Students will:
• Classify wetlands based on theircharacteristics.
Materials:• UNB Inhabitant Cards (Appendix A)• Map of the United States• (optional) Pictures of wetlands
(from books, magazines, internet)• Handouts
- Wetland Habitats Flow Chart- Habitat Cards
Preparation:• If necessary, review the use of a flow chart,
practicing as a group with one of thepictures.
• Make a copy of the Wetland Habitats FlowChart for each student or group
Option 1 – see Procedures• Make a copy the Habitat Cards for each
group.
Option 2 – see Procedures• Make one copy of the Habitat Cards, cut
them apart, and place them at variousstations around the room, perhaps withphotos of that wetland habitat.
Time Required:• Approximately 45 minutes
Procedures:
1. Discuss wetlands with students. Explain that wetlands are classified, in part, by the type ofwater, frequency and degree of inundation, and types of vegetation most prevalent there.
2. Tell students that they are going to use a flow chart to identify ten wetland types by thehabitats they provide.
3. Divide the class into groups and distribute to each group a copy of the Wetland Habitats FlowChart.
4. Proceed with Option 1 or 2 below:
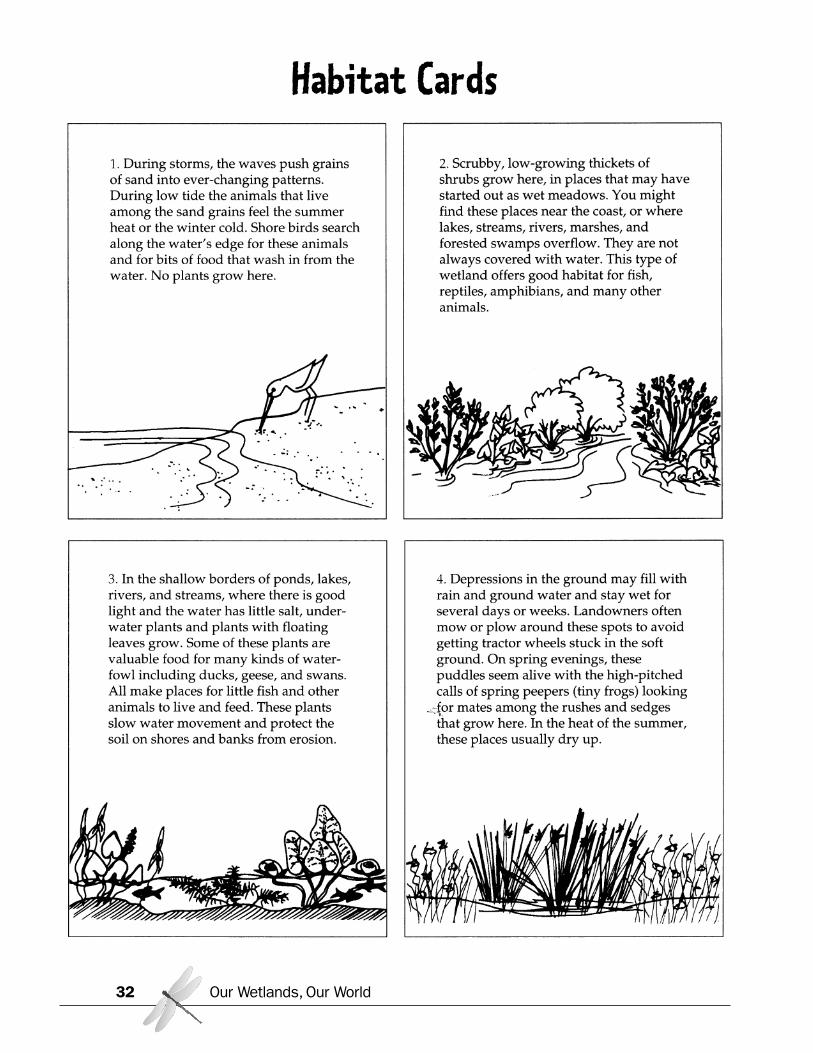
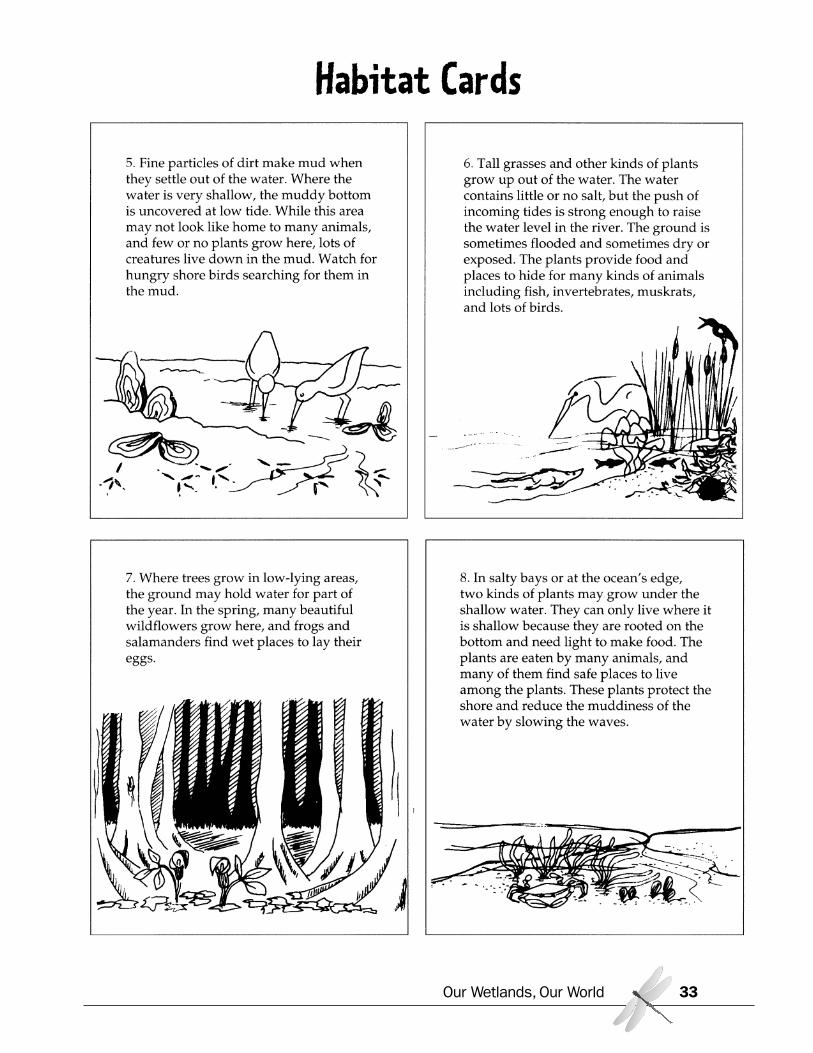
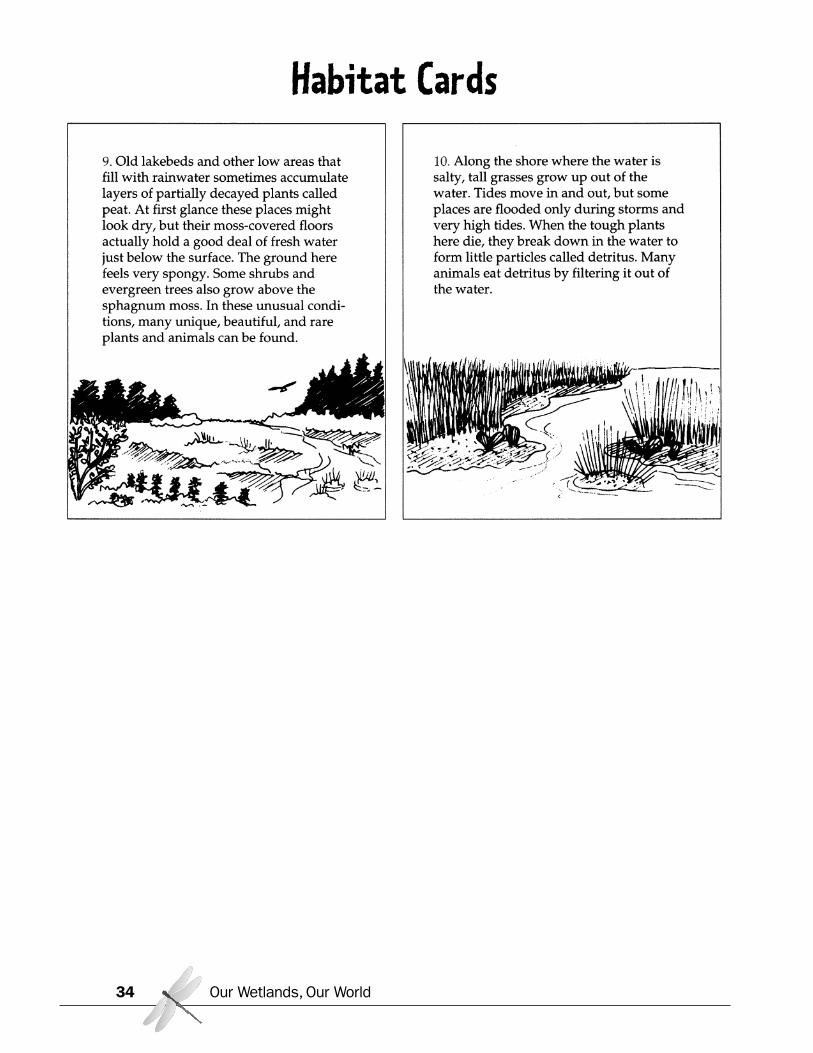
Option 1Distribute a copy of the Habitat Cards to each group. Have each group use the Wetland HabitatsFlow Chart to identify the ten wetlands described on the Habitat Cards.
Option 2Tell students that around the room are descriptions and pictures of various types of wetlands.Explain that they are to move from station to station and use the flow chart to identify each typeof wetland.
Follow-up:
1. Have students share their answers, discussing anydiscrepancies.(See Answer Key.)
2. Have students use the UNB Inhabitant Cards and theflow chart to classify the wetlands in Upper Newport Bay.
3. Using a map of the United States, have students discusswhere the different wetland types might appear.
4. From what they have read on the Habitat Cards, havestudent identify the value of wetlands.
Extensions:
Make a list of several organisms that live in the various habitats. Randomly assign organisms tostudent groups and have them determine the likely habitat for each organism and explain why.
Adapted from “Wetland Habitats” from WOW! The Wonders of Wetlands,co-published by International Project WET and Environmental Concern
Our Wetlands, Our World30
Answer Key:
1. sandy beach2. shrub swamp3. aquatic plant bed4. wet meadow5. mud flat6. tidal freshwater marsh7. forested wetland8. seagrass bed9. bog10. salt marsh
Our Wetlands, Our World 31
Our Wetlands, Our World32
Habitat Cards
Our Wetlands, Our World 33
Habitat Cards
Our Wetlands, Our World34
Habitat Cards
Activity: Explore a Wetland (Field Study)
Summary: Students explore a local wetland, learning about different characteristics of the wetlandand the plants and wildlife it supports.
Our Wetlands, Our World 35
California State Content Standards
SCIENCE
Biology/Life Sciences• Ecology 6a. Students know biodiversity is the sum
total of different kinds of organisms and is affectedby alterations of habitats.
• Ecology 6b. Students know how to analyze changesin an ecosystem resulting from changes in climate,human activity, introduction of nonnative species, orchanges in population size.
• Ecology 6e. Students know a vital part of anecosystem is the stability of its producers anddecomposers.
Investigation & Experimentation• 1c. Students will identify possible reasons for
inconsistent results, such as sources of error oruncontrolled conditions.
• 1j. Students will recognize the issues of statisticalvariability and the need for controlled tests.
• 1k. Students will recognize the cumulative nature ofscientific evidence.
Objectives:Students will be able to:
• Identify the habitats of the wetland• Describe different organisms that live in the
wetland
Materials:• Field guides• Clipboards• Collecting dishes and jars • Hand lenses and/or magnifying glasses • Binoculars• Digital camera• UNB Inhabitant Cards (Appendix A)• Handout
- Field Notes Worksheet
Preparations:• Make a copy for each student or group of
the Field Notes Worksheet.• Contact the wetland you plan to visit (see
list in Appendix D) to obtain permission foraccess and to find out what specific areasstudents can focus on, what equipment andmaterials may be borrowed, and whatactivities are available at the site.
• Use this field trip to the wetland to preparefor or in conjunction with other activities.See:
- Wetland Soil- Measuring Decomposition- Water Quality- Space for Species- Seed Experiments- Plant Monitoring- Stewardship
Time Required:• The amount of time required will vary
between a minimum of one hour to a fullday, in addition to follow-up after the fieldtrip.
Procedures:
BEFORE THE FIELD TRIP:
1. Inform students that they will be taking a field trip to a wetland and that they will be acting asfield biologists for the trip, exploring the ecology of the wetland.
2. Review each of the items on the Field Notes Worksheet.
3. Encourage students to study the UNB Inhabitant Cards.
AT THE WETLAND SITE:
1. Remind students that wetlands are fragile and rare ecosystems that are easily damaged. Reviewsome behavior rules:
• Do not feed the wildlife.• Do not disturb any form of plant or animal life.• Do not collect specimens unless you have permission.• Do not walk on the mudflats.
2. Determine how you want students to explore and make observations: all groups in all areas oreach group in a separate area; on foot or in canoes/kayaks or both.
3. Tell students that field guides and the UNB Inhabitant Cards, along with collecting jars andhand lenses, are available to help them identify organisms they find.
4. Remind students to spend time quietly observing—listening, watching, smelling, touching.
5. Hand out a copy of the Field Notes Worksheet to each student or group.
AFTER THE FIELD TRIP:
Have students compare and discuss their Field Notes Worksheets. Use the following questions tohelp generate discussions.
a. Did the weather and the tide have any effect on what you saw at the wetland?b. How might the wetland change with the seasons?c. Did you discover any plants or animals that you didn’t expect to find? Any that you
haven’t been able to identify?d. Which habitat had the highest biodiversity among animal and plant species?e. What food chains exist among the organisms you saw in the wetland?f. How do humans use and affect the wetland?g. How would the information you gathered be useful to biologists?h. Were there differences among students’ Field Notes Worksheets? Why?
Our Wetlands, Our World36

Extensions:
1. Have students create a virtual wetlands PowerPoint lesson for lower grades.2. Tour other wetlands and compare their ecology. (See Appendix D.)3. Visit the Peter and Mary Muth Interpretive Center. Call 949- 923-2290 for information.
Our Wetlands, Our World 37

Field Notes Worksheet
Wetland Name/Location: ________________________________________________________________
Date:______________________________________ Time: ______________________________________
General Observations: Spend 5 minutes quietly observing. What do you see, smell, hear, and feel?
WeatherTemperature: ____________________________ Cloud Cover: _______________________________
Wind: __________________________________ Other: _____________________________________
TideHigh or low: ____________________________ Coming in or going out: _____________________
GeologyWhat signs of tectonic shifting can you identify?
Habitats, Animals, Plants
mammals
birds
fish
invertebrates
reptiles
Our Wetlands, Our World38
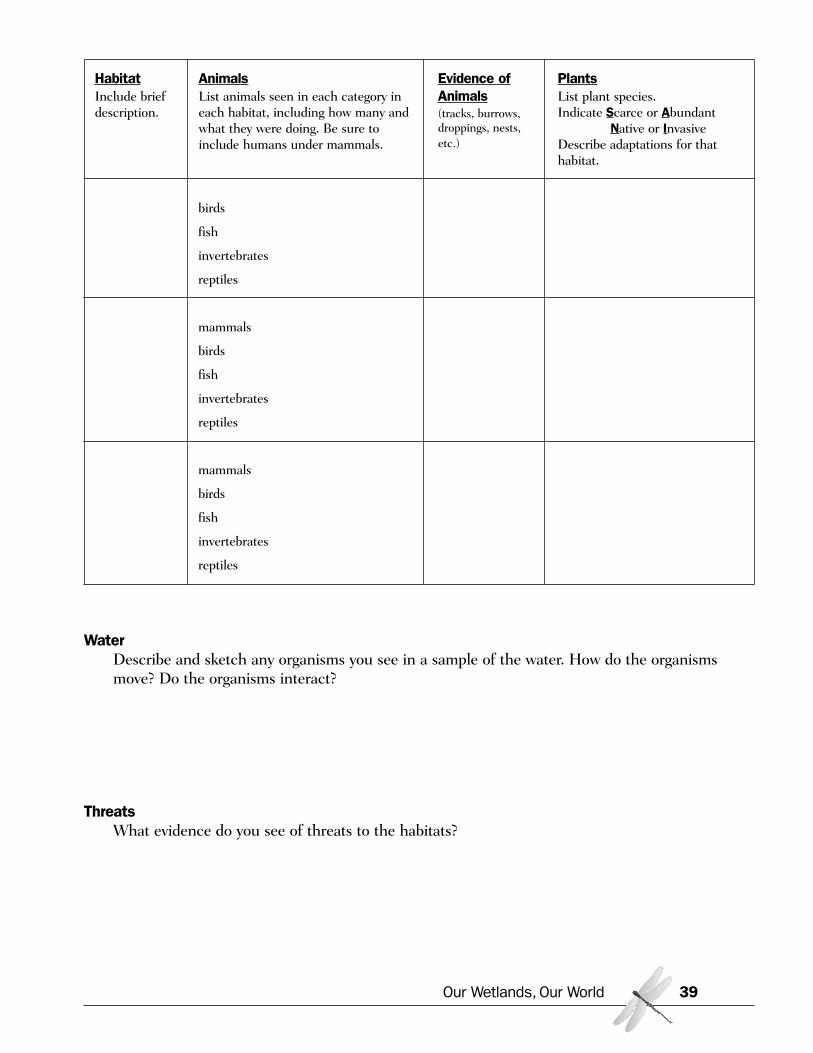
HabitatInclude briefdescription.
AnimalsList animals seen in each category ineach habitat, including how many andwhat they were doing. Be sure toinclude humans under mammals.
Evidence ofAnimals(tracks, burrows,droppings, nests,etc.)
PlantsList plant species.Indicate Scarce or Abundant
Native or InvasiveDescribe adaptations for thathabitat.
birds
fish
invertebrates
reptiles
mammals
birds
fish
invertebrates
reptiles
mammals
birds
fish
invertebrates
reptiles
WaterDescribe and sketch any organisms you see in a sample of the water. How do the organismsmove? Do the organisms interact?
ThreatsWhat evidence do you see of threats to the habitats?
Our Wetlands, Our World 39
HabitatInclude briefdescription.
AnimalsList animals seen in each category ineach habitat, including how many andwhat they were doing. Be sure toinclude humans under mammals.
Evidence ofAnimals(tracks, burrows,droppings, nests,etc.)
PlantsList plant species.Indicate Scarce or Abundant
Native or InvasiveDescribe adaptations for thathabitat.
Activity: Wetland Webs Summary: Students learn about the inhabitants in wetlands and construct a typical wetland food webto discover the interconnectedness of the ecosystem.
California State Content Standards
SCIENCE
Biology/Life Sciences• Ecology 6e. Students know a vital part of an
ecosystem is the stability of its producers anddecomposers.
• Ecology 6f. Students know at each link in a food websome energy is stored in newly made structures butmuch energy is dissipated into the environment asheat. This dissipation may be represented in anenergy pyramid.
ENGLISH-LANGUAGE ARTS
Grades 9-10
Reading Comprehension• Comprehension and Analysis of Grade-Level-
Appropriate Text 2.3. Generate relevant questionsabout readings on issues that can be researched.
• Comprehension and Analysis of Grade-Level-Appropriate Text 2.5. Extend ideas presented inprimary or secondary sources through originalanalysis, evaluation, and elaboration.
Speaking Applications • Deliver Expository Presentations 2.2
b. Convey information and ideas from primary andsecondary sources accurately and coherently.e. Anticipate and address the listener’s potentialmisunderstandings, biases, and expectations.
• Apply Appropriate Interviewing Techniques 2.3a. Prepare and ask relevant questions.b. Make notes of responses.d. Respond correctly and effectively to questions.e. Demonstrate knowledge of the subject ororganization.f. Compile and report responses.
• Deliver Descriptive Presentations 2.6a. Establish clearly the speaker’s point of view on thesubject of the presentation.b. Establish clearly the speaker’s relationship withthat subject (e.g., dispassionate observation, personalinvolvement).c. Use effective, factual descriptions of appearance,concrete images, shifting perspectives and vantagepoints, and sensory details.
Grades 11-12
Listening and Speaking Strategies• Organization and Delivery of Oral Communication
1.8. Use effective and interesting language,including:a. Informal expressions for effectb. Standard American English for clarityc. Technical language for specificity.
Objectives:Students will be able to:
• Identify wetland inhabitants• Identify the various roles within in a food
web• Explain the concept of interconnectedness
Materials:• UNB Inhabitant Cards (Appendix A)• Notepads and pencils• Chart paper or butcher paper
Preparations:• Have several sheets of chart paper or lengths
of butcher paper available for each largegroup of students.
Time Required:• Approximately 50 minutes for each of the
two activities; additional time for research
Our Wetlands, Our World40
Procedures:
Conduct the following activities with the UNB Inhabitant Cards to help students learn about theplants and animals that inhabit Upper Newport Bay and discover the relation of one species toanother in a wetland food web.
Each One Teach One:
1. Hand out one or more of the UNB Inhabitant Cards to each student. Give students time notonly to learn the information on their cards but also to conduct outside research to learnother facts about the inhabitants on their cards.
2. Explain to students that they are to interview other students about the inhabitants of UpperNewport Bay and that, in turn, they will be interviewed about their species. Ask students tokeep a list of the inhabitants within each of the following categories: plants, birds, landanimals, fish, other marine animals. Have students determine how they might categorize thespecies in each list, for example by habitat or by trophic level.
Build a Food Pyramid, Food Chains, Food Webs:
1. Discuss the various roles within a food web:
- primary producers (autotrophs—which covert energy from the sun)- primary consumers (herbivores—which consume primary producers)- secondary consumers (carnivores—which consume primary consumers and other secondary
consumers)- detritivores (micro- and macroorganisms that decompose dead plant and animal matter)
Point out that organisms within a community interact with each other and with the abiotic,non-living, environment—that is, sun, soil, water, inorganic nutrients, etc. Explain that thepassage of energy from one organism to another takes place along a particular food chain—that is, a sequence of organisms related to one another as prey and predator. Ask students togive examples of simple food chains. For example:
Shore birds eat clams.Clams eat plankton.
Zooplankton eat phytoplankton.Phytoplankton are dependent upon nutrients in the water
and the sun for energy to make their own food throughphotosynthesis.
2. Tell students that in most ecosystems, food chains are linked together in complex food webs,with many interconnections. Explain that webs may involve more than 100 different species,with predators taking more than one type of prey, and each type of prey being exploited byseveral different species of predator. Emphasize that the connection between species in a foodweb can make or break the function of the ecosystem.
3. Hand out one or more UNB Inhabitant Cards to each student. Have students use theinformation on the cards to build a “food pyramid” from the primary producers up. Askstudents how the number of species in the bottom levels compares to the number of speciesat the top level. Ask why they think the pyramid is shaped this way. Point out that a large bodyoften requires a more abundant food source and a larger habitat.
Our Wetlands, Our World 41
4. Next, divide the students into large groups and have them lay out their cards on the chart orbutcher paper to create food chains. Ask them to write the name of their species on the paperand to draw arrows pointing to what is consumed.
5. Combine groups and have them compare their food chains and now create food websshowing how the chains are interconnected.
6. Demonstrate ecosystem stability by adding or removing food web connections.
Follow-up:
After the activities, ask students to share and explain their food webs. Ask the following questions togenerate a discussion:
1. How does the size of the organism generally relate to its position in the food web?
(In general, the larger the animal, the higher it is on the food web.)
2. Did you note any exceptions to this generalization?
3. What other connections, besides predator-prey, hold an ecosystem in balance? (Mutualism iscommon in nature, and species depend on one another for more than just a meal. Pollinatorsand animals provide dispersal mechanisms; microbes and roots provide soil aeration; plantsprovide protection, shelter, and nesting refuge; etc.)
4. What could happen to the food web if a hazard, such as an oil spill, occurred?
(Food webs are fragile, and the removal of even one link in the chain may ultimately result inthe collapse of the entire food web. For example, an oil spill may block out the sun and disruptphotosynthesis in phytoplankton, decreasing the amount of plankton in the water. Clams thencannot find enough to eat and their numbers will decrease. And ultimately, the shore birds thateat the clams will have to find some other food item, move to another habitat, perhaps forgoreproduction that year, or maybe even starve.)
5. Why would the disruption and possible destruction of a marine food web matter to us?
Extensions:
1. Make more UNB Inhabitant Cards. The UNB Inhabitant Cards represent only a small portionof the organisms in Upper Newport Bay. There are, for example, more than 200 species ofbirds. Have students research other species at the Bay within each category and make cards tomatch the existing UNB Inhabitant Cards. (See the list of Species Common to Upper NewportBay in Appendix B.)
2. Build a food chain for each of the foods in a meal, e.g. a student’s lunch. Think about theenergy transfer required to produce one pound of beef versus one pound of rice, or a spinylobster versus a bluefin tuna.
Our Wetlands, Our World42
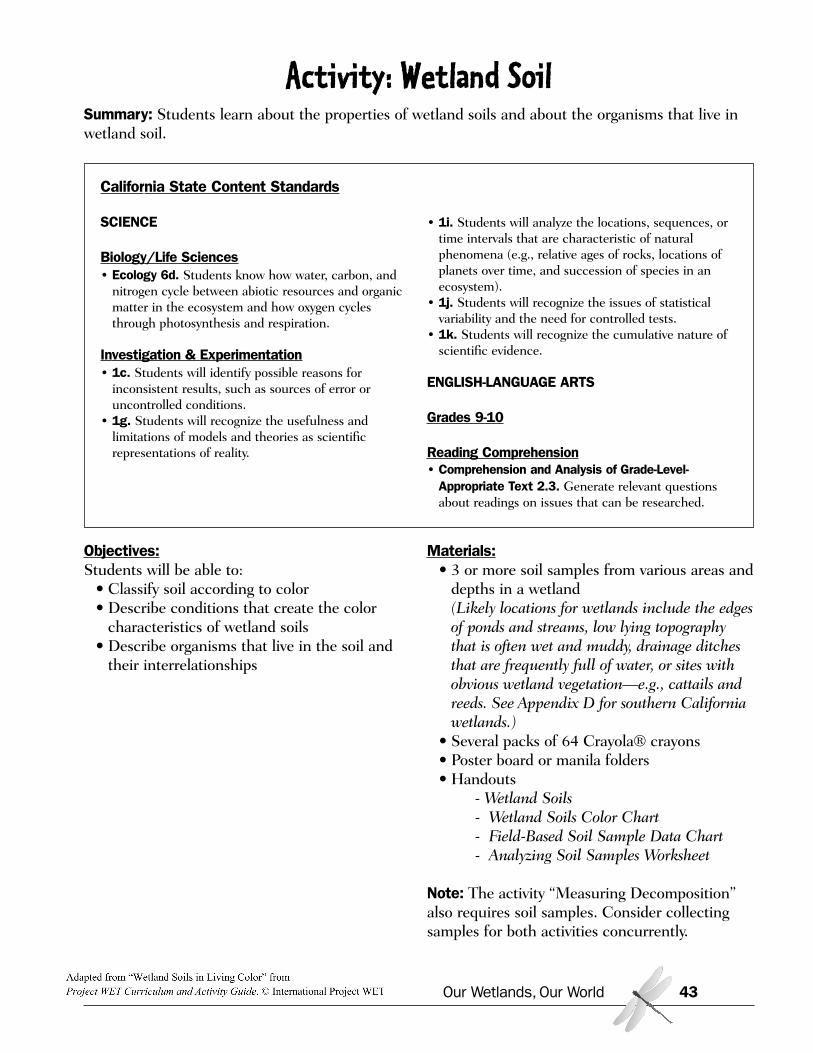
Activity: Wetland SoilSummary: Students learn about the properties of wetland soils and about the organisms that live inwetland soil.
California State Content Standards
SCIENCE
Biology/Life Sciences• Ecology 6d. Students know how water, carbon, and
nitrogen cycle between abiotic resources and organicmatter in the ecosystem and how oxygen cyclesthrough photosynthesis and respiration.
Investigation & Experimentation• 1c. Students will identify possible reasons for
inconsistent results, such as sources of error oruncontrolled conditions.
• 1g. Students will recognize the usefulness andlimitations of models and theories as scientificrepresentations of reality.
• 1i. Students will analyze the locations, sequences, ortime intervals that are characteristic of naturalphenomena (e.g., relative ages of rocks, locations ofplanets over time, and succession of species in anecosystem).
• 1j. Students will recognize the issues of statisticalvariability and the need for controlled tests.
• 1k. Students will recognize the cumulative nature ofscientific evidence.
ENGLISH-LANGUAGE ARTS
Grades 9-10
Reading Comprehension• Comprehension and Analysis of Grade-Level-
Appropriate Text 2.3. Generate relevant questionsabout readings on issues that can be researched.
Objectives:Students will be able to:
• Classify soil according to color • Describe conditions that create the color
characteristics of wetland soils• Describe organisms that live in the soil and
their interrelationships
Materials:• 3 or more soil samples from various areas and
depths in a wetland(Likely locations for wetlands include the edgesof ponds and streams, low lying topographythat is often wet and muddy, drainage ditchesthat are frequently full of water, or sites withobvious wetland vegetation—e.g., cattails andreeds. See Appendix D for southern Californiawetlands.)
• Several packs of 64 Crayola® crayons• Poster board or manila folders• Handouts
- Wetland Soils- Wetland Soils Color Chart- Field-Based Soil Sample Data Chart- Analyzing Soil Samples Worksheet
Note: The activity “Measuring Decomposition”also requires soil samples. Consider collectingsamples for both activities concurrently.
Our Wetlands, Our World 43
Procedures:
1. Read the following description of a land area to students and ask if they would classify it as awetland.
“The land contains some long-leafed plants that look like grasses. Most of the year theland is dry; however, almost every spring the area is flooded.”
2. Tell students that wetlands have three characteristics that make them unique habitats: theremust be water present for a sufficient period of time to establish hydrophytic plant speciesand to influence the development of hydric soils. Point out that because of regular flooding inthe example above, one would assume that the plants are hydrophytes; however, a soil testcould confirm whether the area deserves wetland classification.
3. Tell students that soils are often used to determine whether or not an area is a wetland. Showstudents three soil samples of varying colors. Ask students how they would classify them ordistinguish one from the other.
Our Wetlands, Our World44
Preparations:• Collect soil samples from 3 different
locations at the wetland—mudflat, water’sedge, and upland area. (Note: A soil probewill extract a deep narrow sample withminimal disruption of the landscape, but itdoes not work well in dry soil. A gardentrowel may be used, but obtaining acontinuous sample will be difficult.)
- Call the site to verify that you can takesoil samples and to inquire about whattools and assistance are available forcollection.
- At each location, remove a scoop of soilabout the size of a Ping Pong ball attwo-inch intervals to a depth of eighteeninches.
- Place each sample in a specimen jar orzip-top bag and label with the locationand depth of the sample.
- Refill the hole.
Alternatively, have students collect and labelsamples on a field trip to the wetland.
• Make a copy for each student of the WetlandSoils handout.
• If taking students on a field trip to thewetland, make a copy for each group of theSoil Sample Data Chart.
• Make a copy for each group of the WetlandSoils Color Chart.
• Make copies of the Analyzing Soil SamplesWorksheet for each group (one copy for eachsoil sample to be analyzed).
• Set up three stations in the room, each with amicroscope and the soil samples from eacharea.
Time Required:• Approximately 60 minutes for lesson plus
time to collect soil samples or take optionalfield trip.
4. Tell students that color provides important clues used by scientists when classifying soils.Explain that wetland scientists use a complex set of color charts—a Munsell soil color book—to classify soils into different types based on color, lightness and darkness, and the degree ofmixture of colors. Tell students that because wetland habitats are rare, there are lawsprotecting wetlands from development or other disturbances; therefore, soil classification is animportant tool used by scientists to determine whether a site can be defined as a “wetland,”deserving stricter regulations and protected status.
5. Hand out a copy of Wetland Soils to each student. Read and discuss the information about howorganic debris, moisture content, and mineral composition influence the color of soils. Be surethat students understand these are general guidelines and that there is variance in classifyingsoils. Ask students to predict whether deeper soils are gleyed or mottled? Ask how they mightdetect whether the location of a sample was historically used as a sediment-dump site?
6. Divide students into groups. Distribute copies of the Wetland Soil Color Chart to each groupand review the directions at the top of the page. Explain that this is a simplified version of achart used by wetland scientists. Have students complete the Wetland Soils Color Chart intheir groups.
7. If taking a field trip to the wetland, have student groups collect the soil samples and comparethem against the Wetland Soils Color Chart. Tell students to break open the samples to checkfor the truest color. While in the field, have students complete the Field Based Soil SampleData Chart. Have students share and combine their data to create and label a vertical diagramof the soil colors.
8. In the classroom, point out to students the various stations set up with soil samples. Hand outcopies of the Analyzing Soil Samples Worksheet to each student group. Explain that at eachstation, they are to fill out a worksheet for each soil sample.
9. Have groups move from station to station until all groups have visited each station.
Follow-up:
Discuss the results of students’ worksheets. Point out the following:
• In addition to color, a soil’s texture and degree of wetness, along with other qualities likesmell and the presence or absence of living matter (biotic or abiotic), provide clues to itsclassification.
• A rotten-egg smell indicates the presence of hydrogen sulfide, a product of anaerobicbacteria.
• Various layers of soil from the same hole may exhibit striking differences in color, texture,and smell, caused by the presence of water, the parent soil material, aerobic or anaerobicconditions, and so on. Vertical soil samples (cores) may provide insight to historicaldisturbance and climatic conditions.
Our Wetlands, Our World 45
Extensions:
Create a soil log to compare changes over time:
1. Use crayons to color a strip diagram that matches the horizons of the soil sample at eachdepth. Record the date the soil sample was collected and where it was collected. Has therebeen a change in the depth of the soil horizons since the previous year? Is the soil more or lesshydric?
2. Using soil test kits, record the pH and nutrients present in the soil. Determine the acidity of each two-inch section of the soil sample. Soils with high organicmatter tend to be more acidic, but fewer plants are adapted to acidic soil conditions. Does thepH change from the surface to the bottom section?Determine the nutrients available to wetland plants by testing for nitrogen, phosphorous, andpotassium across depth and location. What might be the source of excess nutrients?
3. Our understanding of wetlands is evolving based on knowledge gained from data over time.Compare soil sample data from previous years at the same location to determine if changeshave occurred.
Adapted from “Wetland Soils in Living Color” from Project WET Curriculum and Activity Guide,
© International Project WET
Our Wetlands, Our World46
Wetland Soils
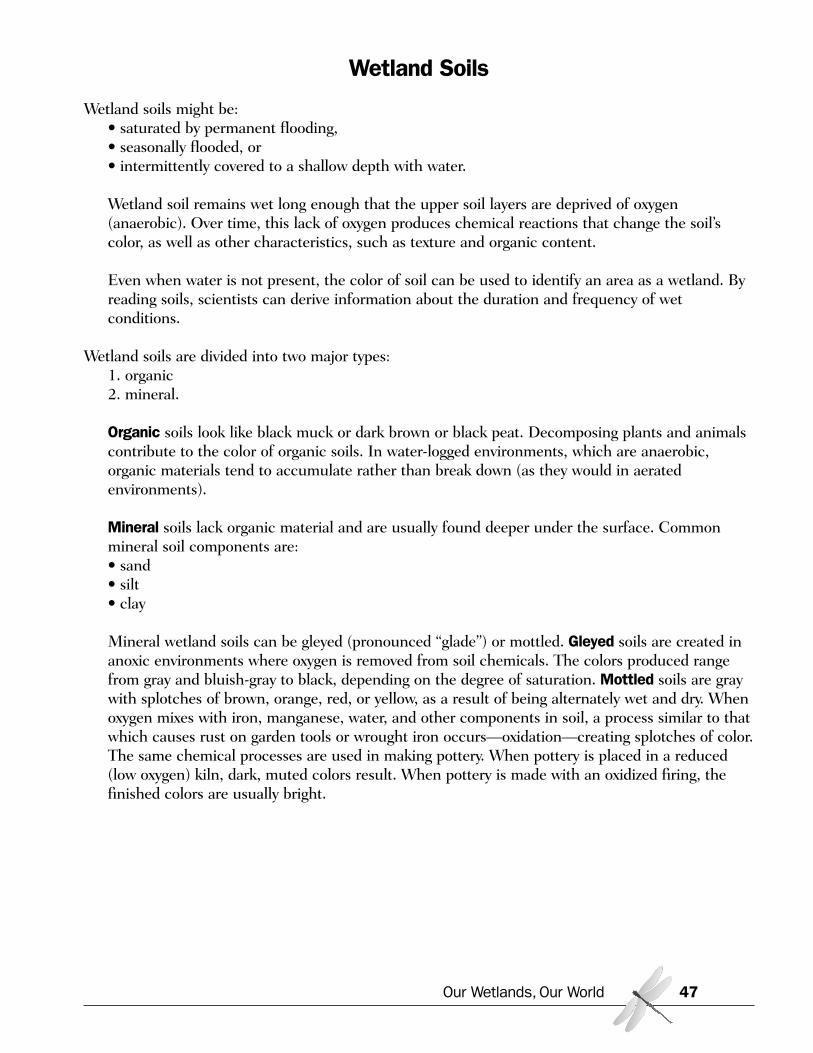
Wetland soils might be:• saturated by permanent flooding,• seasonally flooded, or • intermittently covered to a shallow depth with water.
Wetland soil remains wet long enough that the upper soil layers are deprived of oxygen(anaerobic). Over time, this lack of oxygen produces chemical reactions that change the soil’scolor, as well as other characteristics, such as texture and organic content.
Even when water is not present, the color of soil can be used to identify an area as a wetland. Byreading soils, scientists can derive information about the duration and frequency of wetconditions.
Wetland soils are divided into two major types: 1. organic 2. mineral.
Organic soils look like black muck or dark brown or black peat. Decomposing plants and animalscontribute to the color of organic soils. In water-logged environments, which are anaerobic,organic materials tend to accumulate rather than break down (as they would in aeratedenvironments).
Mineral soils lack organic material and are usually found deeper under the surface. Commonmineral soil components are:• sand• silt• clay
Mineral wetland soils can be gleyed (pronounced “glade”) or mottled. Gleyed soils are created inanoxic environments where oxygen is removed from soil chemicals. The colors produced rangefrom gray and bluish-gray to black, depending on the degree of saturation. Mottled soils are graywith splotches of brown, orange, red, or yellow, as a result of being alternately wet and dry. Whenoxygen mixes with iron, manganese, water, and other components in soil, a process similar to thatwhich causes rust on garden tools or wrought iron occurs—oxidation—creating splotches of color.The same chemical processes are used in making pottery. When pottery is placed in a reduced(low oxygen) kiln, dark, muted colors result. When pottery is made with an oxidized firing, thefinished colors are usually bright.
Our Wetlands, Our World 47
Wetland Soils Color Chart
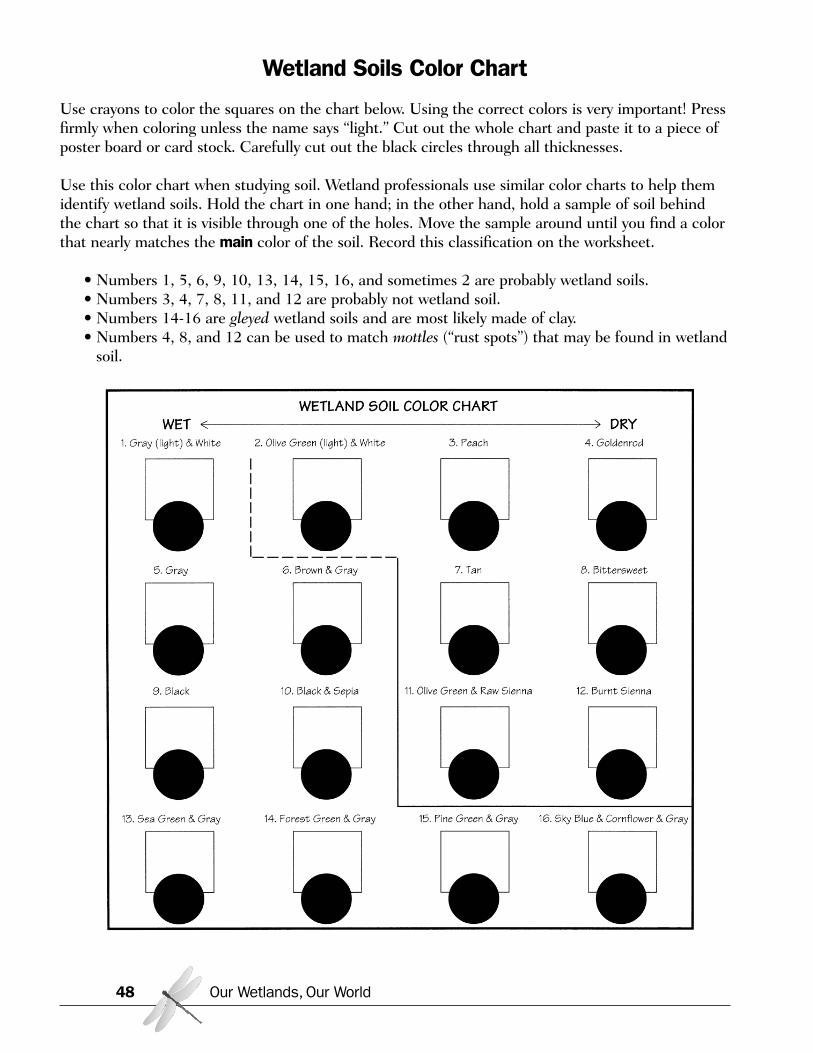
Use crayons to color the squares on the chart below. Using the correct colors is very important! Pressfirmly when coloring unless the name says “light.” Cut out the whole chart and paste it to a piece ofposter board or card stock. Carefully cut out the black circles through all thicknesses.
Use this color chart when studying soil. Wetland professionals use similar color charts to help themidentify wetland soils. Hold the chart in one hand; in the other hand, hold a sample of soil behindthe chart so that it is visible through one of the holes. Move the sample around until you find a colorthat nearly matches the main color of the soil. Record this classification on the worksheet.
• Numbers 1, 5, 6, 9, 10, 13, 14, 15, 16, and sometimes 2 are probably wetland soils.• Numbers 3, 4, 7, 8, 11, and 12 are probably not wetland soil. • Numbers 14-16 are gleyed wetland soils and are most likely made of clay. • Numbers 4, 8, and 12 can be used to match mottles (“rust spots”) that may be found in wetland
soil.
Our Wetlands, Our World48

Our Wetlands, Our World 49
Field Based Soil Sample Data Chart
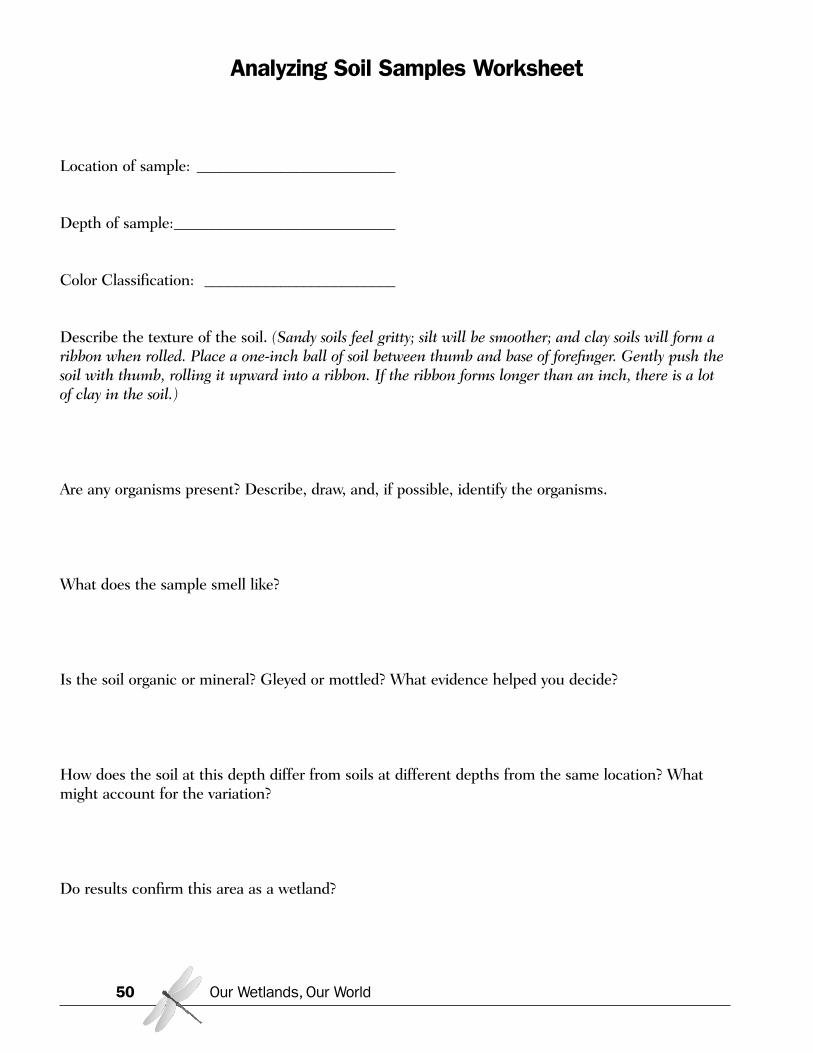
Analyzing Soil Samples Worksheet
Location of sample: __________________________
Depth of sample:_____________________________
Color Classification: _________________________
Describe the texture of the soil. (Sandy soils feel gritty; silt will be smoother; and clay soils will form aribbon when rolled. Place a one-inch ball of soil between thumb and base of forefinger. Gently push thesoil with thumb, rolling it upward into a ribbon. If the ribbon forms longer than an inch, there is a lotof clay in the soil.)
Are any organisms present? Describe, draw, and, if possible, identify the organisms.
What does the sample smell like?
Is the soil organic or mineral? Gleyed or mottled? What evidence helped you decide?
How does the soil at this depth differ from soils at different depths from the same location? Whatmight account for the variation?
Do results confirm this area as a wetland?
Our Wetlands, Our World50
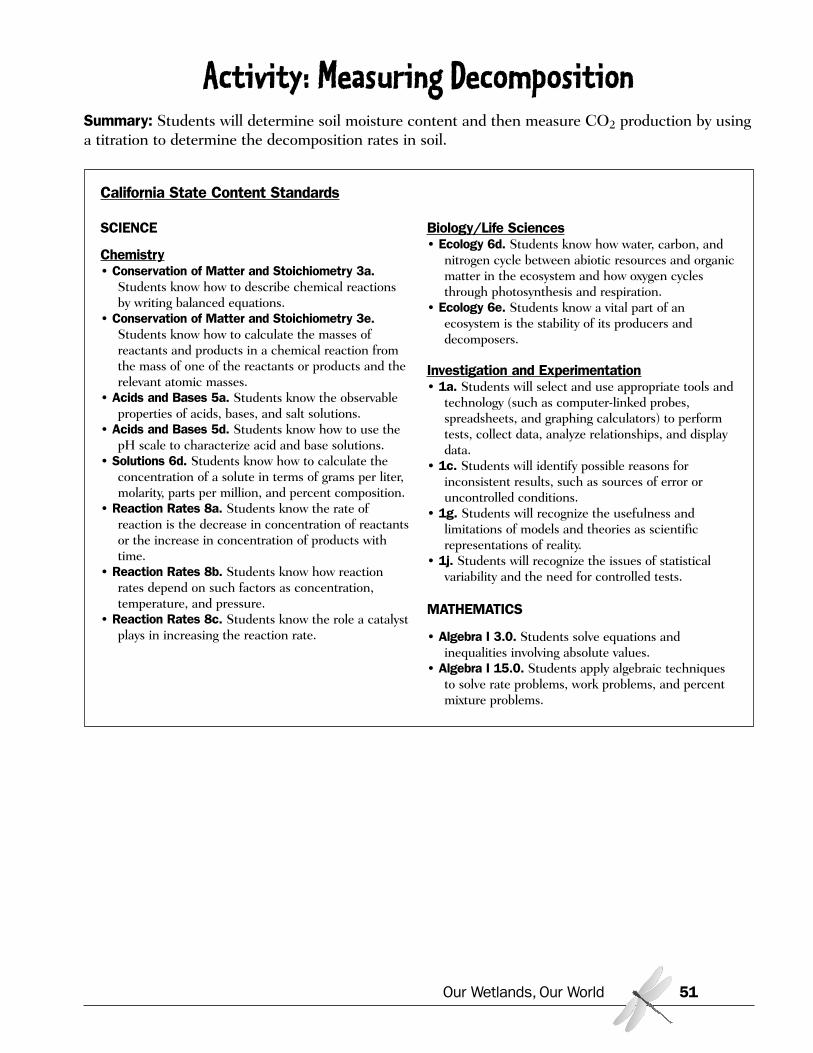
Activity: Measuring DecompositionSummary: Students will determine soil moisture content and then measure CO2 production by usinga titration to determine the decomposition rates in soil.
Our Wetlands, Our World 51
California State Content Standards
SCIENCE
Chemistry• Conservation of Matter and Stoichiometry 3a.
Students know how to describe chemical reactionsby writing balanced equations.
• Conservation of Matter and Stoichiometry 3e.Students know how to calculate the masses ofreactants and products in a chemical reaction fromthe mass of one of the reactants or products and therelevant atomic masses.
• Acids and Bases 5a. Students know the observableproperties of acids, bases, and salt solutions.
• Acids and Bases 5d. Students know how to use thepH scale to characterize acid and base solutions.
• Solutions 6d. Students know how to calculate theconcentration of a solute in terms of grams per liter,molarity, parts per million, and percent composition.
• Reaction Rates 8a. Students know the rate ofreaction is the decrease in concentration of reactantsor the increase in concentration of products withtime.
• Reaction Rates 8b. Students know how reactionrates depend on such factors as concentration,temperature, and pressure.
• Reaction Rates 8c. Students know the role a catalystplays in increasing the reaction rate.
Biology/Life Sciences• Ecology 6d. Students know how water, carbon, and
nitrogen cycle between abiotic resources and organicmatter in the ecosystem and how oxygen cyclesthrough photosynthesis and respiration.
• Ecology 6e. Students know a vital part of anecosystem is the stability of its producers anddecomposers.
Investigation and Experimentation• 1a. Students will select and use appropriate tools and
technology (such as computer-linked probes,spreadsheets, and graphing calculators) to performtests, collect data, analyze relationships, and displaydata.
• 1c. Students will identify possible reasons forinconsistent results, such as sources of error oruncontrolled conditions.
• 1g. Students will recognize the usefulness andlimitations of models and theories as scientificrepresentations of reality.
• 1j. Students will recognize the issues of statisticalvariability and the need for controlled tests.
MATHEMATICS
• Algebra I 3.0. Students solve equations andinequalities involving absolute values.
• Algebra I 15.0. Students apply algebraic techniquesto solve rate problems, work problems, and percentmixture problems.
Our Wetlands, Our World52
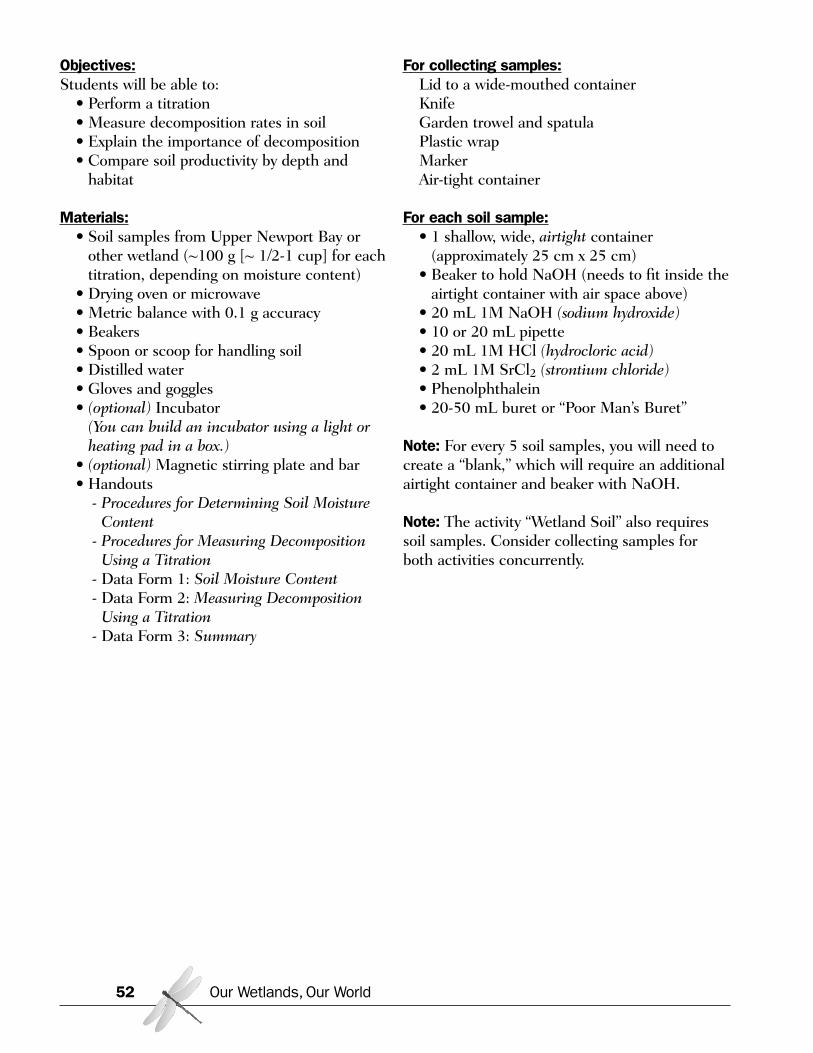
Objectives:Students will be able to:
• Perform a titration• Measure decomposition rates in soil• Explain the importance of decomposition • Compare soil productivity by depth and
habitat
Materials:• Soil samples from Upper Newport Bay or
other wetland (~100 g [~ 1/2-1 cup] for eachtitration, depending on moisture content)
• Drying oven or microwave• Metric balance with 0.1 g accuracy• Beakers• Spoon or scoop for handling soil• Distilled water• Gloves and goggles• (optional) Incubator
(You can build an incubator using a light orheating pad in a box.)
• (optional) Magnetic stirring plate and bar• Handouts
- Procedures for Determining Soil MoistureContent
- Procedures for Measuring DecompositionUsing a Titration
- Data Form 1: Soil Moisture Content- Data Form 2: Measuring Decomposition
Using a Titration- Data Form 3: Summary
For collecting samples:Lid to a wide-mouthed containerKnife Garden trowel and spatula Plastic wrapMarkerAir-tight container
For each soil sample:• 1 shallow, wide, airtight container
(approximately 25 cm x 25 cm)• Beaker to hold NaOH (needs to fit inside the
airtight container with air space above)• 20 mL 1M NaOH (sodium hydroxide)• 10 or 20 mL pipette• 20 mL 1M HCl (hydrocloric acid)• 2 mL 1M SrCl2 (strontium chloride)• Phenolphthalein• 20-50 mL buret or “Poor Man’s Buret”
Note: For every 5 soil samples, you will need tocreate a “blank,” which will require an additionalairtight container and beaker with NaOH.
Note: The activity “Wetland Soil” also requiressoil samples. Consider collecting samples forboth activities concurrently.
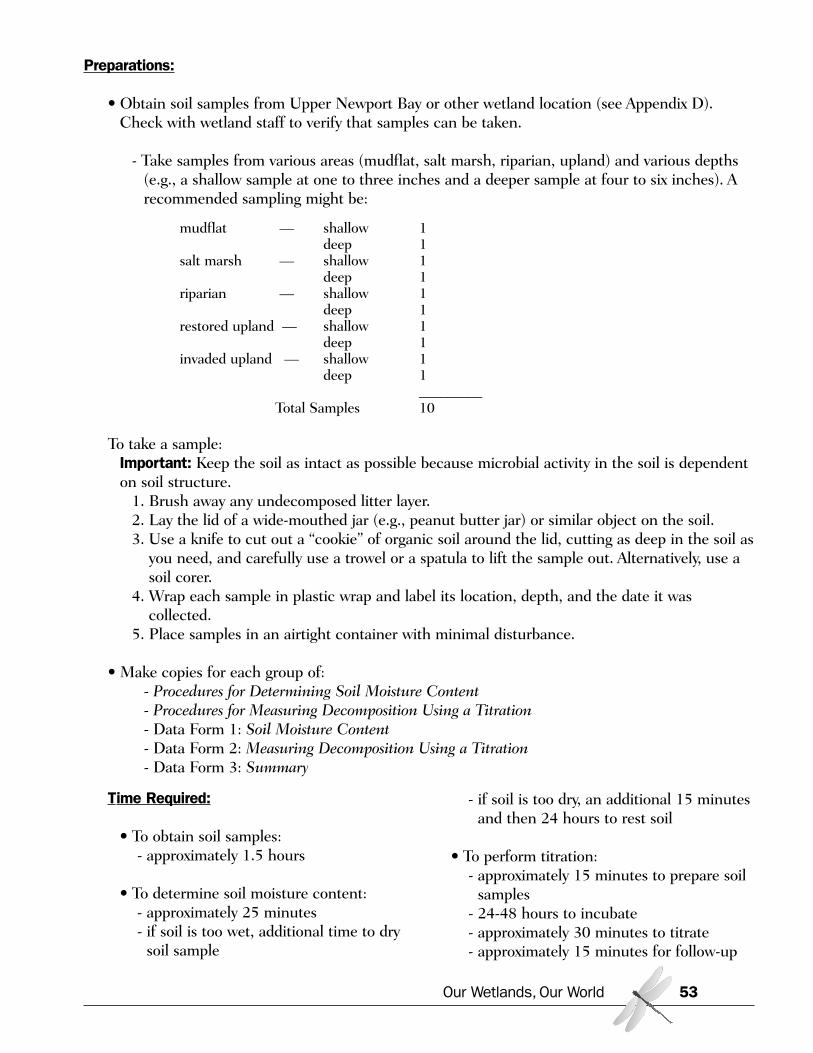
Preparations:
• Obtain soil samples from Upper Newport Bay or other wetland location (see Appendix D).Check with wetland staff to verify that samples can be taken.
- Take samples from various areas (mudflat, salt marsh, riparian, upland) and various depths(e.g., a shallow sample at one to three inches and a deeper sample at four to six inches). Arecommended sampling might be:
mudflat — shallow 1deep 1
salt marsh — shallow 1deep 1
riparian — shallow 1deep 1
restored upland — shallow 1deep 1
invaded upland — shallow 1deep 1
_________Total Samples 10
To take a sample:Important: Keep the soil as intact as possible because microbial activity in the soil is dependenton soil structure.
1. Brush away any undecomposed litter layer. 2. Lay the lid of a wide-mouthed jar (e.g., peanut butter jar) or similar object on the soil. 3. Use a knife to cut out a “cookie” of organic soil around the lid, cutting as deep in the soil as
you need, and carefully use a trowel or a spatula to lift the sample out. Alternatively, use asoil corer.
4. Wrap each sample in plastic wrap and label its location, depth, and the date it wascollected.
5. Place samples in an airtight container with minimal disturbance.
• Make copies for each group of:- Procedures for Determining Soil Moisture Content- Procedures for Measuring Decomposition Using a Titration- Data Form 1: Soil Moisture Content- Data Form 2: Measuring Decomposition Using a Titration- Data Form 3: Summary
Our Wetlands, Our World 53
Time Required:
• To obtain soil samples:- approximately 1.5 hours
• To determine soil moisture content:- approximately 25 minutes - if soil is too wet, additional time to dry
soil sample
- if soil is too dry, an additional 15 minutesand then 24 hours to rest soil
• To perform titration:- approximately 15 minutes to prepare soil
samples- 24-48 hours to incubate- approximately 30 minutes to titrate- approximately 15 minutes for follow-up
Procedures:
1. Introduce the lesson to students by conveying the following information:
Soil consists of both inorganic and organic material. The inorganic material comes fromrocks that have broken down to smaller particles. The organic material comes from livingthings in the soil. For example, plants shed leaves and drop twigs onto the soil. Eventually,this litter layer decomposes and becomes part of the organic material in the soil. Whenplant roots die, they also become part of the organic material in the soil. Additionalorganic material is added when invertebrates that live in the soil, such as worms, die.Finally, many different organisms add organic matter to the soil in the form of feces andother waste products.
When microbes and invertebrates break down organic matter in soil, they produce CO2through the process of respiration. Thus, the rate at which CO2 is produced in soil is agood indicator of the rate of decomposition of organic matter in the soil.
2. Tell students that they are going to be testing soil samples from Upper Newport Bay (or otherlocation) to determine the rate of decomposition in the soil. Explain that they will measurethe CO2 produced by microbes and invertebrates in a microcosm—a small scale laboratorymodel of what occurs in nature.
3. Before students perform each procedure, have them hypothesize results.
Determine Soil Moisture Content
4. Explain that to measure decomposition in soils, they need to measure soil moisture contentbecause:
• it allows calculation of the dry weight of the sample, a number that is used in theformula for determining the rate of CO2 production;
• the moisture greatly affects the rate of activity of soil microbes.
5. Divide students into groups according to the number of soil samples and assign a sample toeach group. (For example, if you have collected 10 soil samples and have a class of 30, dividestudents into 10 groups of 3 students each.)
6. Hand out to each group a copy of Data Form 1: Soil Moisture Content and have each groupfill in the top of the form.
7. Hand out a copy of the Procedures for Determining Soil Moisture Content to each group. Havestudents follow the procedures and fill in their data forms as they work.
Our Wetlands, Our World54

Measure Decomposition Using a Titration
8. Tell students that they will be using the reaction of CO2 with sodium hydroxide (NaOH) tomeasure the amount of CO2 released from the soil. Explain that CO2 produced by themicrobes and invertebrates in soil reacts with NaOH as shown in the following equation:
2 NaOH + CO2 --> 2H+ + CO32- + 2 Na+ + O2-
9. Overview the titration procedure:
Begin with a known quantity of NaOH in a beaker placed in your soil microcosm—in thiscase, an airtight container. Because the CO2 respired by soil microbes reacts with NaOH toform carbonic acid (H2CO3), the beaker solution becomes more acidic over time, as it absorbsCO2.
Next, add strontium chloride (SrCl2) to the solution. SrCl2 reacts with CO32- to form an
insoluble precipitate. This removes all CO32- from solution and prevents the equation
equilibrium from moving back to the left.
Next add phenolphthalein to the solution. Phenolphthalein is pink in basic solutions and clearin solutions that are neutral. When you first add phenolphthalein to your solution, thepresence of basic NaOH will cause the solution to turn pink.
Then you will titrate—that is, add known quantities of acidic HCl into the solution. When thesolution develops a neutral pH, it will turn clear. By measuring how much acid must be addedto make the solution neutral, you can find out how much CO2 was absorbed throughmicrobial action during the incubation period. Solutions requiring less HCl indicate moreproductive soils. You will need to use “blanks” to account for background levels of CO2.
10. Hand out the Procedures for Measuring Decomposition Using a Titration to each group. Pointout there are three parts to this activity—preparing blanks to account for background levels ofCO2, preparing soil samples, and titrating. Explain that one blank needs to be prepared forevery five soil samples. If each group is doing fewer than five samples, determine whichgroups will prepare the blanks.
11. Hand out to each group Data Form 2: Measuring Decomposition Using a Titration. Havestudents follow the procedures for performing a titration and fill in their data forms as theywork.
Our Wetlands, Our World 55
Follow-up:
1. When students have finished the procedure, use Data Form 3: Summary to compare anddiscuss the results.
2. Use the following questions to discuss or have students write about their experiment.
• Describe the general results of the titration experiment. What did you learn about soilCO2 production rates?
• Were CO2 production levels higher or lower than you expected? Explain.
• If you had replicates for each soil type, what was the average for each soil type? Whatdoes the average tell you about differences between soil types?
• Did you see any variability among soil samples in the same soil type? What might besome reasons for the variability?
• Why is the measurement of soil decomposition rates useful or important?
Extensions:
1. Collaborate with another school that has performed this experiment to compare results.
2. Test your backyard soils and compare results.
Adapted from Invasion Ecology from NSTA Press.
Our Wetlands, Our World56
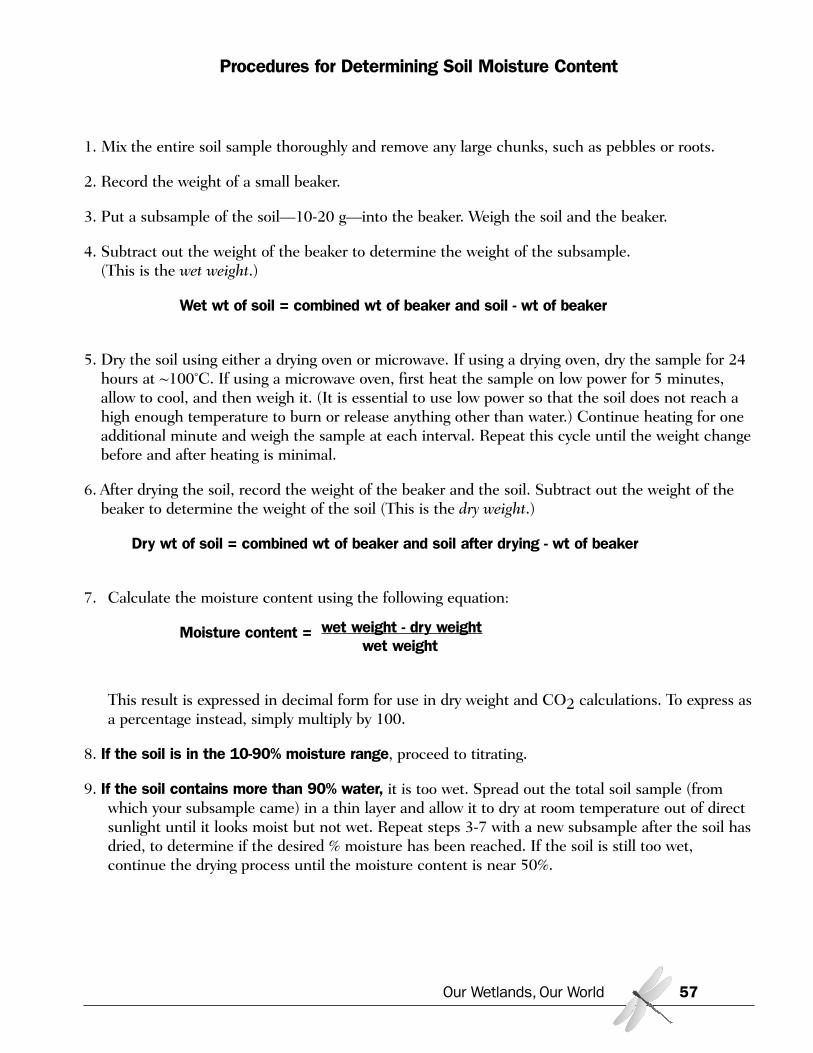
Procedures for Determining Soil Moisture Content
1. Mix the entire soil sample thoroughly and remove any large chunks, such as pebbles or roots.
2. Record the weight of a small beaker.
3. Put a subsample of the soil—10-20 g—into the beaker. Weigh the soil and the beaker.
4. Subtract out the weight of the beaker to determine the weight of the subsample. (This is the wet weight.)
Wet wt of soil = combined wt of beaker and soil - wt of beaker
5. Dry the soil using either a drying oven or microwave. If using a drying oven, dry the sample for 24hours at ~100˚C. If using a microwave oven, first heat the sample on low power for 5 minutes,allow to cool, and then weigh it. (It is essential to use low power so that the soil does not reach ahigh enough temperature to burn or release anything other than water.) Continue heating for oneadditional minute and weigh the sample at each interval. Repeat this cycle until the weight changebefore and after heating is minimal.
6. After drying the soil, record the weight of the beaker and the soil. Subtract out the weight of thebeaker to determine the weight of the soil (This is the dry weight.)
Dry wt of soil = combined wt of beaker and soil after drying - wt of beaker
7. Calculate the moisture content using the following equation:
Moisture content = wet weight - dry weightwet weight
This result is expressed in decimal form for use in dry weight and CO2 calculations. To express asa percentage instead, simply multiply by 100.
8. If the soil is in the 10-90% moisture range, proceed to titrating.
9. If the soil contains more than 90% water, it is too wet. Spread out the total soil sample (fromwhich your subsample came) in a thin layer and allow it to dry at room temperature out of directsunlight until it looks moist but not wet. Repeat steps 3-7 with a new subsample after the soil hasdried, to determine if the desired % moisture has been reached. If the soil is still too wet,continue the drying process until the moisture content is near 50%.
Our Wetlands, Our World 57
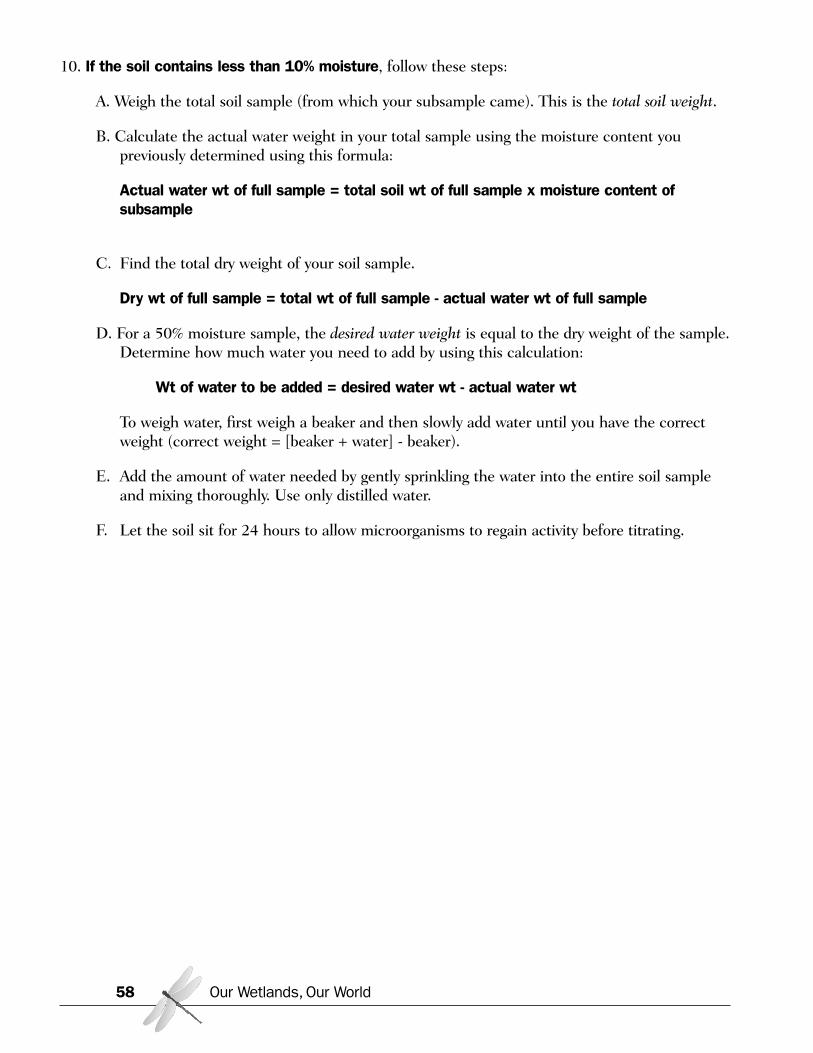
10. If the soil contains less than 10% moisture, follow these steps:
A. Weigh the total soil sample (from which your subsample came). This is the total soil weight.
B. Calculate the actual water weight in your total sample using the moisture content youpreviously determined using this formula:
Actual water wt of full sample = total soil wt of full sample x moisture content ofsubsample
C. Find the total dry weight of your soil sample.
Dry wt of full sample = total wt of full sample - actual water wt of full sample
D. For a 50% moisture sample, the desired water weight is equal to the dry weight of the sample.Determine how much water you need to add by using this calculation:
Wt of water to be added = desired water wt - actual water wt
To weigh water, first weigh a beaker and then slowly add water until you have the correctweight (correct weight = [beaker + water] - beaker).
E. Add the amount of water needed by gently sprinkling the water into the entire soil sampleand mixing thoroughly. Use only distilled water.
F. Let the soil sit for 24 hours to allow microorganisms to regain activity before titrating.
Our Wetlands, Our World58
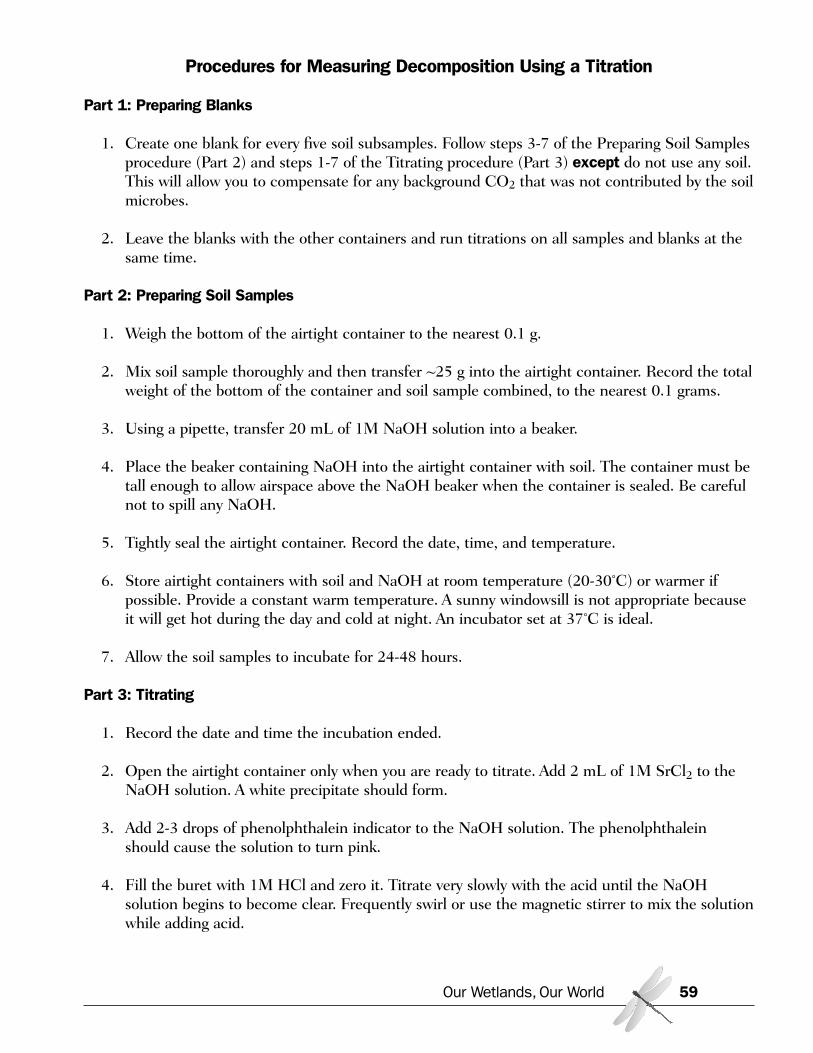
Procedures for Measuring Decomposition Using a Titration
Part 1: Preparing Blanks
1. Create one blank for every five soil subsamples. Follow steps 3-7 of the Preparing Soil Samplesprocedure (Part 2) and steps 1-7 of the Titrating procedure (Part 3) except do not use any soil.This will allow you to compensate for any background CO2 that was not contributed by the soilmicrobes.
2. Leave the blanks with the other containers and run titrations on all samples and blanks at thesame time.
Part 2: Preparing Soil Samples
1. Weigh the bottom of the airtight container to the nearest 0.1 g.
2. Mix soil sample thoroughly and then transfer ~25 g into the airtight container. Record the totalweight of the bottom of the container and soil sample combined, to the nearest 0.1 grams.
3. Using a pipette, transfer 20 mL of 1M NaOH solution into a beaker.
4. Place the beaker containing NaOH into the airtight container with soil. The container must betall enough to allow airspace above the NaOH beaker when the container is sealed. Be carefulnot to spill any NaOH.
5. Tightly seal the airtight container. Record the date, time, and temperature.
6. Store airtight containers with soil and NaOH at room temperature (20-30˚C) or warmer ifpossible. Provide a constant warm temperature. A sunny windowsill is not appropriate becauseit will get hot during the day and cold at night. An incubator set at 37˚C is ideal.
7. Allow the soil samples to incubate for 24-48 hours.
Part 3: Titrating
1. Record the date and time the incubation ended.
2. Open the airtight container only when you are ready to titrate. Add 2 mL of 1M SrCl2 to theNaOH solution. A white precipitate should form.
3. Add 2-3 drops of phenolphthalein indicator to the NaOH solution. The phenolphthaleinshould cause the solution to turn pink.
4. Fill the buret with 1M HCl and zero it. Titrate very slowly with the acid until the NaOHsolution begins to become clear. Frequently swirl or use the magnetic stirrer to mix the solutionwhile adding acid.
Our Wetlands, Our World 59

5. As the endpoint gets closer, add HCl one drop at a time, mixing thoroughly between drops.The endpoint has been reached when the solution turns from pink to clear. The greater theamount of CO2 that has been released from the soil and has reacted with the solution, the lessacid it will take to reach the titration endpoint.
6. Record the molarity of HCl used (should be 1M) and the volume of HCl required to reach theendpoint (clear solution).
7. Calculate your results using Data Form 2: Measuring Decomposition Using a Titration.
Our Wetlands, Our World60
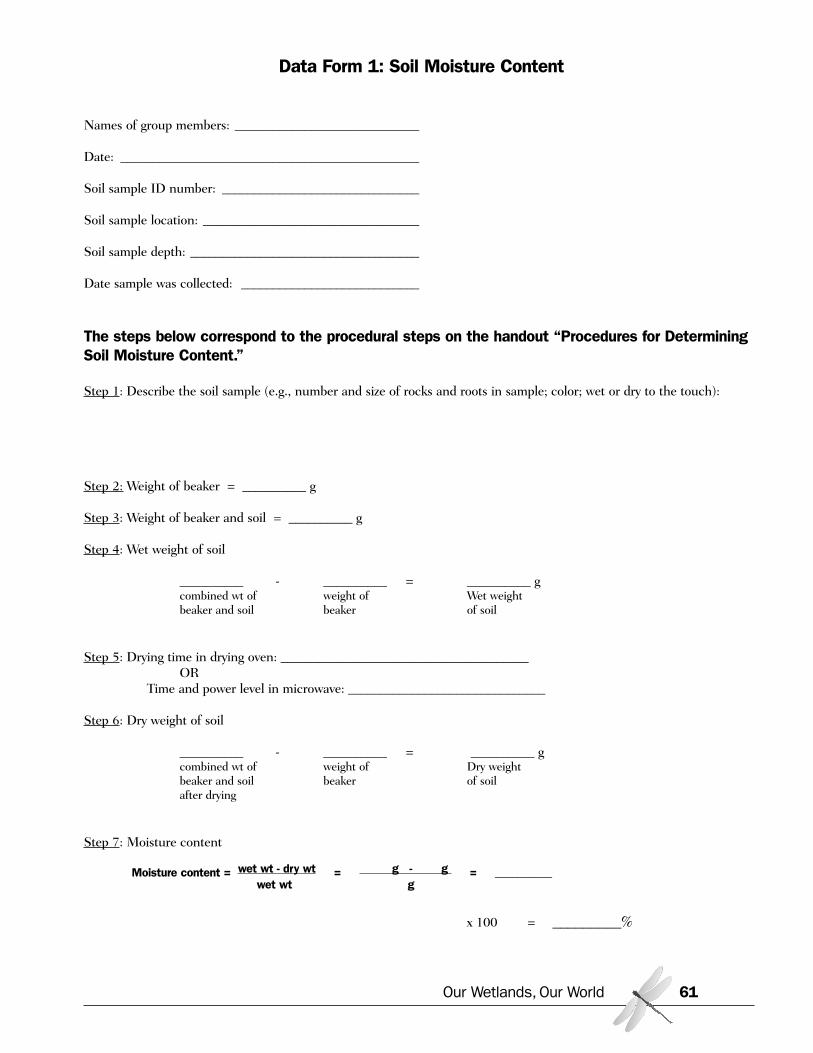
Data Form 1: Soil Moisture Content
Names of group members: _____________________________
Date: _______________________________________________
Soil sample ID number: _______________________________
Soil sample location: __________________________________
Soil sample depth: ____________________________________
Date sample was collected: ____________________________
The steps below correspond to the procedural steps on the handout “Procedures for DeterminingSoil Moisture Content.”
Step 1: Describe the soil sample (e.g., number and size of rocks and roots in sample; color; wet or dry to the touch):
Step 2: Weight of beaker = __________ g
Step 3: Weight of beaker and soil = __________ g
Step 4: Wet weight of soil
__________ - __________ = __________ gcombined wt of weight of Wet weightbeaker and soil beaker of soil
Step 5: Drying time in drying oven: _______________________________________OR
Time and power level in microwave: _______________________________
Step 6: Dry weight of soil
__________ - __________ = __________ gcombined wt of weight of Dry weightbeaker and soil beaker of soilafter drying
Step 7: Moisture content
Moisture content = wet wt - dry wt = g - g = __________wet wt g
x 100 = _________%
Our Wetlands, Our World 61

Step 8: If soil is in the 10-90% moisture range, proceed to titrating.
Step 9: If soil contains more than 90% water, continue drying process until moisture content is near 50%.
Step 10: If soil contains less than 10% moisture:
A. Total soil weight = __________ g
B. Actual water weight of full sample
__________ x __________ = __________ gtotal soil wt moisture content actual water wtof full sample of subsample of full sample
C. Dry weight of full sample
__________ - __________ = __________ gtotal soil wt actual water wt dry wtof full sample of full sample of full sample
D. Weight of water to be added
__________ - __________ = __________ gdesired water wt actual water wt wt of water
to be added
Our Wetlands, Our World62

Data Form 2: Measuring Decomposition Using Titration
Names of group members: ________________________
Date: __________________________________________
Soil sample ID number: __________________________
Soil sample location: _____________________________
Soil sample depth: _______________________________
Date sample was collected: _______________________
1. Calculate dry weight of soil.
Weight of container (without lid) = __________ g
Weight of container with soil = __________ g
Total Soil Weight = __________ g
Use Total Soil Weight and % soil moisture (Step 7 of Determining Soil Moisture Content) to calculatedry weight of soil. Remember to use the fraction for moisture content, not the percentage.
__________ g - __________ = __________ gtotal soil wt (moisture content dry weight
x total soil wt)
This answer will be in grams of dry soil. For use in the final equation, you need to convert it tokilograms:
__________ g x 0.001 kg/g = _________ kg dry soildry weight
2. Record the amount of time you used for the incubation.
Date and time incubation began: ___________________________________________________________
Date and time incubation ended (should be 24-48 hours): ______________________________________
Length of incubation period = __________ days(e.g., 27 hours = 1.125 days)
Our Wetlands, Our World 63
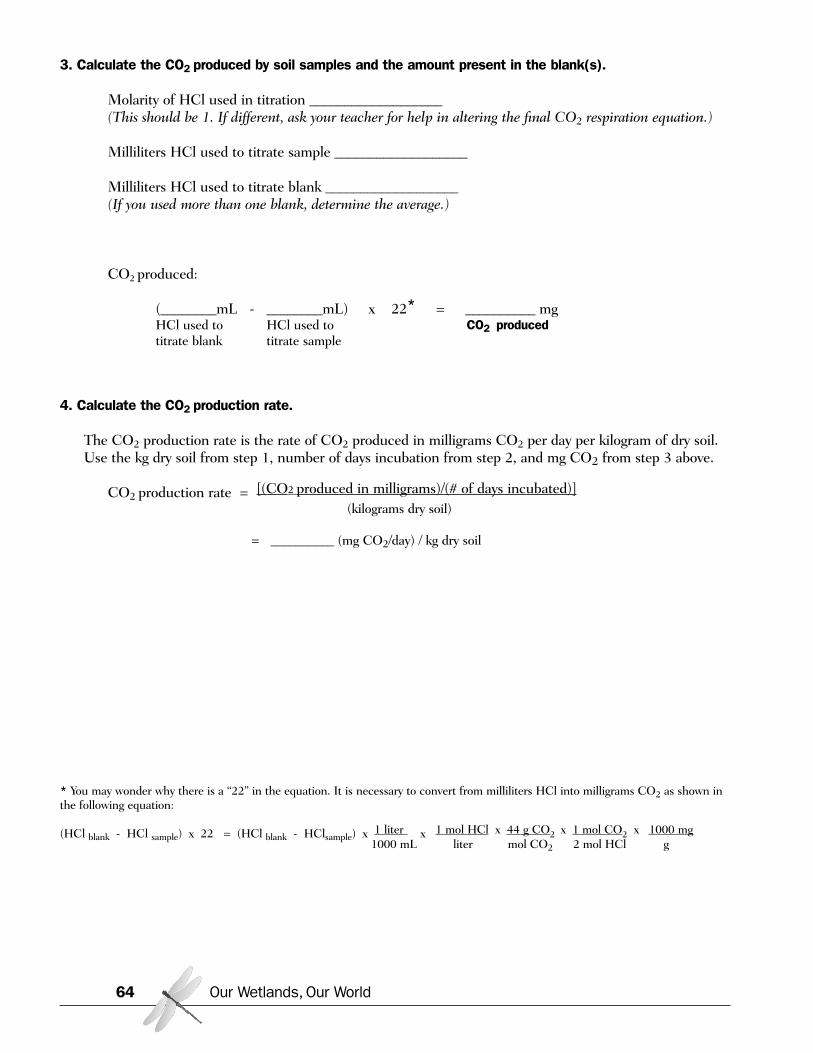
3. Calculate the CO2 produced by soil samples and the amount present in the blank(s).
Molarity of HCl used in titration ___________________(This should be 1. If different, ask your teacher for help in altering the final CO2 respiration equation.)
Milliliters HCl used to titrate sample ___________________
Milliliters HCl used to titrate blank ___________________(If you used more than one blank, determine the average.)
CO2 produced:
(________mL - ________mL) x 22* = __________ mgHCl used to HCl used to CO2 producedtitrate blank titrate sample
4. Calculate the CO2 production rate.
The CO2 production rate is the rate of CO2 produced in milligrams CO2 per day per kilogram of dry soil.Use the kg dry soil from step 1, number of days incubation from step 2, and mg CO2 from step 3 above.
CO2 production rate = [(CO2 produced in milligrams)/(# of days incubated)](kilograms dry soil)
= __________ (mg CO2/day) / kg dry soil
* You may wonder why there is a “22” in the equation. It is necessary to convert from milliliters HCl into milligrams CO2 as shown inthe following equation:
(HCl blank - HCl sample) x 22 = (HCl blank - HClsample) x 1 liter x 1 mol HCl x 44 g CO2 x 1 mol CO2 x 1000 mg1000 mL liter mol CO2 2 mol HCl g
Our Wetlands, Our World64
HUMAN IMPACTSAs more and more people populate the Earth and as more and more land is taken over by humans,many natural areas—including wetlands—are destroyed, degraded, or reduced in size. Human activi-ties have also brought water pollution and invasive species that threaten our remaining wetlands.
Loss of Wetlands
The United States has lost approximately one half of the wetland area that existed before Europeansettlers arrived. In California, the percentage lost is even higher, much higher—91 percent. In 2000,only 400,000 acres of the state’s original three to five million acres of wetland area remained. InOrange County, accelerated development destroys more than two square miles each year.
Where Have All the Wetlands Gone?Historically, the largest losses in wetland acreage around the world have been due to agriculture.Drained wetlands often produce fertile farmland, at least for a while. In the U.S., over 80 percent ofwetland loss can be attributed to agriculture.
Now, however, it is not agriculture but urban and suburban growth that is destroying wetlands.Coastal wetlands are the most endangered. People want to live and work near the water, and indus-tries prefer to be located near discharge points or cooling water sources supplied by the ocean. So,coastal property has high real estate value. Estuaries have been turned into harbors, amusementparks, nuclear power plants, university campuses, airports, and housing tracts. Even when wetlandsare preserved, chemical and biological pollution from nearby development can disrupt the delicatebalance of wetland ecosystems.
Why Does It Matter?When we lose wetlands, we lose the benefits that wetlands provide, such as filtering pollutants fromrunoff, supplying habitat for wildlife and providing recreational areas for people. The loss of wetlandsalso results in the loss of biodiversity.
Biodiversity refers to the variety of plant and animal species coexisting within an ecosystem.Ecologists know that the more kinds of organisms that can coexist in a system, the more stable orresilient that system is. The loss of wetlands has endangered many species of plants, birds, fish, andother wildlife that depend on associated habitats for food, shelter, and breeding. In southernCalifornia, endangered animals that depend on coastal sage scrub include: California Gnatcatcher,Sage Sparrow, little pocket mouse, San Diego horned lizard, and the orange-throated whiptail lizard.About one-half of the 188 animals that are federally designated as endangered or threatened are wet-land dependent.
Even if development does not completely destroy a wetland, it can break the wetland up into smallerchunks—a problem called fragmentation. By reducing the quantity or quality of habitat available,fragmentation lowers the diversity of plants and animals. Species that are very rare or that are foundonly in small populations are especially at risk when habitat portions are destroyed. And if another
Our Wetlands, Our World 65
species depends on the lost species for either food or shelter, it too might be lost, disrupting the foodweb and its connection to the entire ecosystem.
Many habitat fragments are surrounded by barriers—roads, parking lots, buildings—that preventspecies from moving between different areas to get what they might need to survive, such as food,shelter, and mates. When a species is isolated from others of its kind, it can become subject toinbreeding and lose some of its genetic diversity. Gene pools are like a bag of survival tricks. A specieswith less genetic diversity is less likely to survive disturbances such as flooding or grazing.
The loss, degradation, and fragmentation of habitats are important factors behind species endanger-ment and extinction.
Urban Encroachment
As our cities grow larger with more people and more development to accommodate these people,even wetlands with protected status are affected.
Loss of Buffers
A wetland ecosystem includes both land that is actually “wet” and surrounding areas called bufferzones. These buffer zones are areas where some species retreat during high tide and where pollutantsand sediments can be filtered before entering the water. Buffer zones also absorb such impacts asnoise and pet disturbance. But as people move closer and closer to wetlands, the buffer zones arelost.
Upper Newport Bay’s historical buffer zone was composed of grasslands and coastal sage scrub.Much of this habitat has been degraded or converted. The coastal sage scrub adjacent to the wet-lands has been used in the past for livestock grazing and as a dump for sediment dredged out of theBay, both of which compacted the soils and altered their chemistry. The resulting degraded habitat isprone to invasion by non-native plants, which now dominate the area. Bluffs surrounding the Bayhave been converted to housing developments. Much of the landscaping for these houses providesseed stock for more non-native plant invasions, a true form of biological pollution. Non-native land-scaping often requires irrigation, which creates run-off with fertilizers and pesticides that flow directlyinto the Bay.
Coastal sage scrub, an integral component of Upper Newport Bay’s ecosystem, is now an endangeredecological community. It is estimated that only ten percent of California’s historic coastal sage scrubacreage remains, and most of this land is in private ownership. Less than ten percent of the remain-ing habitat is formally protected; the rest may be slated for development.
People and Their Pets
As development moves closer to wetlands, so do the people. Wetlands provide wonderful recreationalopportunities, but with more and more people come more and more potential threats.
At Upper Newport Bay, thousands of people jog, bicycle, kayak, or walk through the Bay each year.Unfortunately, many of these people leave trash behind, trample wildlife, and cause erosion by mak-
Our Wetlands, Our World66
ing their own trails. It’s not only people but also their pets that can cause damage to this ecosystem.Horse and bike traffic can erode trails, and unleashed dogs disturb bird nests, especially those of theLight-footed Clapper Rail, an endangered species that builds its nests among the grasses in themarsh. Also, pet waste that washes into the Bay can result in water pollution.
Too Much DirtEven development far from the wetland can cause problems. Rain washes soil eroded from construc-tion sites and farm fields through the watershed, ultimately depositing these sediments into the wet-land. Increased urbanization in the Upper Newport Bay watershed has resulted in the need to formconcrete channels in San Diego Creek that direct storm water and dry-weather runoff quickly, andwith more silt, into the Bay. Such channelization is common practice in areas that have developmentson floodplains.
Excessive amounts of silt in a wetland can clog the gills of fish, bury their eggs, obliterate underwatershelters, and cloud the water so little sunlight can reach aquatic plants, which depend on the lightfor photosynthesis. In Upper Newport Bay, nearly a million cubic yards (approximately the volume of19 Olympic-sized pools, or a million pick-up truckloads) of sediments were dredged from the north-east corner of the Bay in 1998-99. More than twice that amount is slated for removal in 2004-2005,and similar dredge operations are expected every 21 years. Without dredging, the Newport Harborwould eventually become inaccessible by boat.
Water Quality
While it is true that wetlands can reduce or eliminate the harmful effects of water pollution, they canalso become overwhelmed if the amount of pollution exceeds that wetland’s biological capacity. Largequantities of pollutants washed into wetlands can lead to the death of plants, animals, and importantmicroorganisms.
There’s No Point to PollutionPollution comes from many sources. Point source pollution is discharged from, and can be tracedback to, an identifiable point or source, such as a factory’s discharge pipe. But most pollution enter-ing wetlands is nonpoint source pollution. Nonpoint source pollution is contaminated runoff thatoriginates from an indefinite or unidentifiable place; usually it accumulates from a variety of places.
As the drain for the watershed basin, a coastal wetland ends up with whatever finds its way into theflowing water. In Upper Newport Bay, that includes:
• Trash — Foamed plastic cups, paper, cans, bottles, plastic bags and packages, cigarette butts,and other garbage all can be found in the Bay, whether washed in through storm drains or care-lessly dropped by visitors. Not only is the trash unsightly, it is also dangerous to the marine lifeand the birds that get tangled up in it or eat bits of plastic, mistaking it for food.
• Chemicals — We use toxic chemicals every day, and many of them end up on the ground wherethey can get washed into rivers or storm drains. Pesticides, paint, cleaners, polishes, glue, oil,gasoline, and auto-coolant are all helpful to us but harmful to the Bay ecosystem. Oil andgrease can coat bird feathers; other toxic chemicals can kill or contaminate fish and plant life.
• Metals — Metallic substances can leach from paints applied to the bottoms of boats moored inthe lower bay. Fine metallic particles from car brake pads accumulate as dust along the sides ofroads and get washed down to the Bay with run-off. These metals can accumulate in animal tis-sues.
Our Wetlands, Our World 67
• Fertilizers and animal waste — Commercial nurseries, golf courses, hotels, and homes all usefertilizers. These fertilizers, along with waste from animals—dogs, horses, and wildlife—getpicked up by runoff and then deposited in the Bay. Fertilizers and animal waste are actuallynutrients, which promote plant growth. But an excess of these nutrients in the Bay can causealgae blooms—the overgrowth of algae. When the algae die, the oxygen in the water is used upby microbes through decomposition, which affects all living things in the water. This process,called eutrophication, can cause fish to die from lack of oxygen. Eutrophication is also responsi-ble for the sulphuric smell rising from the Bay—a sign of anaerobic decomposition.
• Green waste — Grass clippings, tree branches, leaves, dead plants—all can end up in the Bay.In 2004, the County of Orange found that 99 percent of trash intercepted by street sweeperswas organic debris. Like fertilizers and animal waste, green waste can dramatically increase thenutrient levels in the Bay, resulting in eutrophication.
Non-native Species
Non-native, invasive plant and animal species are another major threat to wetlands across the country.
Who’s Native?Native plants (also called indigenous plants) are plants that have evolved over thousands of years in aparticular area. California has the largest number of native plant species of any state in the nation. Aplant is native to California when its origins, for as long as can be traced back, are from California.Native species—such as California sagebrush and arroyo willow—have been here for so long they arespecifically adapted to our climate, soils, and habitats.
Most native plants occur in communities; that is, they have evolved together with other plants. As aresult, a community of native plants provides habitat for a set of native wildlife species, including pol-linators and herbivores, which are specifically adapted to life in that community. They depend onone another for food, air, nesting, resting, and hiding places.
Alien InvadersNon-native plants (also known as non-indigenous, introduced, or exotic) are species that have beenintroduced into an environment in which they did not evolve. Introduction of non-native plants intoour landscape has been both accidental and deliberate.
In their new homes, non-natives generally have no enemies or controls—such as natural pests, herbi-vores, diseases, or parasites—to limit their growth. These invasive species out-compete native speciesfor nutrients, water, sunlight, and living space. As they spread, the native plant communities are dis-placed, and often, along with them, the animals that depend on the plants for food or shelter. Thefunctions of the entire ecosystem are disrupted.
Our Wetlands, Our World68
When non-native species dominate native vegetation, they can: • eliminate the native plants that provide food and shelter for wildlife• degrade the variety and quality of habitats• dramatically reduce biodiversity• alter soil chemistry• promote erosion• sequester water• alter fire-frequency.
In the BayMany California native plants live at Upper Newport Bay, including:
• bush sunflower• California buckwheat• California sagebrush• pickleweed• cordgrass
Some are endangered, such as the salt marsh bird’s beak, which, once prevalent in coastal OrangeCounty, can only now be found in Upper Newport Bay.
Invasive non-native plants have found their way into the Bay. Three that are commonly seen are iceplant, pampas grass, and giant reed. Giant reed is a particularly destructive invader. It can grow overtwo feet per week and colonizes quickly in the presence of freshwater, displacing native plants andwildlife because of the massive stands it forms. As it out-competes local vegetation for space andwater, it reduces habitat and food supply for several species, particularly insect populations. Unlikenative riparian plants, giant reed provides little shade, leading to increased water temperatures andreduced habitat quality for aquatic life. It also promotes bank erosion because of its shallow root sys-tem, contributing to more sediment being deposited in the Bay.
Our Wetlands, Our World 69
Activity: Changes Over TimeSummary: In this activity, students will compare aerial photographs of Upper Newport Bay taken in1938, 1975, and 2001 to discover how the area has changed and what impact that change has had.
Our Wetlands, Our World70
California State Content Standards
SCIENCE
Biology/Life SciencesEcology 6b. Students know how to analyze changes in
an ecosystem resulting from changes in climate,human activity, introduction of nonnative species, orchanges in population size.
Earth SciencesCalifornia Geology 9a. Students know the resources of
major economic importance in California and theirrelation to California’s geology.
California Geology 9c. Students know the importanceof water to society, the origins of California’s freshwater, and the relationship between supply and need.
Investigation & Experimentation1d. Students will formulate explanations by using logic
and evidence.1i. Students will analyze the locations, sequences, or
time intervals that are characteristic of naturalphenomena
Objectives:Students will be able to:
• Interpret and compare aerial photographs• Describe the changes in the area caused by
human development • Determine how development has possibly
affected wildlife habitat and populations inUpper Newport Bay
Materials:• UNB Inhabitant Cards (Appendix A)• Handouts
- Aerial photographs of Upper Newport Bayin 1938, 1975, and 2001
- Changes Over Time worksheet
Preparation:• Make a copy for each group of:
each aerial photoChanges Over Time worksheet Newport Bay Timeline
Time Required:Approximately 1 hour
Procedures:
1. Divide students into small groups and give each group a copy of the three aerial photos. Pointout that the photos were taken of the Upper Newport Bay watershed in 1938, 1975, and 2001.Ask students to look at the photos for a few minutes and try to identify landmarks, such asPacific Coast Highway, Shellmaker Island, the Salt Dike, and orange tree groves.
2. Hand out a copy of the Changes Over Time worksheet to each group. Tell students to look atthe photos to determine what changes have occurred in each of the areas shown on the work-sheet—that is:- Are there more or less?- Have there been alterations?- Has anything disappeared?
Tell students to record the changes in the “Change” column of their worksheets.
3. Using the species included on the UNB Inhabitant Cards, or on the list of Species Common toUpper Newport Bay in Appendix B, ask students to consider how each change might affectwildlife in the Bay. Have students record their ideas in the “Possible Impacts on Wildlife” col-umn on the worksheet. For example: “The increase in open water has greatly enlarged the feed-ing grounds for diving birds such as the Least Tern.”
4. Bring the class together to compare their findings. Ask students to think about and discusswhether the wildlife in the Bay was generally better off in 1938, 1975, or 2001. Remind stu-dents that the Clean Water Act was passed in 1972, along with the ban of DDT and other toxicchemicals that polluted the wetland.
Follow-up:
Use the following questions to ask students what they learned from comparing the photos.
1. What anthropogenic (human-made) features have been harmful to wildlife in the Upper New-port Bay and why?
2. What do you think the Bay will look like in 50 years? Remember, global climate change dataestimate that sea level will rise three millimeters each year—over three inches in 50 years.
3. Have students use the Newport Bay Timeline to relate historical events to changes observed inthe aerials.
4. Use the California Coastal Records Website (www.californiacoastline.org) to look at historicalaerials of California’s coastline. By clicking on “Time Comparison,” users can compare photo-graphs from 2002 and 1972.
Our Wetlands, Our World 71
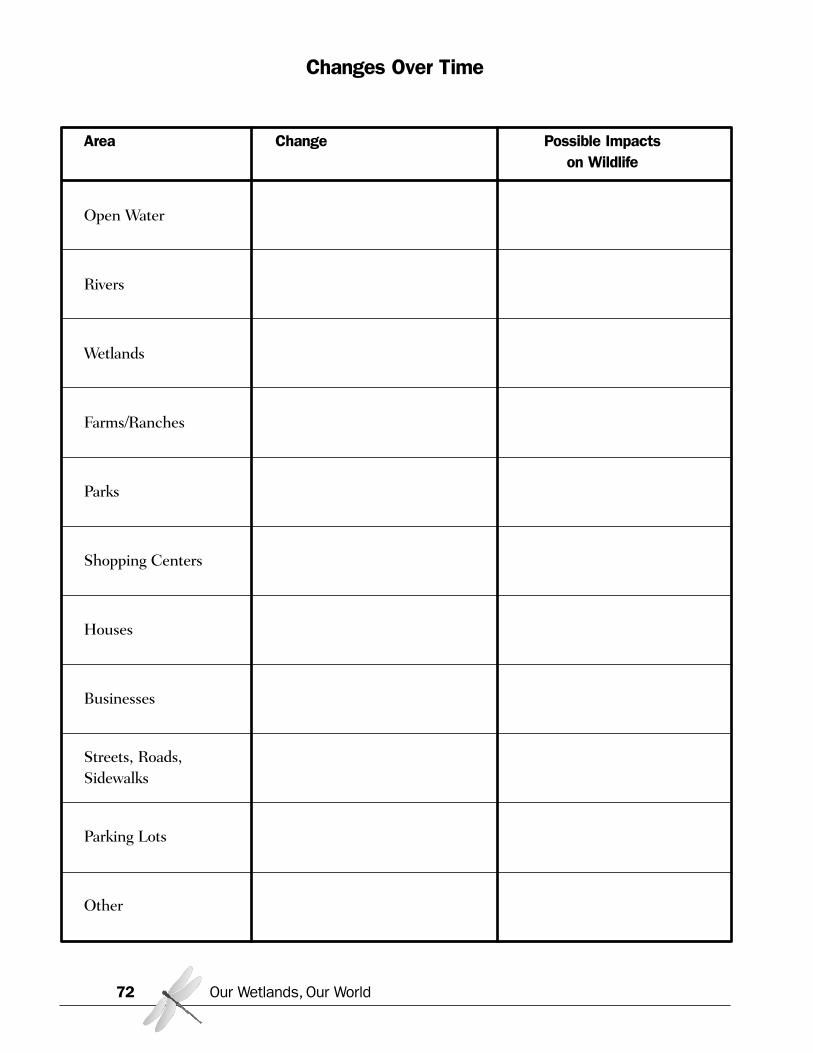
Changes Over Time
Area Change Possible Impacts on Wildlife
Open Water
Rivers
Wetlands
Farms/Ranches
Parks
Shopping Centers
Houses
Businesses
Streets, Roads, Sidewalks
Parking Lots
Other
Our Wetlands, Our World72
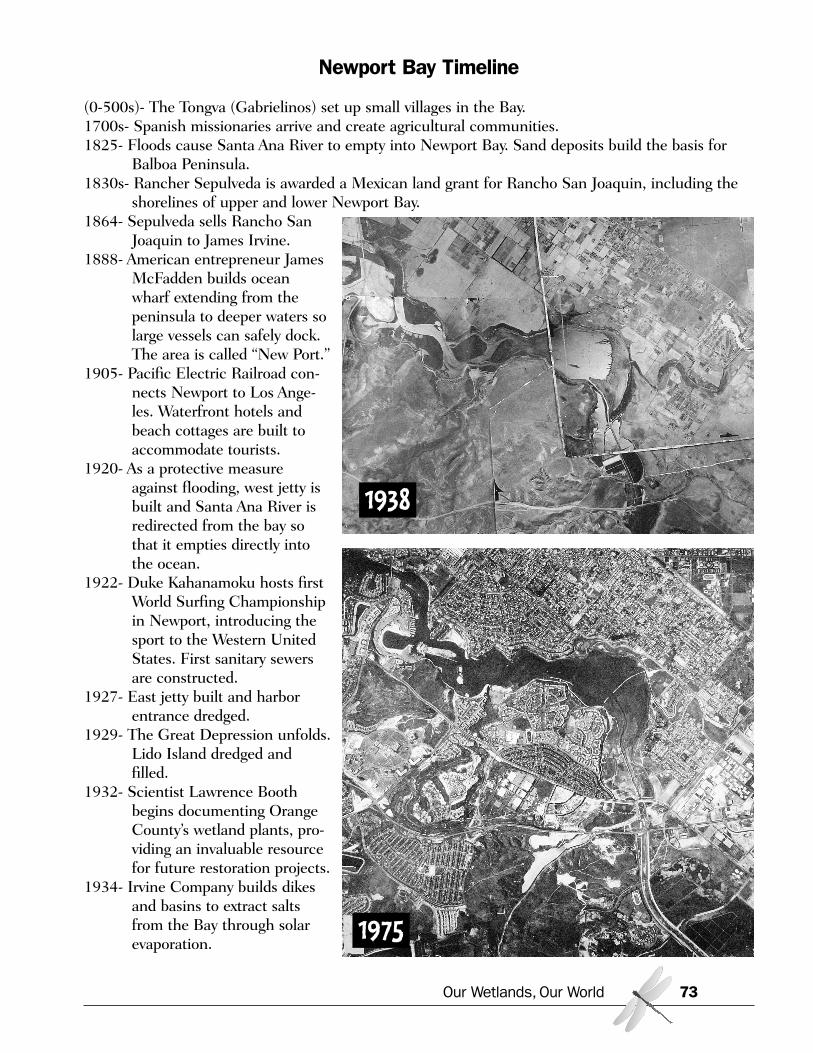
Newport Bay Timeline
(0-500s)- The Tongva (Gabrielinos) set up small villages in the Bay.1700s- Spanish missionaries arrive and create agricultural communities.1825- Floods cause Santa Ana River to empty into Newport Bay. Sand deposits build the basis for
Balboa Peninsula. 1830s- Rancher Sepulveda is awarded a Mexican land grant for Rancho San Joaquin, including the
shorelines of upper and lower Newport Bay.1864- Sepulveda sells Rancho San
Joaquin to James Irvine. 1888- American entrepreneur James
McFadden builds oceanwharf extending from thepeninsula to deeper waters solarge vessels can safely dock.The area is called “New Port.”
1905- Pacific Electric Railroad con-nects Newport to Los Ange-les. Waterfront hotels andbeach cottages are built toaccommodate tourists.
1920- As a protective measureagainst flooding, west jetty isbuilt and Santa Ana River isredirected from the bay sothat it empties directly intothe ocean.
1922- Duke Kahanamoku hosts firstWorld Surfing Championshipin Newport, introducing thesport to the Western UnitedStates. First sanitary sewersare constructed.
1927- East jetty built and harborentrance dredged.
1929- The Great Depression unfolds.Lido Island dredged andfilled.
1932- Scientist Lawrence Boothbegins documenting OrangeCounty’s wetland plants, pro-viding an invaluable resourcefor future restoration projects.
1934- Irvine Company builds dikesand basins to extract saltsfrom the Bay through solarevaporation.
Our Wetlands, Our World 73
1938
1975
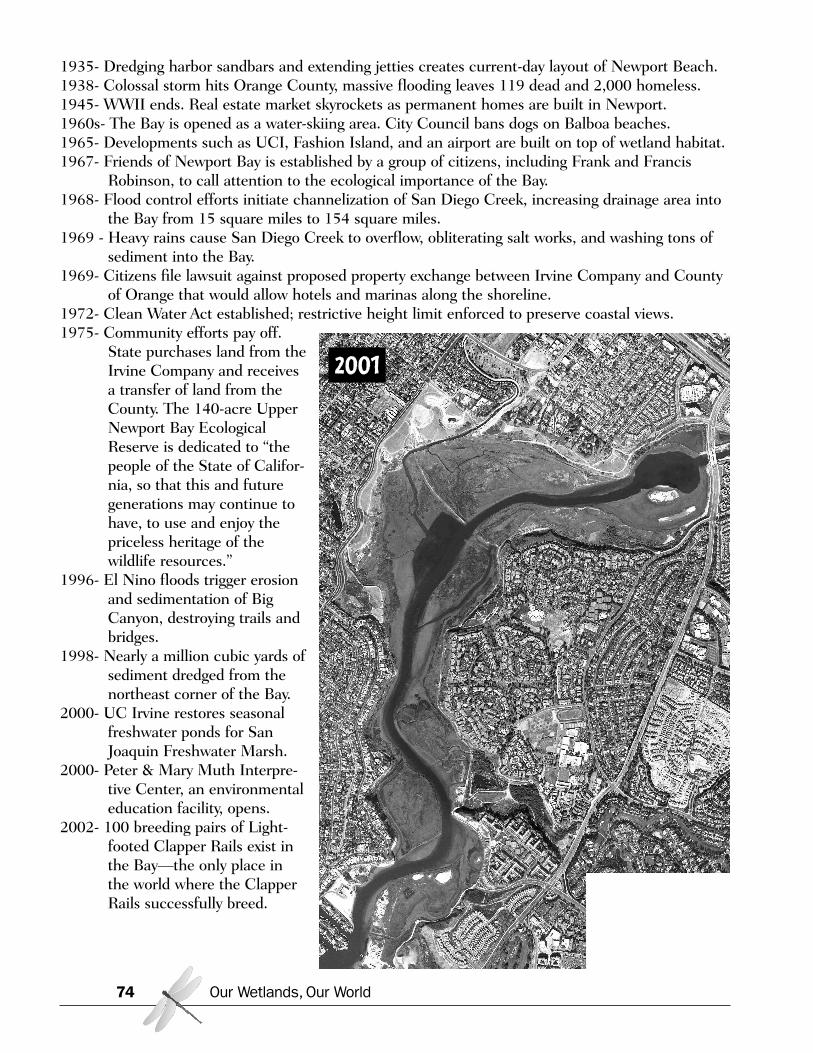
1935- Dredging harbor sandbars and extending jetties creates current-day layout of Newport Beach.1938- Colossal storm hits Orange County, massive flooding leaves 119 dead and 2,000 homeless.1945- WWII ends. Real estate market skyrockets as permanent homes are built in Newport. 1960s- The Bay is opened as a water-skiing area. City Council bans dogs on Balboa beaches.1965- Developments such as UCI, Fashion Island, and an airport are built on top of wetland habitat.1967- Friends of Newport Bay is established by a group of citizens, including Frank and Francis
Robinson, to call attention to the ecological importance of the Bay.1968- Flood control efforts initiate channelization of San Diego Creek, increasing drainage area into
the Bay from 15 square miles to 154 square miles.1969 - Heavy rains cause San Diego Creek to overflow, obliterating salt works, and washing tons of
sediment into the Bay.1969- Citizens file lawsuit against proposed property exchange between Irvine Company and County
of Orange that would allow hotels and marinas along the shoreline. 1972- Clean Water Act established; restrictive height limit enforced to preserve coastal views.1975- Community efforts pay off.
State purchases land from theIrvine Company and receivesa transfer of land from theCounty. The 140-acre UpperNewport Bay EcologicalReserve is dedicated to “thepeople of the State of Califor-nia, so that this and futuregenerations may continue tohave, to use and enjoy thepriceless heritage of thewildlife resources.”
1996- El Nino floods trigger erosionand sedimentation of BigCanyon, destroying trails andbridges.
1998- Nearly a million cubic yards ofsediment dredged from thenortheast corner of the Bay.
2000- UC Irvine restores seasonalfreshwater ponds for SanJoaquin Freshwater Marsh.
2000- Peter & Mary Muth Interpre-tive Center, an environmentaleducation facility, opens.
2002- 100 breeding pairs of Light-footed Clapper Rails exist inthe Bay—the only place inthe world where the ClapperRails successfully breed.
Our Wetlands, Our World74
2001
Activity: Nonpoint Source PollutionSummary: In this activity, students will read and interpret a map showing runoff drainage and how itaffects Upper Newport Bay. Students will consider some solutions to the problem of nonpoint sourcepollution.
California State Content Standards
SCIENCE
Biology/Life Sciences• Ecology 6b. Students know how to analyze changes
in an ecosystem resulting from changes in climate,human activity, introduction of nonnative species, orchanges in population size.
Investigation and Experimentation• 1a. Students will select and use appropriate tools and
technology (such as computer-linked probes, spread-sheets, and graphing calculators) to perform tests,collect data, analyze relationships, and display data.
ENGLISH-LANGUAGE ARTS
Grades 9-10
Writing Applications • Expository Compositions 2.3
a. Marshal evidence in support of a thesis and relat-ed claims, including information on all relevant per-spectives.
b. Convey information and ideas from primary andsecondary sources accurately and coherently.c. Make distinctions between the relative value andsignificance of specific data, facts, and ideas.
Grades 11-12
Writing Applications • Reflective Compositions 2.3
a. Explore the significance of personal experiences,events, conditions, or concerns by using rhetoricalstrategies (e.g., narration, description, exposition,persuasion).
b. Draw comparisons between specific incidents andbroader themes that illustrate the writer’s importantbeliefs or generalizations about life.c. Maintain a balance in describing individual inci-dents and relate those incidents to more general andabstract ideas.
Objectives:Students will be able to:
• Define nonpoint source pollution andexplain how it affects the Upper NewportBay
• Read and interpret a map showing drainagesystems affecting Upper Newport Bay
• Consider some solutions to the problem ofnonpoint source pollution
Materials:• Newport Bay Flood Control & Drainage
Map (www.ocwatersheds.com/watersheds/maps.asp?mapname=highres_map/map55.gif)
• Handout- Examples of Nonpoint Source Pollution
Preparation:• Project or print the flood control and
drainage map and make copies for each stu-dent group.
• Make a copy of Examples of Nonpoint SourcePollution for each student or group.
Time Required:• Approximately 1 hour
Our Wetlands, Our World 75
Procedures:
1. Ask students if they know the difference between “point” and “nonpoint” sources of pollution.
2. After discussion, write the following definitions on the chalkboard, overhead, or chart paper, andhave a student read them aloud:
• Point Source Pollution: Pollution that originates from a specific place such as a golf course orpower plant.
• Nonpoint Source Pollution: Contaminated runoff originating from an undefined place, oftenan accumulation of sources.
3. Ask students to name as many types of nonpoint source pollution as they can (e.g., pet waste,soaps, lawn fertilizers, litter, motor oil) and list their answers on the board.
4. Discuss the challenges faced in attempting to prevent or reduce nonpoint source pollution versuspoint source pollution. Ask students why nonpoint source pollution might be more difficult to con-trol. (For example, point sources, such as factory discharge pipes, are more easily cited and regulated;nonpoint sources, such as people dropping cigarette butts on the sidewalk or washing their cars in thestreet, are much harder to locate and regulate.
5. Hand out a copy of the Examples of Nonpoint Source Pollution to each student or group. Discusseach pollutant type, where it comes from, and what effects it has on the environment and onhumans.
6. Project or hand out to each student or student group a copy of the Flood Control and DrainageFacilities map of Upper Newport Bay. Review the legend together so that students understandwhat the symbols represent. Identify various locations on the map, such as their school, theirhomes, a local park. Ask the students:
a. Where does the water flowing along a gutter lead?(It leads to a storm drain, which generally empties into the ocean. During the dry season, howev-er, some of Orange County’s runoff might be diverted to treatment facilities.)
b. When should you see water flowing into storm drains?(Water should be flowing in the gutter only after it rains.)
c. If it is not raining and you see water flowing along gutters, where might it be coming from?(This is runoff from irrigating plants, washing cars, watering lawns, cleaning pavement, etc.)
7. Assign a portion of the map to each group, and have the groups identify on their portion wherenonpoint sources of pollution originate and what the pollutants may be. Have students list thoseareas and pollutants on the chart Examples of Nonpoint Source Pollution, as well as potential solu-tions to the problem of each particular pollutant.
Our Wetlands, Our World76
8. When all groups have finished, have each group share what they found. Keep a master chart show-ing locations and pollutants in the Upper Newport Bay watershed.
Follow-up:
1. Have students work in groups or individually to list ways to reduce nonpoint source pollution com-ing into Upper Newport Bay. For example:
Keep cars well maintained and free of leaks.Recycle used motor oil.Do not pour chemicals on the ground or down storm drains.Properly dispose of trash in garbage cans.Pick up pet waste.Don’t dispose of leaves or grass clippings in the storm drain; try composting yard waste.Landscape yards with native, drought-tolerant plants that do not require fertilizer.Prevent runoff by not over-watering.Avoid allowing even clean water to run off into gutters.Try “natural” (non-toxic) pest control.Do not use degreasers, which break down oil, dispersing it throughout water.
2. Have students observe nonpoint source pollution in their local neighborhoods for one week. Askstudents to keep a journal recording their observations on the way to and from school and as theytravel around the neighborhood. Tell them to indicate the location of storm drains and possiblesources of pollution that could make their way into the drainage system. Have them use theirobservation journals to write reports detailing how nonpoint source pollution could be reduced intheir own neighborhoods. Consider sending this report to a city council member or to a localnewspaper.
Extensions:
1. Ask students to develop a plan to reduce nonpoint source pollution. How would students go aboutenforcing it? Find out what measures Orange County is already taking to reduce run-off pollution.
2. Educate others. Discuss why people create nonpoint source pollution and how behavior can bechanged. Research safe substitutes for toxic products. Create a handout or posters to educate oth-ers about nonpoint source pollution and about how they can help reduce it.
Adapted from “Searching Out Non-Point Sources of Pollution” in Save Our Seas, by the Center for Marine Conservation and the California Coastal Commission.
Our Wetlands, Our World 77
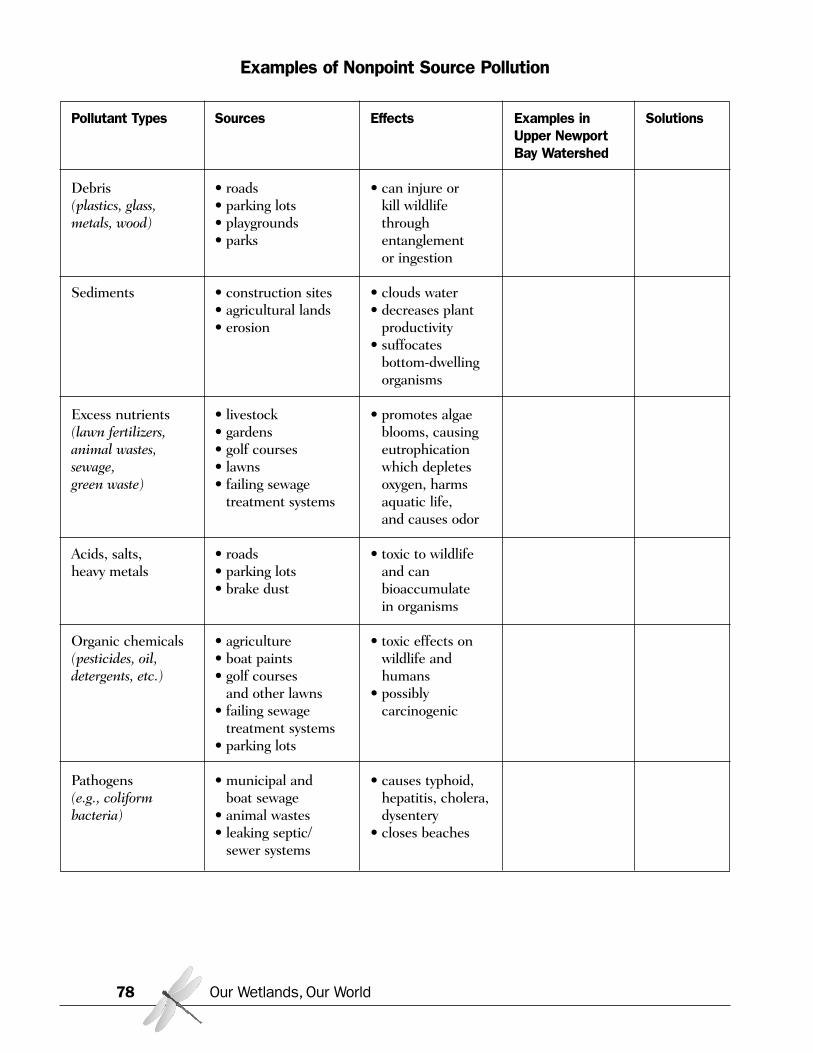
Our Wetlands, Our World78
Pollutant Types Sources Effects Examples in Solutions Upper Newport Bay Watershed
Debris • roads • can injure or(plastics, glass, • parking lots • kill wildlifemetals, wood) • playgrounds • through
• parks • entanglement• or ingestion
Sediments • construction sites • clouds water• agricultural lands • decreases plant• erosion • productivity
• suffocates • bottom-dwelling • organisms
Excess nutrients • livestock • promotes algae (lawn fertilizers, • gardens • blooms, causinganimal wastes, • golf courses • eutrophicationsewage, • lawns • which depletesgreen waste) • failing sewage • oxygen, harms
• treatment systems • aquatic life,• and causes odor
Acids, salts, • roads • toxic to wildlifeheavy metals • parking lots • and can
• brake dust • bioaccumulate• in organisms
Organic chemicals • agriculture • toxic effects on(pesticides, oil, • boat paints • wildlife anddetergents, etc.) • golf courses • humans
• and other lawns • possibly• failing sewage • carcinogenic• treatment systems• parking lots
Pathogens • municipal and • causes typhoid,(e.g., coliform • boat sewage • hepatitis, cholera,bacteria) • animal wastes • dysentery
• leaking septic/ • closes beaches• sewer systems
Examples of Nonpoint Source Pollution
Activity: Water QualitySummary: In this activity, students will test water from Upper Newport Bay or other wetlands for dis-solved oxygen, temperature, nitrate, phosphate, pH, and turbidity. Students will analyze the data fromtheir experiments and discuss how various types of pollution affect Upper Newport Bay and otherwetlands.
California State Content Standards
SCIENCE
Chemistry• Acids and Bases 5a. Students know the observable
properties of acids, bases, and salt solutions.• Acids and Bases 5d. Students know how to use the
pH scale to characterize acid and base solutions.
Biology/Life Sciences• Ecology 6b. Students know how to analyze changes
in an ecosystem resulting from changes in climate,human activity, introduction of nonnative species, orchanges in population size.
Investigations & Experimentation• 1a. Students will select and use appropriate tools and
technology to perform tests, collect data, analyze rela-tionships, and display data.
• 1b. Students will identify and communicate sourcesof unavoidable experimental error.
• 1c. Students will identify possible reasons for incon-sistent results, such as sources of error or uncon-trolled conditions.
ENGLISH-LANGUAGE ARTS
Grades 9-10
Reading Comprehension • Comprehension and Analysis of Grade-Level-Appro-
priate Text 2.6. Demonstrate use of sophisticatedlearning tools by following technical directions (e.g.,those found with graphic calculators and specializedsoftware programs and in access guides to WorldWide Web sites on the Internet).
Objectives:Students will be able to:
• Perform various water quality tests• Relate abiotic and biotic parameters• Interpret data and results of tests
Materials:• Water samples from various areas in Upper
Newport Bay or other source (run-off, tapwater, etc.)
• Map of sampling locations (for UNB, sug-gested collection sites include: ShellmakerIsland dock, Back Bay Drive pipe, Back BayDrive bend, Big Canyon bridge, Big Canyonoutfall)
• Dissolved Oxygen TesTabs (2 for each test)
• Nitrate Wide Range CTA TesTabs (1 for eachtest)
• Phosphorus TesTabs (1 for each test)• pH Wide Range TesTabs (1 for each test)• Turbidity test kit (secchi disk)• Test tubes (1 for each test) labeled:
✓ DO✓ Nitrate✓ Phosphate✓ pH✓ Salinity
• Distilled water• Gloves for each group• Liquid waste container• Handout
Testing Procedures
Our Wetlands, Our World 79
Procedures:
(Note: You need to determine how you want the testing to be carried out. Preferably, set up enoughmaterials at each station so that student pairs can perform each test. Alternatively, divide the class intosix groups, have each group perform a different test, and then share results with the class.)
1. Hand out a copy of the Testing Procedures to each student or group.
2. Tell students that they are going to be performing various water quality tests. Show students amap indicating where each sample was obtained. Discuss the differences among the samplinglocations.
3. Have students read the background for each test and discuss.
4. Point out the six stations and explain the testing procedures. For each test, ask students to pre-dict results before beginning.
5. Have students conduct the tests and record their observations. Remind them to handle allmaterials carefully.
6. When students have finished their tests, have them dump all test liquids into the liquid wastecontainer. Ask them why the waste liquid should be diluted before disposing of the waste.
Follow-up:
Have each group present their results and discuss their findings.
1. What test results indicated “poor” water quality?
2. What might be the source of that type of pollution in Upper Newport Bay? (for example, phosphate from soaps and pet waste, nitrate from fertilizer)
Our Wetlands, Our World80
Preparation:• Apply for permission to collect water samples
at your selected site. For Upper Newport Bay,call 949-640-0286 or 949-640-9956.
• Obtain water samples (approximately oneliter from each location) and label them toindicate their origin. Keep samples in a cooleruntil testing.
• Indicate on a map the location for each ofthe water samples
• Make a copy of the Testing Procedures foreach student or group.
• Set up a testing station for each water qualitytest. (See Testing Procedures.) Try to have atleast two samples—each from a different partof the Bay—for each test.
Time Required:• Approximately 1 hour
Note: Kits containing materials to conduct the testsare available in scientific supply catalogs as well asonline. Earth Force Low Cost Estuary and MarineKit (Product #5911) can be ordered fromwww.green.org.
3. How do water samples from various areas in the Bay differ? Why do they differ?
4. What sources of error might have affected your results? How could you reduce these errors?
5. What organisms may be affected by poor water quality?
6. How will those effects influence ecosystem balance and function?
7. What might remedy some of the pollution problems?(for example, farming organically, using a basin to “catch” some pollution before it enters the Bay,dredging contaminated sediment, keeping waste materials off the street)
8. What could you do to make a difference?
Extensions:
1. Have students research the organisms on the UNB Inhabitant Cards (Appendix A) to determinethe ideal conditions for each.
2. Record your results in Microsoft Excel and start a water quality log that will track changes overtime.
3. Volunteer to be a citizen monitor with your local Surfrider Foundation or borrow their videoSea to Summit, which features surf and skate celebrities. Visit www.surfrider.org or call 949-492-8170 for more information.
4. Have a speaker from the Municipal Water District of Orange County come to your classroomto discuss local water quality issues. Call the MWDOC Education Department 714-593-5017for more information.
5. Send students on a “phosphates hunt” to determine what products contain phosphates.
6. Have students do some research to find out what water quality problems have existed histori-cally and how some of those problems have been resolved.
Adapted from “Water Quality Testing” from Save San FranciscoBay Watershed Education Program, www.saveSFbay.org
Our Wetlands, Our World 81
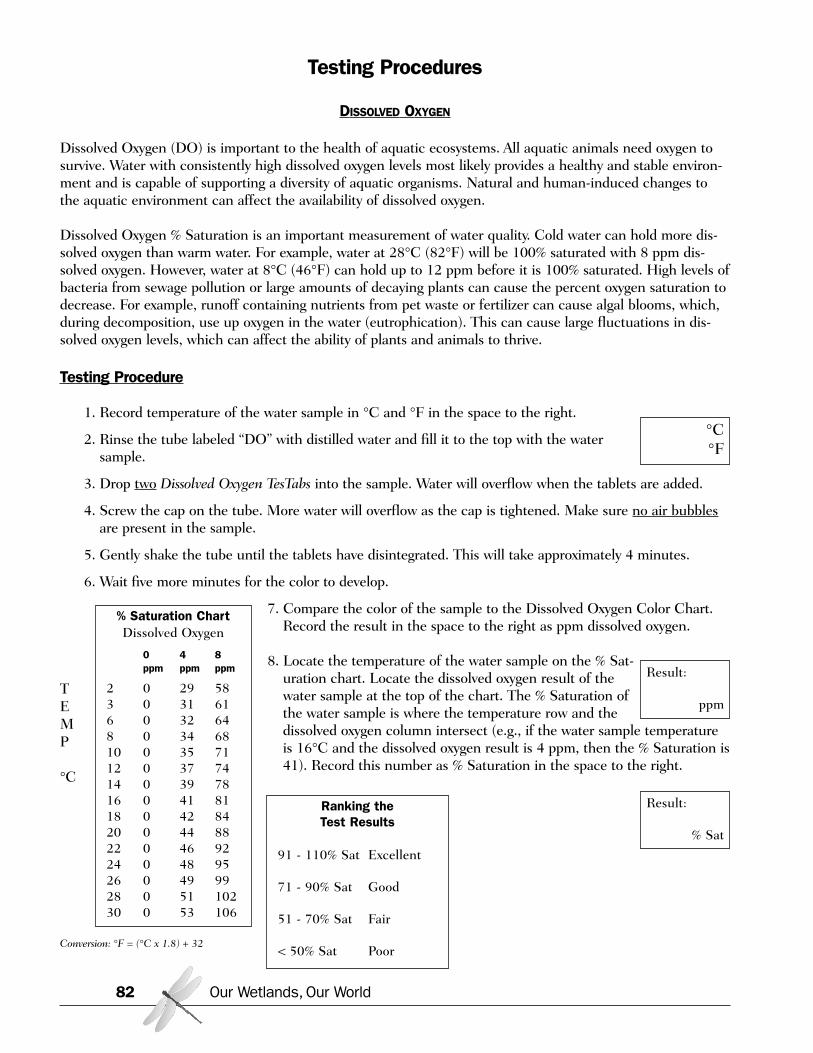
Testing Procedures
DISSOLVED OXYGEN
Dissolved Oxygen (DO) is important to the health of aquatic ecosystems. All aquatic animals need oxygen tosurvive. Water with consistently high dissolved oxygen levels most likely provides a healthy and stable environ-ment and is capable of supporting a diversity of aquatic organisms. Natural and human-induced changes tothe aquatic environment can affect the availability of dissolved oxygen.
Dissolved Oxygen % Saturation is an important measurement of water quality. Cold water can hold more dis-solved oxygen than warm water. For example, water at 28°C (82°F) will be 100% saturated with 8 ppm dis-solved oxygen. However, water at 8°C (46°F) can hold up to 12 ppm before it is 100% saturated. High levels ofbacteria from sewage pollution or large amounts of decaying plants can cause the percent oxygen saturation todecrease. For example, runoff containing nutrients from pet waste or fertilizer can cause algal blooms, which,during decomposition, use up oxygen in the water (eutrophication). This can cause large fluctuations in dis-solved oxygen levels, which can affect the ability of plants and animals to thrive.
Testing Procedure
1. Record temperature of the water sample in °C and °F in the space to the right.
2. Rinse the tube labeled “DO” with distilled water and fill it to the top with the water sample.
3. Drop two Dissolved Oxygen TesTabs into the sample. Water will overflow when the tablets are added.
4. Screw the cap on the tube. More water will overflow as the cap is tightened. Make sure no air bubblesare present in the sample.
5. Gently shake the tube until the tablets have disintegrated. This will take approximately 4 minutes.
6. Wait five more minutes for the color to develop.
7. Compare the color of the sample to the Dissolved Oxygen Color Chart.Record the result in the space to the right as ppm dissolved oxygen.
8. Locate the temperature of the water sample on the % Sat-uration chart. Locate the dissolved oxygen result of thewater sample at the top of the chart. The % Saturation ofthe water sample is where the temperature row and thedissolved oxygen column intersect (e.g., if the water sample temperatureis 16°C and the dissolved oxygen result is 4 ppm, then the % Saturation is41). Record this number as % Saturation in the space to the right.
Our Wetlands, Our World82
TEMP
°C
Conversion: °F = (°C x 1.8) + 32
°C°F
Result:
ppm
Result:
% Sat
% Saturation ChartDissolved Oxygen
0 4 8ppm ppm ppm
2 0 29 583 0 31 616 0 32 648 0 34 6810 0 35 7112 0 37 7414 0 39 7816 0 41 8118 0 42 8420 0 44 8822 0 46 9224 0 48 9526 0 49 9928 0 51 10230 0 53 106
Ranking the Test Results
91 - 110% Sat Excellent
71 - 90% Sat Good
51 - 70% Sat Fair
< 50% Sat Poor
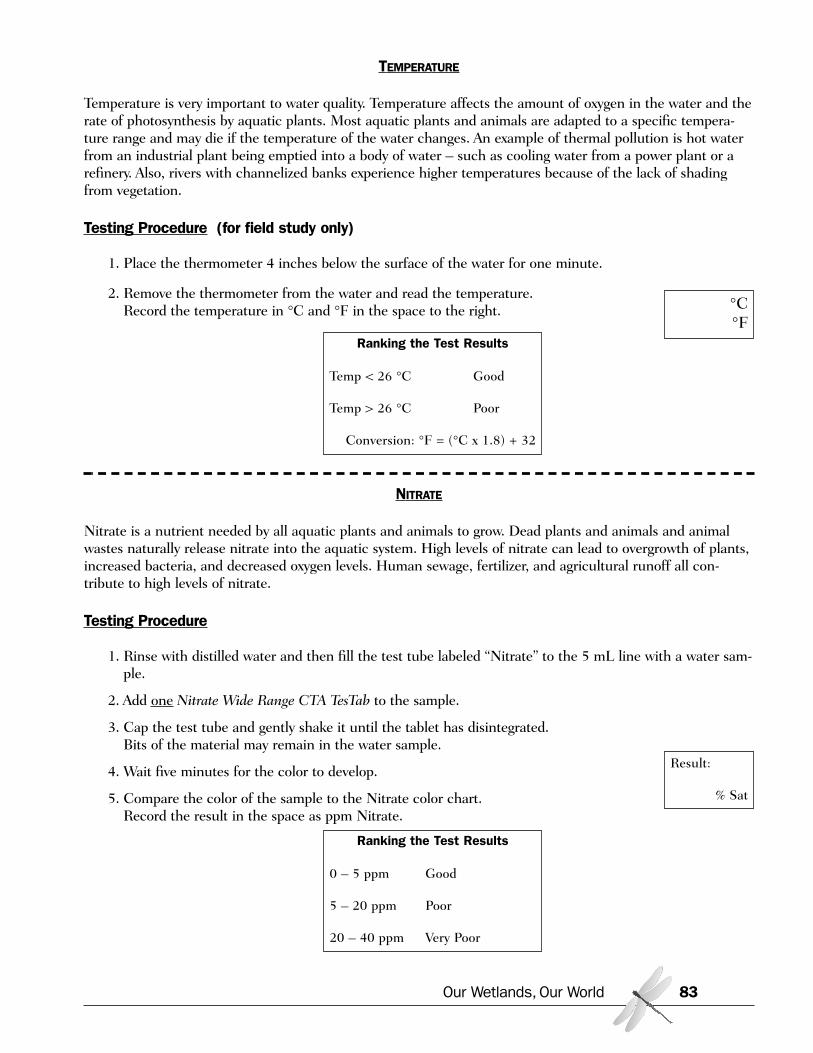
TEMPERATURE
Temperature is very important to water quality. Temperature affects the amount of oxygen in the water and therate of photosynthesis by aquatic plants. Most aquatic plants and animals are adapted to a specific tempera-ture range and may die if the temperature of the water changes. An example of thermal pollution is hot waterfrom an industrial plant being emptied into a body of water – such as cooling water from a power plant or arefinery. Also, rivers with channelized banks experience higher temperatures because of the lack of shadingfrom vegetation.
Testing Procedure (for field study only)
1. Place the thermometer 4 inches below the surface of the water for one minute.
2. Remove the thermometer from the water and read the temperature.Record the temperature in °C and °F in the space to the right.
NITRATE
Nitrate is a nutrient needed by all aquatic plants and animals to grow. Dead plants and animals and animalwastes naturally release nitrate into the aquatic system. High levels of nitrate can lead to overgrowth of plants,increased bacteria, and decreased oxygen levels. Human sewage, fertilizer, and agricultural runoff all con-tribute to high levels of nitrate.
Testing Procedure
1. Rinse with distilled water and then fill the test tube labeled “Nitrate” to the 5 mL line with a water sam-ple.
2. Add one Nitrate Wide Range CTA TesTab to the sample.
3. Cap the test tube and gently shake it until the tablet has disintegrated. Bits of the material may remain in the water sample.
4. Wait five minutes for the color to develop.
5. Compare the color of the sample to the Nitrate color chart. Record the result in the space as ppm Nitrate.
Our Wetlands, Our World 83
°C°F
Result:
% Sat
Ranking the Test Results
Temp < 26 °C Good
Temp > 26 °C Poor
Conversion: °F = (°C x 1.8) + 32
Ranking the Test Results
0 – 5 ppm Good
5 – 20 ppm Poor
20 – 40 ppm Very Poor
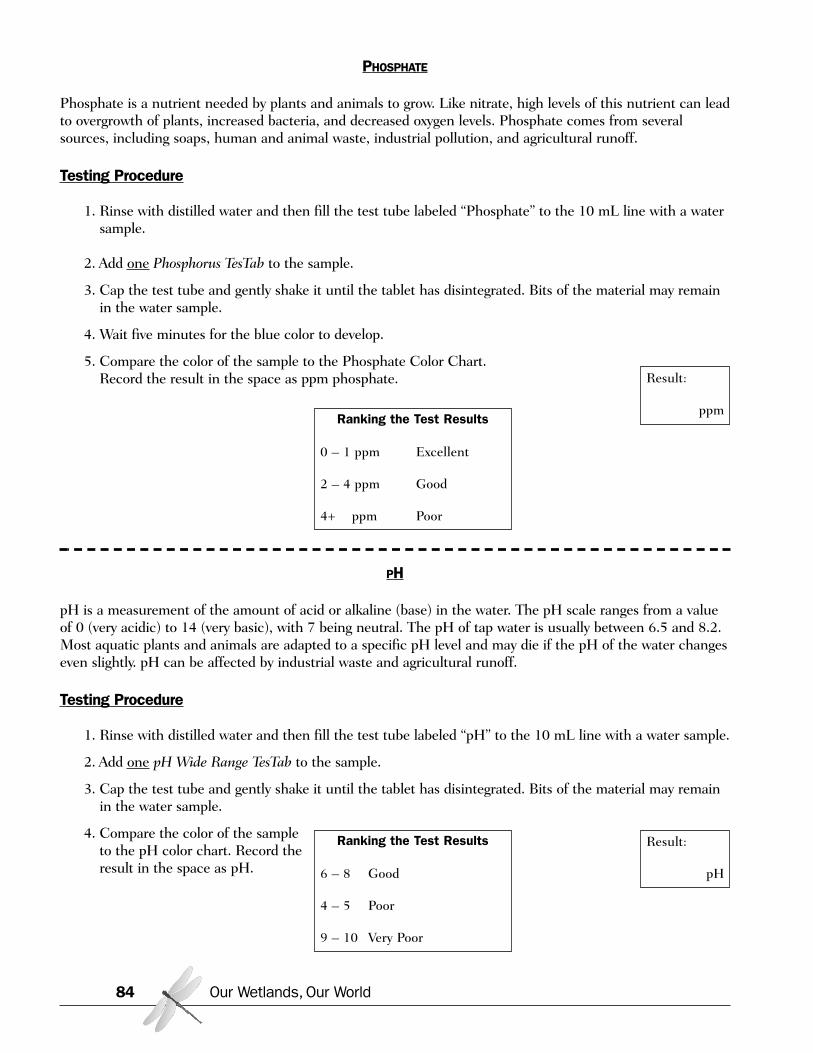
PHOSPHATE
Phosphate is a nutrient needed by plants and animals to grow. Like nitrate, high levels of this nutrient can leadto overgrowth of plants, increased bacteria, and decreased oxygen levels. Phosphate comes from severalsources, including soaps, human and animal waste, industrial pollution, and agricultural runoff.
Testing Procedure
1. Rinse with distilled water and then fill the test tube labeled “Phosphate” to the 10 mL line with a watersample.
2. Add one Phosphorus TesTab to the sample.
3. Cap the test tube and gently shake it until the tablet has disintegrated. Bits of the material may remainin the water sample.
4. Wait five minutes for the blue color to develop.
5. Compare the color of the sample to the Phosphate Color Chart. Record the result in the space as ppm phosphate.
PH
pH is a measurement of the amount of acid or alkaline (base) in the water. The pH scale ranges from a valueof 0 (very acidic) to 14 (very basic), with 7 being neutral. The pH of tap water is usually between 6.5 and 8.2.Most aquatic plants and animals are adapted to a specific pH level and may die if the pH of the water changeseven slightly. pH can be affected by industrial waste and agricultural runoff.
Testing Procedure
1. Rinse with distilled water and then fill the test tube labeled “pH” to the 10 mL line with a water sample.
2. Add one pH Wide Range TesTab to the sample.
3. Cap the test tube and gently shake it until the tablet has disintegrated. Bits of the material may remainin the water sample.
4. Compare the color of the sampleto the pH color chart. Record theresult in the space as pH.
Our Wetlands, Our World84
Result:
ppm
Result:
pH
Ranking the Test Results
0 – 1 ppm Excellent
2 – 4 ppm Good
4+ ppm Poor
Ranking the Test Results
6 – 8 Good
4 – 5 Poor
9 – 10 Very Poor
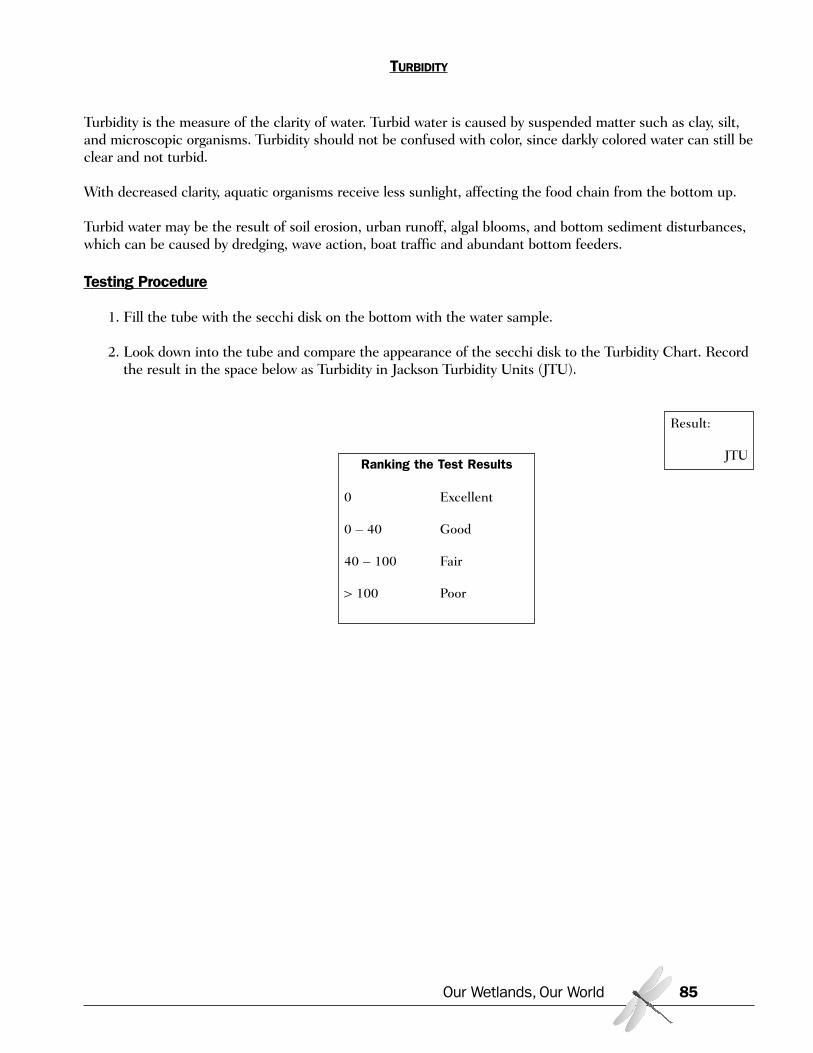
TURBIDITY
Turbidity is the measure of the clarity of water. Turbid water is caused by suspended matter such as clay, silt,and microscopic organisms. Turbidity should not be confused with color, since darkly colored water can still beclear and not turbid.
With decreased clarity, aquatic organisms receive less sunlight, affecting the food chain from the bottom up.
Turbid water may be the result of soil erosion, urban runoff, algal blooms, and bottom sediment disturbances,which can be caused by dredging, wave action, boat traffic and abundant bottom feeders.
Testing Procedure
1. Fill the tube with the secchi disk on the bottom with the water sample.
2. Look down into the tube and compare the appearance of the secchi disk to the Turbidity Chart. Recordthe result in the space below as Turbidity in Jackson Turbidity Units (JTU).
Our Wetlands, Our World 85
Result:
JTURanking the Test Results
0 Excellent
0 – 40 Good
40 – 100 Fair
> 100 Poor
Activity: Pollution ObservationSummary: In this activity, students will conduct an experiment to observe the effects of nonpointsource pollution on water environments.
California State Content Standards
SCIENCE
Chemistry• Acids and Bases 5a. Students know the observable
properties of acids, bases, and salt solutions.
Biology/Life Sciences• Ecology 6b. Students know how to analyze changes
in an ecosystem resulting from changes in climate,human activity, introduction of nonnative species, orchanges in population size.
• Ecology 6d. Students know how water, carbon, andnitrogen cycle between abiotic resources and organicmatter in the ecosystem and how oxygen cyclesthrough photosynthesis and respiration.
Earth Sciences• Biogeochemical Cycles 7a. Students know the car-
bon cycle of photosynthesis and respiration and thenitrogen cycle.
Investigation and Experimentation• 1c. Students will identify possible reasons for incon-
sistent results, such as sources of error or uncon-trolled conditions.
• 1d. Students will formulate explanations by usinglogic and evidence.
• 1g. Students will recognize the usefulness and limita-tions of models and theories as scientific representa-tions of reality.
• 1j. Students will recognize the issues of statisticalvariability and the need for controlled tests.
Objectives:Students will be able to:
• Record and interpret observations of theeffects different types of nonpoint source pol-lution have on water environments
• List possible effects of pollution on wildlife inUpper Newport Bay
Materials:• 5 clear 1-quart or larger containers (plastic
soda bottles or canning jars)• Water that contains algae from a freshwater
aquarium or a pond, or pond water pur-chased from a biological supply company (at least 5 quarts)
• Good light source (direct sunlight or strongartificial light)
• Plant fertilizer (7 teaspoons)• Motor oil (2 teaspoons)• Vinegar (1/2 cup)• Dish detergent (2 tablespoons)• Masking tape or blank labels• Markers• Handout
- Observation Sheet
Preparation:• Two weeks before the lesson, set up the five
bottles or jars. Fill each jar with aquarium orpond water, add one teaspoon of plant fertiliz-er, and stir thoroughly. To improve the qualityof the model, try adding a bit of soil from thebottom of a pond or gravel from an aquariumtank along with the water. Put the jars with-out lids near a window where they will getdirect light or give them a strong incandescentor fluorescent light. Do not put them wherethey will get cold. Let the jars sit for 2 weeks.
• The day of the lesson, set up 4 testing sta-tions. Each station should have a jar, tapeand marker for labeling, measured amount ofone of the pollutants (2 teaspoons of motoroil, 1/2 cup of vinegar, 2 tablespoons of deter-gent, 2 teaspoons of fertilizer), and an Obser-vation Sheet.
Time Required:• 1 hour for initial lesson• 5 minutes twice a week for 4 weeks for obser-
vations• 1 hour for final lesson
Our Wetlands, Our World86
Procedures:
1. Tell students that they will be conducting an experiment to see how pollution affects waterenvironments such as Upper Newport Bay. Show students the five jars. Explain that each con-tains water and some added nutrients, in the form of fertilizer, to feed the plants in the water.
2. Explain that one jar will be the control, and the other four will each have a “pollutant” addedto them. Point out each pollutant and ask students how that pollutant might get into the Bay.
Motor oil – from cars and car repair shops; washes off streets and parking lots and runsinto storm drains or creeks
Detergent – from car washing, dog washing, patio washing; runs off into storm drains orcreeks
Vinegar – represents acid rain or acidic runoff from manufacturing Fertilizer – from agriculture, gardens, pet waste, parks, golf courses; runs off into storm
drains or creeks.
3. Divide students into four groups and direct each group to a different station. Direct students tolabel their jar with the name of the pollutant they will be adding, and to record what theyobserve in the jar before adding the pollutant. Have students predict what will happen to thejar of water, both immediately and over time, and record their predictions on the sheet.
4. Ask students to carefully add the pollutant to their sample and to record their immediate obser-vations of changes. Ask students to cover the jars lightly (covering tightly might lead to thegrowth of some undesirable bacteria). Put the jars in the light as before.
5. Twice a week for the next four weeks, have students check their jars and record notes on theirObservation Sheet. (OPTION: Use a camera to take pictures of the samples each week.) At theend of week 4, have each group give a brief report to the class on their observations.
Follow-up:
Ask students the following questions:
1. Why is the fertilizer, which is a nutrient and promotes plant growth, considered a “pollutant”?(The algae grow too quickly, disrupting the balance of organisms. When the algae die and decom-pose, the oxygen in the water is depleted because of microbial activity—called eutrophication. Thelack of oxygen can harm plants and animals living in the water. Many plants and other organismsthat can’t move, such as clams, will suffocate.)
2. Why did the vinegar make the water so clear? (The water became clear because the acid in the vinegar killed everything in the water.)
3. Why can some organisms survive under a layer of oil?(If the algae can get enough sunlight, they can produce enough oxygen to keep themselves—andother organisms that live below the oxygen-impervious oil layer—alive.)
Our Wetlands, Our World 87
4. What wildlife can be harmed by oil in the water?(Animals that come into contact with oil are harmed. Aquatic birds and mammals that get coatedwith oil are unable to fly or stay warm. Fish gills can be clogged.)
5. How can wetlands help lessen the effects of pollutants?(Because they are able to process excess nutrients and toxins, wetland plants can filter out manypollutants before they have a chance to enter larger water bodies. Too many pollutants, however,can begin to kill wetland plants and animals.)
6. What can you do to decrease the amount of these pollutants that reach the water?(For example, properly maintain cars, pick up pet waste, use commercial car washes.)
Extensions:
1. Have students devise methods to reverse or improve the water quality in their model pollutedsystems. For example:— Add baking soda to the acid test to neutralize the acid. (This is similar to adding lime or
limestone rocks to lakes or streams to neutralize the effects of acid rain.)— Mop up the oil spill with straw, feathers, or cotton. Can students skim the oil off of their
models to let the oxygen through again?
2. Have students research and write a report on what is being done to keep pollutants off thestreet. For example:— sweeping streets— mailing information sheets — providing pet-waste bags in parks— stenciling storm drains with “Leads to Ocean”— setting “Total Maximum Daily Load” (TMDL) requirements for pollutants
Adapted from “Recipe for Trouble” in WOW! The Wonders Of Wetlands,co-published by International Project WET and Environmental Concern
Our Wetlands, Our World88

Observation Sheet
Pollutant: ______________________________________________________________________________
Appearance before adding pollutant: _______________________________________________________
_______________________________________________________________________________________
Predictions: _____________________________________________________________________________
_______________________________________________________________________________________
_______________________________________________________________________________________
Appearance immediately after adding pollutant: ______________________________________________
_______________________________________________________________________________________
Week 1: ________________________________________________________________________________
_______________________________________________________________________________________
Week 2: ________________________________________________________________________________
_______________________________________________________________________________________
Week 3: ________________________________________________________________________________
_______________________________________________________________________________________
Week 4: ________________________________________________________________________________
_______________________________________________________________________________________
Possible Sources of Error: ________________________________________________________________
_______________________________________________________________________________________
Conclusions: ____________________________________________________________________________
_______________________________________________________________________________________
_______________________________________________________________________________________
_______________________________________________________________________________________
Our Wetlands, Our World 89
Activity: Space for Species(Field Study)
Summary: Students will survey plant diversity in a habitat they are familiar with—their schoolyard,park, or some other local area. Students learn how to make and interpret the species-area curve, onetool scientists use to investigate the level of biodiversity in a habitat.
Our Wetlands, Our World90
California State Content Standards
SCIENCE
Biology/Life Sciences• Ecology 6a. Students know biodiversity is the sum
total of different kinds of organisms and is affected byalterations of habitats.
• Ecology 6b. Students know how to analyze changesin an ecosystem resulting from changes in climate,human activity, introduction of nonnative species, orchanges in population size.
• Evolution 8b. Students know a great diversity ofspecies increases the chance that at least some organ-isms survive major changes in the environment.
Investigation and Experimentation• 1a. Students will select and use appropriate tools and
technology (such as computer-linked probes, spread-sheets, and graphing calculators) to perform tests, col-lect data, analyze relationships, and display data.
• 1c. Students will identify possible reasons for incon-sistent results, such as sources of error or uncon-trolled conditions.
• 1d. Students will formulate explanations by usinglogic and evidence.
• 1g. Students will recognize the usefulness and limita-tions of models and theories as scientific representa-tions of reality.
• 1k. Students will recognize the cumulative nature ofscientific evidence.
MATHEMATICS
• Probability and Statistics 8.0. Students organize anddescribe distributions of data by using a number ofdifferent methods, including frequency tables, his-tograms, standard line and bar graphs, stem-and-leafdisplays, scatterplots, and box-and-whisker plots.
Objectives:Students will be able to:
• Create a graph that demonstrates therelationship between species richness andthe size of a habitat
• Describe factors that affect the relationshipbetween habitat fragmentation andbiodiversity
Materials:• Plot of land 64 square meters (approximately
830 square feet) containing at least 12different species of plants from which leavescan be taken (e.g., schoolyard, roadside field,local park)
• Stakes (e.g., pencils or coffee stirrers)• Twine• Tape measure (8 meter or 30 foot length)• Large clear plastic bags• Easel with chart paper or butcher paper and
marker• Clear tape• Graph paper• Handout
- Leaf I.D.
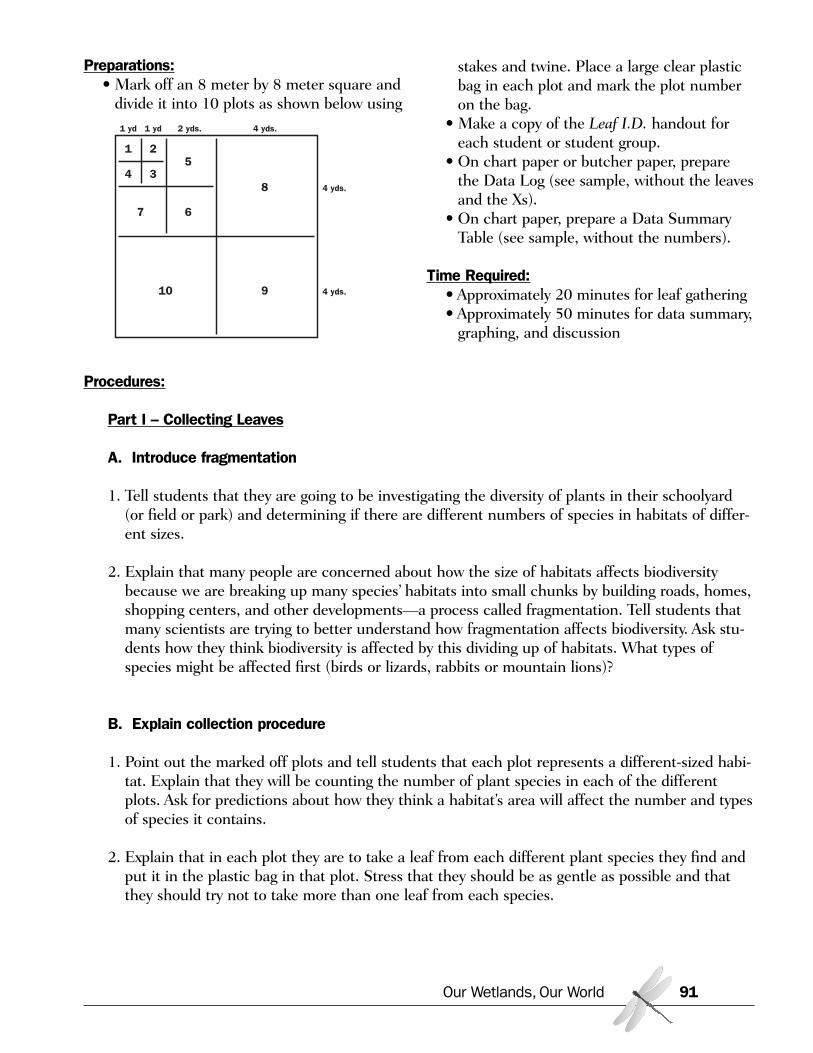
Procedures:
Part I – Collecting Leaves
A. Introduce fragmentation
1. Tell students that they are going to be investigating the diversity of plants in their schoolyard(or field or park) and determining if there are different numbers of species in habitats of differ-ent sizes.
2. Explain that many people are concerned about how the size of habitats affects biodiversitybecause we are breaking up many species’ habitats into small chunks by building roads, homes,shopping centers, and other developments—a process called fragmentation. Tell students thatmany scientists are trying to better understand how fragmentation affects biodiversity. Ask stu-dents how they think biodiversity is affected by this dividing up of habitats. What types ofspecies might be affected first (birds or lizards, rabbits or mountain lions)?
B. Explain collection procedure
1. Point out the marked off plots and tell students that each plot represents a different-sized habi-tat. Explain that they will be counting the number of plant species in each of the differentplots. Ask for predictions about how they think a habitat’s area will affect the number and typesof species it contains.
2. Explain that in each plot they are to take a leaf from each different plant species they find andput it in the plastic bag in that plot. Stress that they should be as gentle as possible and thatthey should try not to take more than one leaf from each species.
Our Wetlands, Our World 91
Preparations:• Mark off an 8 meter by 8 meter square and
divide it into 10 plots as shown below using
stakes and twine. Place a large clear plasticbag in each plot and mark the plot numberon the bag.
• Make a copy of the Leaf I.D. handout foreach student or student group.
• On chart paper or butcher paper, preparethe Data Log (see sample, without the leavesand the Xs).
• On chart paper, prepare a Data SummaryTable (see sample, without the numbers).
Time Required:• Approximately 20 minutes for leaf gathering • Approximately 50 minutes for data summary,
graphing, and discussion
1 2
1 yd 1 yd 2 yds. 4 yds.
4 35
67
8 4 yds.
4 yds.910
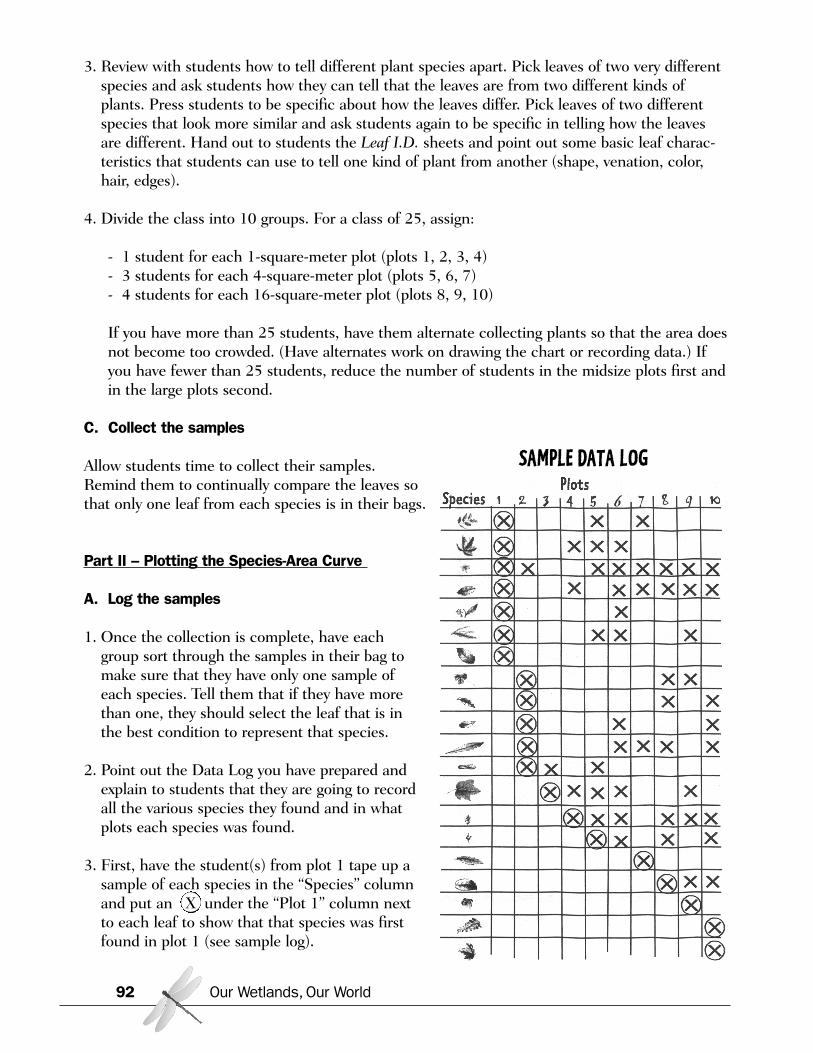
3. Review with students how to tell different plant species apart. Pick leaves of two very differentspecies and ask students how they can tell that the leaves are from two different kinds ofplants. Press students to be specific about how the leaves differ. Pick leaves of two differentspecies that look more similar and ask students again to be specific in telling how the leavesare different. Hand out to students the Leaf I.D. sheets and point out some basic leaf charac-teristics that students can use to tell one kind of plant from another (shape, venation, color,hair, edges).
4. Divide the class into 10 groups. For a class of 25, assign:
- 1 student for each 1-square-meter plot (plots 1, 2, 3, 4)- 3 students for each 4-square-meter plot (plots 5, 6, 7)- 4 students for each 16-square-meter plot (plots 8, 9, 10)
If you have more than 25 students, have them alternate collecting plants so that the area doesnot become too crowded. (Have alternates work on drawing the chart or recording data.) Ifyou have fewer than 25 students, reduce the number of students in the midsize plots first andin the large plots second.
C. Collect the samples
Allow students time to collect their samples.Remind them to continually compare the leaves sothat only one leaf from each species is in their bags.
Part II – Plotting the Species-Area Curve
A. Log the samples
1. Once the collection is complete, have eachgroup sort through the samples in their bag tomake sure that they have only one sample ofeach species. Tell them that if they have morethan one, they should select the leaf that is inthe best condition to represent that species.
2. Point out the Data Log you have prepared andexplain to students that they are going to recordall the various species they found and in whatplots each species was found.
3. First, have the student(s) from plot 1 tape up asample of each species in the “Species” columnand put an X under the “Plot 1” column nextto each leaf to show that that species was firstfound in plot 1 (see sample log).
Our Wetlands, Our World92
SAMPLE DATA LOG
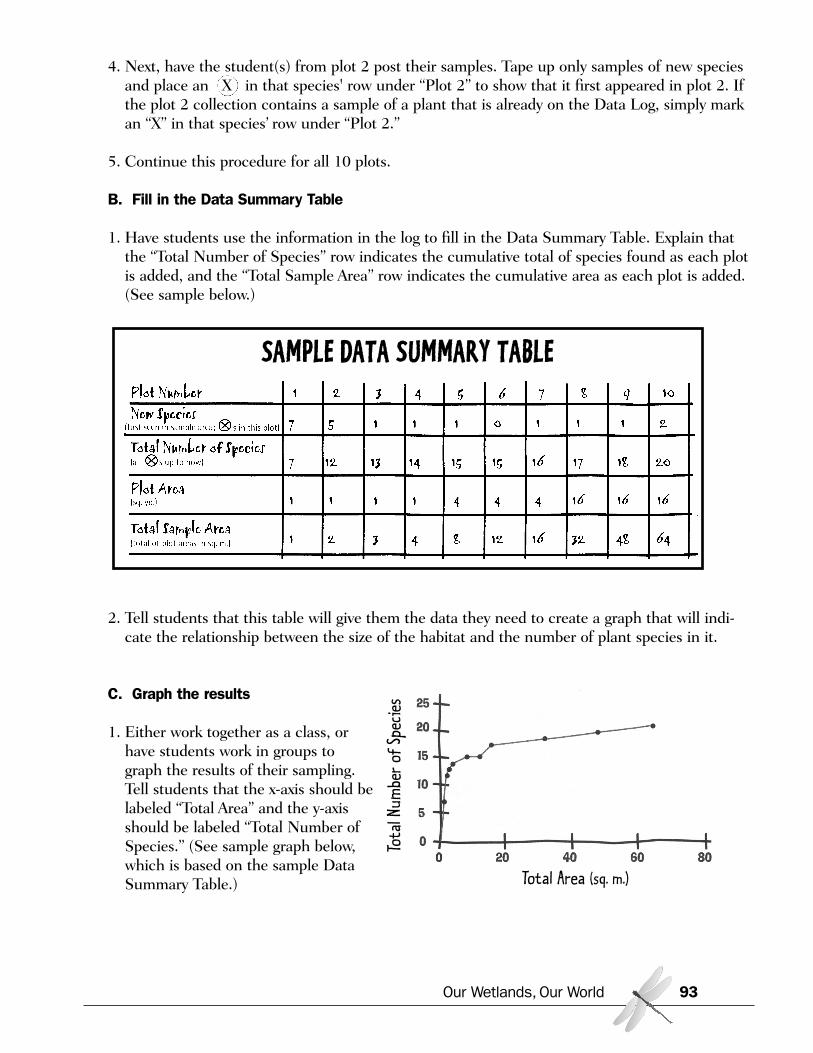
4. Next, have the student(s) from plot 2 post their samples. Tape up only samples of new speciesand place an X in that species' row under “Plot 2” to show that it first appeared in plot 2. Ifthe plot 2 collection contains a sample of a plant that is already on the Data Log, simply markan “X” in that species’ row under “Plot 2.”
5. Continue this procedure for all 10 plots.
B. Fill in the Data Summary Table
1. Have students use the information in the log to fill in the Data Summary Table. Explain thatthe “Total Number of Species” row indicates the cumulative total of species found as each plotis added, and the “Total Sample Area” row indicates the cumulative area as each plot is added.(See sample below.)
2. Tell students that this table will give them the data they need to create a graph that will indi-cate the relationship between the size of the habitat and the number of plant species in it.
C. Graph the results
1. Either work together as a class, orhave students work in groups tograph the results of their sampling.Tell students that the x-axis should belabeled “Total Area” and the y-axisshould be labeled “Total Number ofSpecies.” (See sample graph below,which is based on the sample DataSummary Table.)
Our Wetlands, Our World 93
SAMPLE DATA SUMMARY TABLETo
tal N
umbe
r of
Spe
cies
Total Area (sq. m.)
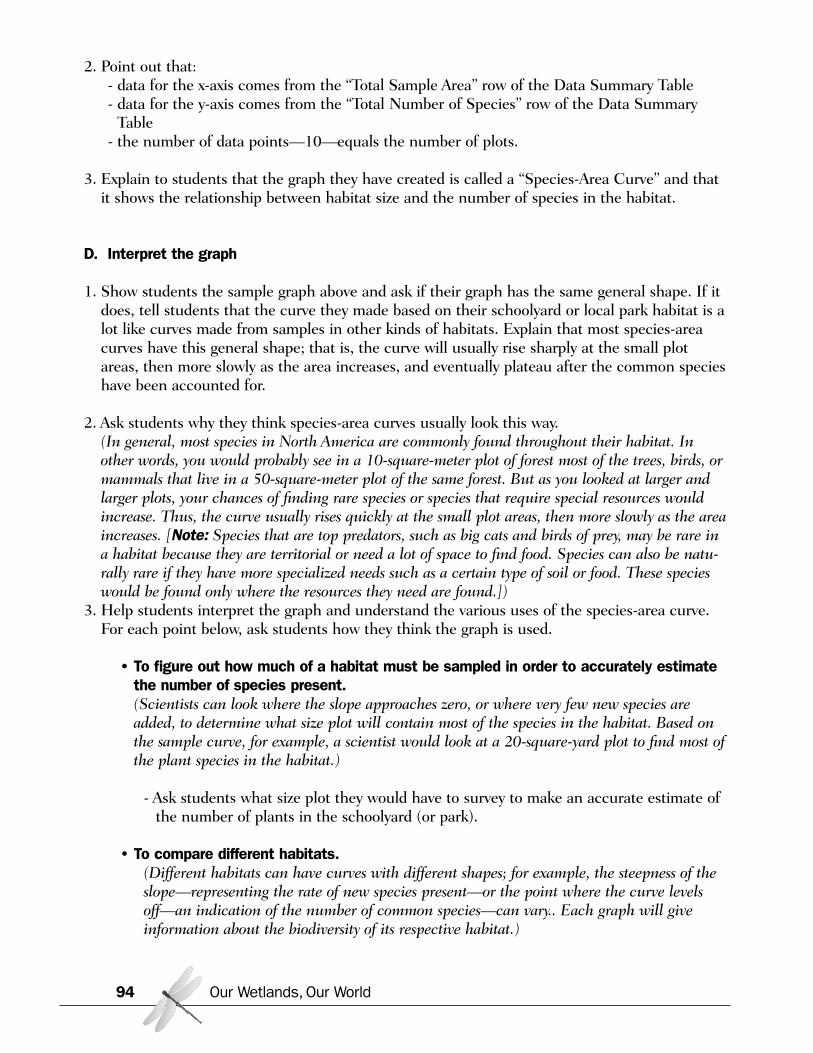
2. Point out that:- data for the x-axis comes from the “Total Sample Area” row of the Data Summary Table - data for the y-axis comes from the “Total Number of Species” row of the Data Summary
Table- the number of data points—10—equals the number of plots.
3. Explain to students that the graph they have created is called a “Species-Area Curve” and thatit shows the relationship between habitat size and the number of species in the habitat.
D. Interpret the graph
1. Show students the sample graph above and ask if their graph has the same general shape. If itdoes, tell students that the curve they made based on their schoolyard or local park habitat is alot like curves made from samples in other kinds of habitats. Explain that most species-areacurves have this general shape; that is, the curve will usually rise sharply at the small plotareas, then more slowly as the area increases, and eventually plateau after the common specieshave been accounted for.
2. Ask students why they think species-area curves usually look this way.(In general, most species in North America are commonly found throughout their habitat. Inother words, you would probably see in a 10-square-meter plot of forest most of the trees, birds, ormammals that live in a 50-square-meter plot of the same forest. But as you looked at larger andlarger plots, your chances of finding rare species or species that require special resources wouldincrease. Thus, the curve usually rises quickly at the small plot areas, then more slowly as the areaincreases. [Note: Species that are top predators, such as big cats and birds of prey, may be rare ina habitat because they are territorial or need a lot of space to find food. Species can also be natu-rally rare if they have more specialized needs such as a certain type of soil or food. These specieswould be found only where the resources they need are found.])
3. Help students interpret the graph and understand the various uses of the species-area curve.For each point below, ask students how they think the graph is used.
• To figure out how much of a habitat must be sampled in order to accurately estimatethe number of species present.(Scientists can look where the slope approaches zero, or where very few new species areadded, to determine what size plot will contain most of the species in the habitat. Based onthe sample curve, for example, a scientist would look at a 20-square-yard plot to find most ofthe plant species in the habitat.)
- Ask students what size plot they would have to survey to make an accurate estimate ofthe number of plants in the schoolyard (or park).
• To compare different habitats.(Different habitats can have curves with different shapes; for example, the steepness of theslope—representing the rate of new species present—or the point where the curve levelsoff—an indication of the number of common species—can vary.. Each graph will giveinformation about the biodiversity of its respective habitat.)
Our Wetlands, Our World94
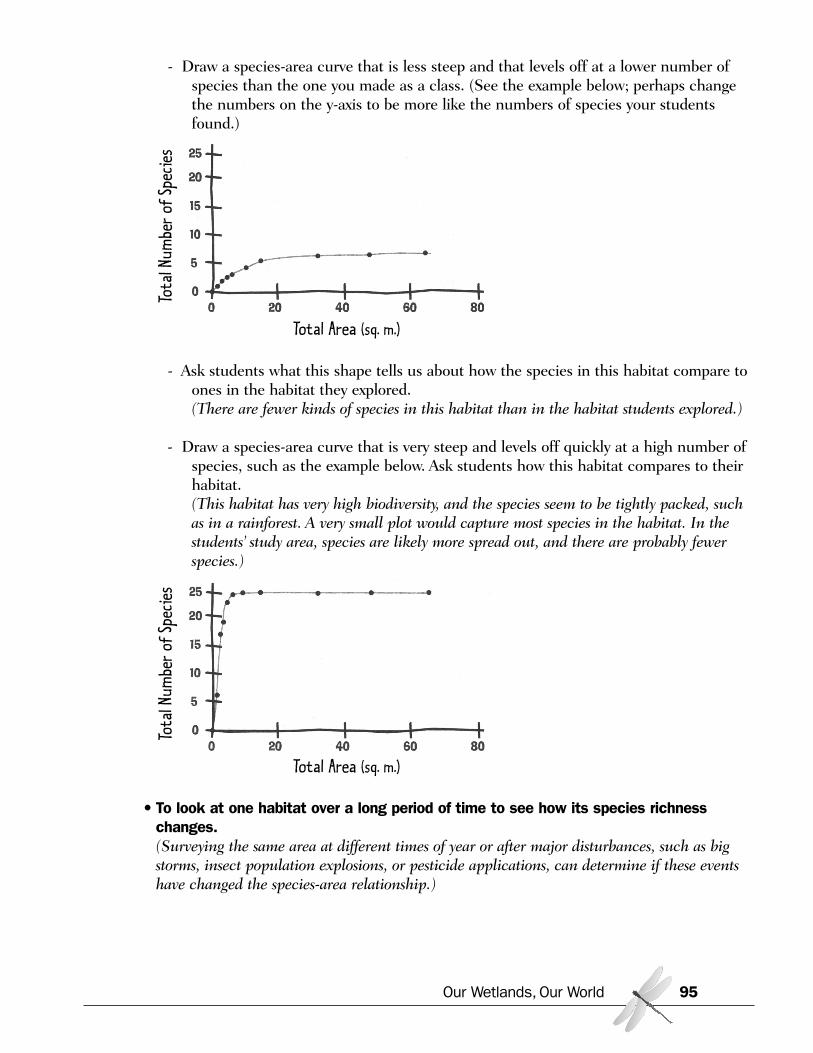
- Draw a species-area curve that is less steep and that levels off at a lower number ofspecies than the one you made as a class. (See the example below; perhaps changethe numbers on the y-axis to be more like the numbers of species your studentsfound.)
- Ask students what this shape tells us about how the species in this habitat compare toones in the habitat they explored.(There are fewer kinds of species in this habitat than in the habitat students explored.)
- Draw a species-area curve that is very steep and levels off quickly at a high number ofspecies, such as the example below. Ask students how this habitat compares to theirhabitat.(This habitat has very high biodiversity, and the species seem to be tightly packed, suchas in a rainforest. A very small plot would capture most species in the habitat. In thestudents’ study area, species are likely more spread out, and there are probably fewerspecies.)
• To look at one habitat over a long period of time to see how its species richnesschanges.(Surveying the same area at different times of year or after major disturbances, such as bigstorms, insect population explosions, or pesticide applications, can determine if these eventshave changed the species-area relationship.)
Our Wetlands, Our World 95
Tota
l Num
ber
of S
peci
es
Total Area (sq. m.)
Tota
l Num
ber
of S
peci
es
Total Area (sq. m.)
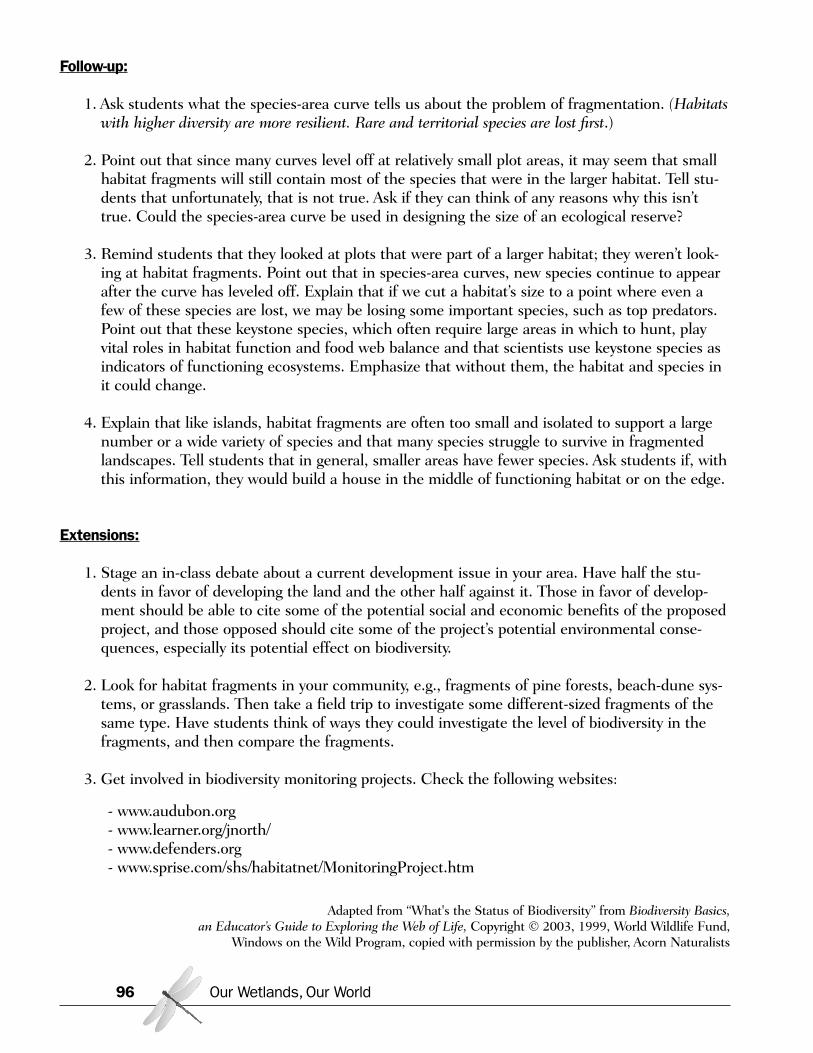
Follow-up:
1. Ask students what the species-area curve tells us about the problem of fragmentation. (Habitatswith higher diversity are more resilient. Rare and territorial species are lost first.)
2. Point out that since many curves level off at relatively small plot areas, it may seem that smallhabitat fragments will still contain most of the species that were in the larger habitat. Tell stu-dents that unfortunately, that is not true. Ask if they can think of any reasons why this isn’ttrue. Could the species-area curve be used in designing the size of an ecological reserve?
3. Remind students that they looked at plots that were part of a larger habitat; they weren’t look-ing at habitat fragments. Point out that in species-area curves, new species continue to appearafter the curve has leveled off. Explain that if we cut a habitat’s size to a point where even afew of these species are lost, we may be losing some important species, such as top predators.Point out that these keystone species, which often require large areas in which to hunt, playvital roles in habitat function and food web balance and that scientists use keystone species asindicators of functioning ecosystems. Emphasize that without them, the habitat and species init could change.
4. Explain that like islands, habitat fragments are often too small and isolated to support a largenumber or a wide variety of species and that many species struggle to survive in fragmentedlandscapes. Tell students that in general, smaller areas have fewer species. Ask students if, withthis information, they would build a house in the middle of functioning habitat or on the edge.
Extensions:
1. Stage an in-class debate about a current development issue in your area. Have half the stu-dents in favor of developing the land and the other half against it. Those in favor of develop-ment should be able to cite some of the potential social and economic benefits of the proposedproject, and those opposed should cite some of the project’s potential environmental conse-quences, especially its potential effect on biodiversity.
2. Look for habitat fragments in your community, e.g., fragments of pine forests, beach-dune sys-tems, or grasslands. Then take a field trip to investigate some different-sized fragments of thesame type. Have students think of ways they could investigate the level of biodiversity in thefragments, and then compare the fragments.
3. Get involved in biodiversity monitoring projects. Check the following websites:
- www.audubon.org- www.learner.org/jnorth/- www.defenders.org- www.sprise.com/shs/habitatnet/MonitoringProject.htm
Adapted from “What's the Status of Biodiversity” from Biodiversity Basics, an Educator’s Guide to Exploring the Web of Life, Copyright © 2003, 1999, World Wildlife Fund,
Windows on the Wild Program, copied with permission by the publisher, Acorn Naturalists
Our Wetlands, Our World96
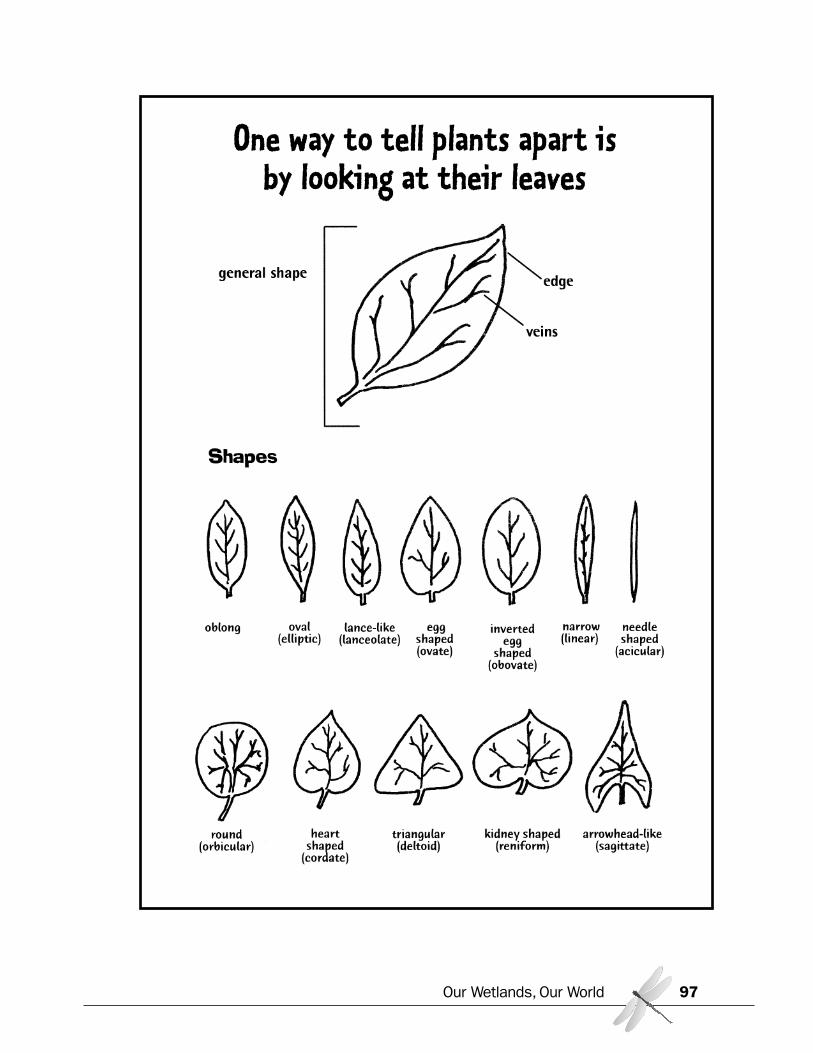
Our Wetlands, Our World 97
One way to tell plants apart isby looking at their leaves
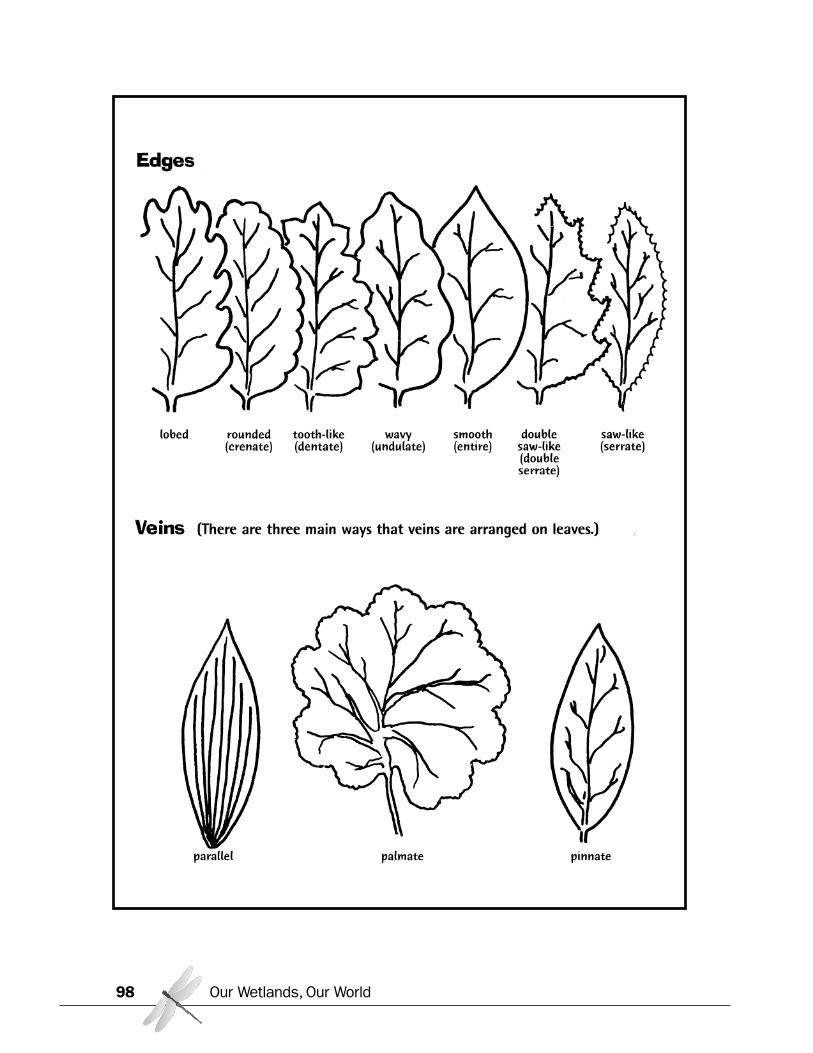
Our Wetlands, Our World98
Activity: Species In PerilSummary: In this activity, students will discover the distinctions between threatened, rare, and endan-gered species, prepare a report on threatened or endangered species that live in the Upper NewportBay, and explore the factors affecting species’ status.
Our Wetlands, Our World 99
California State Content Standards
SCIENCE
Biology/Life Sciences• Ecology 6a. Students know biodiversity is the sum
total of different kinds of organisms and is affected byalterations of habitats.
• Ecology 6b. Students know how to analyze changesin an ecosystem resulting from changes in climate,human activity, introduction of nonnative species, orchanges in population size.
• Ecology 6c. Students know how fluctuations in popu-lation size in an ecosystem are determined by the rela-tive rates of birth, immigration, emigration, and death.
• Evolution 8b. Students know a great diversity ofspecies increases the chance that at least some organ-isms survive major changes in the environment.
ENGLISH-LANGUAGE ARTS
Grades 9-10
Reading Comprehension• Structural Features of Informational Materials 2.2.
Prepare a bibliography of reference materials for areport using a variety of consumer, workplace, andpublic documents.
• Comprehension and Analysis of Grade-Level-Appro-priate Text 2.5. Extend ideas presented in primary orsecondary sources through original analysis, evalua-tion, and elaboration.
Writing Strategies• Organization and Focus 1.1. Prepare a bibliography
of reference materials for a report using a variety ofconsumer, workplace, and public documents.
• Organization and Focus 1.2. Use precise language,action verbs, sensory details, appropriate modifiers,and the active rather than the passive voice.
• Research and Technology 1.3. Use clear researchquestions and suitable research methods (e.g., library,electronic media, personal interview) to elicit andpresent evidence from primary and secondary sources.
• Research and Technology 1.4. Develop the mainidea within the body of the composition through sup-porting evidence (e.g., scenarios, commonly helpbeliefs, hypotheses, definitions).
• Research and Technology 1.5. Synthesize informa-tion from multiple sources and identify complexitiesand discrepancies in the information and the differentperspectives found in each medium (e.g., almanacs,microfiche, news sources, in-depth field studies,speeches, journals, technical documents).
Writing Applications• Expository Compositions 2.3
a. Marshal evidence in support of a thesis and relatedclaims, including information on all relevant per-spectives.
b. Convey information and ideas from primary andsecondary sources accurately and coherently.
c. Make distinctions between the relative value andsignificance of specific data, facts, and ideas.
d. Include visual aids by employing appropriate tech-nology to organize and record information oncharts, maps, and graphs.
e. Anticipate and address readers’ potential misunder-standings, biases, and expectations.
f. Use technical terms and notations accurately.
Our Wetlands, Our World100
Listening and Speaking Strategies• Organization and Delivery of Oral Communication
1.7. Use props, visual aids, graphs, and electronicmedia to enhance the appeal and accuracy of presen-tations.
Speaking Applications• Deliver Expository Presentations 2.2
a. Marshal evidence in support of a thesis and relatedclaims, including information on all relevant per-spectives.
b. Convey information and ideas from primary andsecondary sources accurately and coherently.
c. Make distinctions between the relative value andsignificance of specific data, facts, and ideas.
d. Include visual aids by employing appropriate tech-nology to organize and display information oncharts, maps, and graphs.
e. Anticipate and address the listener’s potential mis-understandings, biases, and expectations.
f. Use technical terms and notations accurately.
Grades 11-12
Writing Strategies• Research and Technology 1.6. Develop presentations
by using clear research questions and creative andcritical research strategies (e.g., field studies, oral his-tories, interviews, experiments, electronic sources).
• Research and Technology 1.8. Integrate databases,graphics, and spreadsheets into word-processed docu-ments.
Listening and Speaking Strategies• Organization and Delivery of Oral Communication
1.8. Use effective and interesting language, includ-ing:a. Informal expressions for effectb. Standard American English for clarityc. Technical language for specificity.
Objectives:Students will be able to:
• Define native and non-native species• Define threatened, rare, and endangered
species• Become familiar with state and federal
processes for listing and protecting threat-ened and endangered wildlife
• Identify threatened or endangered species inUpper Newport Bay and the factors thatcontribute to their peril
Materials:• Handouts
The Endangered Species ActSpecies In Peril chartThreatened and Endangered Species Report Guide
Preparation:• Make a copy of The Endangered Species Act
handout for each student• Make a transparency of the Species In Peril
chart or make a copy for each student.• Make seven copies of the Report Guide.• Make an overhead of the Species Status
Table (on the Report Guide) or copy it ontothe board or chart paper.
Time Required:• Class time – about 2 class periods• Research time – flexible
Procedures:
1. Hand out a copy of The Endangered Species Act to each student. Read and discuss the infor-mation. Ask students why the extinction of a species matters.
2. Place a copy of the Species in Peril chart on the overhead projector (or give a copy to each stu-dent). Discuss the definition of each term. Use the following questions to generate a discus-sion.
Why do you think these definitions were developed? How are they useful?Do you think any definitions could be improved?How might non-native species pose problems for threatened or endangered species?How might human activity be a problem for threatened species?How do you think protection of threatened or endangered species could be improved?
3. Explain that there are seven threatened or endangered species in Upper Newport Bay. Dividethe class into seven groups and tell students that each group will prepare a report on one of thenine threatened or endangered species in Upper Newport Bay.
4. Hand out a copy of the Report Guide to each group. Assign a different species from the SpeciesStatus Table to each group. Encourage students to call land managers at Orange County PublicFacilities and Resources Department or at the Department of Fish and Game, to interviewlong-time residents, to use the Internet, and to read books and articles to gather information.
5. Tell students how much time they have to prepare their reports. Arrange for students to havesome class time to work together on their reports.
6. Have each group present its report to the class, answering the questions on the Report Guide.Place a copy of the Species Status Table on the overhead (or copy it onto the board or chartpaper). As each group reports, fill in the Species Status Table.
Follow-up:
Discuss the Species Status Table.
1. Ask why some species are on the California list but not on the federal list. (These differences occur because habitats, and the species that live in them, cross state lines. Ananimal or plant may have been lost within one state’s boundaries, but may be abundant in anoth-er and therefore not considered threatened federally by USFWS.)
2. Discuss the factors affecting each species. Do some factors affect more than one species? Howcould the impact of some of these factors be reduced?(Setting conservation priorities based on public definition of which species are most “lovable” isclearly not ideal.)
3. Discuss strategies to protect multiple species under one recovery plan.
Our Wetlands, Our World 101
4. Have students guess which species group has the most listings. Which group receives the mostrecovery funds? (31 Mammals, 13 Reptiles, 12 Amphibians, 33 Birds, 34 Fish, 218 Plants, 32 Invertebratesspecies are listed. Seventy percent of listed mammals are afforded protection; in contrast, the aver-age percentage of protection for all other taxa is less than 15%. Plants are the least protected: theyrepresent 50% of the listed species yet they receive only 8% of the recovery funds.)
Extensions:
1. Research an invasive species in Upper Newport Bay (e.g., wild mustard, pampas grass, Africanclawed frog). Explain how it is impacting native California species, and describe possible solu-tions to the problem.
2. Research native species in your area. Try to find native species in nature. Record observationssuch as: location, habitat description, abundance, cohabitants, and competitors.
3. Write a report on how the Endangered Species Act could be improved. Identify taxonomic biasby comparing the number of animals and plants or birds and fish that have been listed. Whatpercent of recovery funds are spent on whales versus trees? Are the standards against whichdecisions for selecting species to list as endangered or threatened objective and measurable?How many species have been delisted?
Adapted from “What’s So Special About Native Species?”in Waves, Wetlands, and Watersheds: California Coastal Commission Science Activity Guide
Our Wetlands, Our World102
The Endangered Species Act
Although extinction is a natural process, human activities have caused a dramaticincrease in its rate. Human beings have become a hundred times more numerous thanany other land animal of comparable size in the history of life. Our species appropri-ates 40 percent of the solar energy captured in organic material by plants. Drawingupon the resources of the planet to such a degree drastically affects other species.Some scientists estimate that human activity is responsible for the extinction of 100plants and animals each day—that’s almost four species extinctions per hour. Otherscientists offer lower figures, but few experts disagree that the rate of species extinctionis being accelerated by human actions.
The U.S. Endangered Species Act of 1973 gives authority the U.S. Secretary of theInterior, or in the case of marine species to the Secretary of Commerce, to placespecies on an endangered list. Implementation of the Endangered Species Act is over-seen by the U.S. Fish and Wildlife Service (USFWS) and the National Marine Fish-eries Service. Proposals to list or delist a species are published in the Federal Register, aU.S. government publication, and after a public comment period, the USFWS decideswhether to approve, revise, or withdraw the proposal. In California, the Department ofFish and Game identifies the state’s species of concern.
Listed species have special protection, and any project that threatens one of thesespecies must undergo an intensive review. The endangered species list includes recov-ery plans for each species, detailing the tasks needed to reach a level where protectionfor that species is no longer necessary.
Our Wetlands, Our World 103
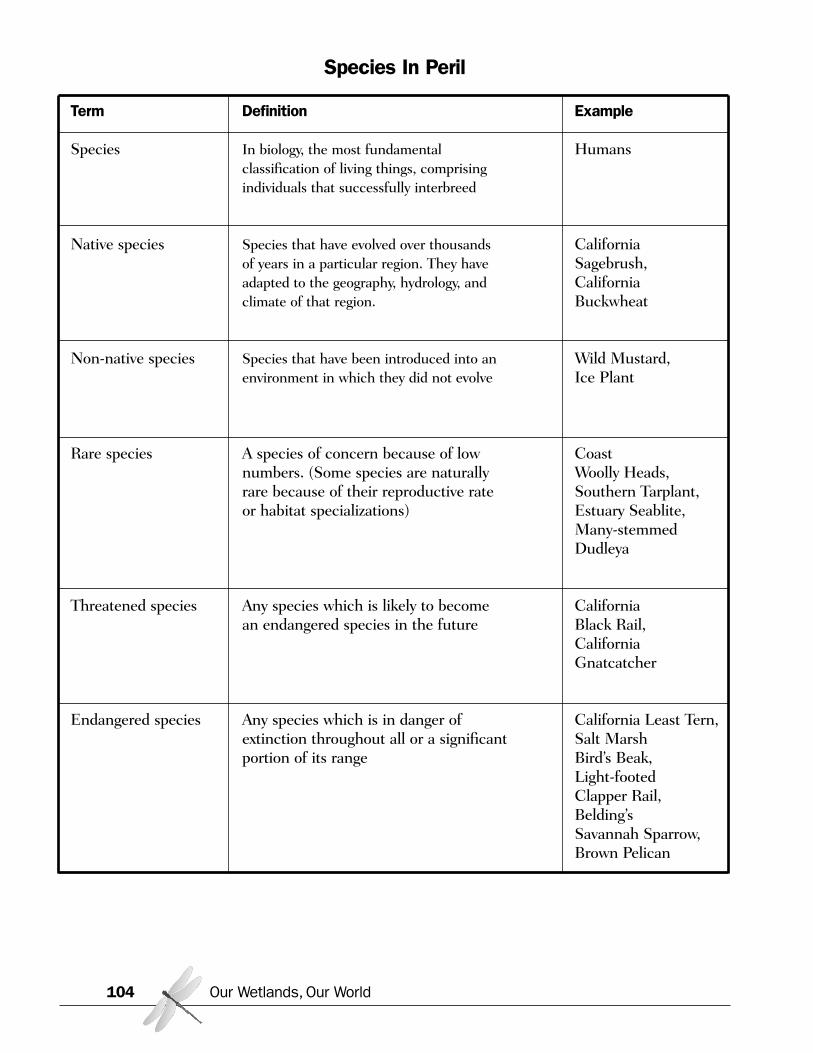
Species In Peril
Term Definition Example
Species In biology, the most fundamental Humansclassification of living things, comprising individuals that successfully interbreed
Native species Species that have evolved over thousands California of years in a particular region. They have Sagebrush,adapted to the geography, hydrology, and Californiaclimate of that region. Buckwheat
Non-native species Species that have been introduced into an Wild Mustard,environment in which they did not evolve Ice Plant
Rare species A species of concern because of low Coastnumbers. (Some species are naturally Woolly Heads,rare because of their reproductive rate Southern Tarplant,or habitat specializations) Estuary Seablite,
Many-stemmedDudleya
Threatened species Any species which is likely to become Californiaan endangered species in the future Black Rail,
CaliforniaGnatcatcher
Endangered species Any species which is in danger of California Least Tern,extinction throughout all or a significant Salt Marshportion of its range Bird’s Beak,
Light-footedClapper Rail,Belding’s Savannah Sparrow,Brown Pelican
Our Wetlands, Our World104
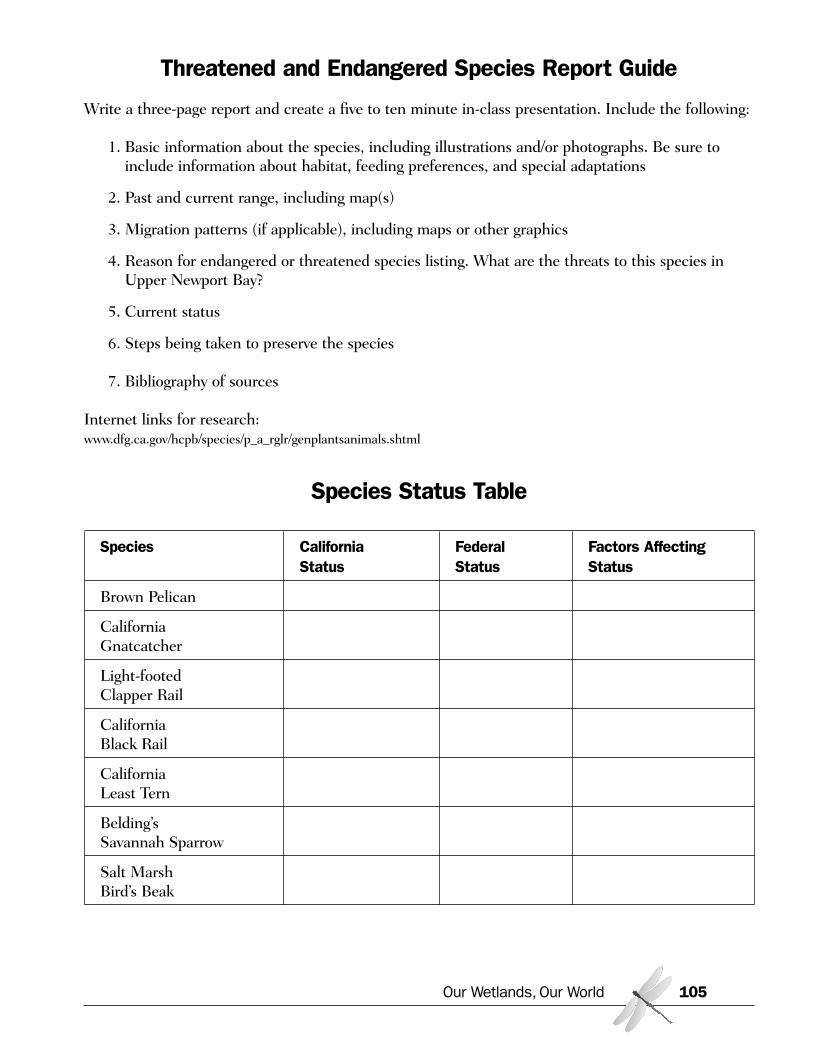
Threatened and Endangered Species Report Guide
Write a three-page report and create a five to ten minute in-class presentation. Include the following:
1. Basic information about the species, including illustrations and/or photographs. Be sure toinclude information about habitat, feeding preferences, and special adaptations
2. Past and current range, including map(s)
3. Migration patterns (if applicable), including maps or other graphics
4. Reason for endangered or threatened species listing. What are the threats to this species inUpper Newport Bay?
5. Current status
6. Steps being taken to preserve the species
7. Bibliography of sources
Internet links for research:www.dfg.ca.gov/hcpb/species/p_a_rglr/genplantsanimals.shtml
Our Wetlands, Our World 105
Species Status Table
Species California Federal Factors Affecting Status Status Status
Brown Pelican
California Gnatcatcher
Light-footed Clapper Rail
California Black Rail
California Least Tern
Belding’s Savannah Sparrow
Salt Marsh Bird’s Beak
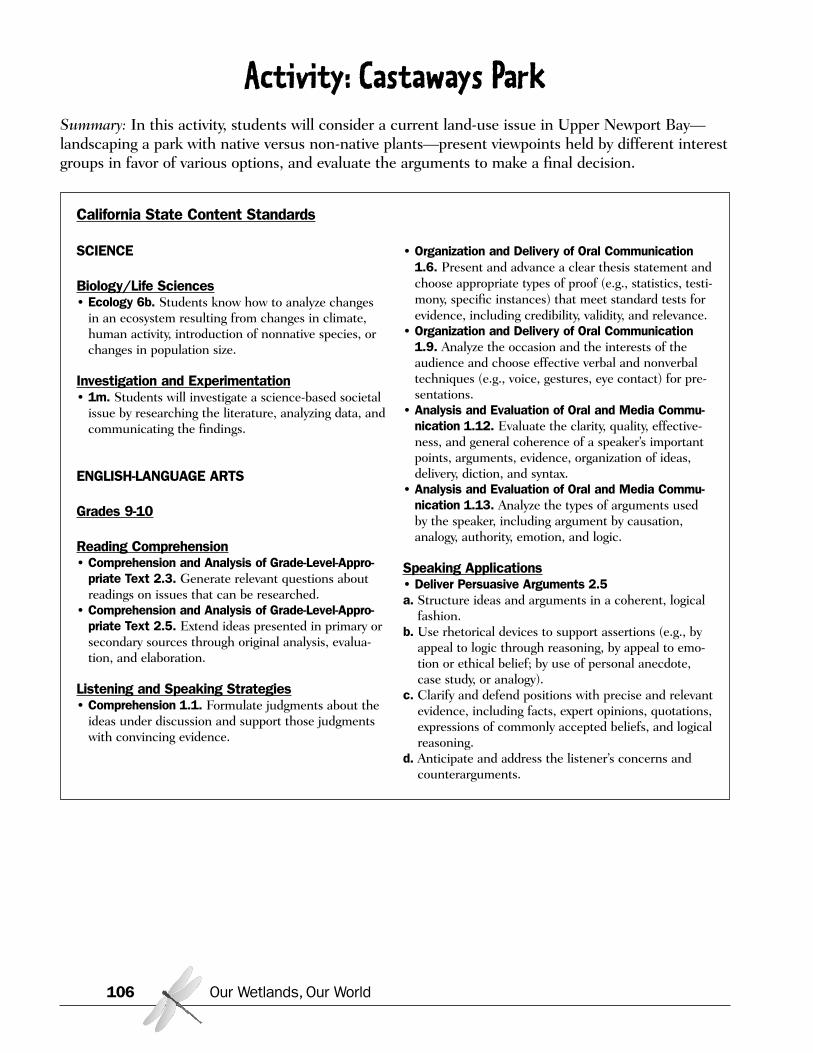
Activity: Castaways ParkSummary: In this activity, students will consider a current land-use issue in Upper Newport Bay—landscaping a park with native versus non-native plants—present viewpoints held by different interestgroups in favor of various options, and evaluate the arguments to make a final decision.
Our Wetlands, Our World106
California State Content Standards
SCIENCE
Biology/Life Sciences• Ecology 6b. Students know how to analyze changes
in an ecosystem resulting from changes in climate,human activity, introduction of nonnative species, orchanges in population size.
Investigation and Experimentation• 1m. Students will investigate a science-based societal
issue by researching the literature, analyzing data, andcommunicating the findings.
ENGLISH-LANGUAGE ARTS
Grades 9-10
Reading Comprehension• Comprehension and Analysis of Grade-Level-Appro-
priate Text 2.3. Generate relevant questions aboutreadings on issues that can be researched.
• Comprehension and Analysis of Grade-Level-Appro-priate Text 2.5. Extend ideas presented in primary orsecondary sources through original analysis, evalua-tion, and elaboration.
Listening and Speaking Strategies• Comprehension 1.1. Formulate judgments about the
ideas under discussion and support those judgmentswith convincing evidence.
• Organization and Delivery of Oral Communication1.6. Present and advance a clear thesis statement andchoose appropriate types of proof (e.g., statistics, testi-mony, specific instances) that meet standard tests forevidence, including credibility, validity, and relevance.
• Organization and Delivery of Oral Communication1.9. Analyze the occasion and the interests of theaudience and choose effective verbal and nonverbaltechniques (e.g., voice, gestures, eye contact) for pre-sentations.
• Analysis and Evaluation of Oral and Media Commu-nication 1.12. Evaluate the clarity, quality, effective-ness, and general coherence of a speaker’s importantpoints, arguments, evidence, organization of ideas,delivery, diction, and syntax.
• Analysis and Evaluation of Oral and Media Commu-nication 1.13. Analyze the types of arguments usedby the speaker, including argument by causation,analogy, authority, emotion, and logic.
Speaking Applications• Deliver Persuasive Arguments 2.5a. Structure ideas and arguments in a coherent, logical
fashion.b. Use rhetorical devices to support assertions (e.g., by
appeal to logic through reasoning, by appeal to emo-tion or ethical belief; by use of personal anecdote,case study, or analogy).
c. Clarify and defend positions with precise and relevantevidence, including facts, expert opinions, quotations,expressions of commonly accepted beliefs, and logicalreasoning.
d. Anticipate and address the listener’s concerns andcounterarguments.
Our Wetlands, Our World 107
Grades 11-12
Listening and Speaking Strategies• Organization and Delivery of Oral Communication
1.6. Use logical, ethical, and emotional appeals thatenhance a specific tone and purpose.
• Organization and Delivery of Oral Communication1.8. Use effective and interesting language, including:
a. Informal expressions for effectb. Standard American English for clarityc. Technical language for specificity.
• Analysis and Evaluation of Oral and Media Communi-cations 1.11. Critique a speaker’s diction and syntaxin relation to the purpose of an oral communicationand the impact the words may have on the audience.
• Analysis and Evaluation of Oral and Media Communi-cations 1.12. Identify logical fallacies used in oraladdresses (e.g., attack ad hominem, false causality, redherring, overgeneralization, bandwagon effect).
HISTORY/SOCIAL SCIENCE
• Principles of American Democracy 12.7.5. Explainhow public policy is formed, including the setting ofthe public agenda and implementation of it throughregulations and executive orders.
• Principles of Economics 12.1.3. Identify the differ-ence between monetary and nonmonetary incentivesand how changes in incentives cause changes inbehavior.
Objectives:Students will be able to:• Determine some of the effects of planting
native or non-native plants• Present arguments in favor of one or more
viewpoints concerning land use• Evaluate arguments
Materials:• Handouts
Castaways Park BackgroundCastaways Park Interest GroupsStop-watch or clock with second-hand
Preparation:• Make a copy for each student of the Castaways
Park Background handout.• Make a copy for each group of the Castaways
Park Interest Groups handout.
Time Required:Approximately 2 class sessions
Procedures:
Session One
1. Remind students that deciding how land should be used is not always easy, as people have dif-ferent values, interests, and ideas. Explain that they are going to look at a recent land use con-troversy that affected Upper Newport Bay.
2. Distribute to each student a copy of the Castaways Park Background. Tell students that itdescribes a real issue in Newport Beach concerning a park that represented one of the lastremaining undeveloped pieces of land adjacent to the Bay. Have students read the information.
3. Discuss the various options presented. Ask students to predict who in the community wouldfavor each option. Have students vote on the option they support and record this as the initialtally.
4. Divide students into 10 groups. Hand out copies of Castaways Park Interest Groups. Assigneach student group to represent one of the interest groups listed.
5. Explain that each group will present their viewpoint at a mock City Council meeting staged inthe class. Tell students not only to use the information presented on the handout but also toresearch other points that may be relevant to their choice. Encourage students to read theinformation about all the interest groups—and to determine the pros and cons of eachoption—so that they can be prepared to counter the arguments raised by groups in favor ofother options.
6. Inform students that presentations will be limited to five minutes, including a two-minutequestion session. Tell each group to designate spokespersons to present the group’s viewpointsand to question others at the City Council meeting. Allow students time to work on their pre-sentations. Inform students when the City Council meeting will take place.
Session Two
1. Seat the City Council Members facing the audience. Call the City Council meeting to order.Have one of the council members review the Castaways Park issue and options
2. Explain that there will be no interruptions and that question sessions will follow each presenta-tion. Encourage students to take notes so they can present counterarguments during the ques-tion sessions.
3. Open the floor for each interest group to present. Be sure to stop presentations after threeminutes and stop question sessions after two-minutes.
Our Wetlands, Our World108
Follow-up:
1. Take a Council vote to see if any clear decision has been reached. Take a class-wide vote anddiscuss any changes from the initial tally.
2. Discuss the process.What challenges did they face in coming to a decision?Were any of the groups’ arguments particularly convincing?What compromises can be made?
3. Discuss what has happened in Castaways Park. On September 23, 2002, the Newport BeachCity Council approved Option 2 with a 4-2 vote. Meadow sedge, a hardy native, replaced theplan for wildflowers and grasses on the bluff while the remainder of the native plant palettewas unchanged. There was a large community turnout at the meeting with native park support-ers outnumbering others by three to one.
Extensions:
1. Collect newspaper articles concerning local water-related and land-use issues and discuss theoptions. Attend a city council meeting and be prepared to voice your opinion.
2. Learn more about environmental impact reports (EIRs). Obtain copies of EIRs for wetlands inyour area. What concerns are addressed in these documents?
3. Research zoning laws and land use regulations in your area. Would any of the laws affect theoutcome at Castaways Park?
Our Wetlands, Our World 109
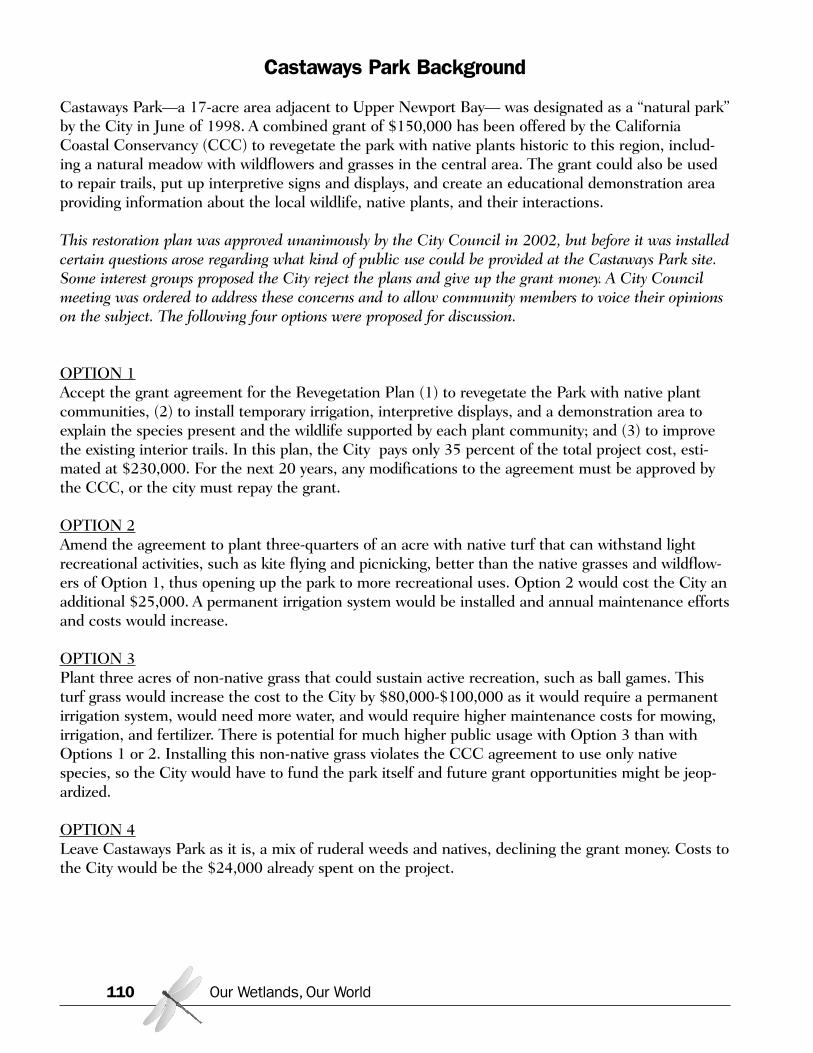
Castaways Park Background
Castaways Park—a 17-acre area adjacent to Upper Newport Bay— was designated as a “natural park”by the City in June of 1998. A combined grant of $150,000 has been offered by the CaliforniaCoastal Conservancy (CCC) to revegetate the park with native plants historic to this region, includ-ing a natural meadow with wildflowers and grasses in the central area. The grant could also be usedto repair trails, put up interpretive signs and displays, and create an educational demonstration areaproviding information about the local wildlife, native plants, and their interactions.
This restoration plan was approved unanimously by the City Council in 2002, but before it was installedcertain questions arose regarding what kind of public use could be provided at the Castaways Park site.Some interest groups proposed the City reject the plans and give up the grant money. A City Councilmeeting was ordered to address these concerns and to allow community members to voice their opinionson the subject. The following four options were proposed for discussion.
OPTION 1Accept the grant agreement for the Revegetation Plan (1) to revegetate the Park with native plantcommunities, (2) to install temporary irrigation, interpretive displays, and a demonstration area toexplain the species present and the wildlife supported by each plant community; and (3) to improvethe existing interior trails. In this plan, the City pays only 35 percent of the total project cost, esti-mated at $230,000. For the next 20 years, any modifications to the agreement must be approved bythe CCC, or the city must repay the grant.
OPTION 2Amend the agreement to plant three-quarters of an acre with native turf that can withstand lightrecreational activities, such as kite flying and picnicking, better than the native grasses and wildflow-ers of Option 1, thus opening up the park to more recreational uses. Option 2 would cost the City anadditional $25,000. A permanent irrigation system would be installed and annual maintenance effortsand costs would increase.
OPTION 3Plant three acres of non-native grass that could sustain active recreation, such as ball games. Thisturf grass would increase the cost to the City by $80,000-$100,000 as it would require a permanentirrigation system, would need more water, and would require higher maintenance costs for mowing,irrigation, and fertilizer. There is potential for much higher public usage with Option 3 than withOptions 1 or 2. Installing this non-native grass violates the CCC agreement to use only nativespecies, so the City would have to fund the park itself and future grant opportunities might be jeop-ardized.
OPTION 4Leave Castaways Park as it is, a mix of ruderal weeds and natives, declining the grant money. Costs tothe City would be the $24,000 already spent on the project.
Our Wetlands, Our World110
Castaways Park Interest Groups
Council Members If the City rejects this grant, breaking the previous agreement, you fear that obtaining future grantsfor upcoming projects from the CCC and other environmental organizations may prove difficult. Youare aware that other open spaces in the City are also suitable for native plantings in the future ifother grants can be secured. It is important to keep your voters happy. You will have to vote on a deci-sion by the end of the meeting, so you must be prepared to ask questions from the community repre-sentatives.
The California Coastal Conservancy (CCC)Your Revegetation Plan would create a unique all-native park that would be a leading example to therest of the county. A special Castaways Park Advisory Committee, consisting of representatives of theneighborhood and experts from a broad spectrum of fields, was created in order to come up with avegetation plan that took safety, education, water conservation, recreation, esthetics, and the preser-vation of native wildlife into consideration. For these reasons, you feel that Option 1 is the bestchoice for the creation of a successful self-sustaining native park, but you are willing to acceptOption 2.
Department of Water Conservation and Management (DWCM) Southern California is a region known to experience periodic droughts. Grass lawns require largeamounts of water. Since water is a limited resource, using native plants to vegetate Castaways Parkwill not only save money on water bills but also set a good example for water-wise gardening. Also, itis possible the runoff from irrigating grass lawns would contaminate the adjacent wetlands with fertil-izers, herbicides, and pesticide residues. You support Option 1.
Fire DepartmentWhile all four options retain provisions for fire safety, you feel that Option 1 is the best, thoughwould accept 2 or 3. Some of the non-native plants currently growing in Castaways Park catch fireeasily. The fire abatement costs for periodically clearing brush from the site is $25,000 per year. TheFire Marshal provided the Castaways Advisory Committee with a list of native fire retardant plants fortheir Vegetation Plan. Replacing the non-native plants with coastal sage might help reduce the costsof fire abatement, and the money saved could be used elsewhere.
Homeowner’s AssociationYou live adjacent to Castaways Park. Neighbors of nearby Bob Henry Park, which is largely a turf areadesignated for active recreation, have complained of trash and noise pollution due to the high num-ber of people that come to use its grassy field. The residents of your community are concerned that alarge grass area added to Castaways Park will draw a noisier and messier crowd. Furthermore, you arefamiliar with the drainage problems at Castaways Park, particularly near the bluff. You fear that waterused in the regular irrigation of grass areas could seep underground and create dangerous instabilityand erosion near the bluff. You don’t wish for the possibility of trash, noise, or land disturbance inyour neighborhood, and support Options 1 or 2. Why replicate Bob Henry’s turf park next-door?
Naturalist VolunteersYou have noticed increased wildlife visitation in areas you’ve helped restore in Upper Newport Bayand have a great appreciation for the knowledge you’ve gained about native plants. You feel it is
Our Wetlands, Our World 111
important to have Castaways Park become an all native park to compliment the adjacent wetlands atUpper Newport Bay. This would expand the habitat of the animals by allowing them to cross fromone park to the other and utilize the resources of both. You think the general public would enjoy andbenefit from the opportunity to learn plant identification, so you encourage interpretive signage at anative park. You support Option 1, but would accept the compromise of Option 2.
Local Organization of RetireesYou truly appreciate parks for both the scenery and the outdoor activity they allow. You enjoy seeingyour grandson fly his kite at the park, having picnics with your friends, bird watching with the localclub, and reading and snoozing in the sun. If the central meadow area is planted with just nativegrasses, some recreational activities may not be possible. Also you believe that native grasses arebrown and ugly during the summer and that coastal sage scrub may have thorns that could poke peo-ple enjoying the meadow. You prefer Option 3.
City Recreation DepartmentThe City has few practice fields and scheduling practice times can be difficult. The City recently cre-ated a Parks Ranger Program to police the parks because fights have occurred over who gets to usethe space. You understand Castaways Park is designated for only passive recreation such as strolling,bird watching, or reading. You support Option 3, in the hopes that adding grass to Castaways Parkmight relieve some of the congestion at local fields.
Local Hiking GroupYou enjoy hiking at parks around Newport Bay. On numerous occasions, you have observed peopleleaving the designated trails and entering into restricted areas. You feel that if there were more parksaround the Bay where people could wander freely, they would pay greater respect to parks withrestricted areas. Castaways Park should become an area where people can explore nature withoutworry of breaking the rules. Besides, the existing native parks currently lack enough people policingthe area to stop the destructive activities occurring in fragile habitats. Why add a new park withrestricted areas when other parks aren’t adequately protected? You support Option 4.
Community Park FoundationYou support the local parks and believe that the rules of the CCC agreement are too strict. You feelthat the City should have more control over how to use and design the park—whether planted withnative or non-native plants. A 20-year commitment is too long to give up control of this prime proper-ty. The great views and location of Castaways Park give the land an estimated worth of $17 million.Why give up control of a multi-million dollar property to outside sources in order to save $150,000?You support Option 3 or 4, whatever it takes to not accept the terms of the grant.
Our Wetlands, Our World112

TAKING ACTIONIn the 1970’s, with approximately half of the wetland acreage in the United States lost to develop-ment, agriculture, and other land uses, the government finally began to take action to protect whatremained—through federal and state legislation.
One federal law—the Clean Water Act—contains provisions (Section 404) to improve the water qual-ity of wetlands and protect wetlands from development. Section 404 does not prohibit developmentin wetlands. But if properly enforced, it does provide a way to control wetland destruction andencourage more ecologically sound alternatives. In California, the California Coastal Act providesadditional protection for wetlands and other sensitive habitats. Both of these laws provide opportuni-ties for public review and comment on proposed developments.
Though these laws do provide some protection for wetlands, many people believe that more needs tobe done to prevent additional wetland losses and to restore wetlands that have been dredged, drained,or polluted.
Restoration
Many of our remaining wetlands have been degraded so that they no longer support the diversity ofwildlife that once existed there. These wetlands may benefit from restoration.
Can We Restore Nature?As it applies to nature, the term “restoration” means different things to different people. To some,restoration means recreating what existed in the past. To others, it is re-establishing a portion of thevalues and functions of a damaged ecosystem. In many cases, complete re-creation of a pre-existingecosystem is not feasible. Factors that restrict our ability to completely restore a degraded ecosysteminclude:
• human-built constraints, such as bridges, roads, upstream dams, and other developments• our limited scientific knowledge of what it takes to successfully restore an area• limited funds—restoration can be very expensive.
Restoration usually focuses on the whole ecosystem, not on a single species. In spite of difficultiesand constraints, restoration projects strive to replicate as many of the values and functions of theoriginal ecosystem as possible, to support multiple native species and create a healthy, self-sustainingsystem.
Restoring wetlands—replicating the complex physical, chemical, and biological interactions—is notquick or easy. It is a process that takes place over a long time. Restoration often requires:
• Re-establishing water flow to support wetland plant communities. This may mean redirecting ariver back into the wetlands, removing dams, or dredging certain areas.
Our Wetlands, Our World 113
• Controlling pollution. Determining and decreasing sources of contaminants that enter the wet-land can be accomplished through educating the public and developing and enforcing laws.
• Re-establishing functional habitat. This may involve removing invasive species, growing andinstalling native plants, and maintaining the restored habitat by weeding and watering.
• Creating habitat links so that species can breed and maintain genetic diversity. This may requirebridging roads or establishing “green-ways” in order to connect existing habitats so that wildlifecan travel between isolated patches.
• Long-term monitoring and adaptive management. Measuring plant survival, wildlife usage, andother wetland functions provides information on what is working and what can be improved toachieve goals. Using an adaptive management strategy enables ecologists to respond to chang-ing conditions and needs.
Some of the goals of restoration are for the wetlands to become:• sustainable, with vegetation maintaining and replacing itself over time, independent of human
help• resistant to invasion by non-native species• diverse, with a range of habitats and species.
Restoring UNBYears of rapid urban growth have seriously degraded the wetlands of Upper Newport Bay (UNB).Some existing problems include:
• water containing pesticides and heavy metals from urban runoff at levels toxic to aquatic life
• trespassers and dogs disturbing the nesting areas of the endangered Least Tern, Belding’sSavannah Sparrow, and Light-footed Clapper Rail
• invasive species, which represent almost half of the plant life at UNB, displacing native commu-nities; many plants and animals that exist nowhere else depend on UNB, but with the contin-ued disappearance of native habitat, these species are threatened with extinction.
Recognizing that southern California’s coastal wetlands are of vital ecological, hydrological, and eco-nomic significance, the California Coastal Commission selected Upper Newport Bay, the region’slargest wetland, to pilot a Community-Based Restoration and Education Program. CBREP recruitsvolunteers from the general public and schools to restore habitat at UNB. Program volunteers have:
• removed thousands of pounds of invasive plants• created a native plant nursery • planted natives that support indigenous wildlife• monitored restoration sites for vegetation coverage and wildlife usage.
Volunteers also remove more than 15 tons of trash each year that washes into the Bay and endangersits wildlife and blemishes its beauty. Other groups working in conjunction with CBREP to restoreand protect the Bay include the California Department of Fish and Game, Orange County HarborsBeaches and Parks, the City of Newport Beach, and the Newport Bay Naturalists and Friends.
Our Wetlands, Our World114
Stewardship
Without help, the sensitive habitats of Upper Newport Bay—as well as other wetland areas—willcontinue to be threatened. Although we have halted the high rate of wetland destruction, much workremains to be done to protect and restore remaining wetlands. Everyone can help.
Environmental stewardship is an understanding that we are both caretakers of and dependent on thenatural environment. Human health and well-being depend on clean water and air and on function-ing ecosystems. As humans, we have the power to decide how we want to live in the world—whetherwe are going to exploit the environment for short-term gains or live in harmony with it. By recogniz-ing our interdependence with the natural world, we begin to take responsibility for its future and ourown.
Ultimately what is good for our natural environment is good for us as well. We benefit in many ways from maintaining and restoring natural places like Upper Newport Bay.Besides providing flood protection and a system for filtering water, wetlands provide habitat and nurs-eries for plants, fish, birds, and other wildlife, and also offer important open space for people to bike,jog, kayak, or simply walk or sit and observe nature’s beauty.
Each of us, as individuals and as groups, can help improve and restore our wetlands and other sensi-tive habitats by getting involved.
First, learn about the importance of wetlands and other sensitive habitats, and the issues thataffect these natural environments. Share your knowledge with others.
Second, be active. Participate in clean-up days or restoration events. Plant natives in your back-yard and enjoy the wildlife they attract. And get others involved. When people help pick up thetrash that has collected downstream or keep track of the quality of the water in the Bay, theybecome aware of such harmful habits as littering or washing the car in their driveway.
Third, participate in the decision-making process. Government officials who make decisions con-cerning wetlands and other sensitive habitats need to hear your views. Write letters and attendpublic hearings. And whenever possible, let your voice be heard by voting.
Protection and restoration of our natural environment is possible if government and the residents inthe watershed work together. The value of restoration is not just its ability to transform the landscapebut also its ability to educate and transform the human beings who inhabit and shape it.
Our Wetlands, Our World 115
Activity: Seed ExperimentsSummary: Students germinate seeds, compare plant growth and health, introduce variations in soil,and gather and analyze data on optimal conditions for plant growth.
Our Wetlands, Our World116
California State Content Standards
SCIENCE
Chemistry• Acids and Bases 5a. Students know the observable
properties of acids, bases, and salt solutions.• Acids and Bases 5d. Students know how to use the
pH scale to characterize acid and base solutions.
Biology/Life Sciences• Ecology 6b. Students know how to analyze changes
in an ecosystem resulting from changes in climate,human activity, introduction of nonnative species, orchanges in population size.
• Ecology 6e. Students know a vital part of an ecosys-tem is the stability of its producers and decomposers.
Investigation and Experimentation• 1a. Students will select and use appropriate tools and
technology (such as computer-linked probes, spread-sheets, and graphing calculators) to perform tests, col-lect data, analyze relationships, and display data.
• 1b. Students will identify and communicate sourcesof unavoidable experimental error.
• 1c. Students will identify possible reasons for incon-sistent results, such as sources of error or uncon-trolled conditions.
• 1d. Students will formulate explanations by usinglogic and evidence.
MATHEMATICS
• Probability and Statistics 6.0. Students know thedefinitions of the mean, median, and mode of a distri-bution of data and can compute each in particular sit-uations.
Objectives:Students will be able to:
• Germinate seeds• Analyze data on plant growth
Materials:• Seeds with high germination rates;
if growing plants for a restoration project,use California native plants:- Goldenbush – Haplopappus venetus - Bush Sunflower – Encelia californica- Sagebrush – Artemisia californica
• Newspaper• Plastic wrap• Water spray bottle• Water• Seeding flats• Liners (small plant pots)• Potting soil• (optional) Seed-starter mix (may produce
better germination)
• Substances to change soil conditions (not too toxic!), such as baking soda, vinegar,fertilizer, sand, salt, etc.
• Handouts - Observation Worksheet
(Parts 1, 2, 3, and 4)- Planting Techniques
Preparations:• Make a copy of the 4 parts of the Observa-
tion Worksheet for each student or group
Time Required:• Three 50-minute class periods• 5 minutes each day for 2 weeks for observing
and recording
Note: The Community-based Restoration andEducation Program at Upper Newport Bay mayprovide seeds, flats, and pots; call 949-640-0286.
Procedures:
Part I – One 50-minute class period plus 5 minutes for observation/recording each day for thenext week.
1. Distribute to each student or group:- seeding flat- seed-starter mix or potting soil- three different kinds of seeds- Part 1 of the Observation Worksheet
2. Ask students to complete questions 1 through 3 on their worksheets:- the common and scientific names of the seeds- a description of the seeds- a prediction of the number of days for the seeds to germinate (to sprout)
3. Have students sow their seeds following these directions:- Fill a container with drainage holes to the top with seed-starter mix or potting soil; pat down
lightly and uniformly.- Water thoroughly. After watering, the surface of the soil should still be level. - Broadcast the seeds evenly on the surface. - Sprinkle seed-starter mix or potting soil to cover the seeds to a depth equal to one or two
times its smallest diameter. Seeds sown too deeply will not produce seedlings. - Spray the soil with water and place the container in a sheltered location out of direct sun-
light. - Use masking tape and a marker to label the species, date, and student or group name on the
container. - For protection and moisture retention, enclose the container in a plastic bag or piece of plas-
tic wrap, with a sheet of newspaper on top to prevent heat build-up. - During the germination period (1-2 weeks), keep the surface of the soil moist. As seeds start
to germinate, remove the newspaper and plastic.
4. Have students record daily observations on Part I of the Observation Worksheet.
Part II – One 50-minute class period plus 5 minutes for observation/recording each day for thenext week.
1. Distribute to each student or group Part 2 of the Observation Worksheet.
2. Use the questions on the worksheet to have students compare and compile data on the germi-nation of their seeds.
3. Explain that to demonstrate the importance of soil composition and the effects of contami-nants in soils, they are going to plant their seeds in different soil mediums. Ask students whatpollutants might be absorbed into soils, how long these contaminants might last, and howthey might be cleaned from the soil? Have students choose the variations they will introduce.
Our Wetlands, Our World 117
Possibilities include:- adding acidic or basic substances such as vinegar and baking soda to change the pH- adding sand or salt to alter the soil composition- using various fertilizers- using soil from the yard- over-watering
4. Have students transplant their seedlings following these directions:- When the seedlings are large enough to handle, prepare the contaminated soils and fill liners
2/3 full. Water the liners. Fill at least one liner with unaltered potting soil to act as a control.Transplant extra seedlings into potting soil to grow for restoration.
- Lift each seedling out with a fork or knife to protect the tender roots.- Gently hold the seedling with roots dangling above the liner soil and sprinkle more soil
around the roots until they are buried.- Lightly press the soil around the root crown and add more soil until the seedling is planted
to the same depth as it was in the flat.
5. Distribute to each student or group Part 3 of the Observation Worksheet. Ask students to fill inquestions 1 through 3 on their worksheets.
6. For the next week, have students monitor plant growth and health and record their observa-tions on their worksheets.
Part III – One 50-minute class period.
1. Distribute to each student or group Part 4 of the Observation Worksheet.
2. Use the questions on the worksheet to have students compare and compile data on the growthof their plants.
Follow-up:
Follow the Planting Techniques to plant the native seedlings on the schoolgrounds or at Upper New-port Bay after the first rain of the season. (Contact UNB Restoration Project to arrange for planting.)
Extension:
Have students calculate the variance and the standard deviation of the time that it took for all theseeds in the classroom to germinate. Explain that variance and standard deviation are indices thatstatisticians use to characterize differences in a population.
x = the number of days to germination
mean = average
Variance = (x for Seed 1 – mean germination of all seeds)2 + (x for Seed 2 – mean germination of all seeds)2 + …etc.____________________________________________________________________________________________Total number of seeds
Standard Deviation = the square root of the variance
Adapted from “Seed Experiments” from National Park Labs Curriculum, National Park Service at the Golden Gate National Recreation Area.
Our Wetlands, Our World118
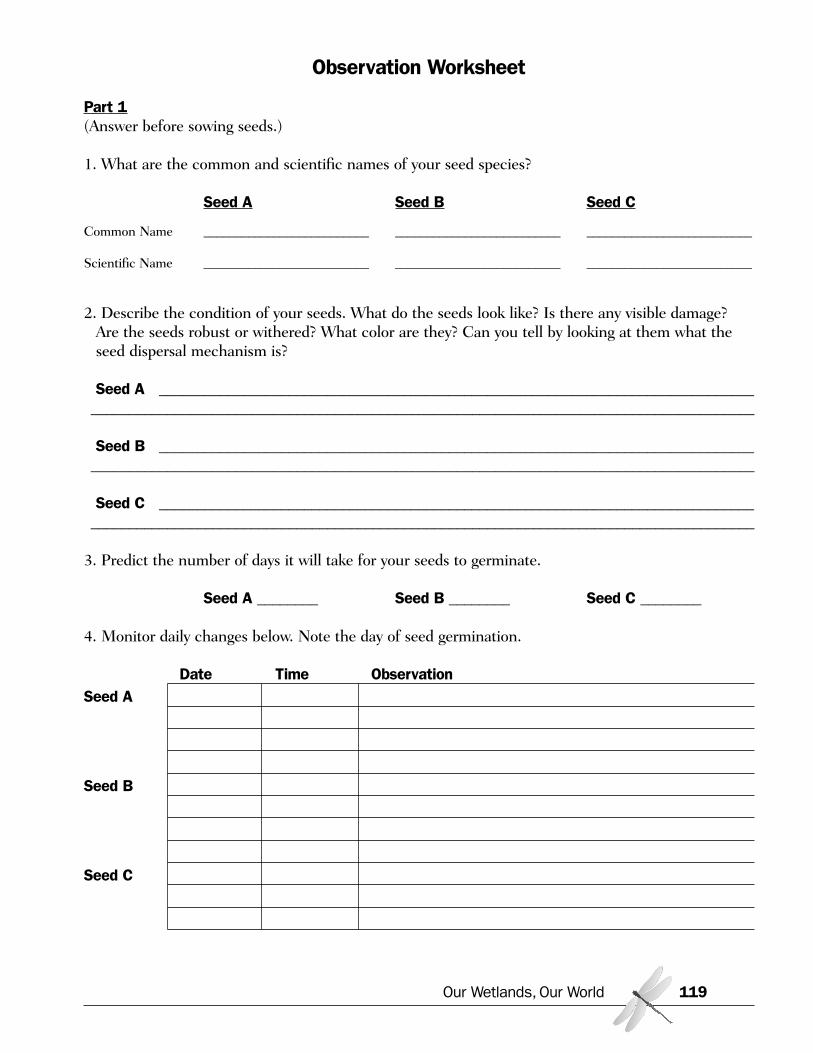
Observation Worksheet
Part 1(Answer before sowing seeds.)
1. What are the common and scientific names of your seed species?
Seed A Seed B Seed C
Common Name __________________________ __________________________ __________________________
Scientific Name __________________________ __________________________ __________________________
2. Describe the condition of your seeds. What do the seeds look like? Is there any visible damage?Are the seeds robust or withered? What color are they? Can you tell by looking at them what theseed dispersal mechanism is?
Seed A _____________________________________________________________________________________________________________________________________________________________________
Seed B _____________________________________________________________________________________________________________________________________________________________________
Seed C _____________________________________________________________________________________________________________________________________________________________________
3. Predict the number of days it will take for your seeds to germinate.
Seed A ________ Seed B ________ Seed C ________
4. Monitor daily changes below. Note the day of seed germination.
Date Time ObservationSeed A
Seed B
Seed C
Our Wetlands, Our World 119
Observation Worksheet
Part 2(Complete one week after sowing seeds.)
1. How long did it take for your seeds to germinate?
Seed A ________ days Seed B ________ days Seed C ________ days
2. Did your seeds take a longer or shorter time to germinate compared to other seeds in your class-room? (circle one)
Seed A Seed B Seed C
Longer or Shorter Longer or Shorter Longer or Shorter
3. For all the seeds in your classroom, determine the mean (average), mode (most common), andmedian (middle) time it took them to germinate.
Mean = Mode = Median = _______________________________________________________________________________________
4. What was the germination rate (percentage of seeds sown that germinated) in your classroom?
_______________________________________________________________________________________(number of germinated seeds ÷ total number of seeds x 100 = % germination rate)
5. Graph the time it took for the seeds to germinate.
Number ofGerminatedSeeds
Number of Days
6. What are some of the reasons that the seeds germinated on different days?____________________________________________________________________________________________________________________________________________________________________________________________________________________________________________________________________________________________________________________________________________________________
Our Wetlands, Our World120
Observation Worksheet
Part 3(Complete immediately after treating soil.)
1. How was your soil treated?
Treatment 1 (T1): ____________________________________________________________________
T2: _________________________________________________________________________________
T3: _________________________________________________________________________________
2. Measure the pH, nitrogen, phosphorous, and potassium levels of the soil and record below.
Seed A pH _____ nitrogen _____ phosphorous _____ potassium _____
Seed B pH _____ nitrogen _____ phosphorous _____ potassium _____
Seed C pH _____ nitrogen _____ phosphorous _____ potassium _____
3. Predict the growth of the plants in altered soil (experimental plants) compared to the controlplants.
____________________________________________________________________________________________________________________________________________________________________________________________________________________________________________________________________________________________________________________________________________________________
4. Monitor daily changes below.
Date Time ObservationSeed A
Seed B
Seed C
Our Wetlands, Our World 121
Observation Worksheet
Part 4(Complete one week after treating soil.)
1. How have your experimental plants grown in comparison with your control plants?
_____________________________________________________________________________________________________________________________________________________________________________________________________________________________________________________________________
2. How have your plants grown in comparison with other plants in your classroom?
_____________________________________________________________________________________________________________________________________________________________________________________________________________________________________________________________________
3. How does your actual plant growth compare to your predictions (Part 3)?
_____________________________________________________________________________________________________________________________________________________________________________________________________________________________________________________________________
4. What are the most favorable soil conditions for plant growth?
_____________________________________________________________________________________________________________________________________________________________________________________________________________________________________________________________________
5. What are the least favorable soil conditions for plant growth?
_____________________________________________________________________________________________________________________________________________________________________________________________________________________________________________________________________
6. For each treatment, create a graph that compares plant growth and survival among species.Include all details that you feel are important. Label both axes.
7. How do contaminants in soil affect plant health?
_____________________________________________________________________________________________________________________________________________________________________________________________________________________________________________________________________
Our Wetlands, Our World122
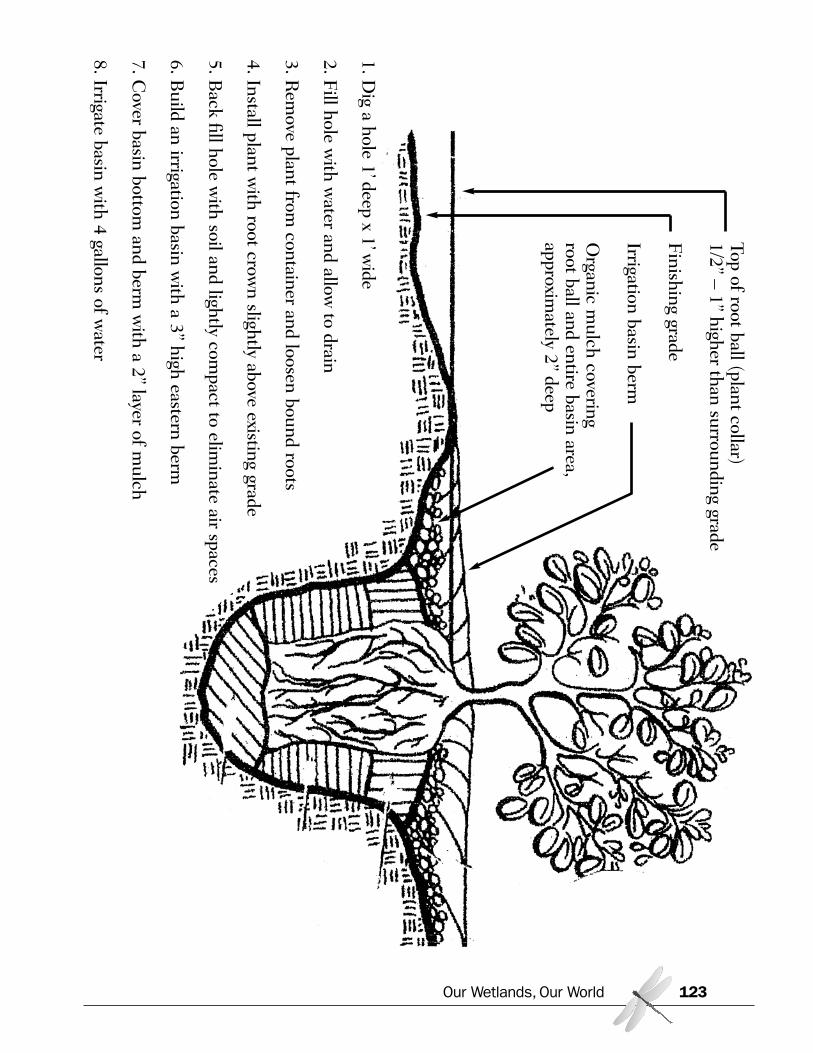
Our Wetlands, Our World 123
1. Dig a hole 1’deep x 1’w
ide
2. Fill hole w
ith water and allow
to drain
3. Rem
ove plant from container and loosen bound roots
4. Install plant with root crow
n slightly above existing grade
5. Back fill hole w
ith soil and lightly compact to elim
inate air spaces
6. Build an irrigation basin w
ith a 3” high eastern berm
7. Cover basin bottom
and berm w
ith a 2” layer of mulch
8. Irrigate basin with 4 gallons of w
ater
Top of root ball (plant collar)1/2” – 1” higher than surrounding grade
Finishing grade
Irrigation basin berm
Organic m
ulch coveringroot ball and entire basin area,approxim
ately 2” deep
Activity: Plant Monitoring(Field Study)
Summary: Students learn to compare the ecological roles of native and non-native plant species in anecosystem and to assess the impact of removing invasive plants based on interdependencies withinthe system. At Upper Newport Bay, or other site, students monitor vegetation growth.
Our Wetlands, Our World124
California State Content Standards
SCIENCE
Biology/Life Sciences• Ecology 6a. Students know biodiversity is the sum
total of different kinds of organisms and is affected byalterations of habitats.
• Ecology 6b. Students know how to analyze changesin an ecosystem resulting from changes in climate,human activity, introduction of nonnative species, orchanges in population size.
• Ecology 6c. Students know how fluctuations in popu-lation size in an ecosystem are determined by the rela-tive rates of birth, immigration, emigration, and death.
• Ecology 6d. Students know how water, carbon, andnitrogen cycle between abiotic resources and organicmatter in the ecosystem and how oxygen cyclesthrough photosynthesis and respiration.
• Ecology 6e. Students know a vital part of an ecosys-tem is the stability of its producers and decomposers.
• Evolution 8b. Students know a great diversity ofspecies increases the chance that at least some organ-isms survive major changes in the environment.
Investigation and Experimentation• 1a. Students will select and use appropriate tools and
technology (such as computer-linked probes, spread-sheets, and graphing calculators) to perform tests, col-lect data, analyze relationships, and display data.
• 1g. Students will recognize the usefulness and limita-tions of models and theories as scientific representa-tions of reality.
• 1j. Students will recognize the issues of statisticalvariability and the need for controlled tests.
• 1k. Students will recognize the cumulative nature ofscientific evidence.
ENGLISH-LANGUAGE ARTS
Grades 9-10
Speaking Applications• Deliver Expository Presentations 2.2b. Convey information and ideas from primary and sec-
ondary sources accurately and coherently.c. Make distinctions between the relative value and sig-
nificance of specific data, facts, and ideas.f. Use technical terms and notations accurately.
• Deliver Descriptive Presentations 2.6c. Use effec-tive, factual descriptions of appearance, concreteimages, shifting perspectives and vantage points, andsensory details.
Grades 11-12
Listening and Speaking Strategies• Organization and Delivery of Oral Communication
1.8. Use effective and interesting language, includ-ing:a. Informal expressions for effectb. Standard American English for clarityc. Technical language for specificity.
MATHEMATICS
• Probability and Statistics 8.0. Students organize anddescribe distributions of data by using a number ofdifferent methods, including frequency tables, his-tograms, standard line and bar graphs, stem-and-leafdisplays, scatterplots, and box-and-whisker plots.
Procedures:
Part I – In class, prior to field study.
A. Demonstrate the concept of interdependence (optional)
1. Have students stand in a circle. Ask each student to name a specific part of the wetland ecosys-tem, either biotic (living) or abiotic (non-living)—for example: cordgrass, water, plankton, sun,killifish, clam, Brown Pelican, Light-footed Clapper Rail, cattail, soil, etc. Be sure all majorareas of the ecosystem are represented, including the primary energy source—the sun.
2. Ask every other student in the circle to turn and face the outside. (Remove one student if thereis an odd number.) Ask students to either hold hands or link elbows and then to lean back withtheir arms in front of them until they all find balance. Explain that they are demonstrating thedelicate balance in any ecosystem.(Note: If students are reluctant to perform this activity, simply have various students state howtheir part of the wetland ecosystem is related to other parts.)
3. Explain you are going to act as an invasive plant that disrupts the interdependencies of theecosystem. Attempt to break the balance of the ecosystem by pulling some students’ hands orarms apart. Point out that though some sections stick together, the overall balance of the struc-ture is broken. Ask students which links they think would break first in the ecosystem?
Our Wetlands, Our World 125
Objectives:Students will be able to:
• Identify wetland plants• Use quadrats to inventory plants• Monitor a site to determine ecosystem
health
Materials:• Cones or flags to mark off field study area
(if needed)• Field Guide for plants
(see www.newportbay.org/plants)• (optional) Camera and compass for photo-
monitoring log • Handouts
Plant Monitoring LogPercent Coverage Data
For each group:• Hula Hoop® or meter-square quadrat
(can be made from PVC piping and elbowsor meter sticks and string)
• Clip board and pen
Preparations:• Contact field study site to arrange a visit.
(See Apendix D. For UNB call 949-640-0286.)
• Find out what materials will be available onsite.
• Make a copy of the Plant Monitoring Logand Percent Coverage Data handouts foreach group.
Time Required:• 50 minute class session• Approximately 1-1/2 hours in the field to
inventory plants and discuss findings
Note: Plants are easiest to identify during thegrowing season, March-June.
B. Identify invasive species
1. Divide the class into groups and assign one (or more, depending on number of groups) of thefollowing plants to each group:
Non-native- Mustard, Brassica nigra- Star Thistle, Centaurea melitensis- Ice Plant, Gasoul crystallinum- Lollypop Tree, Myoporum laetum- Giant Reed, Arundo donax- Brazilian Pepper Tree, Schinus molle
Native- Coastal Buckwheat, Eriogonum fasciculatum- California Sagebrush, Artemisia californica- Pickleweed, Salicornia virginica- Saltgrass, Distichlis spicata- Cordgrass, Spartina foliosa- Mulefat, Baccharis glutinosa
2. Have each group do some research and prepare a brief report and presentation on their plantspecies. In their presentations, be sure students address:
- Is the plant native or non-native?- If non-native, where did it come from?- If non-native, how does it affect the ecosystem?- What might be the effects if it disappears?- Should the plant be removed?- If native, what role does it play within its habitat?- What characteristics does the plant have that allow it to survive within its specific habi-
tat?
Part II – Field study, at Upper Newport Bay or other natural site
A. Inventory species
1. Remind students that plants provide the basis of health in a wetland. Explain that a variety orhigh diversity of plant species, especially native species, usually indicates a balanced ecosystem.
2. Ask students how they would study plant populations in a site. Tell students that scientistsoften study small sample plots—quadrats—within a site and then use this information to makegeneralizations about the larger study area. Explain that a quadrat is normally a one squaremeter area randomly selected in the site and analyzed to quantify the density and percent coverof species within the site. Tell students that they are going to use a hoop as their quadrat.
Our Wetlands, Our World126
3. Along with site staff, determine the area to be inventoried and, if necessary, mark the area withflags or cones. Choose an area with easy access that will not be harmed by foot traffic. Pointout the area to students and tell them that each group will sample a different part of the site.Caution students to tread lightly as they work.
4. Divide students into groups and distribute a clipboard, pen, and Plant Monitoring Log to eachgroup. Before they begin, have students quietly observe their surroundings and note theirobservations on their Plant Monitoring Log.
5. Have each group randomly toss their hoop, and then count and identify plants that are withinthe hoop. Have students fill in their Plant Monitoring Logs as they work. Tell students that ifthey cannot identify a species, just to give it a descriptive name.
B. Discuss plant inventory
After groups have inventoried their quadrats, bring the groups together to discuss what theyfound. Use the following questions to generate a discussion:
1. How many total species were found?
2. What percentage of plants is native and what percentage non-native?
3. What are the five most common plants? Are they native or non-native?
4. Were there any monocultures (only one species within a quadrat) sampled?
5. What is the average percent of plant coverage?
6. What insects and other animals were identified?
7. Is there a relation between the plant coverage and the number of animals observed?
8. Do you think the area the class sampled is a good representation of the entire site? If not,by how much would you increase the sample size to achieve a good representation? Howfrequently would you collect data?
Follow-up:
1. Work with staff at the site to have students remove invasive plants. Use the following questionsto discuss the process:
a. What are the interactions between the non-native plants and the native plants?(The non-native plants often out-compete the native plants, limit their growth, and sometimes killthem by altering soil chemistry and sequestering water, space, light, or nutrients.)
Our Wetlands, Our World 127
b. What do you predict would happen to this ecosystem if we ignored the non-native plants?
c. Will this ecosystem have increased ecological function if the non-native plants are removed?How long do you think ecosystem recovery might take? (Removing plants disturbs the soil, and there is likely a large non-native seed bank waiting to ger-minate.)
d. Besides non-native species introductions, what other disturbances could affect ecosystem bal-ance? (Disturbances may be natural or anthropogenic: fire, flood, drought, grazing, dredging, etc.)
2. Back in class, analyze and display the data collected. Tell students that the data they collect couldbe a valuable addition to a long-term study of the site.
a. Have students create a visual representation of the species data collected within the differentquadrats, showing the number and type of species. Have students select an appropriate methodfor displaying the data, such as a frequency table, histogram, etc.
b. Have students complete the Percent Coverage Data sheet and use the information to create avisual representation of the percentage of native, non-native, and bare ground at the site. Havestudents select an appropriate method for displaying the data, such as a pie chart or graph.
Extensions
1. Have students photo-monitor the site. Establish specific points from which to photograph thesite. Use a compass to determine the direction of the photograph. Record information on thedirection, the date, the time of day, and the weather. Compile the photographs, records, PlantMonitoring Log, and Percent Coverage Data in a binder. Have students keep up the photo-mon-itoring book from season to season, year to year, noting changes in the site and positive andnegative trends.
2. On a world map, have students indicate where the non-native plants in Upper Newport Bayoriginated. What is the climate in these areas? How did the plants get to California?
Adapted from “Invasive Plant Removal & Monitoring” from National Park Labs Curriculum, by National Park Service at the Golden Gate National Recreation Area
Our Wetlands, Our World128

Plant Monitoring Log
Date:_______________________ Data Collectors: _____________________________________________________________________________________________________________________________
Site Location: ________________________________________________________________________Site Size: ____________________________________________________________________________Weather: ____________________________________________________________________________
1. Observations before analyzing quadrat:
2. Species identification (list all species within the quadrat):Note: When estimating percentages, first visualize the quadrat divided into quarters (25%), then record theaverage percentage estimated by two or more group members.
native or invasive % of quadrat
____________________________________________ [ ] [ ] __________
____________________________________________ [ ] [ ] __________
____________________________________________ [ ] [ ] __________
____________________________________________ [ ] [ ] __________
____________________________________________ [ ] [ ] __________
____________________________________________ [ ] [ ] __________
3. Number of species within quadrat: Native _______________________Non-native ___________________Total ________________________
4. Percent coverage of quadrat: Native _______________________Non-native ___________________Bare ground _________________
5. Evidence of insects and animals identified in quadrat:number
_________________________________________________ _______
_________________________________________________ _______
_________________________________________________ _______
Our Wetlands, Our World 129

Percent Coverage Data
Date: _______________________________________________________________________________
Site Location: ________________________________________________________________________
1. Total number of quadrat samples: ____________________________________________________
2. Total number of species found: ______________________________________________________
3. Average number of species found in each quadrat: ______________________________________Average = total number of species found / number of quadrats
4. Total number of native species: _____________________________________________________
5. Percent coverage of native species: ___________________________________________________Percent coverage = average % covered by native species / total number of samples
6. Total number of non-native species: __________________________________________________
7. Percent coverage of non-native species: _______________________________________________
8. Percent coverage of bare ground: ____________________________________________________
Our Wetlands, Our World130
Activity: Wetland TradeoffsSummary: This activity highlights the tradeoffs in wetlands management decisions. Students reviewthe benefits of wetlands, then debate the tradeoffs in a local wetland issue.
Our Wetlands, Our World 131
California State Content Standards
SCIENCE
Biology/Life Sciences• Ecology 6b. Students know how to analyze changes
in an ecosystem resulting from changes in climate,human activity, introduction of nonnative species, orchanges in population size.
ENGLISH-LANGUAGE ARTS
Grades 9-10
Reading Comprehension• Comprehension and Analysis of Grade-Level-Appro-
priate Text 2.3. Generate relevant questions aboutreadings on issues that can be researched.
• Comprehension and Analysis of Grade-Level-Appro-priate Text 2.5. Extend ideas presented in primary orsecondary sources through original analysis, evalua-tion, and elaboration.
• Expository Critique 2.8. Evaluate the credibility of anauthor’s argument or defense of a claim by critiquingthe relationship between generalizations and evi-dence, the comprehensiveness of evidence, and theway in which the author’s intent affects the structureand tone of the text (e.g., in professional journals, edi-torials, political speeches, primary source material).
Writing Strategies• Research and Technology 1.3. Use clear research
questions and suitable research methods (e.g., library,electronic media, personal interview) to elicit andpresent evidence from primary and secondary sources.
• Research and Technology 1.5. Synthesize informa-tion from multiple sources and identify complexitiesand discrepancies in the information and the differentperspectives found in each medium (e.g., almanacs,microfiche, news sources, in-depth field studies,speeches, journals, technical documents).
Listening and Speaking Strategies• Organization and Delivery of Oral Communication
1.3. Choose logical patterns of organization (e.g.,chronological, topical, cause and effect) to inform andto persuade, by soliciting agreement or action, or tounite audiences behind a common belief or cause.
• Organization and Delivery of Oral Communication1.6. Present and advance a clear thesis statement andchoose appropriate types of proof (e.g., statistics, testi-mony, specific instances) that meet standard tests forevidence, including credibility, validity, and relevance.
• Organization and Delivery of Oral Communication1.8. Produce concise notes for extemporaneous deliv-ery.
Speaking Applications• Deliver Persuasive Arguments 2.5a. Structure ideas and arguments in a coherent, logical
fashion.b. Use rhetorical devices to support assertions (e.g., by
appeal to logic through reasoning, by appeal to emo-tion or ethical belief; by use of personal anecdote,case study, or analogy).
c. Clarify and defend positions with precise and relevantevidence, including facts, expert opinions, quotations,expressions of commonly accepted beliefs, and logicalreasoning.
d. Anticipate and address the listener’s concerns andcounterarguments.
Our Wetlands, Our World132
Grades 11-12
Reading Comprehension• Comprehension and Analysis of Grade-Level-Appro-
priate Text 2.3. Verify and clarify facts presented inother types of expository texts by using a variety ofconsumer, workplace, and public documents.
• Comprehension and Analysis of Grade-Level-Appro-priate Text 2.4. Make warranted and reasonableassertions about the author’s arguments by using ele-ments of the text to defend and clarify interpretations.
• Comprehension and Analysis of Grade-Level-Appro-priate Text 2.5. Analyze an author’s implicit andexplicit philosophical assumptions and beliefs about asubject.
• Expository Critique 2.6. Critique the power, validity,and the truthfulness of arguments set forth in publicdocuments; their appeal to both friendly and hostileaudiences; and the extent to which the argumentsanticipate and address reader concerns and counter-claims (e.g., appeal to reason, to authority, to pathosand emotion).
Listening and Speaking Strategies• Comprehension 1.2. Analyze the impact of the media
on the democratic process (e.g., exerting influence onelections, creating images of leaders, shaping atti-tudes) at the local, state, and national levels.
• Comprehension 1.3. Interpret and evaluate the vari-
ous ways in which events are presented and informa-tion is communicated by visual image makers (e.g.,graphic artists, documentary filmmakers, illustrators,new photographers).
• Organization and Delivery of Oral Communication1.6. Use logical, ethical, and emotional appeals thatenhance a specific tone and purpose.
• Organization and Delivery of Oral Communication1.8. Use effective and interesting language, including:
a. Informal expressions for effectb. Standard American English for clarityc. Technical language for specificity.
HISTORY/SOCIAL SCIENCE
• Principles of American Democracy 12.7.5. Explainhow public policy is formed, including the setting ofthe public agenda and implementation of it throughregulations and executive orders.
• Principles of Economics 12.1.1. Examine the causalrelationship between scarcity and the need for choic-es.
• Principles of Economics 12.1.3. Identify the differ-ence between monetary and nonmonetary incentivesand how changes in incentives cause changes inbehavior.
• Principles of Economics 12.1.4. Evaluate the role ofprivate property as an incentive in conserving andimproving scarce resources, including renewable andnonrenewable natural resources.
Objectives:Students will be able to:
• Identify the benefits of wetlands• Compare economic, social, and environmen-
tal tradeoffs in various wetland conservationand development decisions
Materials:• Current reference materials that identify var-
ious viewpoints about wetland issues • Handouts
- Tradeoffs Analyzer (sample)- Tradeoffs Analyzer (blank)
Preparations:• Bring in articles from local newspapers or
magazines (or from the Internet) concerningwetlands (e.g., dredging, invasive plantremoval, herbicide-use, soft bottom channels,natural treatment systems)
• Research current laws that affect develop-ment in wetlands (e.g., Clean Water Act,Coastal Act)
• Make a transparency of the sample TradeoffsAnalyzer
• Make a copy for each group of the blankTradeoffs Analyzer
Time Required:• Approximately 1 hour
(more if students do research)
Procedures:
1. To review the importance of wetlands and to introduce varying viewpoints, ask students the fol-lowing questions:
a. Why are wetlands valuable? (Note: List benefits on the chalkboard.)- Wetlands filter runoff, thus improving water quality.- Wetlands provide habitat and rest-stops for migratory birds.- Wetlands sustain biodiversity by supporting threatened and endangered species.- Wetlands are feeding, breeding, and nursery grounds for many animals.- Wetlands provide recreation—hiking, biking, kayaking, bird watching.- In some areas, wetlands recharge groundwater.- Wetlands protect against flood damage by storing and slowing peak flows of water.)
b. Why would people want to build houses or other buildings on or near wetlands?(People often like waterfront homes and offices. If people don’t value the benefits that wetlandsprovide, they may want the land used in a way that is more financially beneficial to them inthe short term. For example, the flat, undeveloped land with low-growing vegetation is advan-tageous for airports; the productive soil is beneficial for agriculture.)
c. Why would people want to protect wetlands?(People may value wetlands for aesthetic beauty, for recreation, for wildlife habitat, for cleanwater at the beach, for the economic benefits of tourism or commercial fisheries. Some peoplemay have only one reason; other people may value all the benefits of wetlands.)
d. What might Upper Newport Bay look like today if citizens had not fought for its protectionin the 1960s?(The Robinsons and other concerned citizens formed the Friends of Newport Bay in 1967,leading tours around the Bay in order to educate others about the Bay’s ecological significanceas well as opposing development plans, such as the Irvine Company’s proposal to build hotelsand marinas along the shoreline in 1969.)
2. Have students review the wetlands reference materials. Ask students what controversies theyidentify in the materials. Discuss and record them on the board.
3. Ask students to think of any controversies as “problems” rather than “issues.” Use as an exam-ple a newspaper headline that states: “Developer Seeks Permit to Fill Wetlands for Subdivi-sion.” Explain that the “issue”— to develop or not to develop — divides people, but that a prob-lem-solving approach will ask, “Are there alternative plans for protecting the wetland?” or “Arethere alternate sites to build the subdivision?” or “Can we assure jobs and housing and still pro-tect the environment in this case?” Ask students to identify some of the problems associatedwith the controversies listed on the board.
Our Wetlands, Our World 133
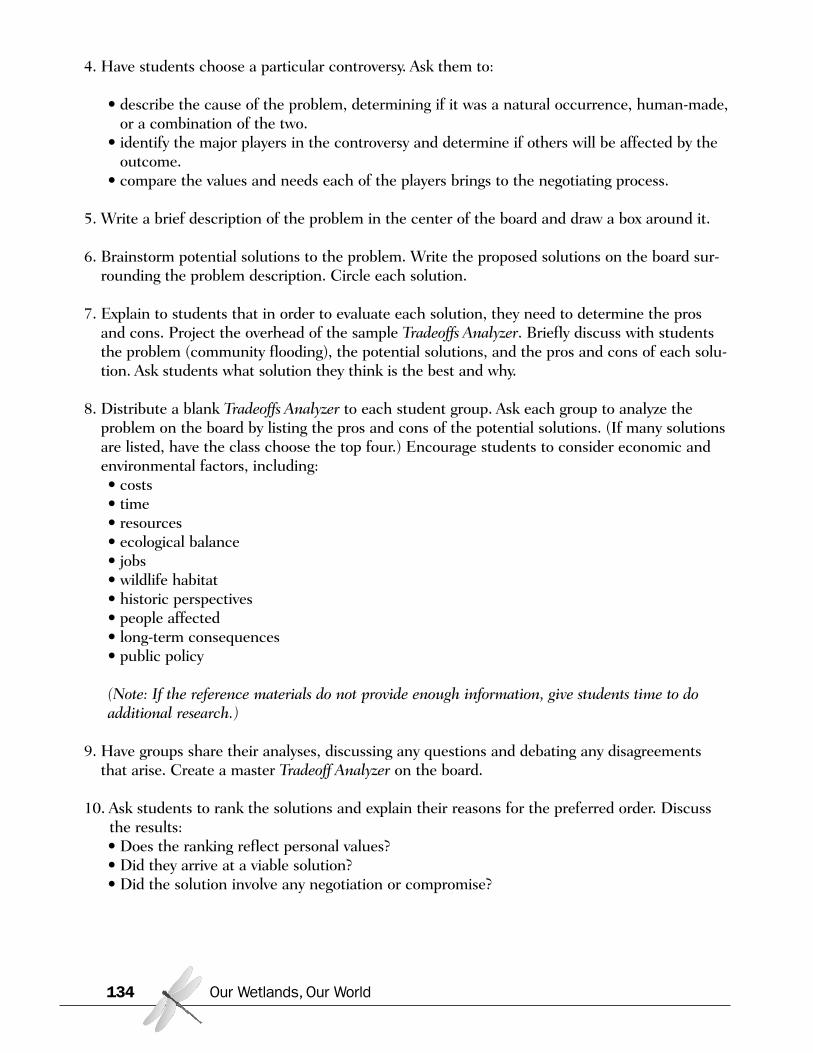
4. Have students choose a particular controversy. Ask them to:
• describe the cause of the problem, determining if it was a natural occurrence, human-made,or a combination of the two.
• identify the major players in the controversy and determine if others will be affected by theoutcome.
• compare the values and needs each of the players brings to the negotiating process.
5. Write a brief description of the problem in the center of the board and draw a box around it.
6. Brainstorm potential solutions to the problem. Write the proposed solutions on the board sur-rounding the problem description. Circle each solution.
7. Explain to students that in order to evaluate each solution, they need to determine the prosand cons. Project the overhead of the sample Tradeoffs Analyzer. Briefly discuss with studentsthe problem (community flooding), the potential solutions, and the pros and cons of each solu-tion. Ask students what solution they think is the best and why.
8. Distribute a blank Tradeoffs Analyzer to each student group. Ask each group to analyze theproblem on the board by listing the pros and cons of the potential solutions. (If many solutionsare listed, have the class choose the top four.) Encourage students to consider economic andenvironmental factors, including:• costs• time• resources • ecological balance• jobs• wildlife habitat• historic perspectives• people affected• long-term consequences• public policy
(Note: If the reference materials do not provide enough information, give students time to doadditional research.)
9. Have groups share their analyses, discussing any questions and debating any disagreementsthat arise. Create a master Tradeoff Analyzer on the board.
10. Ask students to rank the solutions and explain their reasons for the preferred order. Discussthe results:• Does the ranking reflect personal values? • Did they arrive at a viable solution?• Did the solution involve any negotiation or compromise?
Our Wetlands, Our World134
Follow-Up
Have students research the consequences of their proposed solution. If students still believe that theyhave a viable solution and if the problem is currently being addressed in your area, have studentswrite advocacy statements and send them to the players involved.
Extensions
1. Organize class debates on a variety of wetland issues and problems. Scenarios might include:
- filling in and developing a wetland site- creating a wetland nature preserve in an area pressured by an expanding population- dredging a wetland to remove the sediment- removing an invasive plant that is aesthetically pleasing
2. Have students read newspaper accounts of a wetland controversy and analyze which arguments arebased on opinions versus facts.
3. Have interested students attend and participate in public discussions of wetland issues. Ask themto report back to class.
4. Tell students that sending Letters to the Editor is a great way to keep editors aware that manyreaders are concerned about wetlands, and it means newspapers are more likely to publish storieson the topics. Point out that published letters keep decision-makers aware of citizens’ concerns andhelp to shape their opinions on the issue. Have students write letters to the editor. Tell them that itis best to limit yourself to 150 words or less, and remind them to include their name, homeaddress, and daytime phone for verification.
LA Times: [email protected], fax to 213-237-7679Orange County Register: [email protected], fax to 714-796-3657
Adapted from “Wetland Tradeoffs” from WOW! The Wonders of Wetlands, co-published by International Project WET and Environmental Concern
Our Wetlands, Our World 135
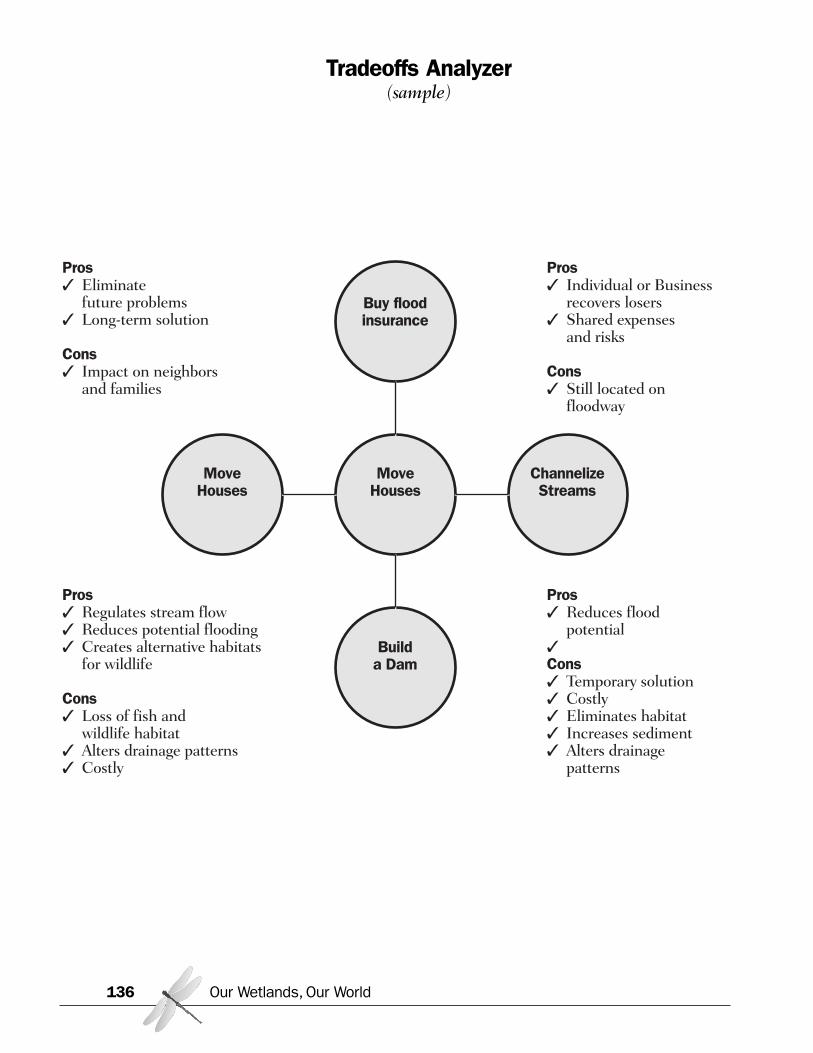
Tradeoffs Analyzer(sample)
Our Wetlands, Our World136
Buy floodinsurance
Pros✓ Eliminate
future problems✓ Long-term solution
Cons✓ Impact on neighbors
and families
Pros✓ Individual or Business
recovers losers✓ Shared expenses
and risks
Cons✓ Still located on
floodway
Pros✓ Regulates stream flow✓ Reduces potential flooding✓ Creates alternative habitats
for wildlife
Cons✓ Loss of fish and
wildlife habitat✓ Alters drainage patterns✓ Costly
Pros✓ Reduces flood
potential✓Cons✓ Temporary solution✓ Costly✓ Eliminates habitat✓ Increases sediment✓ Alters drainage
patterns
Builda Dam
MoveHouses
MoveHouses
ChannelizeStreams
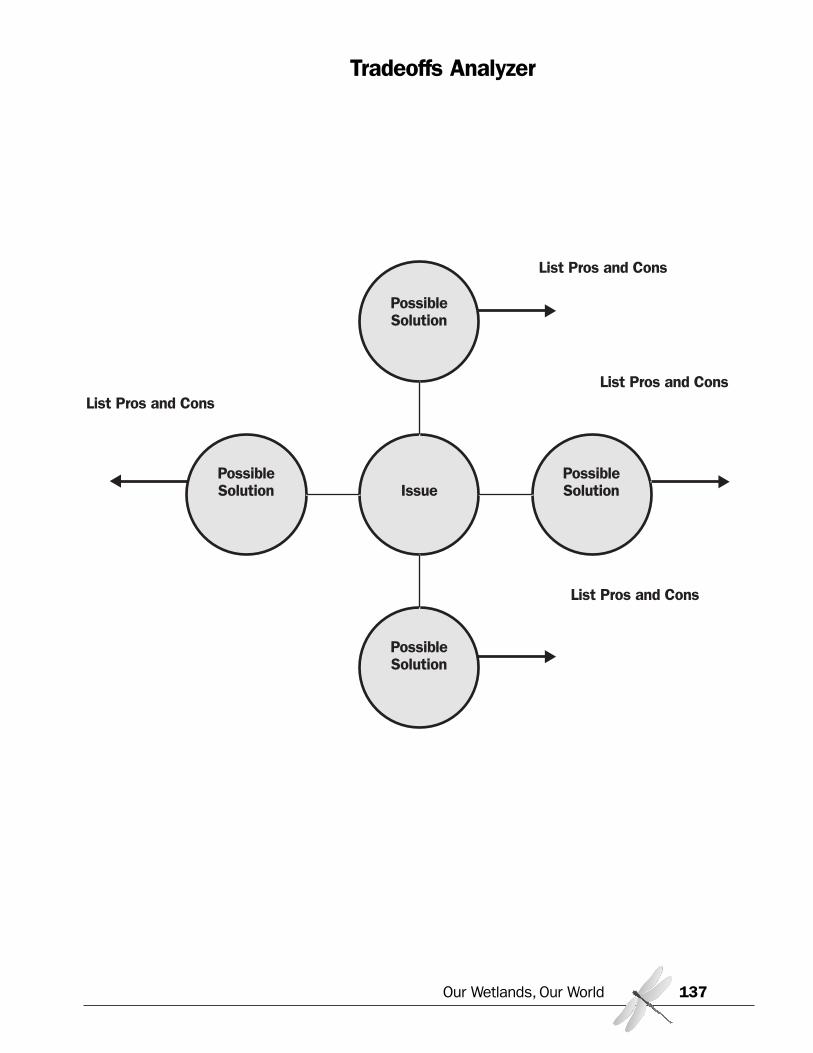
Tradeoffs Analyzer
Our Wetlands, Our World 137
PossibleSolution
List Pros and Cons
List Pros and Cons
List Pros and Cons
List Pros and Cons
PossibleSolution
PossibleSolution Issue
PossibleSolution
Activity: StewardshipSummary: Students learn how they can contribute to wetland preservation and restoration throughstewardship.
Our Wetlands, Our World138
California State Content Standards
SCIENCE
Biology/Life Sciences• Ecology 6a. Students know biodiversity is the sum
total of different kinds of organisms and is affected byalterations of habitats.
• Ecology 6b. Students know how to analyze changesin an ecosystem resulting from changes in climate,human activity, introduction of nonnative species, orchanges in population size.
ENGLISH-LANGUAGE ARTS
Grades 9-10
Writing Strategies• Organization and Focus 1.1. Prepare a bibliography
of reference materials for a report using a variety ofconsumer, workplace, and public documents.
Writing Applications• Expository Compositions 2.3b. Convey information and ideas from primary and sec-
ondary sources accurately and coherently.c. Make distinctions between the relative value and sig-
nificance of specific data, facts, and ideas.d. Include visual aids by employing appropriate technol-
ogy to organize and record information on charts,maps, and graphs.
e. Anticipate and address readers’ potential misunder-standings, biases, and expectations.
f. Use technical terms and notations accurately.
Grades 11-12
Reading Comprehension• Structural Features of Informational Materials 2.1.
Analyze both the features and the rhetorical devices ofdifferent types of public documents (e.g., policy state-ments, speeches, debates, platforms) and the way inwhich authors use those features and devices.
Writing Strategies• Organization and Focus 1.3. Structure ideas and
arguments in a sustained, persuasive, and sophisticat-ed way and support them with precise and relevantexamples.
• Organization and Focus 1.4. Enhance meaning byemploying rhetorical devices, including the extendeduse of parallelism, repetition, and analogy; the incor-poration of visual aids (e.g., graphs, tables, pictures);and the issuance of a call for action.
HISTORY/SOCIAL SCIENCE
• Principles of American Democracy 12.7.5. Explainhow public policy is formed, including the setting ofthe public agenda and implementation of it throughregulations and executive orders.
• Principles of Economics 12.1.3. Identify the differ-ence between monetary and nonmonetary incentivesand how changes in incentives cause changes inbehavior.
Objectives:Students will be able to:
• Participate in projects to improve wetlands• Become aware of citizens’ roles as stewards
Materials:• Depends upon activities selected
Preparations:• Depends upon activities selected
Time Required:• Depends upon activities selected
Procedures:
1. Ask students what kinds of decisions they make as a group (e.g., where to go for lunch or whatmovie to see). Then ask how the group reaches a decision.
2. Tell students that every group decision is, in some way, a demonstration of small-scale politics.Explain that the debate, discussion, lobbying, and informal voting that they use in everydaydecisions can also be useful in community and national political action.
3. Ask students how certain school policies were established (e.g., dress code, lunch rules, role ofstudent council). Ask how they would go about having a policy reviewed or changed.
4. Tell students that wetland stewardship is often in the spotlight of the political process and thatstudents can participate more significantly than they may suspect. Explain that through becom-ing aware, participating in local government, being involved in the community, teaching others,and setting good examples, they can have an impact on issues important to them. For example,the Smoke-Free Beaches campaign started by high school students in Solana Beach has spreadacross the state, including several beaches in Orange County that have accepted a ban onsmoking.
5. Review the following activities with students and have them get involved. Visit www.coastforyou.org for more suggestions and to take the “Coastal Stewardship Pledge.”
Follow-up
Have students keep progress reports of their projects and eventually write final summary reportsaddressing what they did, how well it worked, what they would do differently next time, and whatrecommendations they would make to someone taking on a similar project.
Extensions
1. Set up committees of students to follow several local issues and make periodic reports to theclass.
2. If students participated in restoration projects, have them monitor the site for maintenanceneeds and for future projects.
3. Have students write letters to newspapers and policy makers expressing their views on localwetlands issues.
Our Wetlands, Our World 139
Projects and Activities
Restore HabitatVolunteer to help restore your local wetland or school grounds by removing invasive plants and plant-ing natives. Become part of the ROOTS (Restoration Outreach Opportunity Teamwork Stewardship)team that meets on the fourth Saturday of every month. Call (949) 640-0286 for details.
Volunteer with a Local Environmental GroupMost wetlands have one or more environmental groups dedicated to preservation and restoration.Contact these groups and volunteer to help. (See Appendix C for ideas.)
Get the FactsIf you want something done about the condition of wetlands in your community, you’ll have to bewell-informed. Before you begin, do your homework. Here’s what you need to know:
• Why are these wetlands important or valuable to people? To wildlife?• What (or who) is threatening the wetlands?• Are wetlands protected? Know the law.• Who’s in charge of protecting wetlands in your state and community?• What are local politicians' views on the environment?
Participate in Local GovernmentKeep informed of the environmental issues in your area. Are wetlands getting the attention theydeserve? What does the planning and zoning office have in store for the wetlands in your area? If youdisagree with the actions of these offices, say so! Watch the news for public hearings on developmentprojects that may affect your community. Inform your neighbors of the problem. Write a petition stat-ing your views, get as many signatures as you can, then take the petition to the hearing and presentyour case.
Start a ClubStart a campaign in your school or neighborhood to let people know about wetlands and why they arevaluable. Think of a catchy slogan or a phrase that’s easy to remember. Make colorful posters; createbrochures or buttons; put an ad in your school or community newspaper or newsletter. Let peopleknow how they can help conserve and protect wetlands.
Be a Role Model for Younger KidsHelp younger kids learn about wetlands and responsibility. Take kids fishing, bird-watching, or hikingand use the time to teach them about the importance of wetlands and respect for nature. Make apresentation about wetlands, such as a puppet show or play, or create songs. Volunteer to help withlocal schools’ outdoor lessons or field trips for younger students.
Participate in Coastal Clean-up EventsFind out when coastal clean-ups are scheduled in your area (www.coastforyou.org or 800-Coast-4U)and get a group together to participate, or just go on your own to meet new people and help clean upthe beach. (Remember not to pick-up organic debris like driftwood or kelp as these items are impor-tant players in beach ecology.)
Our Wetlands, Our World140
Organize a Clean-up DayHold a clean-up day in your community. Organize a committee to help you plan the day. Advertisethe clean-up well in advance and let people know what to bring (e.g., gloves, trash bags, wheelbar-rows). Ask local stores for donations of snacks or other supplies. Combine the clean-up with some-thing fun and educational, such as a picnic, canoeing, hiking, or a nature presentation. Circulatepress releases about the entire event to broaden public awareness.
Start a Neighborhood Recycling ProgramRecycling programs help keep litter down and reduce the need for landfill space. Call your city’sdepartment of public works or search online for ideas to set up neighborhood recycling. If a programalready exists, encourage more people to recycle, or offer to take their materials to the collection cen-ter for them. Green waste can also be recycled; find out what composting programs your communityoffers.
Plant a School GardenWork with other students and your school's administration to establish a garden on your schoolgrounds. Types of native plant gardens suitable for schools include: container gardens, raised beds,borders along sidewalks, specialty gardens designed to attract butterflies or birds, or to be edible, or torepresent plants used by California Indian tribes. Get permission for the location of the garden andthe use of the school's water; request tools and plants from local stores or residents; and create amaintenance schedule. Make your garden pesticide-free and "water-wise"! Native plants may be pur-chased at Tree of Life Nursery—(949) 728-0685. Visit the School Gardens webpage of the CaliforniaIntegrated Waste Management Board at www.ciwmb.ca.gov/Schools/WasteReduce/Food/SchoolGar-den.htm. The California Native Plant Society has published a guide titled Southern California NativePlants for School Gardens by Betsey Landis—(310) 472-0624.
Perform an Environmental Audit of Your SchoolMake a detailed study of your school's environmental impact, looking at the water and energy con-sumed and the waste and pollution created. Create a report for your school administration and sug-gest ways that the school could improve. The Natural Resources Defense Council has an interactivewebsite that can help you learn about environmental problems and solutions at your school,www.nrdc.org/greensquad. Check out the Center for Environmental Education's School SustainabilityGuidelines for sample audit forms, greenschools.schoolsgogreen.org/green/GREEN_Sustain. ReadYouth for Environmental Sanity's "Green Schools Energy Project" manual,www.yesworld.org/info/GreenSchoolsManual.pdf, for an example of how some students helped theirschool become more energy efficient and save money in the process.
Our Wetlands, Our World 141
Our Wetlands, Our World142
APPENDIX
Our Wetlands, Our World 143
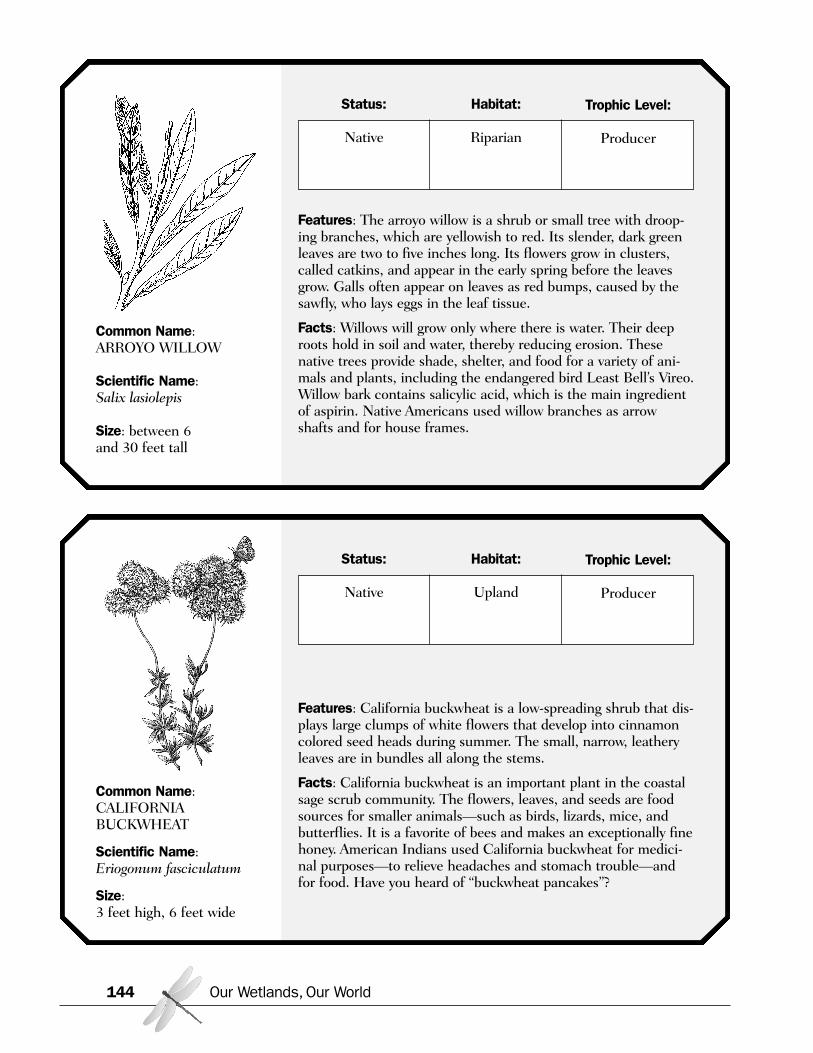
Our Wetlands, Our World144
Common Name: ARROYO WILLOW
Scientific Name: Salix lasiolepis
Size: between 6 and 30 feet tall
Features: The arroyo willow is a shrub or small tree with droop-ing branches, which are yellowish to red. Its slender, dark greenleaves are two to five inches long. Its flowers grow in clusters,called catkins, and appear in the early spring before the leavesgrow. Galls often appear on leaves as red bumps, caused by thesawfly, who lays eggs in the leaf tissue.
Facts: Willows will grow only where there is water. Their deeproots hold in soil and water, thereby reducing erosion. Thesenative trees provide shade, shelter, and food for a variety of ani-mals and plants, including the endangered bird Least Bell’s Vireo.Willow bark contains salicylic acid, which is the main ingredientof aspirin. Native Americans used willow branches as arrowshafts and for house frames.
Status:
Native
Habitat:
Riparian
Trophic Level:
Producer
Common Name:CALIFORNIA BUCKWHEAT
Scientific Name:Eriogonum fasciculatum
Size: 3 feet high, 6 feet wide
Features: California buckwheat is a low-spreading shrub that dis-plays large clumps of white flowers that develop into cinnamoncolored seed heads during summer. The small, narrow, leatheryleaves are in bundles all along the stems.
Facts: California buckwheat is an important plant in the coastalsage scrub community. The flowers, leaves, and seeds are foodsources for smaller animals—such as birds, lizards, mice, andbutterflies. It is a favorite of bees and makes an exceptionally finehoney. American Indians used California buckwheat for medici-nal purposes—to relieve headaches and stomach trouble—andfor food. Have you heard of “buckwheat pancakes”?
Status:
Native
Habitat:
Upland
Trophic Level:
Producer
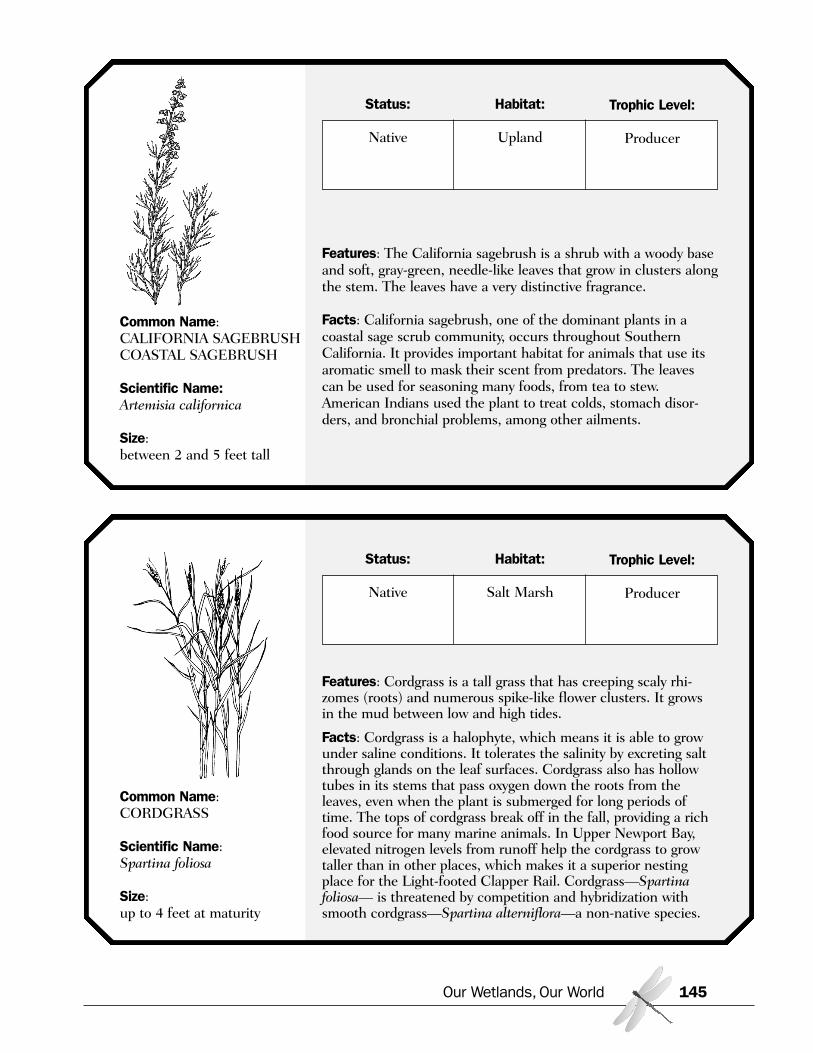
Our Wetlands, Our World 145
Common Name: CALIFORNIA SAGEBRUSH COASTAL SAGEBRUSH
Scientific Name: Artemisia californica
Size: between 2 and 5 feet tall
Features: The California sagebrush is a shrub with a woody baseand soft, gray-green, needle-like leaves that grow in clusters alongthe stem. The leaves have a very distinctive fragrance.
Facts: California sagebrush, one of the dominant plants in acoastal sage scrub community, occurs throughout SouthernCalifornia. It provides important habitat for animals that use itsaromatic smell to mask their scent from predators. The leavescan be used for seasoning many foods, from tea to stew.American Indians used the plant to treat colds, stomach disor-ders, and bronchial problems, among other ailments.
Status:
Native
Habitat:
Upland
Trophic Level:
Producer
Common Name: CORDGRASS
Scientific Name: Spartina foliosa
Size: up to 4 feet at maturity
Features: Cordgrass is a tall grass that has creeping scaly rhi-zomes (roots) and numerous spike-like flower clusters. It growsin the mud between low and high tides.
Facts: Cordgrass is a halophyte, which means it is able to growunder saline conditions. It tolerates the salinity by excreting saltthrough glands on the leaf surfaces. Cordgrass also has hollowtubes in its stems that pass oxygen down the roots from theleaves, even when the plant is submerged for long periods oftime. The tops of cordgrass break off in the fall, providing a richfood source for many marine animals. In Upper Newport Bay,elevated nitrogen levels from runoff help the cordgrass to growtaller than in other places, which makes it a superior nestingplace for the Light-footed Clapper Rail. Cordgrass—Spartinafoliosa— is threatened by competition and hybridization withsmooth cordgrass—Spartina alterniflora—a non-native species.
Status:
Native
Habitat:
Salt Marsh
Trophic Level:
Producer
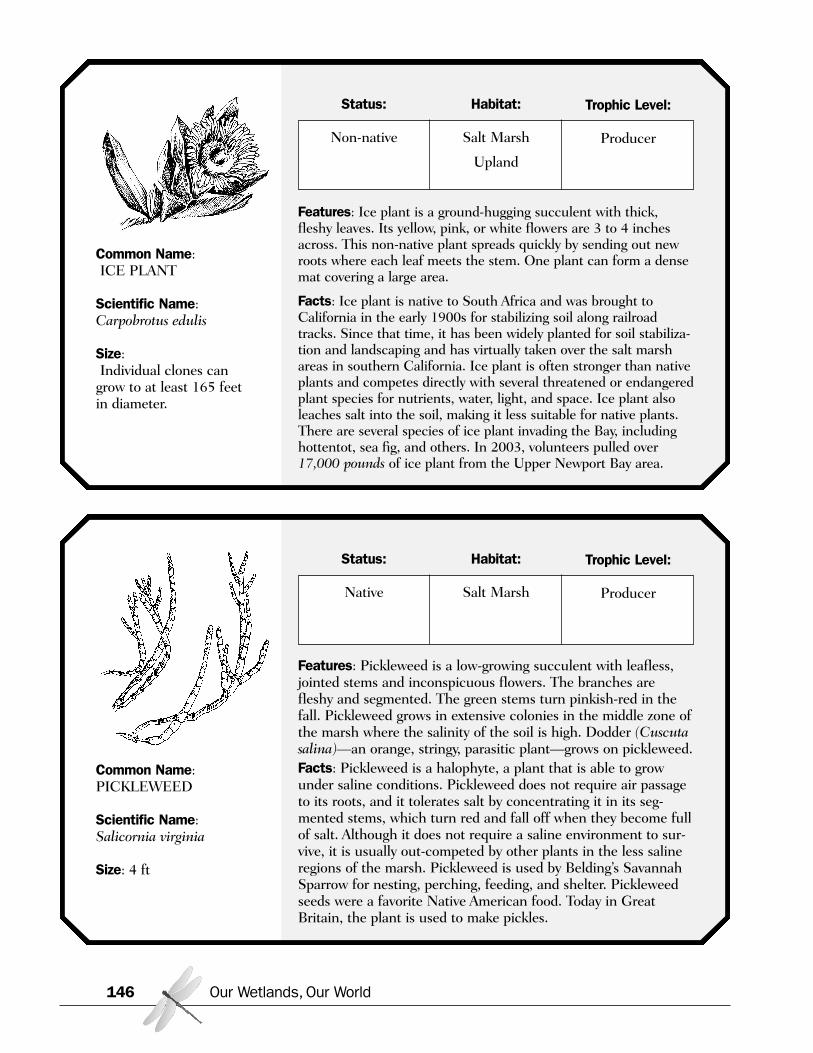
Our Wetlands, Our World146
Common Name:ICE PLANT
Scientific Name:Carpobrotus edulis
Size:Individual clones can
grow to at least 165 feetin diameter.
Features: Ice plant is a ground-hugging succulent with thick,fleshy leaves. Its yellow, pink, or white flowers are 3 to 4 inchesacross. This non-native plant spreads quickly by sending out newroots where each leaf meets the stem. One plant can form a densemat covering a large area.
Facts: Ice plant is native to South Africa and was brought toCalifornia in the early 1900s for stabilizing soil along railroadtracks. Since that time, it has been widely planted for soil stabiliza-tion and landscaping and has virtually taken over the salt marshareas in southern California. Ice plant is often stronger than nativeplants and competes directly with several threatened or endangeredplant species for nutrients, water, light, and space. Ice plant alsoleaches salt into the soil, making it less suitable for native plants.There are several species of ice plant invading the Bay, includinghottentot, sea fig, and others. In 2003, volunteers pulled over17,000 pounds of ice plant from the Upper Newport Bay area.
Status:
Non-native
Habitat:
Salt Marsh
Upland
Trophic Level:
Producer
Common Name: PICKLEWEED
Scientific Name: Salicornia virginia
Size: 4 ft
Features: Pickleweed is a low-growing succulent with leafless,jointed stems and inconspicuous flowers. The branches arefleshy and segmented. The green stems turn pinkish-red in thefall. Pickleweed grows in extensive colonies in the middle zone ofthe marsh where the salinity of the soil is high. Dodder (Cuscutasalina)—an orange, stringy, parasitic plant—grows on pickleweed.Facts: Pickleweed is a halophyte, a plant that is able to growunder saline conditions. Pickleweed does not require air passageto its roots, and it tolerates salt by concentrating it in its seg-mented stems, which turn red and fall off when they become fullof salt. Although it does not require a saline environment to sur-vive, it is usually out-competed by other plants in the less salineregions of the marsh. Pickleweed is used by Belding’s SavannahSparrow for nesting, perching, feeding, and shelter. Pickleweedseeds were a favorite Native American food. Today in GreatBritain, the plant is used to make pickles.
Status:
Native
Habitat:
Salt Marsh
Trophic Level:
Producer
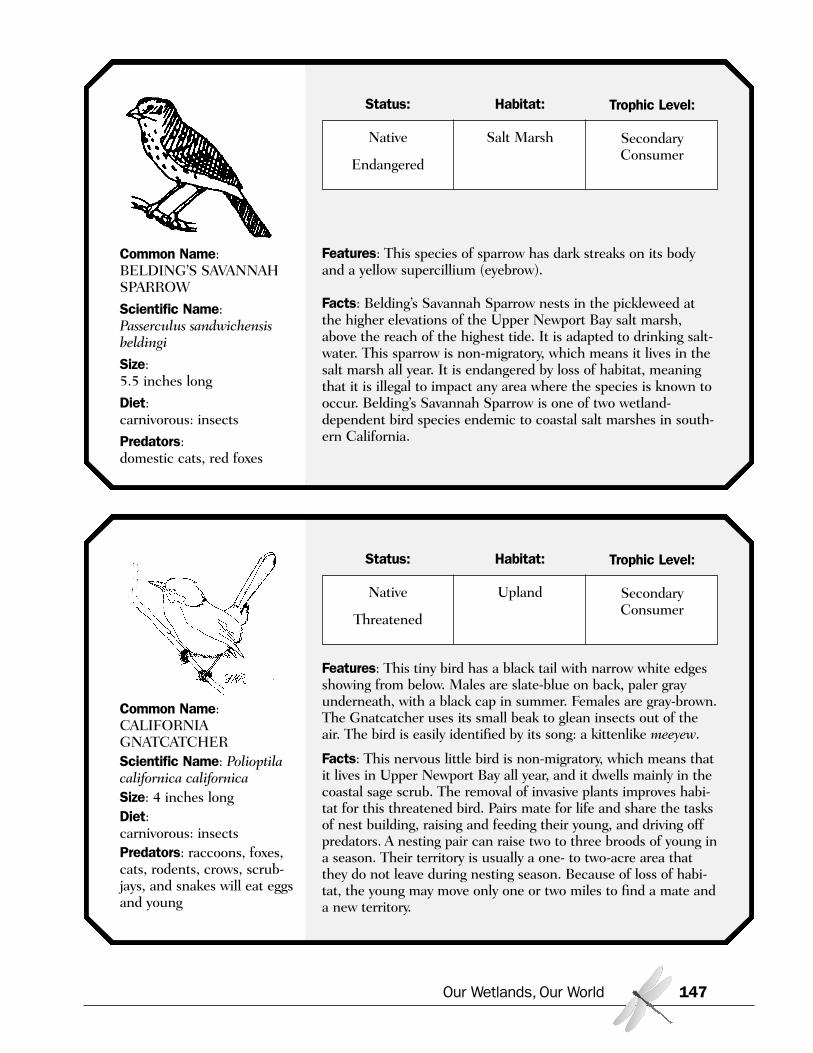
Our Wetlands, Our World 147
Common Name: BELDING’S SAVANNAHSPARROW
Scientific Name: Passerculus sandwichensisbeldingi
Size: 5.5 inches long
Diet: carnivorous: insects
Predators: domestic cats, red foxes
Features: This species of sparrow has dark streaks on its bodyand a yellow supercillium (eyebrow).
Facts: Belding’s Savannah Sparrow nests in the pickleweed atthe higher elevations of the Upper Newport Bay salt marsh,above the reach of the highest tide. It is adapted to drinking salt-water. This sparrow is non-migratory, which means it lives in thesalt marsh all year. It is endangered by loss of habitat, meaningthat it is illegal to impact any area where the species is known tooccur. Belding’s Savannah Sparrow is one of two wetland-dependent bird species endemic to coastal salt marshes in south-ern California.
Status:
Native
Endangered
Habitat:
Salt Marsh
Trophic Level:
SecondaryConsumer
Common Name:CALIFORNIA GNATCATCHERScientific Name: Polioptila californica californicaSize: 4 inches longDiet: carnivorous: insects Predators: raccoons, foxes,cats, rodents, crows, scrub-jays, and snakes will eat eggsand young
Features: This tiny bird has a black tail with narrow white edgesshowing from below. Males are slate-blue on back, paler grayunderneath, with a black cap in summer. Females are gray-brown.The Gnatcatcher uses its small beak to glean insects out of theair. The bird is easily identified by its song: a kittenlike meeyew.
Facts: This nervous little bird is non-migratory, which means thatit lives in Upper Newport Bay all year, and it dwells mainly in thecoastal sage scrub. The removal of invasive plants improves habi-tat for this threatened bird. Pairs mate for life and share the tasksof nest building, raising and feeding their young, and driving offpredators. A nesting pair can raise two to three broods of young ina season. Their territory is usually a one- to two-acre area thatthey do not leave during nesting season. Because of loss of habi-tat, the young may move only one or two miles to find a mate anda new territory.
Status:
Native
Threatened
Habitat:
Upland
Trophic Level:
SecondaryConsumer
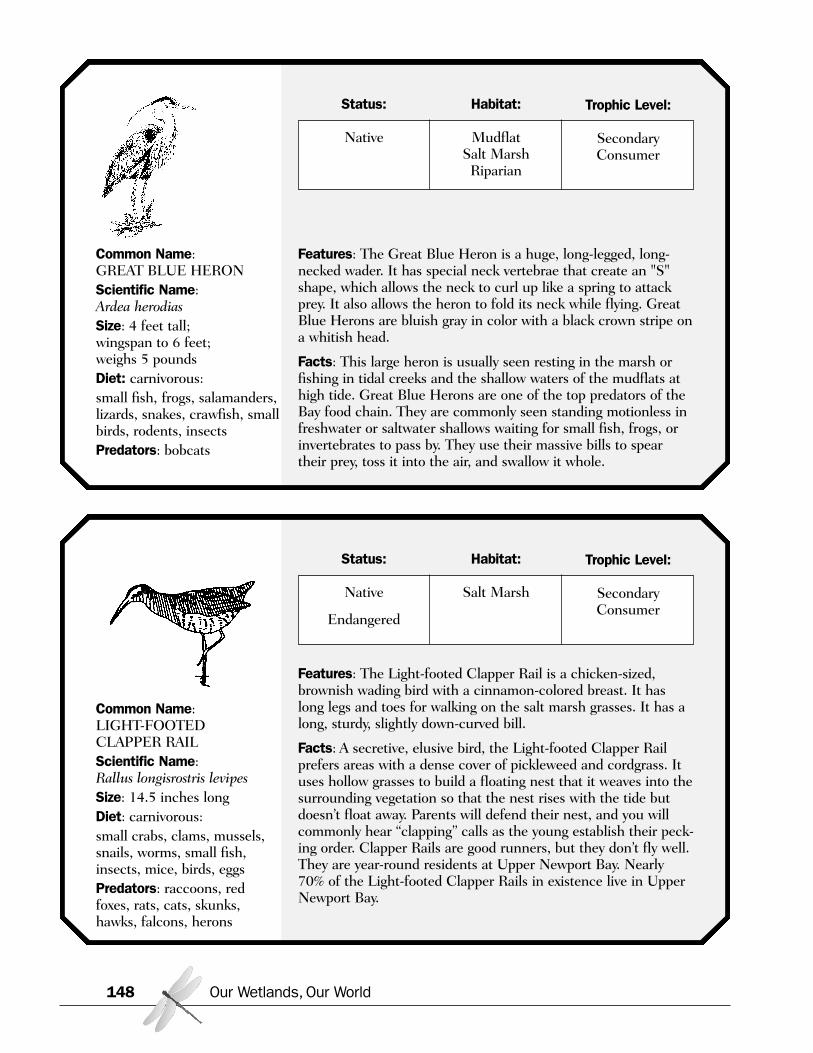
Our Wetlands, Our World148
Common Name: GREAT BLUE HERONScientific Name: Ardea herodiasSize: 4 feet tall;wingspan to 6 feet; weighs 5 poundsDiet: carnivorous:small fish, frogs, salamanders,lizards, snakes, crawfish, smallbirds, rodents, insectsPredators: bobcats
Features: The Great Blue Heron is a huge, long-legged, long-necked wader. It has special neck vertebrae that create an "S"shape, which allows the neck to curl up like a spring to attackprey. It also allows the heron to fold its neck while flying. GreatBlue Herons are bluish gray in color with a black crown stripe ona whitish head.
Facts: This large heron is usually seen resting in the marsh orfishing in tidal creeks and the shallow waters of the mudflats athigh tide. Great Blue Herons are one of the top predators of theBay food chain. They are commonly seen standing motionless infreshwater or saltwater shallows waiting for small fish, frogs, orinvertebrates to pass by. They use their massive bills to speartheir prey, toss it into the air, and swallow it whole.
Status:
Native
Habitat:
MudflatSalt MarshRiparian
Trophic Level:
SecondaryConsumer
Common Name: LIGHT-FOOTED CLAPPER RAILScientific Name: Rallus longisrostris levipesSize: 14.5 inches longDiet: carnivorous:small crabs, clams, mussels,snails, worms, small fish,insects, mice, birds, eggsPredators: raccoons, redfoxes, rats, cats, skunks,hawks, falcons, herons
Features: The Light-footed Clapper Rail is a chicken-sized,brownish wading bird with a cinnamon-colored breast. It haslong legs and toes for walking on the salt marsh grasses. It has along, sturdy, slightly down-curved bill.
Facts: A secretive, elusive bird, the Light-footed Clapper Railprefers areas with a dense cover of pickleweed and cordgrass. Ituses hollow grasses to build a floating nest that it weaves into thesurrounding vegetation so that the nest rises with the tide butdoesn’t float away. Parents will defend their nest, and you willcommonly hear “clapping” calls as the young establish their peck-ing order. Clapper Rails are good runners, but they don’t fly well.They are year-round residents at Upper Newport Bay. Nearly70% of the Light-footed Clapper Rails in existence live in UpperNewport Bay.
Status:
Native
Endangered
Habitat:
Salt Marsh
Trophic Level:
SecondaryConsumer
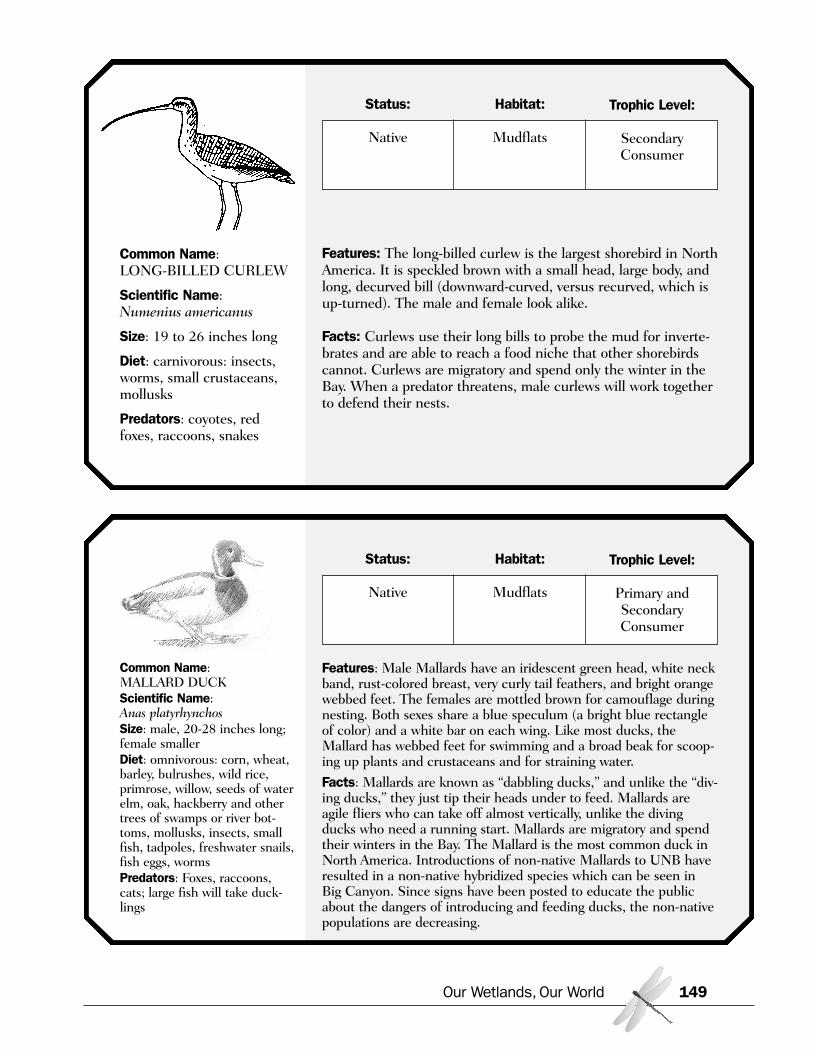
Our Wetlands, Our World 149
Common Name: LONG-BILLED CURLEW
Scientific Name:Numenius americanus
Size: 19 to 26 inches long
Diet: carnivorous: insects,worms, small crustaceans,mollusks
Predators: coyotes, redfoxes, raccoons, snakes
Features: The long-billed curlew is the largest shorebird in NorthAmerica. It is speckled brown with a small head, large body, andlong, decurved bill (downward-curved, versus recurved, which isup-turned). The male and female look alike.
Facts: Curlews use their long bills to probe the mud for inverte-brates and are able to reach a food niche that other shorebirdscannot. Curlews are migratory and spend only the winter in theBay. When a predator threatens, male curlews will work togetherto defend their nests.
Status:
Native
Habitat:
Mudflats
Trophic Level:
SecondaryConsumer
Common Name: MALLARD DUCKScientific Name: Anas platyrhynchosSize: male, 20-28 inches long;female smallerDiet: omnivorous: corn, wheat,barley, bulrushes, wild rice,primrose, willow, seeds of waterelm, oak, hackberry and othertrees of swamps or river bot-toms, mollusks, insects, smallfish, tadpoles, freshwater snails,fish eggs, wormsPredators: Foxes, raccoons,cats; large fish will take duck-lings
Features: Male Mallards have an iridescent green head, white neckband, rust-colored breast, very curly tail feathers, and bright orangewebbed feet. The females are mottled brown for camouflage duringnesting. Both sexes share a blue speculum (a bright blue rectangleof color) and a white bar on each wing. Like most ducks, theMallard has webbed feet for swimming and a broad beak for scoop-ing up plants and crustaceans and for straining water.
Facts: Mallards are known as “dabbling ducks,” and unlike the “div-ing ducks,” they just tip their heads under to feed. Mallards areagile fliers who can take off almost vertically, unlike the divingducks who need a running start. Mallards are migratory and spendtheir winters in the Bay. The Mallard is the most common duck inNorth America. Introductions of non-native Mallards to UNB haveresulted in a non-native hybridized species which can be seen inBig Canyon. Since signs have been posted to educate the publicabout the dangers of introducing and feeding ducks, the non-nativepopulations are decreasing.
Status:
Native
Habitat:
Mudflats
Trophic Level:
Primary andSecondaryConsumer
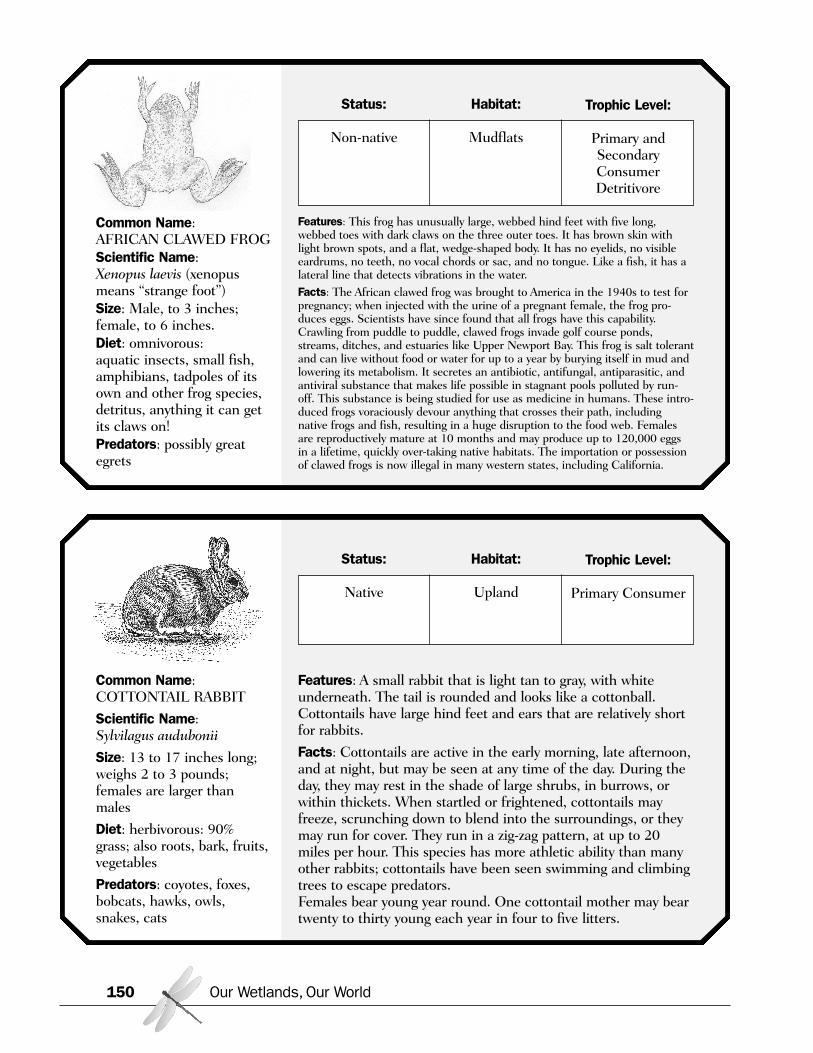
Our Wetlands, Our World150
Common Name: AFRICAN CLAWED FROGScientific Name: Xenopus laevis (xenopusmeans “strange foot”)Size: Male, to 3 inches;female, to 6 inches.Diet: omnivorous:aquatic insects, small fish,amphibians, tadpoles of itsown and other frog species,detritus, anything it can getits claws on!Predators: possibly greategrets
Features: This frog has unusually large, webbed hind feet with five long,webbed toes with dark claws on the three outer toes. It has brown skin withlight brown spots, and a flat, wedge-shaped body. It has no eyelids, no visibleeardrums, no teeth, no vocal chords or sac, and no tongue. Like a fish, it has alateral line that detects vibrations in the water.Facts: The African clawed frog was brought to America in the 1940s to test forpregnancy; when injected with the urine of a pregnant female, the frog pro-duces eggs. Scientists have since found that all frogs have this capability.Crawling from puddle to puddle, clawed frogs invade golf course ponds,streams, ditches, and estuaries like Upper Newport Bay. This frog is salt tolerantand can live without food or water for up to a year by burying itself in mud andlowering its metabolism. It secretes an antibiotic, antifungal, antiparasitic, andantiviral substance that makes life possible in stagnant pools polluted by run-off. This substance is being studied for use as medicine in humans. These intro-duced frogs voraciously devour anything that crosses their path, includingnative frogs and fish, resulting in a huge disruption to the food web. Femalesare reproductively mature at 10 months and may produce up to 120,000 eggsin a lifetime, quickly over-taking native habitats. The importation or possessionof clawed frogs is now illegal in many western states, including California.
Status:
Non-native
Habitat:
Mudflats
Trophic Level:
Primary andSecondaryConsumerDetritivore
Common Name: COTTONTAIL RABBIT
Scientific Name: Sylvilagus audubonii
Size: 13 to 17 inches long;weighs 2 to 3 pounds;females are larger thanmales
Diet: herbivorous: 90%grass; also roots, bark, fruits,vegetables
Predators: coyotes, foxes,bobcats, hawks, owls,snakes, cats
Features: A small rabbit that is light tan to gray, with whiteunderneath. The tail is rounded and looks like a cottonball.Cottontails have large hind feet and ears that are relatively shortfor rabbits.
Facts: Cottontails are active in the early morning, late afternoon,and at night, but may be seen at any time of the day. During theday, they may rest in the shade of large shrubs, in burrows, orwithin thickets. When startled or frightened, cottontails mayfreeze, scrunching down to blend into the surroundings, or theymay run for cover. They run in a zig-zag pattern, at up to 20miles per hour. This species has more athletic ability than manyother rabbits; cottontails have been seen swimming and climbingtrees to escape predators.Females bear young year round. One cottontail mother may beartwenty to thirty young each year in four to five litters.
Status:
Native
Habitat:
Upland
Trophic Level:
Primary Consumer
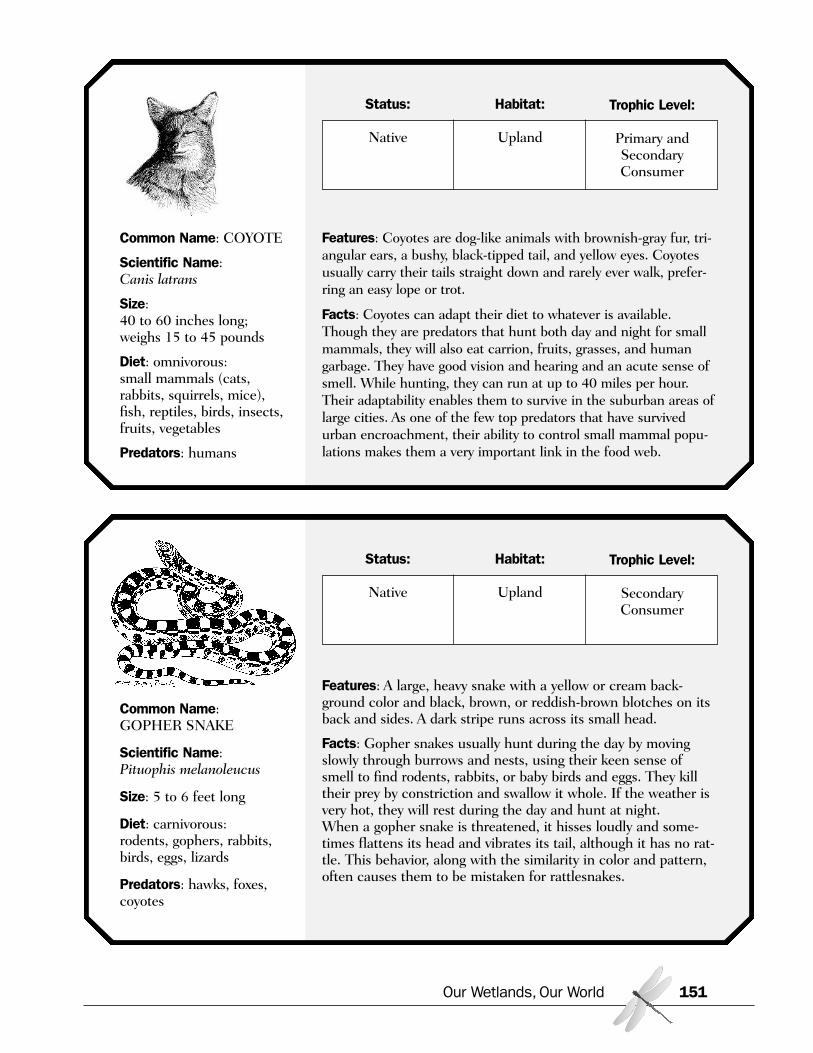
Our Wetlands, Our World 151
Common Name: COYOTE
Scientific Name: Canis latrans
Size: 40 to 60 inches long;weighs 15 to 45 pounds
Diet: omnivorous:small mammals (cats,rabbits, squirrels, mice),fish, reptiles, birds, insects,fruits, vegetables
Predators: humans
Features: Coyotes are dog-like animals with brownish-gray fur, tri-angular ears, a bushy, black-tipped tail, and yellow eyes. Coyotesusually carry their tails straight down and rarely ever walk, prefer-ring an easy lope or trot.
Facts: Coyotes can adapt their diet to whatever is available.Though they are predators that hunt both day and night for smallmammals, they will also eat carrion, fruits, grasses, and humangarbage. They have good vision and hearing and an acute sense ofsmell. While hunting, they can run at up to 40 miles per hour.Their adaptability enables them to survive in the suburban areas oflarge cities. As one of the few top predators that have survivedurban encroachment, their ability to control small mammal popu-lations makes them a very important link in the food web.
Status:
Native
Habitat:
Upland
Trophic Level:
Primary andSecondaryConsumer
Common Name: GOPHER SNAKE
Scientific Name:Pituophis melanoleucus
Size: 5 to 6 feet long
Diet: carnivorous:rodents, gophers, rabbits,birds, eggs, lizards
Predators: hawks, foxes,coyotes
Features: A large, heavy snake with a yellow or cream back-ground color and black, brown, or reddish-brown blotches on itsback and sides. A dark stripe runs across its small head.
Facts: Gopher snakes usually hunt during the day by movingslowly through burrows and nests, using their keen sense ofsmell to find rodents, rabbits, or baby birds and eggs. They killtheir prey by constriction and swallow it whole. If the weather isvery hot, they will rest during the day and hunt at night.When a gopher snake is threatened, it hisses loudly and some-times flattens its head and vibrates its tail, although it has no rat-tle. This behavior, along with the similarity in color and pattern,often causes them to be mistaken for rattlesnakes.
Status:
Native
Habitat:
Upland
Trophic Level:
SecondaryConsumer
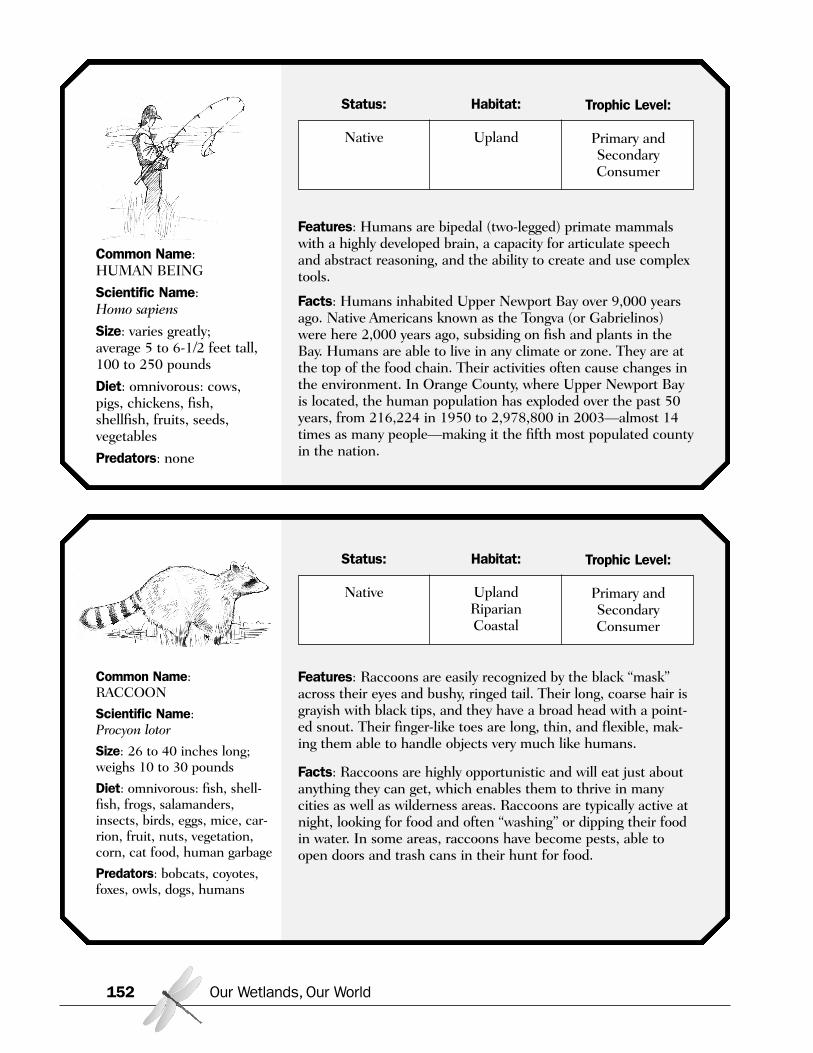
Our Wetlands, Our World152
Common Name: HUMAN BEING
Scientific Name: Homo sapiens
Size: varies greatly; average 5 to 6-1/2 feet tall,100 to 250 pounds
Diet: omnivorous: cows,pigs, chickens, fish,shellfish, fruits, seeds,vegetables
Predators: none
Features: Humans are bipedal (two-legged) primate mammalswith a highly developed brain, a capacity for articulate speechand abstract reasoning, and the ability to create and use complextools.
Facts: Humans inhabited Upper Newport Bay over 9,000 yearsago. Native Americans known as the Tongva (or Gabrielinos)were here 2,000 years ago, subsiding on fish and plants in theBay. Humans are able to live in any climate or zone. They are atthe top of the food chain. Their activities often cause changes inthe environment. In Orange County, where Upper Newport Bayis located, the human population has exploded over the past 50years, from 216,224 in 1950 to 2,978,800 in 2003—almost 14times as many people—making it the fifth most populated countyin the nation.
Status:
Native
Habitat:
Upland
Trophic Level:
Primary andSecondaryConsumer
Common Name: RACCOON
Scientific Name:Procyon lotor
Size: 26 to 40 inches long;weighs 10 to 30 pounds
Diet: omnivorous: fish, shell-fish, frogs, salamanders,insects, birds, eggs, mice, car-rion, fruit, nuts, vegetation,corn, cat food, human garbage
Predators: bobcats, coyotes,foxes, owls, dogs, humans
Features: Raccoons are easily recognized by the black “mask”across their eyes and bushy, ringed tail. Their long, coarse hair isgrayish with black tips, and they have a broad head with a point-ed snout. Their finger-like toes are long, thin, and flexible, mak-ing them able to handle objects very much like humans.
Facts: Raccoons are highly opportunistic and will eat just aboutanything they can get, which enables them to thrive in manycities as well as wilderness areas. Raccoons are typically active atnight, looking for food and often “washing” or dipping their foodin water. In some areas, raccoons have become pests, able toopen doors and trash cans in their hunt for food.
Status:
Native
Habitat:
UplandRiparianCoastal
Trophic Level:
Primary andSecondaryConsumer
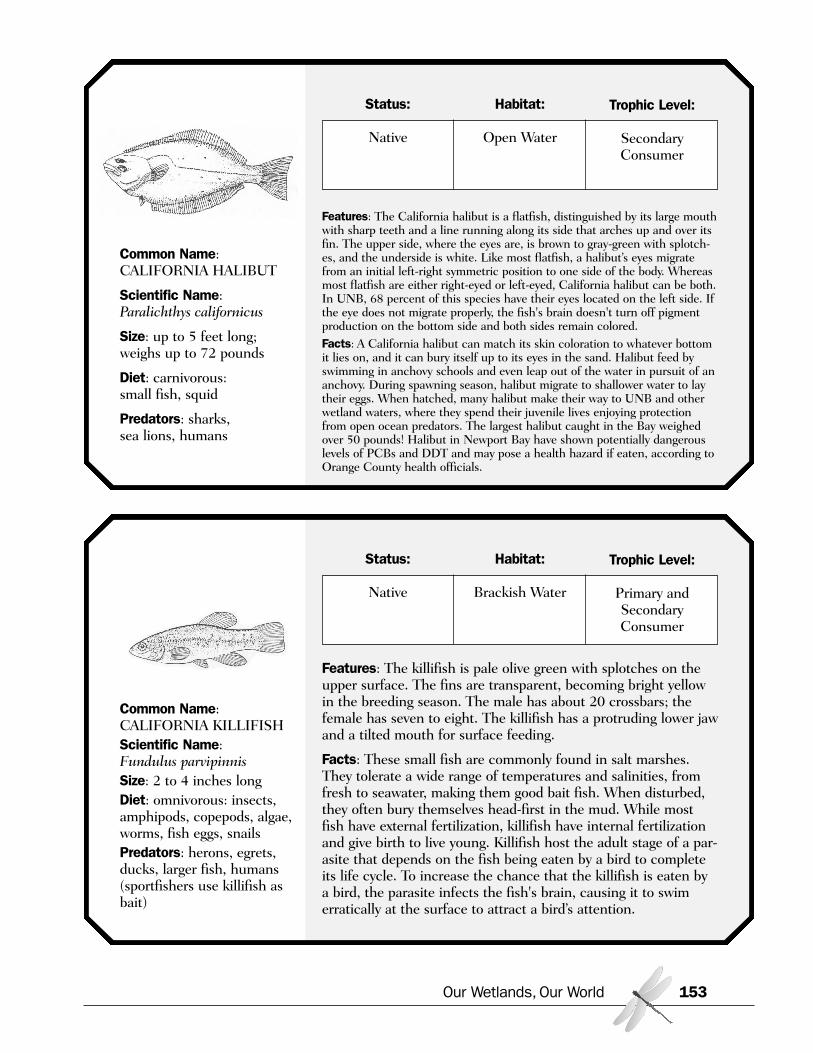
Our Wetlands, Our World 153
Common Name:CALIFORNIA HALIBUT
Scientific Name:Paralichthys californicus
Size: up to 5 feet long;weighs up to 72 pounds
Diet: carnivorous: small fish, squid
Predators: sharks, sea lions, humans
Features: The California halibut is a flatfish, distinguished by its large mouthwith sharp teeth and a line running along its side that arches up and over itsfin. The upper side, where the eyes are, is brown to gray-green with splotch-es, and the underside is white. Like most flatfish, a halibut’s eyes migratefrom an initial left-right symmetric position to one side of the body. Whereasmost flatfish are either right-eyed or left-eyed, California halibut can be both.In UNB, 68 percent of this species have their eyes located on the left side. Ifthe eye does not migrate properly, the fish's brain doesn't turn off pigmentproduction on the bottom side and both sides remain colored. Facts: A California halibut can match its skin coloration to whatever bottomit lies on, and it can bury itself up to its eyes in the sand. Halibut feed byswimming in anchovy schools and even leap out of the water in pursuit of ananchovy. During spawning season, halibut migrate to shallower water to laytheir eggs. When hatched, many halibut make their way to UNB and otherwetland waters, where they spend their juvenile lives enjoying protectionfrom open ocean predators. The largest halibut caught in the Bay weighedover 50 pounds! Halibut in Newport Bay have shown potentially dangerouslevels of PCBs and DDT and may pose a health hazard if eaten, according toOrange County health officials.
Status:
Native
Habitat:
Open Water
Trophic Level:
SecondaryConsumer
Common Name:CALIFORNIA KILLIFISHScientific Name:Fundulus parvipinnisSize: 2 to 4 inches longDiet: omnivorous: insects,amphipods, copepods, algae,worms, fish eggs, snails Predators: herons, egrets,ducks, larger fish, humans(sportfishers use killifish asbait)
Features: The killifish is pale olive green with splotches on theupper surface. The fins are transparent, becoming bright yellowin the breeding season. The male has about 20 crossbars; thefemale has seven to eight. The killifish has a protruding lower jawand a tilted mouth for surface feeding.
Facts: These small fish are commonly found in salt marshes.They tolerate a wide range of temperatures and salinities, fromfresh to seawater, making them good bait fish. When disturbed,they often bury themselves head-first in the mud. While mostfish have external fertilization, killifish have internal fertilizationand give birth to live young. Killifish host the adult stage of a par-asite that depends on the fish being eaten by a bird to completeits life cycle. To increase the chance that the killifish is eaten bya bird, the parasite infects the fish's brain, causing it to swimerratically at the surface to attract a bird’s attention.
Status:
Native
Habitat:
Brackish Water
Trophic Level:
Primary andSecondaryConsumer
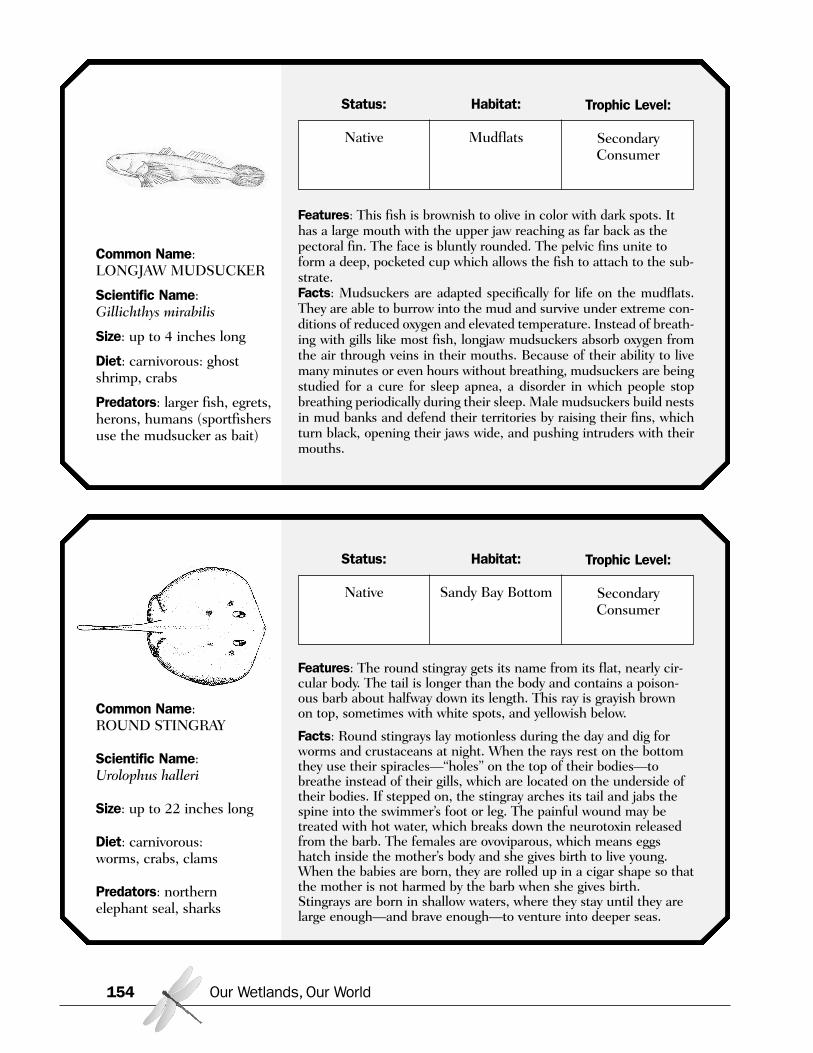
Our Wetlands, Our World154
Common Name:LONGJAW MUDSUCKER
Scientific Name:Gillichthys mirabilis
Size: up to 4 inches long
Diet: carnivorous: ghostshrimp, crabs
Predators: larger fish, egrets,herons, humans (sportfishersuse the mudsucker as bait)
Features: This fish is brownish to olive in color with dark spots. Ithas a large mouth with the upper jaw reaching as far back as thepectoral fin. The face is bluntly rounded. The pelvic fins unite toform a deep, pocketed cup which allows the fish to attach to the sub-strate.Facts: Mudsuckers are adapted specifically for life on the mudflats.They are able to burrow into the mud and survive under extreme con-ditions of reduced oxygen and elevated temperature. Instead of breath-ing with gills like most fish, longjaw mudsuckers absorb oxygen fromthe air through veins in their mouths. Because of their ability to livemany minutes or even hours without breathing, mudsuckers are beingstudied for a cure for sleep apnea, a disorder in which people stopbreathing periodically during their sleep. Male mudsuckers build nestsin mud banks and defend their territories by raising their fins, whichturn black, opening their jaws wide, and pushing intruders with theirmouths.
Status:
Native
Habitat:
Mudflats
Trophic Level:
SecondaryConsumer
Common Name: ROUND STINGRAY
Scientific Name:Urolophus halleri
Size: up to 22 inches long
Diet: carnivorous: worms, crabs, clams
Predators: northernelephant seal, sharks
Features: The round stingray gets its name from its flat, nearly cir-cular body. The tail is longer than the body and contains a poison-ous barb about halfway down its length. This ray is grayish brownon top, sometimes with white spots, and yellowish below.
Facts: Round stingrays lay motionless during the day and dig forworms and crustaceans at night. When the rays rest on the bottomthey use their spiracles—“holes” on the top of their bodies—tobreathe instead of their gills, which are located on the underside oftheir bodies. If stepped on, the stingray arches its tail and jabs thespine into the swimmer’s foot or leg. The painful wound may betreated with hot water, which breaks down the neurotoxin releasedfrom the barb. The females are ovoviparous, which means eggshatch inside the mother’s body and she gives birth to live young.When the babies are born, they are rolled up in a cigar shape so thatthe mother is not harmed by the barb when she gives birth.Stingrays are born in shallow waters, where they stay until they arelarge enough—and brave enough—to venture into deeper seas.
Status:
Native
Habitat:
Sandy Bay Bottom
Trophic Level:
SecondaryConsumer
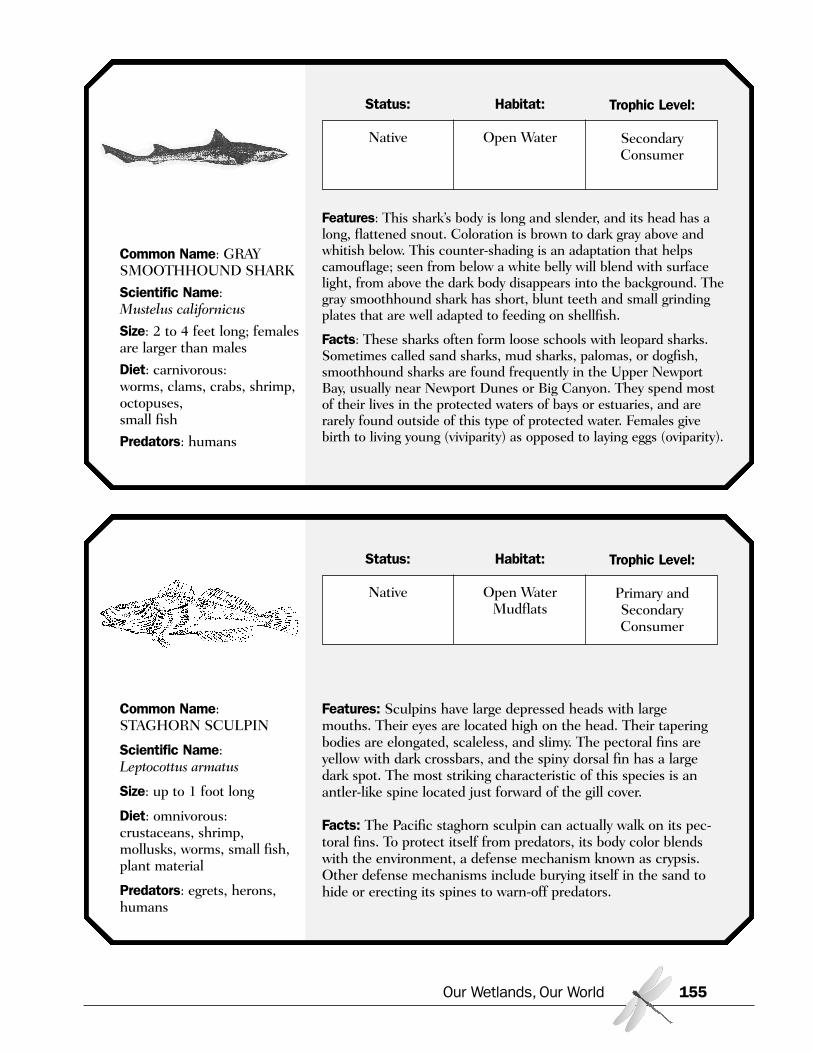
Our Wetlands, Our World 155
Common Name: GRAYSMOOTHHOUND SHARK
Scientific Name:Mustelus californicus
Size: 2 to 4 feet long; femalesare larger than males
Diet: carnivorous: worms, clams, crabs, shrimp,octopuses, small fish
Predators: humans
Features: This shark’s body is long and slender, and its head has along, flattened snout. Coloration is brown to dark gray above andwhitish below. This counter-shading is an adaptation that helpscamouflage; seen from below a white belly will blend with surfacelight, from above the dark body disappears into the background. Thegray smoothhound shark has short, blunt teeth and small grindingplates that are well adapted to feeding on shellfish.
Facts: These sharks often form loose schools with leopard sharks.Sometimes called sand sharks, mud sharks, palomas, or dogfish,smoothhound sharks are found frequently in the Upper NewportBay, usually near Newport Dunes or Big Canyon. They spend mostof their lives in the protected waters of bays or estuaries, and arerarely found outside of this type of protected water. Females givebirth to living young (viviparity) as opposed to laying eggs (oviparity).
Status:
Native
Habitat:
Open Water
Trophic Level:
SecondaryConsumer
Common Name:STAGHORN SCULPIN
Scientific Name:Leptocottus armatus
Size: up to 1 foot long
Diet: omnivorous:crustaceans, shrimp,mollusks, worms, small fish,plant material
Predators: egrets, herons,humans
Features: Sculpins have large depressed heads with largemouths. Their eyes are located high on the head. Their taperingbodies are elongated, scaleless, and slimy. The pectoral fins areyellow with dark crossbars, and the spiny dorsal fin has a largedark spot. The most striking characteristic of this species is anantler-like spine located just forward of the gill cover.
Facts: The Pacific staghorn sculpin can actually walk on its pec-toral fins. To protect itself from predators, its body color blendswith the environment, a defense mechanism known as crypsis.Other defense mechanisms include burying itself in the sand tohide or erecting its spines to warn-off predators.
Status:
Native
Habitat:
Open WaterMudflats
Trophic Level:
Primary andSecondaryConsumer
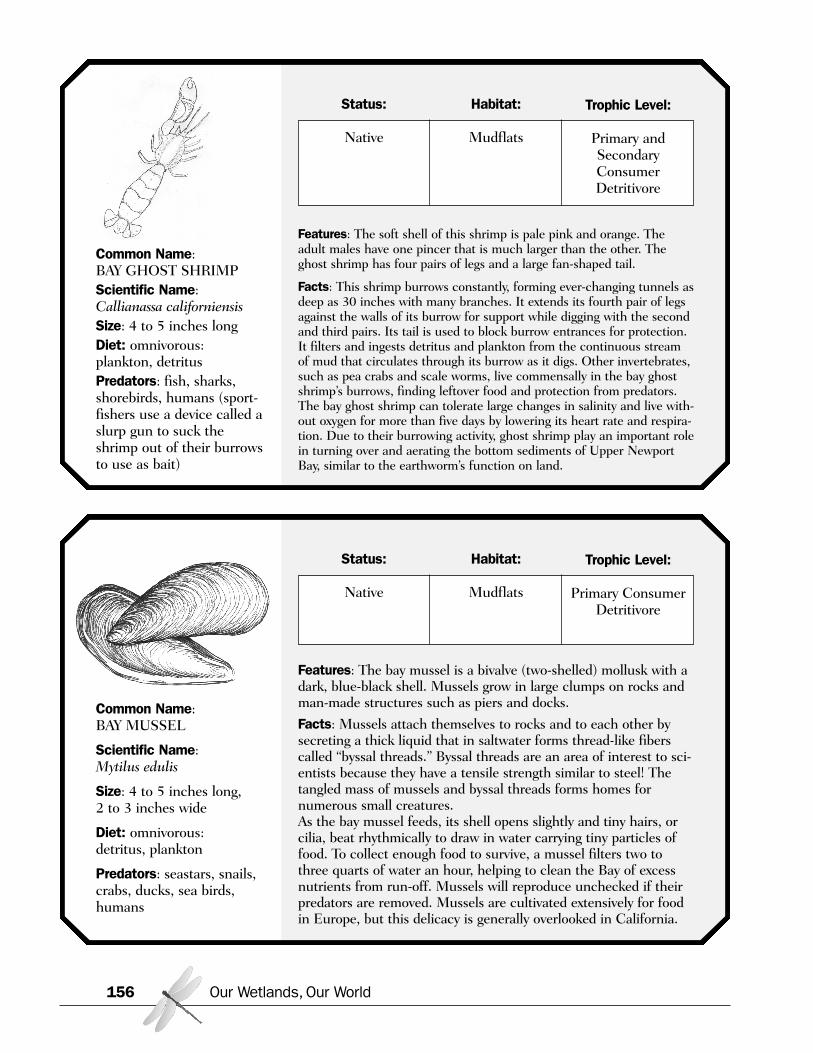
Our Wetlands, Our World156
Common Name:BAY GHOST SHRIMPScientific Name:Callianassa californiensisSize: 4 to 5 inches longDiet: omnivorous:plankton, detritusPredators: fish, sharks,shorebirds, humans (sport-fishers use a device called aslurp gun to suck theshrimp out of their burrowsto use as bait)
Features: The soft shell of this shrimp is pale pink and orange. Theadult males have one pincer that is much larger than the other. Theghost shrimp has four pairs of legs and a large fan-shaped tail.
Facts: This shrimp burrows constantly, forming ever-changing tunnels asdeep as 30 inches with many branches. It extends its fourth pair of legsagainst the walls of its burrow for support while digging with the secondand third pairs. Its tail is used to block burrow entrances for protection.It filters and ingests detritus and plankton from the continuous streamof mud that circulates through its burrow as it digs. Other invertebrates,such as pea crabs and scale worms, live commensally in the bay ghostshrimp’s burrows, finding leftover food and protection from predators. The bay ghost shrimp can tolerate large changes in salinity and live with-out oxygen for more than five days by lowering its heart rate and respira-tion. Due to their burrowing activity, ghost shrimp play an important rolein turning over and aerating the bottom sediments of Upper NewportBay, similar to the earthworm’s function on land.
Status:
Native
Habitat:
Mudflats
Trophic Level:
Primary andSecondaryConsumerDetritivore
Common Name:BAY MUSSEL
Scientific Name:Mytilus edulis
Size: 4 to 5 inches long, 2 to 3 inches wide
Diet: omnivorous: detritus, plankton
Predators: seastars, snails,crabs, ducks, sea birds,humans
Features: The bay mussel is a bivalve (two-shelled) mollusk with adark, blue-black shell. Mussels grow in large clumps on rocks andman-made structures such as piers and docks.
Facts: Mussels attach themselves to rocks and to each other bysecreting a thick liquid that in saltwater forms thread-like fiberscalled “byssal threads.” Byssal threads are an area of interest to sci-entists because they have a tensile strength similar to steel! Thetangled mass of mussels and byssal threads forms homes fornumerous small creatures.As the bay mussel feeds, its shell opens slightly and tiny hairs, orcilia, beat rhythmically to draw in water carrying tiny particles offood. To collect enough food to survive, a mussel filters two tothree quarts of water an hour, helping to clean the Bay of excessnutrients from run-off. Mussels will reproduce unchecked if theirpredators are removed. Mussels are cultivated extensively for foodin Europe, but this delicacy is generally overlooked in California.
Status:
Native
Habitat:
Mudflats
Trophic Level:
Primary ConsumerDetritivore
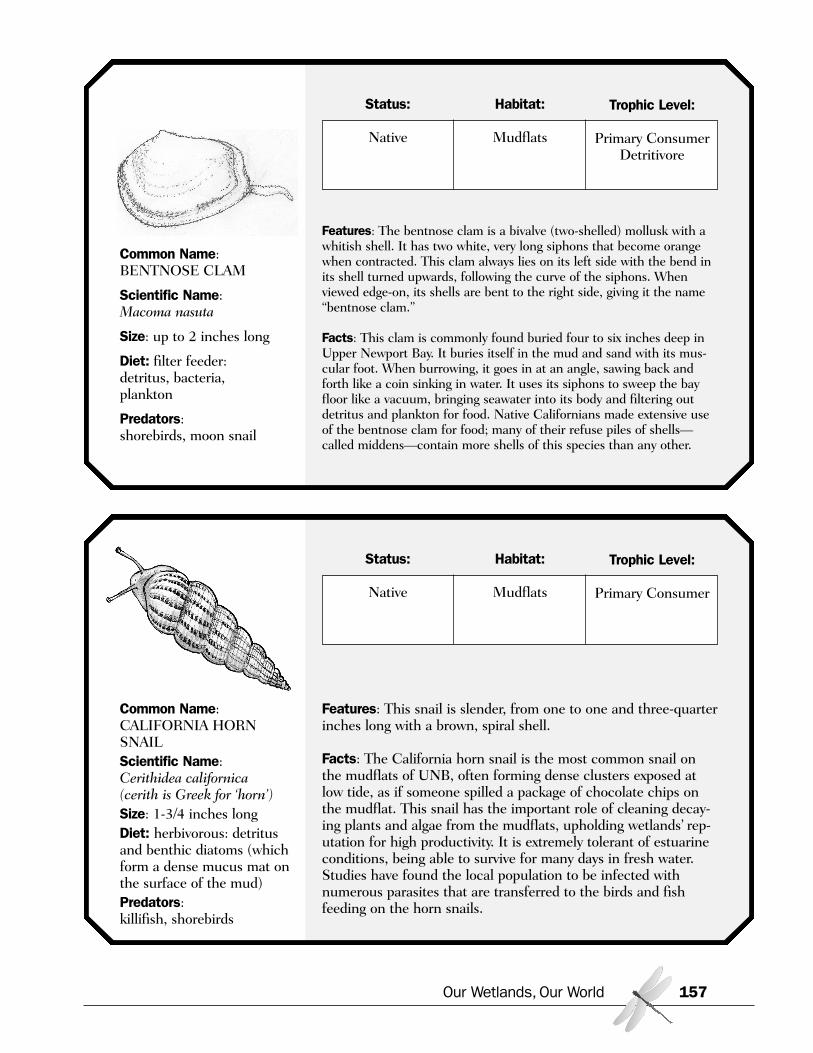
Our Wetlands, Our World 157
Common Name:BENTNOSE CLAM
Scientific Name:Macoma nasuta
Size: up to 2 inches long
Diet: filter feeder: detritus, bacteria, plankton
Predators: shorebirds, moon snail
Features: The bentnose clam is a bivalve (two-shelled) mollusk with awhitish shell. It has two white, very long siphons that become orangewhen contracted. This clam always lies on its left side with the bend inits shell turned upwards, following the curve of the siphons. Whenviewed edge-on, its shells are bent to the right side, giving it the name“bentnose clam.”
Facts: This clam is commonly found buried four to six inches deep inUpper Newport Bay. It buries itself in the mud and sand with its mus-cular foot. When burrowing, it goes in at an angle, sawing back andforth like a coin sinking in water. It uses its siphons to sweep the bayfloor like a vacuum, bringing seawater into its body and filtering outdetritus and plankton for food. Native Californians made extensive useof the bentnose clam for food; many of their refuse piles of shells—called middens—contain more shells of this species than any other.
Status:
Native
Habitat:
Mudflats
Trophic Level:
Primary ConsumerDetritivore
Common Name:CALIFORNIA HORNSNAILScientific Name:Cerithidea californica(cerith is Greek for ‘horn’)Size: 1-3/4 inches longDiet: herbivorous: detritusand benthic diatoms (whichform a dense mucus mat onthe surface of the mud)Predators: killifish, shorebirds
Features: This snail is slender, from one to one and three-quarterinches long with a brown, spiral shell.
Facts: The California horn snail is the most common snail onthe mudflats of UNB, often forming dense clusters exposed atlow tide, as if someone spilled a package of chocolate chips onthe mudflat. This snail has the important role of cleaning decay-ing plants and algae from the mudflats, upholding wetlands’ rep-utation for high productivity. It is extremely tolerant of estuarineconditions, being able to survive for many days in fresh water.Studies have found the local population to be infected withnumerous parasites that are transferred to the birds and fishfeeding on the horn snails.
Status:
Native
Habitat:
Mudflats
Trophic Level:
Primary Consumer
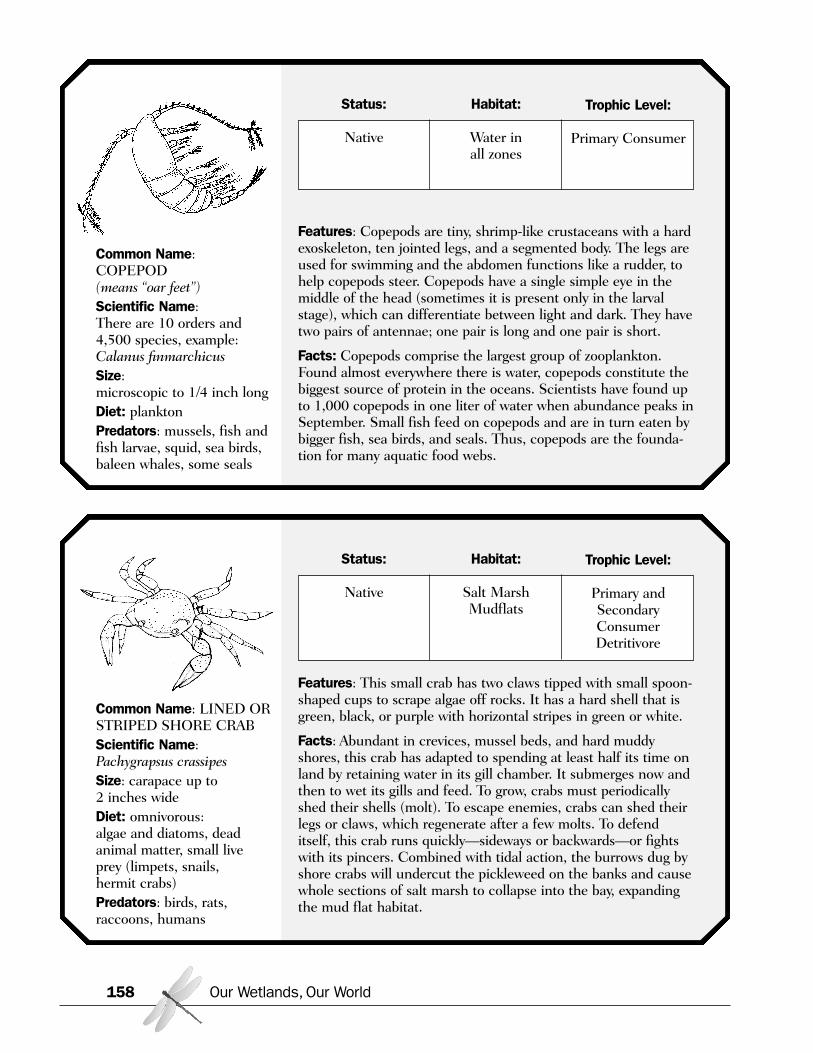
Our Wetlands, Our World158
Common Name: COPEPOD (means “oar feet”)Scientific Name:There are 10 orders and4,500 species, example:Calanus finmarchicusSize: microscopic to 1/4 inch longDiet: planktonPredators: mussels, fish andfish larvae, squid, sea birds,baleen whales, some seals
Features: Copepods are tiny, shrimp-like crustaceans with a hardexoskeleton, ten jointed legs, and a segmented body. The legs areused for swimming and the abdomen functions like a rudder, tohelp copepods steer. Copepods have a single simple eye in themiddle of the head (sometimes it is present only in the larvalstage), which can differentiate between light and dark. They havetwo pairs of antennae; one pair is long and one pair is short.
Facts: Copepods comprise the largest group of zooplankton.Found almost everywhere there is water, copepods constitute thebiggest source of protein in the oceans. Scientists have found upto 1,000 copepods in one liter of water when abundance peaks inSeptember. Small fish feed on copepods and are in turn eaten bybigger fish, sea birds, and seals. Thus, copepods are the founda-tion for many aquatic food webs.
Status:
Native
Habitat:
Water in all zones
Trophic Level:
Primary Consumer
Common Name: LINED ORSTRIPED SHORE CRABScientific Name:Pachygrapsus crassipesSize: carapace up to 2 inches wideDiet: omnivorous:algae and diatoms, dead animal matter, small live prey (limpets, snails, hermit crabs)Predators: birds, rats,raccoons, humans
Features: This small crab has two claws tipped with small spoon-shaped cups to scrape algae off rocks. It has a hard shell that isgreen, black, or purple with horizontal stripes in green or white.
Facts: Abundant in crevices, mussel beds, and hard muddyshores, this crab has adapted to spending at least half its time onland by retaining water in its gill chamber. It submerges now andthen to wet its gills and feed. To grow, crabs must periodicallyshed their shells (molt). To escape enemies, crabs can shed theirlegs or claws, which regenerate after a few molts. To defenditself, this crab runs quickly—sideways or backwards—or fightswith its pincers. Combined with tidal action, the burrows dug byshore crabs will undercut the pickleweed on the banks and causewhole sections of salt marsh to collapse into the bay, expandingthe mud flat habitat.
Status:
Native
Habitat:
Salt MarshMudflats
Trophic Level:
Primary andSecondaryConsumerDetritivore
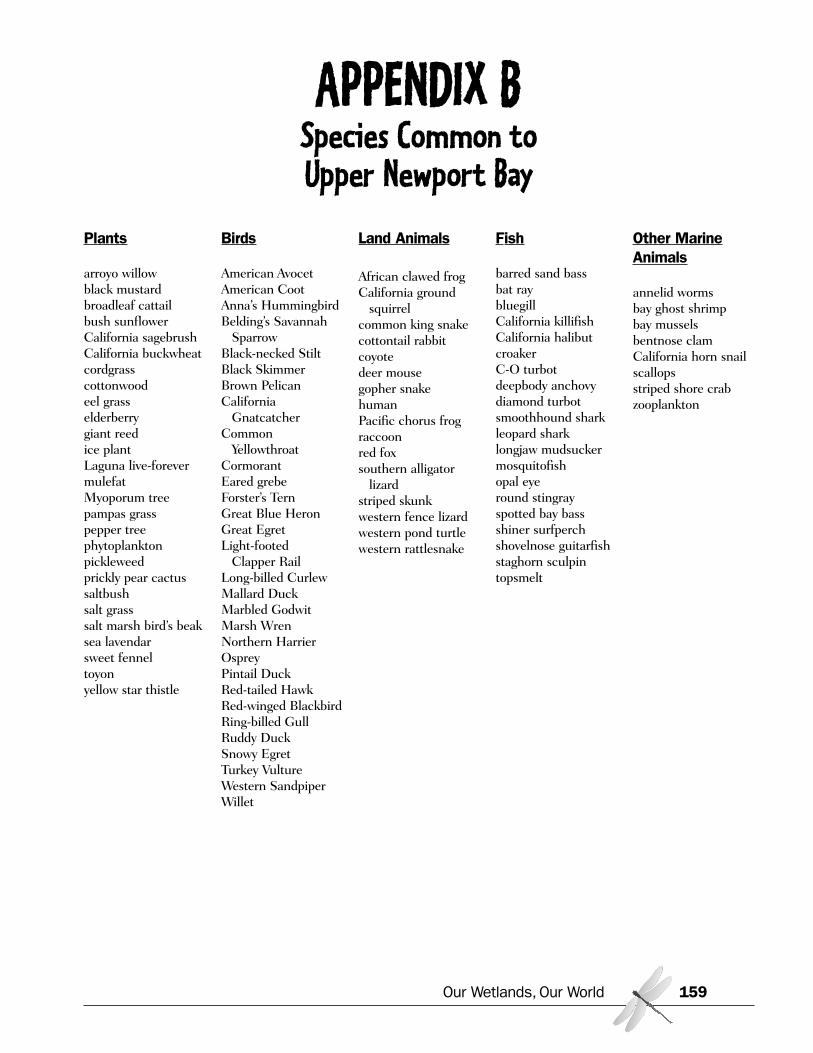
Our Wetlands, Our World 159
Plants
arroyo willowblack mustardbroadleaf cattailbush sunflowerCalifornia sagebrushCalifornia buckwheatcordgrasscottonwoodeel grasselderberrygiant reedice plantLaguna live-forevermulefatMyoporum treepampas grasspepper treephytoplanktonpickleweedprickly pear cactussaltbushsalt grasssalt marsh bird’s beaksea lavendarsweet fenneltoyonyellow star thistle
Birds
American AvocetAmerican CootAnna’s HummingbirdBelding’s Savannah
SparrowBlack-necked StiltBlack SkimmerBrown PelicanCalifornia
GnatcatcherCommon
YellowthroatCormorantEared grebeForster’s TernGreat Blue HeronGreat EgretLight-footed
Clapper RailLong-billed CurlewMallard DuckMarbled GodwitMarsh Wren Northern HarrierOspreyPintail DuckRed-tailed HawkRed-winged BlackbirdRing-billed GullRuddy DuckSnowy EgretTurkey VultureWestern SandpiperWillet
Land Animals
African clawed frogCalifornia ground
squirrelcommon king snakecottontail rabbitcoyotedeer mousegopher snakehumanPacific chorus frograccoonred foxsouthern alligator
lizardstriped skunkwestern fence lizardwestern pond turtlewestern rattlesnake
Fish
barred sand bassbat raybluegillCalifornia killifishCalifornia halibutcroakerC-O turbotdeepbody anchovydiamond turbotsmoothhound sharkleopard sharklongjaw mudsuckermosquitofishopal eyeround stingrayspotted bay bassshiner surfperchshovelnose guitarfishstaghorn sculpintopsmelt
Other MarineAnimals
annelid wormsbay ghost shrimpbay musselsbentnose clamCalifornia horn snailscallopsstriped shore crabzooplankton
APPENDIX BSpecies Common to Upper Newport Bay
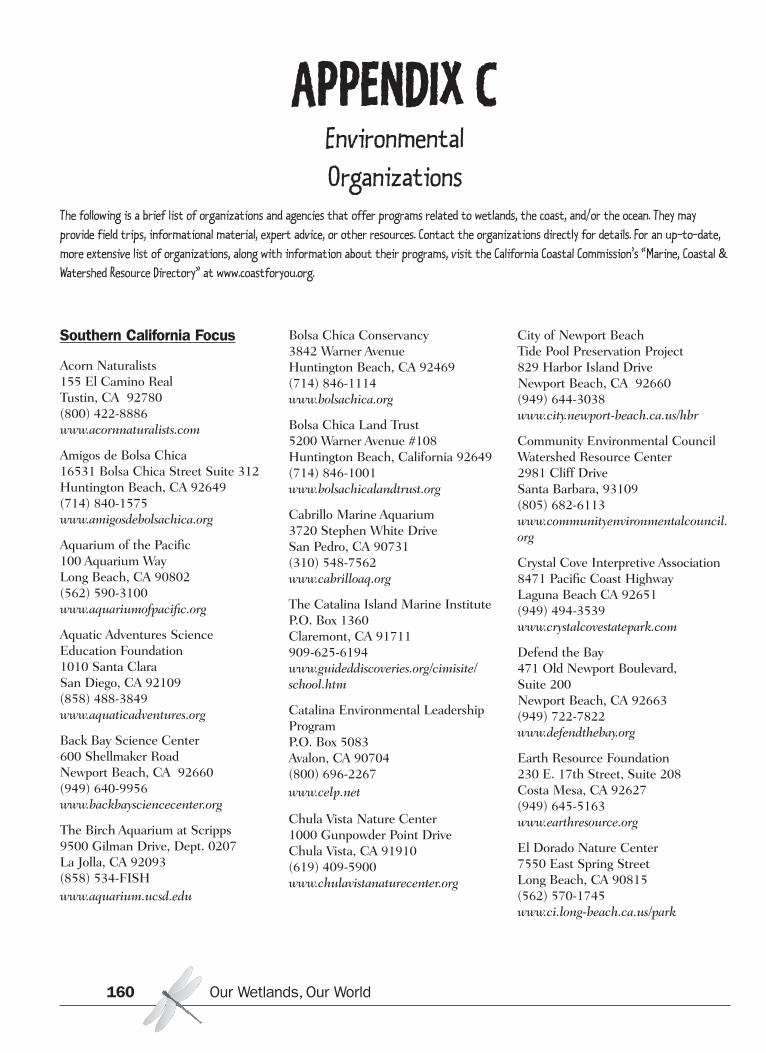
Southern California Focus
Acorn Naturalists155 El Camino Real Tustin, CA 92780 (800) 422-8886www.acornnaturalists.com
Amigos de Bolsa Chica16531 Bolsa Chica Street Suite 312Huntington Beach, CA 92649(714) 840-1575www.amigosdebolsachica.org
Aquarium of the Pacific100 Aquarium WayLong Beach, CA 90802(562) 590-3100www.aquariumofpacific.org
Aquatic Adventures ScienceEducation Foundation1010 Santa ClaraSan Diego, CA 92109(858) 488-3849www.aquaticadventures.org
Back Bay Science Center600 Shellmaker RoadNewport Beach, CA 92660(949) 640-9956www.backbaysciencecenter.org
The Birch Aquarium at Scripps9500 Gilman Drive, Dept. 0207La Jolla, CA 92093(858) 534-FISHwww.aquarium.ucsd.edu
Bolsa Chica Conservancy3842 Warner AvenueHuntington Beach, CA 92469(714) 846-1114www.bolsachica.org
Bolsa Chica Land Trust5200 Warner Avenue #108Huntington Beach, California 92649(714) 846-1001www.bolsachicalandtrust.org
Cabrillo Marine Aquarium3720 Stephen White DriveSan Pedro, CA 90731(310) 548-7562www.cabrilloaq.org
The Catalina Island Marine InstituteP.O. Box 1360Claremont, CA 91711909-625-6194www.guideddiscoveries.org/cimisite/school.htm
Catalina Environmental LeadershipProgram P.O. Box 5083Avalon, CA 90704(800) 696-2267www.celp.net
Chula Vista Nature Center1000 Gunpowder Point DriveChula Vista, CA 91910(619) 409-5900www.chulavistanaturecenter.org
City of Newport BeachTide Pool Preservation Project829 Harbor Island DriveNewport Beach, CA 92660(949) 644-3038www.city.newport-beach.ca.us/hbr
Community Environmental CouncilWatershed Resource Center2981 Cliff DriveSanta Barbara, 93109(805) 682-6113www.communityenvironmentalcouncil.org
Crystal Cove Interpretive Association8471 Pacific Coast HighwayLaguna Beach CA 92651 (949) 494-3539www.crystalcovestatepark.com
Defend the Bay 471 Old Newport Boulevard, Suite 200 Newport Beach, CA 92663 (949) 722-7822www.defendthebay.org
Earth Resource Foundation230 E. 17th Street, Suite 208Costa Mesa, CA 92627(949) 645-5163www.earthresource.org
El Dorado Nature Center7550 East Spring StreetLong Beach, CA 90815(562) 570-1745www.ci.long-beach.ca.us/park
Our Wetlands, Our World160
APPENDIX CEnvironmental
OrganizationsThe following is a brief list of organizations and agencies that offer programs related to wetlands, the coast, and/or the ocean. They may
provide field trips, informational material, expert advice, or other resources. Contact the organizations directly for details. For an up-to-date,
more extensive list of organizations, along with information about their programs, visit the California Coastal Commission’s “Marine, Coastal &
Watershed Resource Directory” at www.coastforyou.org.

Environmental Nature Center1601 Sixteenth StreetNewport Beach, CA 92663(949) 645-8489www.ENCenter.org
Inside the Outdoors Orange County Department ofEducation 200 Kalmus Drive Costa Mesa, CA 92628(714) 708-3885www.insidetheoutdoors.org
Heal the Bay3220 Nebraska AvenueSanta Monica, CA 90404(800) HEAL-BAYwww.healthebay.org
Heal the OceanP.O. Box 90106Santa Barbara, CA 93190(805) 965-7570www.healtheocean.org
Long Beach Marine Institute Box 2816475 E. Pacific Coast HighwayLong Beach, CA 90803 (562) 431-7156www.longbeachmarineinst.com
I Love A Clean San Diego4891 Pacific Highway, Suite 115 San Diego, CA 92110 (619) 291-0103 www.ilacsd.org
Malibu Foundation for Environmental Education1471 S. Bedford Street #3Los Angeles, CA 90035(310) 652-4324www.malibufoundation.org
Mountain and Sea AdventuresP.O. Box 5084 Avalon, CA 90704(310) 510-2695www.mountainandsea.org
Natural History Museum of Los Angeles County900 Exposition BoulevardLos Angeles, CA 90007(213) 763-DINOwww.nhm.org
Santa Barbara Museum of NaturalHistory, Ty Warner Sea Center211 Stearns WharfSanta Barbara, CA 93101(805) 962-2526www.sbnature.org/seacenter
Newport Bay Naturalists and Friends600 Shellmaker RoadNewport Beach, CA 92660(949) 640-6746www.newportbay.org
Ocean Institute24200 Dana Point Harbor DriveDana Point, CA 92629(949) 496-2274www.ocean-institute.org
Orange County Coastkeeper441 Old Newport Boulevard, Suite 103Newport Beach, CA 92663(949) 723-5424www.coastkeeper.org
Peter & Mary Muth Interpretive Center 2301 University Drive Newport Beach, CA 92660 (949)923-2290www.ocparks.com/unbic
Roundhouse Marine Studies Lab & AquariumEnd of the Manhattan Beach PierManhattan Beach, CA 90266310-379-8117www.roundhousemb.com
San Diego Baykeeper2924 Emerson Street, Suite 220San Diego, CA 92106(619) 758-7743www.sdbaykeeper.org
San Dieguito River Park18372 Sycamore Creek RoadEscondido, CA 92025(858) 674-2270www.sdrp.org
Santa Monica BayKeeperP.O. Box 10096Marina del Rey, CA 90295(310) 305-9645www.smbaykeeper.org
Santa Monica BayRestoration Commission320 West 4th Street,Suite 200Los Angeles, CA 90013(213) 576-6615www.santamonicabay.org
Sea and Sage Audubon Society P.O. Box 5447Irvine, CA 92616 (949) 261-7963www.seaandsageaudubon.org
Sea Camp San Diego1380 Garnet AvenuePMB E6San Diego, CA 92109(858) 268-0919www.seacamp.com
SeaLab in Redondo Beach1021 North Harbor DriveRedondo Beach, CA 90277(310) 318-7438www.lacorps.org
Southern California Coastal WaterResearch Project Authority7171 Fenwick Lane Westminster, CA 92683 (714) 894-2222www.sccwrp.org
Southern California Marine Institute820 South Seaside AvenueTerminal Island, CA 90731(310) 519-3172www.scmi.us
Southern California WetlandsRecovery ProjectP.O. Box 22405Santa Barbara, CA 93121(805) 892-4858www.scwrp.org
University of Southern CaliforniaSea Grant ProgramUniversity Park, AMF 209Los Angeles, CA 90089-0373(213) 740-1961www.usc.edu/org/seagrant
Our Wetlands, Our World 161

Statewide Focus
Adopt-A-WatershedP.O. Box 1850Hayfork, CA 96041(530) 628-5334www.adopt-a-watershed.org
Algalita Marine Research Foundation148 Marina Drive Long Beach, CA 90803 (562) 598-4889 www.algalita.org
California Aquatic Science EducationConsortium (CASEC)www.rain.org/casec
California Center for Ocean SciencesEducation Excellence (COSEE)www.cacosee.net
California Coastal Commission45 Fremont Street, Suite 2000San Francisco, CA 94105(800) Coast-4Uwww.coastforyou.org
California Coastal Conservancy1330 Broadway, 11th FloorOakland, CA 94612(510) 286-1015www.coastalconservancy.ca.gov
California Department of ConservationCalifornia Geological Survey801 K Street, MS 12-30Sacramento, CA 95814(916) 445-1825www.consrv.ca.gov/cgs
California Department of Fish and Game1416 Ninth StreetSacramento, CA 95814(916) 445-0411www.dfg.ca.gov
California Department of Water Resources1416 Ninth StreetSacramento, CA 95814(916) 653-5791www.dwr.water.ca.gov
California Native Plant Society2707 K Street, Suite 1 Sacramento, CA 95816(916) 447-2677www.cnps.org
California State Parks1416 Ninth StreetSacramento, CA 95814(800) 777-0369www.parks.ca.gov
California Regional EnvironmentalEducation Community(CREEC) Networkwww.creec.org
Keep California Beautiful3914 Murphy Canyon Road, Suite A-218San Diego, CA 92123(858) 505-9936(800) CLEAN-CAwww.keepcaliforniabeautiful.com
State Water Resources Control Board 1001 I StreetSacramento, CA 95814 (916) 341-5250 www.waterboards.ca.gov
Surfrider FoundationP.O. Box 6010San Clemente, CA 92674-6010(949) 492-8170www.surfrider.org
The Ocean Conservancy2029 K StreetWashington, DC 20006(202) 429-5609www.oceanconservancy.org
U.S. Geological SurveyMarine and Coastal Issues345 Middlefield Road, MS 999Menlo Park, CA 94025(650) 329-5042walrus.wr.usgs.gov
Water Education Foundation717 K Street, Suite 317Sacramento, CA 95814(916) 444-6240www.watereducation.org
Wyland Foundationwww.wylandfoundation.org
Our Wetlands, Our World162
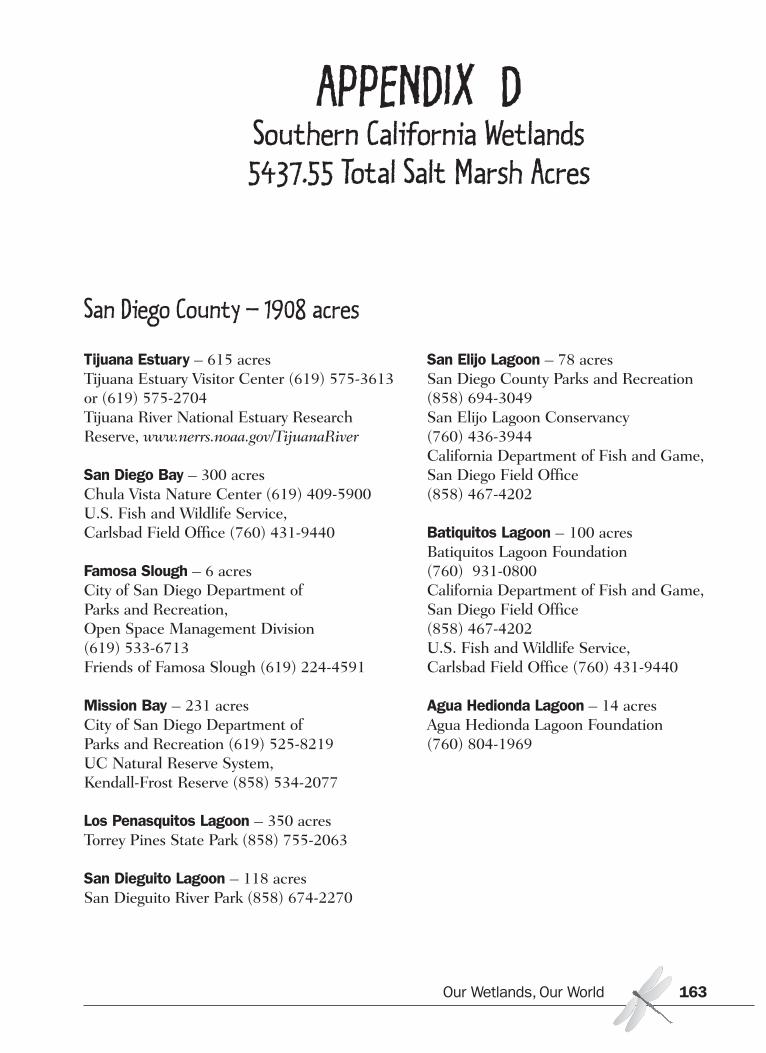
San Diego County – 1908 acres
Tijuana Estuary – 615 acresTijuana Estuary Visitor Center (619) 575-3613or (619) 575-2704Tijuana River National Estuary ResearchReserve, www.nerrs.noaa.gov/TijuanaRiver
San Diego Bay – 300 acresChula Vista Nature Center (619) 409-5900U.S. Fish and Wildlife Service, Carlsbad Field Office (760) 431-9440
Famosa Slough – 6 acresCity of San Diego Department of Parks and Recreation, Open Space Management Division (619) 533-6713Friends of Famosa Slough (619) 224-4591
Mission Bay – 231 acresCity of San Diego Department of Parks and Recreation (619) 525-8219UC Natural Reserve System, Kendall-Frost Reserve (858) 534-2077
Los Penasquitos Lagoon – 350 acresTorrey Pines State Park (858) 755-2063
San Dieguito Lagoon – 118 acresSan Dieguito River Park (858) 674-2270
San Elijo Lagoon – 78 acresSan Diego County Parks and Recreation (858) 694-3049San Elijo Lagoon Conservancy (760) 436-3944California Department of Fish and Game, San Diego Field Office (858) 467-4202
Batiquitos Lagoon – 100 acresBatiquitos Lagoon Foundation(760) 931-0800California Department of Fish and Game, San Diego Field Office (858) 467-4202U.S. Fish and Wildlife Service, Carlsbad Field Office (760) 431-9440
Agua Hedionda Lagoon – 14 acresAgua Hedionda Lagoon Foundation(760) 804-1969
Our Wetlands, Our World 163
APPENDIX DSouthern California Wetlands5437.55 Total Salt Marsh Acres
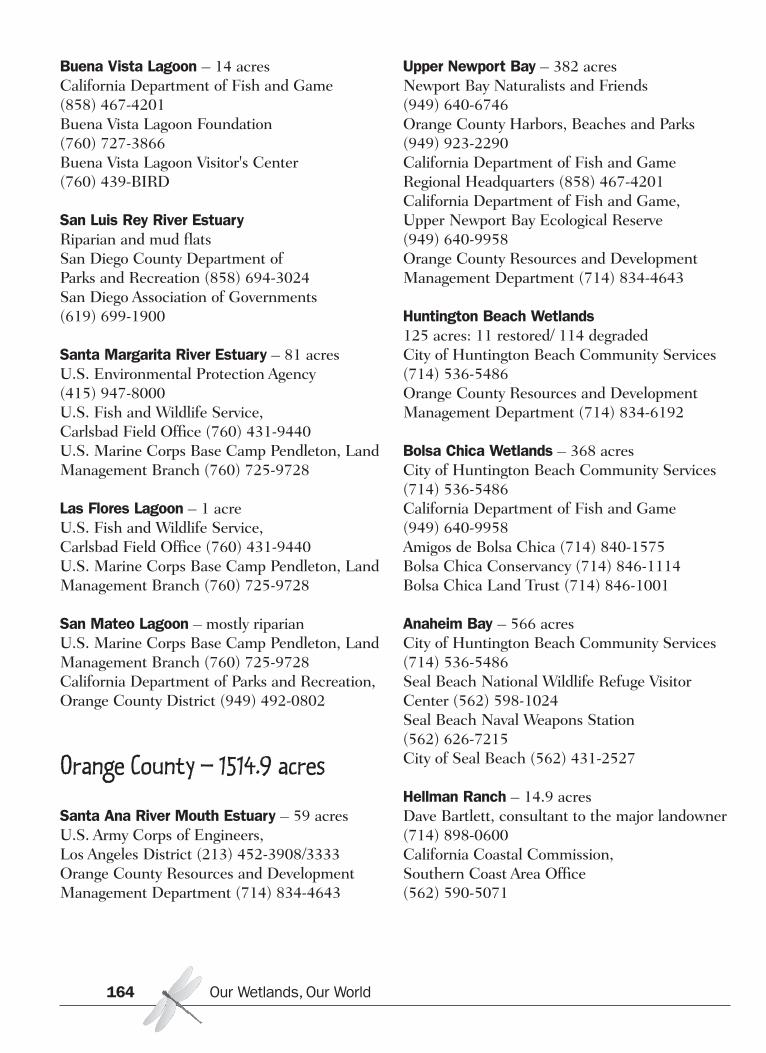
Buena Vista Lagoon – 14 acresCalifornia Department of Fish and Game(858) 467-4201Buena Vista Lagoon Foundation (760) 727-3866Buena Vista Lagoon Visitor's Center (760) 439-BIRD
San Luis Rey River EstuaryRiparian and mud flatsSan Diego County Department of Parks and Recreation (858) 694-3024San Diego Association of Governments (619) 699-1900
Santa Margarita River Estuary – 81 acresU.S. Environmental Protection Agency (415) 947-8000U.S. Fish and Wildlife Service, Carlsbad Field Office (760) 431-9440U.S. Marine Corps Base Camp Pendleton, LandManagement Branch (760) 725-9728
Las Flores Lagoon – 1 acreU.S. Fish and Wildlife Service, Carlsbad Field Office (760) 431-9440U.S. Marine Corps Base Camp Pendleton, LandManagement Branch (760) 725-9728
San Mateo Lagoon – mostly riparianU.S. Marine Corps Base Camp Pendleton, LandManagement Branch (760) 725-9728California Department of Parks and Recreation,Orange County District (949) 492-0802
Orange County – 1514.9 acres
Santa Ana River Mouth Estuary – 59 acresU.S. Army Corps of Engineers, Los Angeles District (213) 452-3908/3333Orange County Resources and DevelopmentManagement Department (714) 834-4643
Upper Newport Bay – 382 acresNewport Bay Naturalists and Friends(949) 640-6746Orange County Harbors, Beaches and Parks(949) 923-2290California Department of Fish and GameRegional Headquarters (858) 467-4201California Department of Fish and Game, Upper Newport Bay Ecological Reserve (949) 640-9958Orange County Resources and DevelopmentManagement Department (714) 834-4643
Huntington Beach Wetlands125 acres: 11 restored/ 114 degradedCity of Huntington Beach Community Services(714) 536-5486Orange County Resources and DevelopmentManagement Department (714) 834-6192
Bolsa Chica Wetlands – 368 acresCity of Huntington Beach Community Services(714) 536-5486California Department of Fish and Game (949) 640-9958Amigos de Bolsa Chica (714) 840-1575Bolsa Chica Conservancy (714) 846-1114Bolsa Chica Land Trust (714) 846-1001
Anaheim Bay – 566 acresCity of Huntington Beach Community Services(714) 536-5486Seal Beach National Wildlife Refuge VisitorCenter (562) 598-1024Seal Beach Naval Weapons Station (562) 626-7215City of Seal Beach (562) 431-2527
Hellman Ranch – 14.9 acresDave Bartlett, consultant to the major landowner(714) 898-0600California Coastal Commission, Southern Coast Area Office (562) 590-5071
Our Wetlands, Our World164
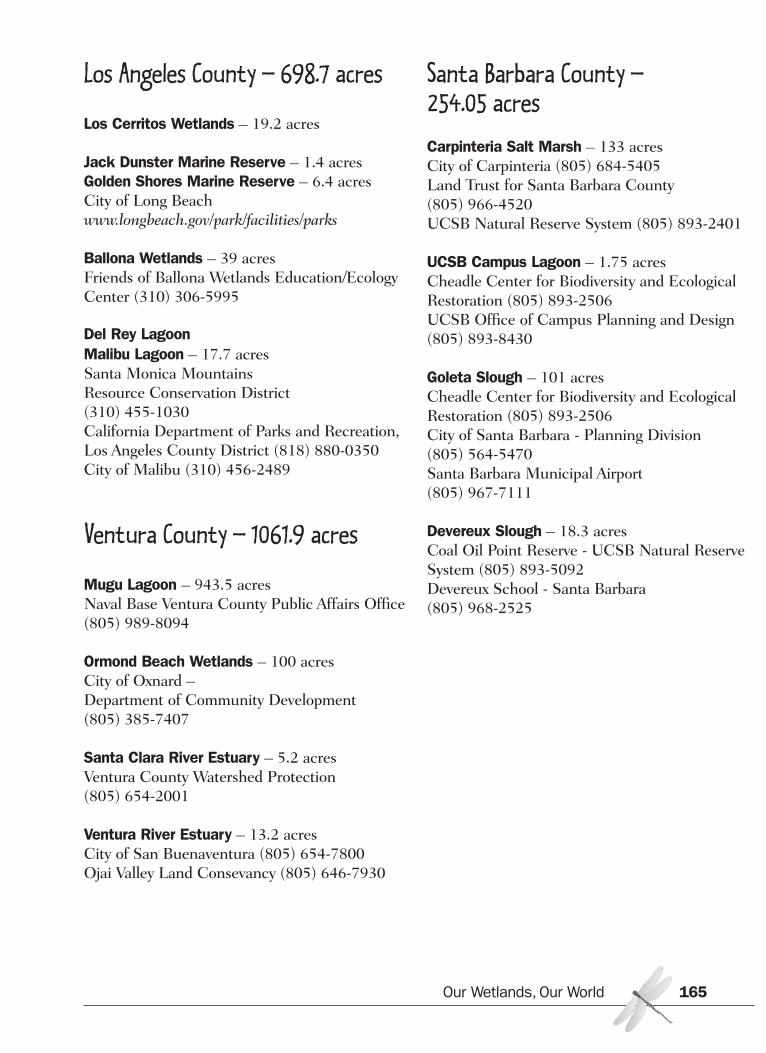
Los Angeles County – 698.7 acres
Los Cerritos Wetlands – 19.2 acres
Jack Dunster Marine Reserve – 1.4 acresGolden Shores Marine Reserve – 6.4 acresCity of Long Beach www.longbeach.gov/park/facilities/parks
Ballona Wetlands – 39 acresFriends of Ballona Wetlands Education/EcologyCenter (310) 306-5995
Del Rey LagoonMalibu Lagoon – 17.7 acresSanta Monica Mountains Resource Conservation District (310) 455-1030California Department of Parks and Recreation,Los Angeles County District (818) 880-0350City of Malibu (310) 456-2489
Ventura County – 1061.9 acres
Mugu Lagoon – 943.5 acresNaval Base Ventura County Public Affairs Office(805) 989-8094
Ormond Beach Wetlands – 100 acresCity of Oxnard – Department of Community Development (805) 385-7407
Santa Clara River Estuary – 5.2 acresVentura County Watershed Protection(805) 654-2001
Ventura River Estuary – 13.2 acresCity of San Buenaventura (805) 654-7800Ojai Valley Land Consevancy (805) 646-7930
Santa Barbara County – 254.05 acres
Carpinteria Salt Marsh – 133 acresCity of Carpinteria (805) 684-5405Land Trust for Santa Barbara County (805) 966-4520UCSB Natural Reserve System (805) 893-2401
UCSB Campus Lagoon – 1.75 acresCheadle Center for Biodiversity and EcologicalRestoration (805) 893-2506UCSB Office of Campus Planning and Design(805) 893-8430
Goleta Slough – 101 acresCheadle Center for Biodiversity and EcologicalRestoration (805) 893-2506City of Santa Barbara - Planning Division (805) 564-5470Santa Barbara Municipal Airport (805) 967-7111
Devereux Slough – 18.3 acresCoal Oil Point Reserve - UCSB Natural ReserveSystem (805) 893-5092Devereux School - Santa Barbara (805) 968-2525
Our Wetlands, Our World 165
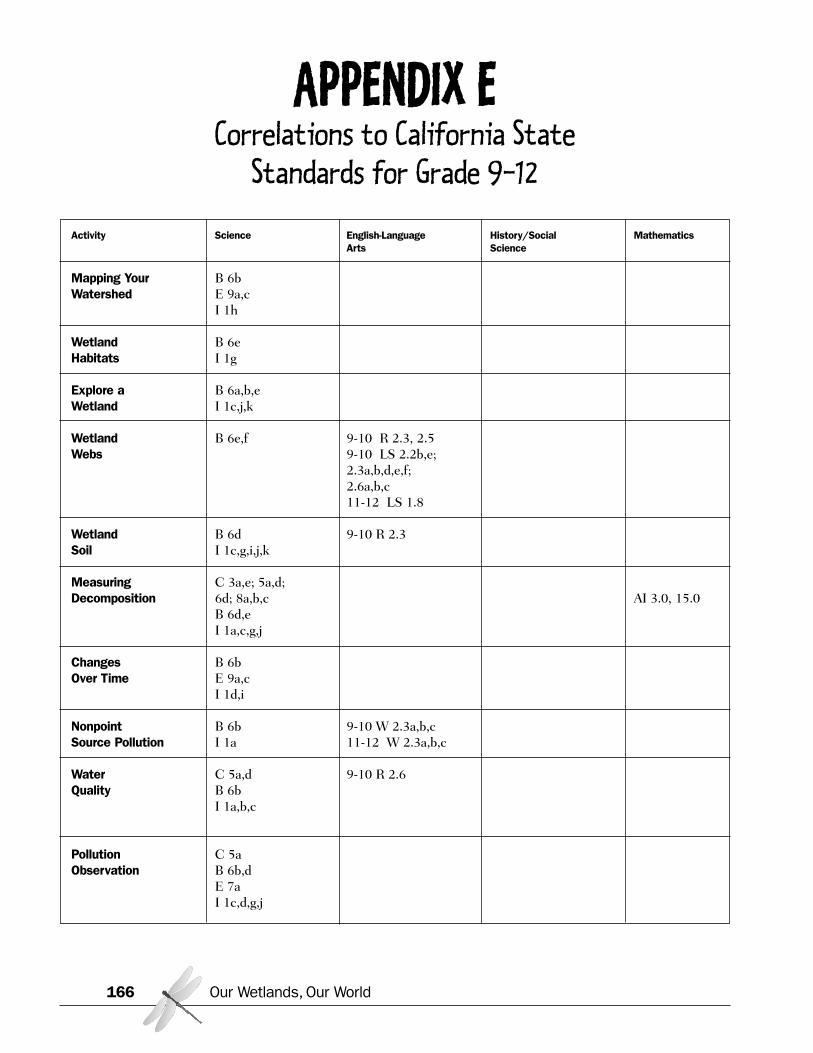
Our Wetlands, Our World166
APPENDIX ECorrelations to California State
Standards for Grade 9-12
Activity Science English-Language History/Social Mathematics Arts Science
Mapping Your B 6bWatershed E 9a,c
I 1h
Wetland B 6eHabitats I 1g
Explore a B 6a,b,eWetland I 1c,j,k
Wetland B 6e,f 9-10 R 2.3, 2.5Webs 9-10 LS 2.2b,e;
2.3a,b,d,e,f; 2.6a,b,c11-12 LS 1.8
Wetland B 6d 9-10 R 2.3Soil I 1c,g,i,j,k
Measuring C 3a,e; 5a,d; Decomposition 6d; 8a,b,c AI 3.0, 15.0
B 6d,eI 1a,c,g,j
Changes B 6bOver Time E 9a,c
I 1d,i
Nonpoint B 6b 9-10 W 2.3a,b,cSource Pollution I 1a 11-12 W 2.3a,b,c
Water C 5a,d 9-10 R 2.6Quality B 6b
I 1a,b,c
Pollution C 5aObservation B 6b,d
E 7aI 1c,d,g,j

Our Wetlands, Our World 167
Activity Science English-Language History/Social Mathematics Arts Science
Space B 6a,b; 8b PS 8.0 for Species I 1a,c,d,g,k
Species B 6a,b,c; 8b 9-10 R 2.2, 2.5in Peril 9-10 W 1.1,1.2,1.3, 1.4,1.5,
9-10 2.3a,b,c,d,e,f9-10 LS 1.7, 2.2a,b,c,d,e,f11-12 W 1.6,1.811-12 LS 1.8
Castaways B 6b 9-10 R 2.3, 2.5 D 12.7.5Park I 1m 9-10 LS 1.1, 1.6, 1.9, 1.12, E 12.1.3
1.13, 2.5a,b,c,d11-12 LS 1.6, 1.8, 1.11, 1.12
Seed C 5a,d PS 6.0Experiments B 6b,e
I 1a,b,c,d
Plant B 6a,b,c,d,e; 8b 9-10 LS 2.2b,c,f; 2.6c PS 8.0Monitoring I 1a,g,j,k 11-12 LS 1.8
Wetlands B 6b 9-10 R 2.3, 2.5, 2.8 D 12.7.5Tradeoffs 9-10 W 1.3, 1.5 E 12.1.1, 12.1.3,
9-10 LS 1.3, 1.6, 1.8, 2.5a,b,c,d 12.1.411-12 R 2.3, 2.4, 2.5, 2.611-12 LS 1.2, 1.3, 1.6, 1.8
Stewardship B 6a,b 9-10 W 1.1, 2.3b,c,d,e,f; D 12.7.59-10 2.5a,b,c,d E 12.1.311-12 R 2.111-12 W 1.3, 1.4
Science: C=Chemistry; B=Biology/Life Sciences; E=Earth Sciences; I=Investigation and ExperimentationEnglish-Language Arts: R=Reading; W=Writing; LS=Listening and SpeakingHistory/Social Science: D=Principles of American Democracy; E=Principles of EconomicsMathematics: AI=Algebra I; PS=Probability and Statistics

Our Wetlands, Our World168