Embed Size (px)
Citation preview

0
ANNUAL PROGRESS REPORT(2014)
AICRP ON WEED CONTROL OUAT CENTRE
OUT LINE PAGE NO
1. General Information of the centre
1
2. Staff position 2
3.
Expenditure statement 3
4-7
4.
5.
Executive summary
Results of practical utility
8
9
6. Recommendation passed to state govt.
10-11
7. Approved technical programme
8.
Meteorological Data
12-13
8.
9.
Research achievements
TSP
14-77
79
10.
List of publications (research, abstract of
seminar/symposia/conference, technical/extension bulletins,
popular articles, books/book chapter, radio/TV talks etc)
80
11. List of trainings/awareness campaign
81
12.
13.
Awards/recognitions/students guided
Linkages and collaboration
82
82
1
GENERAL INFORMATION
1. Project Title : All India Coordinated research
project on weed management
2. Sanction No. : 3-4/96-AFC dt.16.2.000 of ICAR
for the IX Plan period and4.16-
17/AICRP-WC/02/391 dt.6.5.02.
3. Reporting Period : January to December, 2014
4. Date of start : 01.04.1984, ICAR
5. Name of the center : Orissa University of Agriculture
&
1, Bhubaneswar – 751003,
Orissa.
6. Name of the Principal Investigator : Dr. M.M.Mishra
7. Technical Personnel employed : Given in Page 2.
during the report period.

2
II.STAFF POSITION
Sl.
No Post sanctioned Pay scale(Rs)
No.
of
posts
Name of the
incumbent
Present
Pay
(Rs)
Date of
joining
1 Agronomist 374000-
67000+9000(AGP) 1 Dr. M.M. Mishra 51749 01.11.12
2 Jr. Agronomist 374000-
67000+9000(AGP) 1 Dr. R.Dash 46136 19.07.2013
3 Jr. Scientist (Res.
Chemist)
15600-
39100+8000(AGP) 1 Mr.M.M.Behera 24130 25.06.2013
4 V.A.W (T1) 5200-2000(GP)
(Consolidated ) 1 Mr A.K Sahoo
7200
04.12.09
5 Sr. Steno-cum-
Typist
5200-
20200+1900(GP) 1 Smt. S. Sahoo 8210 06.05.06
6 Driver 5200-
20200+2000(GP) 1 Mr. B.K.Bishoi 8940 01.05.08
7 Messenger 4440-
7440+1300(GP) 1 Smt. G.Bewa 8312 20.03.01

3
III.EXPENDITURE STATEMENT (01.04.2014 TO 31.12.2014)
Particulars Amount (Rs.)
Opening Balance as on 01.04.2013 12,54,367
Received during the year 19,50,000
TSP(100% ICAR) 11,23,000
Total Balance 42,03,363
Expenditure during the period
Pay and Allowance 35,56,764
Contingency 1,20,000
TA 30,000
TSP 6,81,000
FLD 40,000
Total Expenditure 30,13,764
Closing Balance as on 01.01.2014 11,95,998*
This includes TSP of 4,80,000 which will be
utilized in this FY
MAP OF ODISHA

4
IV.Executive summary
Major achievements (Rabi 2013--Kharif 2014)
In the said reporting year of 2013-14 a total number of 21 experiments/trials were
conducted out of which 3 programmes were under weed surveillance, 2 under weed
biology and physiology, 6 under weed management in different crops and cropping
systems, 4 under management of problematic / invasive / parasitic / aquatic weed,4
under herbicide residues & environment quality and 2 were under transfer of
technology.
Weed Surveillance
Mikania micrantha,Chromolena odorata, Mimosa Pudica, Parthenium
hysterophorus, Saccharum spontaneum and Lantana camera were
prominent weeds observed in North central plateau Zone of Odisha.
The weed survey conducted in horsegram crop of Banki area revealed that
a new weed i.e Parthenium hysterophorus has been invaded to the crop
field
The results of weed survey in non-cropped area at Banki revealed the
dominance of broad leaf weeds i.e Achyranthus aspera
Orobanche aegyptica: Sporadic incidence of Orobanche was observed in
brinjal and tomato crops under the potential vegetable tracts of Cuttack
and Khurda district along river Mahanadi
Direct seeded rice was heavily infested with grassy weeds like
Dactyloctenium aegyptium.Elusine indica, Leptochloa chinensis,Panicum
spp. In the farmers field.
Celosia argentea is observed to be a severe problem in upland rice and
rabi pulses in the districts of Keonjhar. The weed is invading mostly the
upland areas nearer to the foothills with the soil types belonging to light
textured red soils. The yield loss in rice and pulses due to Celosia was
observed to be in the tune of 40% and 35% , respectively
Echinochloa colona and Digitaria sanguinals are the major grassy weeds
found in kharif ground nut in this zone

5
Weed biology and physiology
Weedy rice infestation was highest in direct seeded rice and least in
transplanted rice in Khorda district of Odisha.
At Bhubaneswar, the highest emergence of (54%) was recorded in Echinochloa
colona and (49 %) in case of Leptochloa chinenesis
Weed management in crops and cropping systems
Post emergence application of pendimethalin+ bispyribac recorded
significantly higher yield of 4.87 t/ha followed by application of
triafamone + ethoxy sulfuron (4.54 t/ha) where as weedy treatment
recorded the lowest yield (1.6 t/ha) .Weed free plots recorded rice yield of
4.98 t/ha..
Post emergence application of pendimethalin+ bispyribac recorded lowest
weed index 3.25% followed by triafamone+ethoxysulfuron (6.5 %). The
highest value of 59.39 % was obtained from weedy check treatment
Application of pendimethalin fb bispyribac fb manual weeding recorded
lowest weed index of 1.56 % followed by oxadiargyl fb bispyribac (3.35
%). The highest value of 58.71 % was obtained from weedy check
treatment
Highest net return and B:C ratio of Rs.18900/ha and 2.78 were obtained
respectively from application of pendimethalin fb bispyribac fb manual
weeding followed by oxadiargyl fb bispyribac (Rs17600/ha and 2.72 ).
Weed management in conservation agriculture systems
The practice of CT(trans)-ZT-ZT system of tillage recorded
significantly higher grain yield in both rabi (4232 kg/ha) kharif
season (4114 kg/ha). Practice of ZT(DSR)-ZT+R-ZT system
resulted the lowest grain yield and the yield reduction was in the
tune of 24.7% as compared to CT-CT method in both the seasons.
Among the weed management practices, IWM(herbicide+manual
weeding) proved better than sole herbicide with yields of 4428 kg
ha-1
in rabi and 4341 kg ha-1
in kharif season, respectively. Weed
index values were observed to be maximum in ZT-ZT-ZT system

6
(24.7%) and yield losses due to weeds were 47.5% in both the
seasons.
Practice of CT(Transplanted) tillage methods reduced the weed
densities over ZT(Direct seeded) in the Kharif rice.
During the initial stages (60 DAP), application butachlor (1.5 kg ha-
1) reduced the weed density by 57% over control and 64% in case
of IWM over unweedy check.
The yield reduction in ZT(Direct seeded) method was not
significant compared to CT method
Integration of ZT method and use of butachlor 1.5 kg ha-1
obtained
the maximum B: C ratio of in the kharif rice
o The composition weed seed bank in ZT was dominated with
grasses (63%) followed by broad leaf weeds (24%) and sedges
(13%) and the corresponding values in CT were 66%, 22% and
12%
Management of Orobanche in Brinjal
Application of neem cake 200 kg/ha at sowing fb pendimethalin 1.0 kg/ha as
pre-em, 3 DAP recorded the lowest number of Orobanche/plant, lowest total
weed density at 60 and 90 DAP
Management of Cuscuta chinensis in niger
The germination of Cuscuta was less in Stale seedbed fb pendimethalin 1.0
kg/ha – pre-emergence which resulted in the highest grain yield of niger
Herbicide residues in long-term herbicide trial
Persistence of herbicides of butachlor and pretilachlor in respective
treatments were of same pattern. Addition of organic matter decreased
the persistence of both the herbicides. No residue could be detected from
60 days after application. No residue was detected in post harvest rice and
ground nut plant parts

7
Studies on herbicide persistence in water
Herbicides like pretilachlor and butachlor could not be detected in
water samples collected from water bodies nearby the fields sprayed
with them.
Testing of persistence of herbicides in the farmers’ field (soil and crop produce)
Soil samples collected from groundnut fields in Delanga block of
Puri district have showed no residue from 20 days after application
of quizalofop-ethyle @ 0.05 kg/ha. However the residues in post
harvest soils, grain and plant parts were below detectable level.
Transfer of Technology
On Farm trials(6 nos.) conducted on transplanted rice during rabi 2013-14
Alsua village of Banki block of cuttack districts revealed Maximum yield
of 4.21 t/ha was recorded in the plot applied with Pretilachlor @ 1.0 lit/ha.
A net saving of Rs 2150 - 2654/ ha was obtained in the plots treated with
herbicides
In groundnut 4 FLDs at Puri district revealed that application of
pendimethalin @ 1.0 kg /ha (3 DAS) increased yield by 21.6 - 39.4% over
farmers practice.
In 10 frontline demonstration conducted on transplanted rice during kharif
2013 in munida,satyabadi of Puri district revealed the yield increase of 21-
42 % with the application bispyribac sodium @ 200 ml/ha at 25 DAT
over farmers’ methods
Tribal sub plan programme
The programme has been operated in two tribal dominated villages of
Sundargarh and Keonjhar district for the overall development of their
livelihood by supplying different farm machineries implements and
agricultural inputs. About 225 farmers were directly benefited under this
programme.

8
VII. Results of Practical Utility
Effective and economic weed control recommendations for major crops of
the state viz. rice, maize, finger millet, groundnut, mustard, sesame, pulses,
sugarcane, jute, cotton and vegetables have been devised and validated in
farmers’ fields under different agro-climatic zones through on-farm trials,
front line demonstrations conducted with the collaboration of agencies like
state agricultural department and Krishi Vigyan Kendras
Relative intensity,distribution and dominance of different dominant weed
flora associated with major crops of the three major Agroclimatic zones of
the state has been surveyed district wise and the weed atlas of the state has
been developed by the Directorate of Weed Science Research, Jabalpur
Yield loss estimation studies revealed the loss due to weeds are 36% in
direct sown upland rice, 15% in transplanted rice, 24% in groundnut, 22%
in maize, 26% in greengram and 28% in sesame
Residual toxicity of common herbicides like butachlor, pretilachlor,
oxyfluorfen and pendimethalin in their standard doses persist maximum up
to 40-50 days after application and are below detectable level in post
harvest soils, grains and plants. Continued application of these herbicides
has no significant effect on soil properties and microbial attributes.
In long term experiment on herbicide in rice-groundnut system, repeated
and rotational use of pretilachlor /butachlor in rice resulted in decrease in
the density of Fimbristylis miliaceae, and new appearance of Cynodon
dactylon which become dominant after 5 years of repeated / rotational use
of herbicides. In ground nut repeated use of alachlor decreased the density
of Digitaria sanguinalis and new appearance of Celosia argentia was
noticed. No significant reduction in yield of rice as well as groundnut have
been noticed due to repeated application of butachlor in rice and alachlor
in mustard continuously for the period of 12 years.
Mexican beetle (Zygogramma bicolorata) on Parthenium was found more
effective with respect to population build-up, establishment and damage on
Parthenium when released in June-July, after first shower of rain as
compared to late release in August-September in the South eastern coastal
belt of Odisha
9
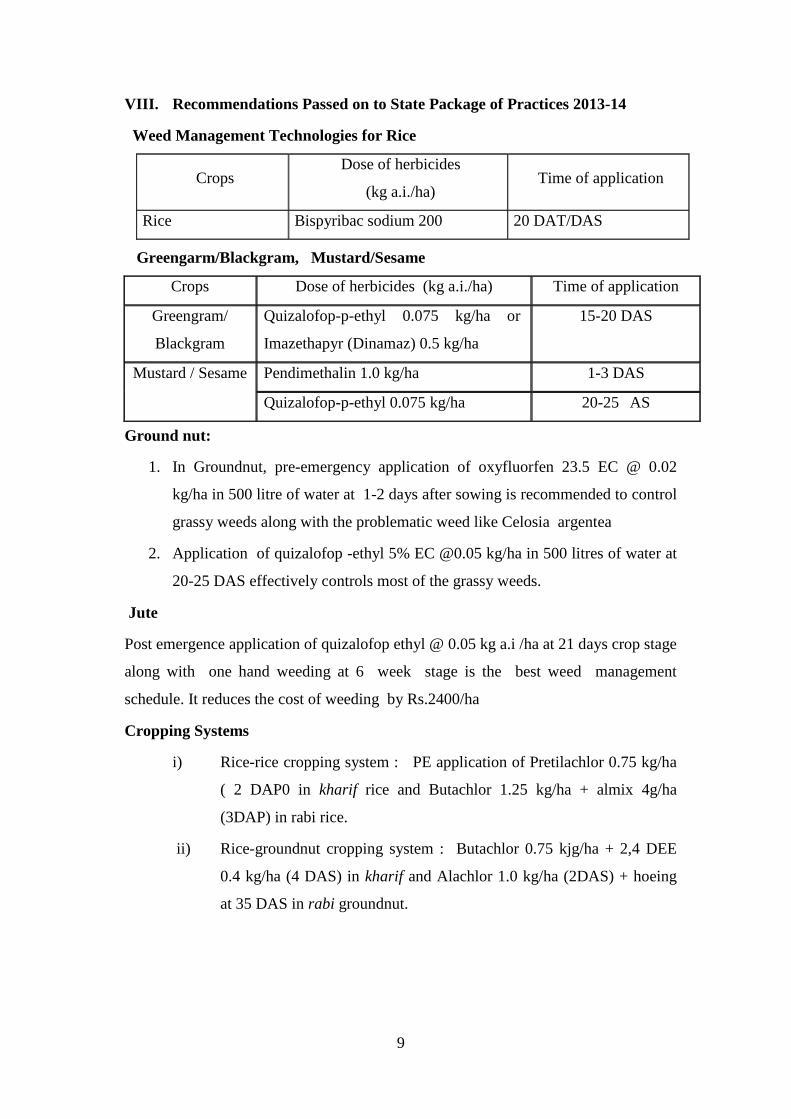
VIII. Recommendations Passed on to State Package of Practices 2013-14
Weed Management Technologies for Rice
Crops Dose of herbicides
(kg a.i./ha) Time of application
Rice Bispyribac sodium 200 20 DAT/DAS
Greengarm/Blackgram, Mustard/Sesame
Crops Dose of herbicides (kg a.i./ha) Time of application
Greengram/
Blackgram
Quizalofop-p-ethyl 0.075 kg/ha or
Imazethapyr (Dinamaz) 0.5 kg/ha
15-20 DAS
Mustard / Sesame Pendimethalin 1.0 kg/ha 1-3 DAS
Quizalofop-p-ethyl 0.075 kg/ha 20-25 AS
Ground nut:
1. In Groundnut, pre-emergency application of oxyfluorfen 23.5 EC @ 0.02
kg/ha in 500 litre of water at 1-2 days after sowing is recommended to control
grassy weeds along with the problematic weed like Celosia argentea
2. Application of quizalofop -ethyl 5% EC @0.05 kg/ha in 500 litres of water at
20-25 DAS effectively controls most of the grassy weeds.
Jute
Post emergence application of quizalofop ethyl @ 0.05 kg a.i /ha at 21 days crop stage
along with one hand weeding at 6 week stage is the best weed management
schedule. It reduces the cost of weeding by Rs.2400/ha
Cropping Systems
i) Rice-rice cropping system : PE application of Pretilachlor 0.75 kg/ha
( 2 DAP0 in kharif rice and Butachlor 1.25 kg/ha + almix 4g/ha
(3DAP) in rabi rice.
ii) Rice-groundnut cropping system : Butachlor 0.75 kjg/ha + 2,4 DEE
0.4 kg/ha (4 DAS) in kharif and Alachlor 1.0 kg/ha (2DAS) + hoeing
at 35 DAS in rabi groundnut.

10
APPROVED TECHNICAL PROGRAMME: 2014-15 and 2015-16
Sl.
No.
Particulars
1. WS 1 Weed surveillance and monitoring
WS 1.1a Monitoring of appearance of new weed species
WS 1.2 Monitoring of weed shift due to weed management practices, changes
in cropping systems and climatic parameters in prevailing ecosystems
WS 1.3 Monitoring of herbicide resistance / escapes in weeds ofthedominant
cropping system
2. WS 2 Weed biology and physiology
WS 2.1a Biology of important weeds
WS 2.1b Weedy rice
3. WS 3 Weed management in crops and cropping systems
WS 3.1 Herbicides combinations for control of complex weed flora in rice
WS 3.1.1 Herbicides combinations for control of complex weed flora in
transplanted rice
WS 3.1.3 Herbicides combinations for control of complex weed flora in direct-
seeded rice (dry/wet)
WS 3.3.3 Integrated weed management in ginger
WS 3.4 Weed management in pulses and oilseed crops
WS 3.4.1 Studies on time of application of imazethapyr and its ready mix
combination with imazamox (Odyssey) against weeds in blackgram
WS 3.6 Weed management in conservation agriculture systems
WS 3.8 Station trials based on location-specific problems
WS 3.8.8 Management of Mikania micrantha: a problematic weed in banana
WS 3.8.9 Weed management in Jute
4. WS 4 Management of problematic weeds
WS 4.1a Management of Orobanche in mustard and solanaceous crops
WS 4.1b Management of Cuscuta
11
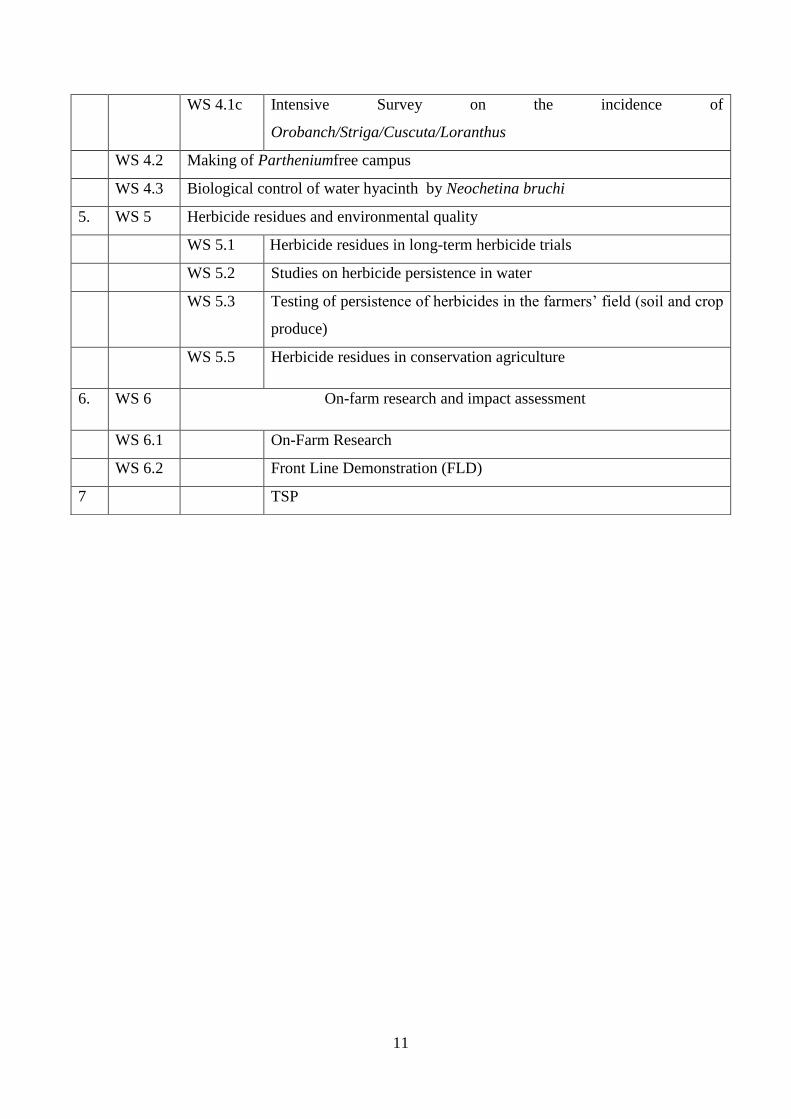
WS 4.1c Intensive Survey on the incidence of
Orobanch/Striga/Cuscuta/Loranthus
WS 4.2 Making of Partheniumfree campus
WS 4.3 Biological control of water hyacinth by Neochetina bruchi
5. WS 5 Herbicide residues and environmental quality
WS 5.1 Herbicide residues in long-term herbicide trials
WS 5.2 Studies on herbicide persistence in water
WS 5.3 Testing of persistence of herbicides in the farmers’ field (soil and crop
produce)
WS 5.5 Herbicide residues in conservation agriculture
6. WS 6 On-farm research and impact assessment
WS 6.1 On-Farm Research
WS 6.2 Front Line Demonstration (FLD)
7 TSP

12
METEOROLOGICAL DATA DURING CROP GROWTH PERIOD
Season: Kharif & Rabi Name of the Zone: North East
Duration: January 2014 to Dec 2014 Name of the Center: Bhubaneswar
Year: 2014
Meteorological Week Temperature
(o
C)
Rain
fall
(mm
) R
ain
y d
ays
(No)
Relative humidity
(%)
Su
nsh
ine
Rec
ord
(hou
rs)
Win
d v
eloci
ty
(Km
/hr)
Pan
Evap
ora
tion
(mm
)
Wee
k
No
Period Max. Min. M AN AV
1 1-7 Jan2014 28.8 15.1 0 0 90 44 67.00 7.8 6.2 6.7
2 8-14 28.7 15.6 0 0 90 45 67.50 7.4 5.9 7.1
3 15-21 29 15.7 0 0 90 49 69.50 8.6 5.5 7.4
4 22-28 29.1 14.7 0 0 94 41 67.50 9.0 7.3 7.4
5 29-03 Jan 2014 29 13.7 0 0 93 35 64.00 9.0 9.6 7.3
6 4-10 34.5 17.3 0 0 92 33 62.50 8.9 8.1 7.8
7 11-17 31.1 18.7 21.8 1 90 53 66.50 8.3 7.2 8.6
8 18-24 30.7 15.9 0 0 91 55 73.00 5.6 6.9 6.7
9 25-03 Feb 2014 32.5 19.4 27.2 2 94 62 78.00 7.5 8.2 6.3
10 4-10 31.2 18.9 26 2 93 66 78.50 7.1 8.7 6.3
11 11-17 35.3 21.2 0 0 89 40 64.50 7.3 5.8 6.4
12 18-24 36.6 23.3 0 0 88 48 69.00 8.3 7.2 8.6
13 25-31 Mar 2014 39.7 23.8 0 0 90 35 62.50 5.6 6.9 6.7
14 2-8 April 2014 38.8 23.9 0 0 91 43 67.00 7.8 6.2 6.7
15 9-15 38.3 23.3 0 0 81 37 59.00 7.4 5.9 7.1
16 16-22 40.1 24.4 9.4 1 90 38 64.00 8.6 5.5 7.4
17 23-29 41.2 26.0 0 0 89 42 65.50 9.0 7.3 7.4
18 30-6 May 2014 40.3 25.1 0 0 83 42 62.50 9.0 9.6 7.3
19 7-13 39.1 25.9 26.2 1 84 50 67.00 8.9 8.1 7.8
20 14-20 42.0 26.7 0 0 87 35 61.00 8.3 7.2 8.6
21 21-27 37.9 25.1 166.6 3 92 55 73.50 5.6 6.9 6.7
22 28-3 June 2014 35.7 25.1 10.9 3 89 64 76.50 7.5 8.2 6.3

13
23 4-10 36.9 26.6 19.1 2 89 62 75.50 7.1 8.7 6.3
24 11-17 39.6 28.0 0 0 82 46 64.00 7.3 5.8 6.4
25 18-24 34.4 26.0 17.3 3 89 67 78.00 2.5 4.4 5.6
26 25-1 July 2014 34.8 24.7 106.1 5 92 72 82.00 2.6 4.2 4.7
27 2-8 31.9 24.4 51.6 4 93 79 86.00 3.5 5.3 3.4
28 9-15 33.7 25.2 100.1 6 92 79 85.50 3.8 4.9 2.8
29 16-22 28.8 24.5 128.0 6 95 90 92.50 0 6.1 2.6
30 23-29 31.8 24.9 12.2 3 91 77 84.00 3.0 6.0 3.2
31 30-5 August
2014 30.8 24.7 151.8 6 95 86
90.50 2.0 6.0 2.2
32 6-12 32.4 24.8 25.7 5 92 77 84.50 4.6 5.1 3.4
33 13-19 33.5 24.4 25.2 4 93 77 85.00 3.9 4.3 3.3
34 20-26 34.8 25.0 61.6 4 94 70 82.00 5.8 4.0 3.3
35 27-2 Sept 2014 31.1 24.4 164.4 7 97 89 93.00 4.5 4.2 2.4
36 3-9 29.2 23.6 115.6 6 96 81 88.50 2.4 5.0 2.3
37 10-16 33.6 24.6 45.2 5 94 79 86.50 5.7 2.6 3.3
38 17-23 30.7 24.4 111.1 7 95 81 88.00 2.9 4.1 2.7
39 24-30 34.1 24.6 0 0 93 60 76.50 6.8 2.1 3.4
40 1-7 Oct 2014 33.8 23.1 26.1 3 93 63 78.00 7.1 2.1 3.3
41 8-14 31.2 23.7 84.4 3 92 74 83.00 5.0 6.2 3.1
42 15-21 32.5 22.2 51.6 3 96 62 79.00 7.3 2.4 3.0
43 22-28 30.6 20.5 1.0 1 94 62 78.00 5.9 2.6 3.4
44 29-4 Nov 2014 30.4 19.4 0 0 90 51 70.50 6.3 2.7 3.5
45 5-11 31.1 20.4 0 0 84 52 68.00 6.2 3.9 3.6
46 12-18 31.8 20.3 0 0 90 47 68.50 6.6 1.7 3.6
47 19-25 30.1 14.9 0 0 90 36 63.00 8.0 1.8 3.6
48 26-2 Dec 2014 30.6 14.7 0 0 95 36 65.50 8.6 1.8 3.5
49 3-9 29.7 14.3 0 0 95 48 71.50 7.5 1.6 3.6
50 10-16 28.2 16.4 0 0 88 49 68.50 3.2 2.1 3.5
51 17-23 26.4 11.9 0 0 87 40 63.50 7.2 3.0 3.6
52 24-31 Dec 2014 25.8 12.9 0 0 79 46 62.50 5.9 3.3 3.7
M- Morning AN – Afternoon AV- Average

14
EXPERIMENTAL RESULTS, 2014
WS 1 Weed surveillance and monitoring
WS 1.1 a Monitoring of appearance of new weed species
The weed survey has been conducted in the rainfed tracts along the state
highway from Khurda to Banki under East and South Eastern Coastal Plain agro-
climatic zone of the state during 2014. The covered locations were Banki, Talabania,
Alsua of cuttack district
Crop rotation for the last three years of the region:
i. Upland rice - pulse (greengram, blackgram, horsegram) in the rainfed areas
ii. Rice - groundnut/vegetables in the irrigated area (25%)
Weed control methods followed in last three years: The weed management
practices followed in the region is mostly manual (70%) in rice and only 30% of the
farmers are using herbicides (butachlor 1.0 kg/ha). Farmers using herbicides are
satisfied with the technologies.
Results
a. Location 1: Banki ( Cuttack district ), 30 km from Khurda town
Situation: Cropped area (Horsegram after rice)
GPS points: 20013’03.46”N to 85
030’19.00”E, altitude: 38m from MSL
Findings: The weed survey conducted in horsegram crop of Banki area revealed that
a new weed i.e Parthenium hysterophorus has been invaded to the crop field
Table 1. New weed flora in horsegram at Banki of cuttack district (Rabi,2014)
Sl.No. Weed species RD(%) RF(%) Rdo(%) IVI
Grasses
1 Cynodon dactylon 10.83 9.09 0.337 20.26
2 Echinochloa colona 10.50 7.75 0.206 18.46
3 Digitaria ciliaris 9.00 5.43 0.151 14.58
4 Eleusine indica 7.50 4.65 0.157 12.31

15
5 Digitaria sanguinalis 2.75 3.10 0.043 5.89
6 Panicum repens 2.50 3.10 0.063 5.66
7 Sporobolus diander 2.25 2.33 0.054 4.63
8 Dactyloctenium aegyptium 2.00 2.33 0.046 4.37
BLW
1 Parthenium hysterophorus 13.00 10.08 0.685 23.76
2 Amaranthus viridis 4.50 6.98 0.117 11.59
3 Spaeranthus indicus 4.00 6.98 0.098 11.07
4 Achyranthus aspera 2.75 4.65 0.145 7.55
5 Celosia argentea 2.50 3.10 0.094 5.69
Situation: Non-cropped area of Banki of cuttack district
GPS points: 20013’15.85”N to 85
029’58.27”E, altitude: 40m from MSL
Findings: The results of weed survey in non-cropped area at Banki revealed the
dominance of broad leaf weeds i.e Achyranthus aspera(49.55).
Table 2. New weed flora in non-cropped area at Banki area of cuttack
district(Rabi, 2014)
Sl.No. Weed species RD(%) RF(%) Rdo(%) IVI
BLW
1 Chromolena odorata 14.50 17.75 0.236 22.49
2 Celosia argentea 4.00 6.98 0.152 11.13
3 Gnaphalium indicum 3.50 4.65 0.081 8.23
4 Euphobia hirta 3.00 4.65 0.094 7.75
5 Portulaca oleracea 2.50 3.88 0.067 6.44
6 Ammania bacifera 2.00 3.10 0.012 5.11
7 Tephrosia purpurea 1.75 3.10 0.068 4.92
8 Sida acuta 1.50 3.10 0.070 4.67
9 Vernonia cinaria 0.90 1.68 0.069 2.65
10 Tridax procumbens 0.90 1.01 0.068 1.97
11 Trianthema portulacastrum 0.45 1.01 0.075 1.53

16
Photograph of weed surveillance
Infestation of Parthenium hysterophorus in horsegram in Banki area of cuttack

17
Road side infested with Chromolena odorata in Banki area of cuttack district

18
W.S. 1.2 Monitoring of weed shift due to weed management practices,changes in
cropping systems and climatic parameters in prevailing ecosystems
Introduction
Weed shift and appearnce of new weeds are being occurred in the long term
experiments conducted in the farm in rice-groundnut cropping system.These shits and
appearnce of new weeds are due to the mangement practices and climatic parameters
prevailing in these areas.
Weed shifts occur when weed management practices do not control an entire weed
community or population. The management practice could be herbicide use or any
other practice such as tillage, manure application, or harvest schedule that brings
about a change in weed species composition.
Results:
Direct seeded rice was heavily infested with grassy weeds like Dactyloctenium
aegyptium.Elusine indica, Leptochloa chinensis,Panicum spp. In the farmers
field.
Celosia argentea is observed to be a severe problem in upland rice and rabi
pulses in the districts of Keonjhar. The weed is invading mostly the upland areas
nearer to the foothills with the soil types belonging to light textured red soils. The
yield loss in rice and pulses due to Celosia was observed to be in the tune of 40%
and 35% , respectively
Echinochloa colona and Digitaria sanguinals are the major grassy weeds
found in kharif ground nut in this zone
Eichhornia crassipes: Earler it was confined to a particular locations like
ponds ,ditches etc. but now it is widely seen in the new area of low land paddy
areas of coastal districts of cuttack,puri,Ganjam,Balasore
Alternanthera philoxerroides: Commonly known as alligator weed, it is observed in
low land paddy areas and low lying swampy areas along the road sides of coastal
districts (Jagatsinghpur ,Kendrapara, Puri , Khurda and Jajpur). A shift from

19
Alternanthera sessilis to Alternanthera philoxerroides was recorded in several low-
lying rice areas in these regions
Orobanche aegyptica: Sporadic incidence of Orobanche was observed in
brinjal and tomato crops under the potential vegetable tracts of Cuttack and
Khurda district along river Mahanadi
Infetstation of cuscuta chinenesis a parasitic weed was observed in niger crop
of semiliguda district.
Heavy infestation of Heliotropium spp. was observed in the green gram and
black gram field of coastal districts of cuutack,Puri,Jagatsingpur.
Heavy infestation of Mikania spp. in banana has been observed in all the
coastal districts.
Photographs of weed surveillance
Mikania infestation in banana in jagatsinghpur district Chromolena infestation in road side of sundargarh district
Lantana infestation near FCI godown of kendrapada district Mimosa infestation in road side of Dhenkanal district

20
WS 1.3 : Monitoring of herbicide resistance / escapes in weeds of the dominant
cropping system (butachlor resistance)
Rice – rice is the important cropping system of Odisha. In coastal belt
Echinochloa crusgalli are dominant grassy weed in rice. Butachlor has been using in
both kharif and rabi paddy by the farmers. Repeated use of same herbicides year after
year in the same area may lead to (i) resistance of certain species to particular
herbicide, (ii) shift in weed flora and (iii) creating environmental problem. In view of
this fact, the present investigation was carried out through pot culture studies in kharif
2014 with an objective to find out butachlor resistance in Echinochloa, if any, due to
repeated use.
Methodology :
Seed collection : Echinochloa crusgalli seeds were collected in previous year (2013)
in different areas of coastal belt of Odisha both from the field where butachlor has
been using at least 5 years and where butachlor never been used. The collected seeds
were dried properly in bright sun light.
Earthen pots (20 x 10 x 10 cm) were filled with garden soil. Recommended
dose of fertilizer (N:P:K – 60:40:40) of kharif rice was applied. Bold seeds (25 Nos.)
of Echinochloa crusgalli collected from the fields where butachlor has been applied
and not-applied, were sown in each tray on 8th
August, 2014, replicated thrice, watered
as and when required. Butachlor @ 0.5, 1.0 and 1.5 kg were applied at 2 DAS (10th
Aug, 2014) water spray was considered as control. Emergence of seedlings was
recorded 20 days after herbicide application (30th
Aug, 2014). Plant height at 20 and
50 DAS and tillers / hill at 50 DAS were also recorded.
Results : No emergence of Echinochloa crusgalli was recorded in recommended dose
of butachlor in the seeds collected from both butachlor treated and non-treated fields
whereas in control and in 0.5 kg dose 30 % and 10% emergence in Echinochloa
crusgalli were observed respectively.

21
Table 11: Growth parameters of Echinochloa crusgalli
Treatments Butachlor treated fields Butachlor – non-treated field
Emergence
(%)
Inhibition
(%)
Plant height
(cm)
Tillers
(No/
hill)
Emergence
(%)
Inhibition
(%)
Plant
height
(cm)
Tillers
(No/ hill)
20
DAS
50
DAS
50
DAS
20
DA
S
50
DAS
50
DAS
T1- Control 30 44.0 5.6 23 3 40 40.0 6 17 2
T2-Buta. 0.5 kg 10 82 6 19 5 8 85
6.
2 20 4
T3-Buta. 1.0 kg 0 0 0 0 0 0 0 0 0 0
T4-Buta 2.0 kg 0 0 0 0 0 0 0 0 0 0
WS 2.1 Study on biology of weeds in cropped and non-cropped area
Echinochloa is a common grassy weed observed in crop fields as well as in
non-cropped areas. Echinochloa colona is a severe problem in rainfed upland crops
causing significant yield loss. Echinochloa crusgalli is one of the major grass
occurring in irrigated tracts particularly in transplanted rice. An attempt has been done
to study the morphological parameters of these weeds in order to develop suitable
management practices. The study has been undertaken in the Kharif season of 2010

22
Table 1. Morphological parameters of cropped weed
Morphological
characters
Echinochloa colona Leptochloa chinensis
Germination (%) 56 78
Total wt
gm(fresh)/plant
2 1.3
Dry weight
(g/plant) 0.18 0.11
Day to flower 33 29
No. of seeds/plant 530 452
1000 seed wt(g) 0.028
0.0014

23
WS 3.1.1: Herbicides combinations for control of complex weed flora in
transplanted rice
Objectives:
To study the bio-efficiency of combination of herbicides against complex
weed flora, and their effect on growth and yield of transplanted rice.
To study the phytotoxic effects on the crop, if any.
(i) Experimental Details:
The experiment was conducted during kharif, 2014 at Central Research
Station, OUAT under East and South Eastern Coastal Plain Zone of the State for the
second consecutive year. The soil of the experimental site was sandy loam with low
in available N (178 kg/ha), medium in P (15.6 kg/ha) and K (175 kg/ha). The
objective of the study was To study the bio-efficiency of combination of herbicides
against complex weed flora, and their effect on growth and yield of transplanted rice
and to study the phytotoxic effects on the crop, if any.
Treatments:
Treatment Dose (g/ha) Time (DAT)
T1 Bispyribac-Na 25 25
T2 Penoxsulam 24% SC 22.5 15
T3 Bispyribac + ethoxysulfuron 25+18.75 25 DAT (3-4 leaf stage)
T4 Bispyribac + almix 20+4 Do
T5 Pretilachlor fb ethoxysulfuron 750/18.75 25 DAT (3-4 leaf stage)
T6 Pretilachlor fb almix 750/4 25 DAT (3-4 leaf stage)
T7 Pyrazosulfuron fb almix 20 0-3fb 25
T8 Penoxsulam+ cyhalofop 6%
OD (RM)
135 15-20
T9 Triafamone+ ethoxysulfuron
30% WG (RM)
60 15
T10 Pendimethalin (38.7% CS)fb
bispyribac-sodium
750/25 0-3 /25
T11 Hand weeding at 25 and 45
DAS
T12 Weedy check

24
Design : RBD
Replication : Three
Plot size : 6 x 4 m2
Variety : Swarna
Date of nursery sowing: 02.07.2014, Date of transplanting: 26.07.2014
Date of Harvesting: 15.11.2014
(ii) Experimental results
a) Major weed flora: The floristic composition of the experimental site was
dominated with grasses like Digitaria ciliaris, Cynodon dactylon, Echinochloa
colona, and broad leaf weeds like Ageratum conyzoides, Cleome viscosa, Ludwigia
parviflora, Physalis minima, Chrozoffera rottleri. The dominant sedges observed was
Cyperus rotundus. Other weeds observed in lower density were Panicum repens,
Sporobolus diander, Alternanthera sessilis, Eclipta alba and Cyperus iria.
(b)Weed Density: The weed density values at 30, 60 DAS and at harvest were
presented in Table 1.
Significant difference in weed densities was observed at 30, 60 DAS and at harvest
due different weed management practices. Weed free treatment recorded significantly
lowest weed density of 2.8 and 2.2 per m2 at 60 DAP and at harvest, respectively.
Among different weed management practices, pre emergence application of
pendimethalin followed by the appliaction of the bispyribac Na recorded significantly
least weed density at all stages of observation followed by application of Triafamone
+ ethoxysulfuron.
(c) Weed biomass:
The weed biomass at different growth stages of rice are presented in Table 1.
There was increasing trend with respect to weed biomass from 30 DAT to harvest
irrespective of treatments. Weed free treatment recorded significantly lowest biomass
of 1.8, 2.1 and 2.3 g/m2 at 30, 60 DAT and at harvest, respectively.At 30 DAT,
application of pendimethalin + bispyribac recorded significantly lower biomass of 1.6
g/m2 which was at par with triafamone + ethoxysulfuron (1.7 g/m
2) at later stages,
also bispyribac + almix treated plots exhibited lower values of biomass. At harvest,
pendimethalin+bispyribac and weed free plots showed at par values of biomass.

25
Weedy check plots recorded significantly lowest biomass at all the stages of
observation.
(d) Yield, yield attributes and weed index:
The value of yield, yield attributes and weed index are presented in Table 1
and 2. Application of pendimethalin+bispyribac recorded significantly higher yield of
4.87 t/ha which was sperior to application of triafamone + ethoxy sulfuron (4.54
t/ha).Weed free plots recorded rice yield of 4.98 t/ha where as weedy treatment
recorded the lowest yield(1.60 t/ha) . The higher yield of different treatments are
supported with higher yield attributes. The value of effective tillers/m2, number of
grains/ panicle and 1000 grain weight are presented in Table 2. These characters were
found to be significant due to different weed control treatments. The plot applied with
pendimethalin+bispyribac recorded significantly significantly highest number of
effective tillers/m2 (440.5) followed by weed free treatment (450.5). Number of
grains/panicle and 1000 grain weight also significantly higher with pendimethalin+
bispyribac and it was at par with weed free treatment with respect to grains/panicle
and followed by triafamone + ethoxysulfuron
Post emergence application of pendimethalin+ bispyribac recorded lowest
weed index 3.25% followed by triafamone+ethoxysulfuron (6.5 %). The highest value
of 59.39 % was obtained from weedy check treatment.
(e) Economics of weed management:
Net returns (Rs./ha) and B:C ratio are presented in Table1. Highest net return
of Rs.21478/ha was obtained from post emergence application of pendimethalin+
bispyribac followed by triafamone+ ethoxysulfuron Rs20713/ha, also the highest B:C
ratio of 2.85 was observed with pendimethalin+ bispyribac treated plots and the nest
best B:C ratio in order was triafamone + ethoxysulfuron (2.79).
Conclusion
Post emergence application of pendimethalin+ bispyribac recorded
significantly higher yield of 4.87 t/ha followed by application of triafamone +
ethoxy sulfuron (4.54 t/ha) where as weedy treatment recorded the lowest
yield (1.6 t/ha) .Weed free plots recorded rice yield of 4.98 t/ha.

26
The plot applied with pendimethalin+ bispyribac recorded significantly
significantly highest number of effective tillers/m2 (440.5) followed by weed
free treatment (450.5).
Highest net return of Rs.21478/ha was obtained from application of
pendimethalin+ bispyribac followed by triafamone + ethoxysulfuron
Rs20713/ha, also the highest B:C ratio of 2.85 was observed with
pendimethalin+ bispyribac treated plots and the nest best B:C ratio in order
was triafamone + ethoxysulfuron (2.79).

27
Table 1. Effect of different herbicides combinations on weed density, weed biomass, yield and economics in transplanted rice (kharif
2014)
Treatment
Weed density (m-2
) Weed biomass (g/m2) Yield (t/ha)
Weed
Index
(%)
Net
Return
(Rs/
ha)
B:C
Ratio 30
DAS
60
DAS
At
harvest
30
DAS
60
DAS
At
harvest Grain Straw
Bispyribac-Na 3.78
(13.8)
5.0
(24.7)
6.1
(36.5)
2.9
(7.7)
4.7
(21.5)
5.5
(30.2) 3.85 6.12 11.01 19413 2.11
Penoxsulam 24%
SC
4.68
(21.5)
5.8
(32.7)
7.7
(58.3)
3.1
(9.5)
4.9
(23.7)
5.9
(34.2) 3.55 5.69 17.69 16454 2.04
Bispyribac +
ethoxysulfuron
4.16
(16.8)
5.4
(28.5)
7.1
(49.5)
3.0
(8.4)
4.9
(23.8)
5.7
(32.6) 3.86 5.98 12.64 18266 2.45
Bispyribac +
almix
4.4
(18.7)
5.3
(27.8)
7.2
(52.0)
3.1
(9.3)
4.9
(23.5)
5.9
(34.3) 3.78 5.71 16.43 16660 2.56
Pretilachlor fb
ethoxysulfuron
2.8
(7.6)
4.0
(15.2)
4.3
(18.5)
1.7
(3.2)
3.3
(10.5)
4.2
(17.0) 3.98 6.61 3.25 20713 2.41
Pretilachlor fb
almix
2.8
(4.8)
2.1
(13.8) 4.3(17.8)
1.6
(2.8)
2.6
(6.3)
3.4
(11.2) 3.02 6.34 21478 2.38
Pyrazosulfuron fb
almix
3.3
(10.5)
4.6
(20.5)
5.0
(24.8)
1.9
(3.2)
3.7
(12.9)
4.7
(21.7) 3.12 5.78 7.58 20054 2.17

28
Penoxsulam+
cyhalofop 6% OD
(RM)
3.0(8.7) 4.2
(17.3)
4.6
(20.5)
2.0
(3.5)
2.9
(7.9)
3.6
(12.8) 3.78 5.86 6.50 19160 2.14
Triafamone+
ethoxysulfuron
30% WG (RM)
3.6
(12.3)
4.9
(23.7) 5.4(28.8) 2.3(5.0) 4.2(17.3) 5.2(26.2) 4.54 7.95 8.66 19960 2.79
Pendimethalin
(38.7% CS)fb
bispyribac-
sodium
3.7
(13.8)
5.0
(24.7) 6.0(35.7) 2.8(7.2) 4.5(19.5) 5.3(27.2) 4.87 7.34 9.93 20507 2.85
Hand weeding at
25 and 45 DAS
2.4
(5.3)
2.0
(3.5) 1.9(3.2) 1.6(2.0) 2.4(5.2) 2.6(6.3) 4.98 8.28 8.12 18790 2.59
Weedy check
8.4
(70.5)
10.0
(100.5) 11.2(124.8) 5.2(26.8) 6.0(35.7) 7.0(48.5) 1.6 3.05 59.39 270 1.91
SE(m)± 0.15 0.15 0.17 0.12 0.10 0.12 0.083 0.110 - - -
C.D (0.05) 0.45 0.45 0.51 0.35 0.31 0.36 0.243 0.310 - - -

29
Table2. Effect of different herbicides combinations on plant height, effective
tillers/m2, number of grains/panicle and 1000 grain weight in
transplanted rice (kharif 2013)
Treatments
Plant
height
(cm)
Effective
tillers/m2
Number of
grains/
panicle
1000 grain
weight (g)
Bispyribac-Na 82.8 392.5 128.5 22.4
Penoxsulam 24% SC 83.0 390.6 123.8 21.6
Bispyribac + ethoxysulfuron 83.8 398.9 126.4 22.2
Bispyribac + almix 83.5 392.7 123.3 21.9
Pretilachlor fb ethoxysulfuron 85.6 396.8 137.2 23.5
Pretilachlor fb almix 86.5 390.5 144.0 24.0
Pyrazosulfuron fb almix 84.5 417.8 133.8 23.1
Penoxsulam+ cyhalofop 6%
OD (RM) 84.7 423.7 136.2 23.3
Triafamone+ ethoxysulfuron
30% WG (RM) 89.0 427.7 133.8 22.7
Pendimethalin (38.7% CS)fb
bispyribac-sodium 95.5 440.5 129.0 22.5
Hand weeding at 25 and 45
DAS 96.5 450.5 141.2 23.7
Weedy check 74.5 200.3 101.8 21.5
SE(m)± 1.18 2.43 1.64 0.37
C.D (0.05) 2.46 7.13 4.81 1.08

30
WS 3.1.2: Herbicides combinations for control of complex weed flora in
direct- seeded rice (dry/wet)
Objectives:
To study the bio-efficiency of combination of herbicides against weed
complex; and their effect on growth and yield of direct-seeded rice
To study the phytotoxic effects on the crop, if any.
(i) Experimental Details:
The experiment was conducted during kharif, 2014 at Central Farm, OUAT
under East and South Eastern Coastal Plain Zone of the State for the third consecutive
year. The soil of the experimental site was sandy loam with low in available N (172
kg/ha), medium in P (19 kg/ha) and K (185 kg/ha). The objective of the study was to
study the bio-efficiency of combination of herbicides against weed complex; and their
effect on growth and yield of direct-seeded rice and to study the phytotoxic effects on
the crop, if any.The treatments were as follows:
Treatments:
Treatment Dose
(g/ha)
Time of application
(DAS)
T1 Bispyribac-Na 25 20DAS(3-
4leafstage)
T2 Pendimethalin* fb bispyribac 1000 fb
25
0-2 fb 25
T3 Oxadiargyl fb bispyribac 100 /25 0-2 fb. 25
T4 Pyrazosulfuron fb bispyribac 20/25 0-3 fb. 25
T5 Pendimethalin* fb bispyribac fb manual
weeding
1000 fb
25
0-2 fb. 20DAS (3-
4 leaf stage) fb
45d
T6 Pendimethalin* fb manual weeding 1000 0-2 fb. 25-30d
T7 Bispyribac + (chlorimuron + metsulfuron) 20+4 20 DAS
T8 Three mechanical weedings (cono / rotary
weeder)
- 20,40,60 DAS
T9 Weed free (HW at 20, 40 and 60 DAS) - -
T10 Weedy check - -
31
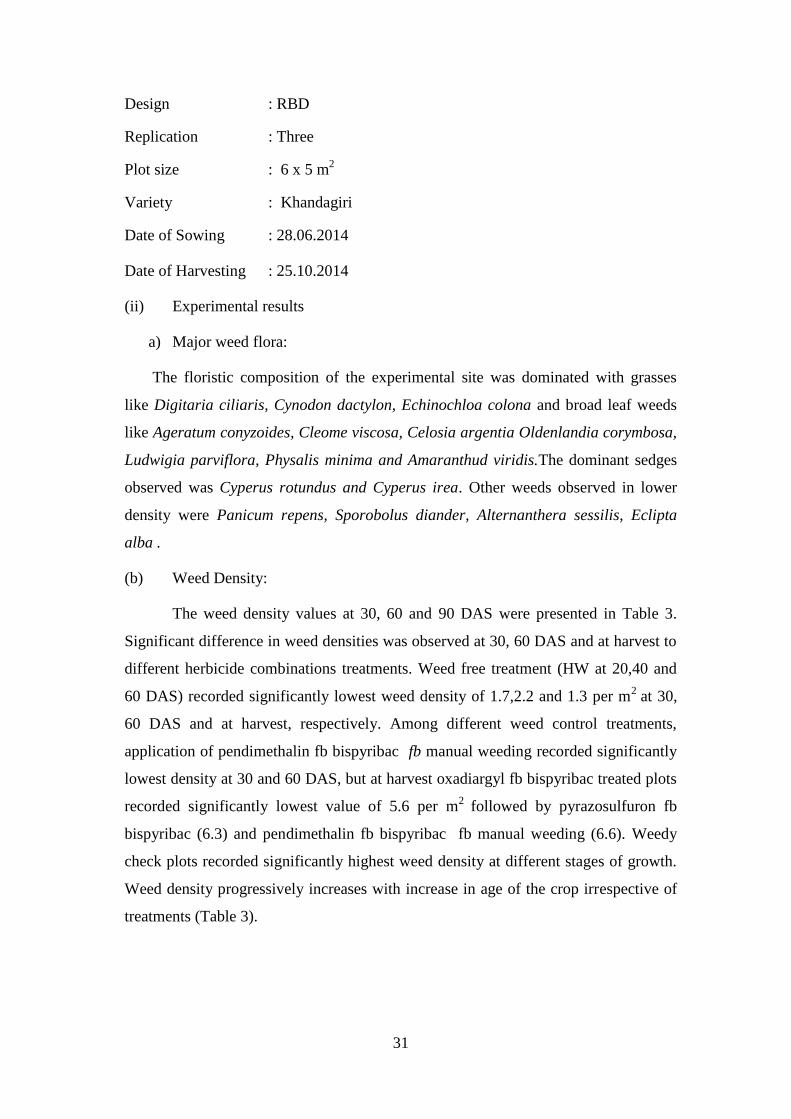
Design : RBD
Replication : Three
Plot size : 6 x 5 m2
Variety : Khandagiri
Date of Sowing : 28.06.2014
Date of Harvesting : 25.10.2014
(ii) Experimental results
a) Major weed flora:
The floristic composition of the experimental site was dominated with grasses
like Digitaria ciliaris, Cynodon dactylon, Echinochloa colona and broad leaf weeds
like Ageratum conyzoides, Cleome viscosa, Celosia argentia Oldenlandia corymbosa,
Ludwigia parviflora, Physalis minima and Amaranthud viridis.The dominant sedges
observed was Cyperus rotundus and Cyperus irea. Other weeds observed in lower
density were Panicum repens, Sporobolus diander, Alternanthera sessilis, Eclipta
alba .
(b) Weed Density:
The weed density values at 30, 60 and 90 DAS were presented in Table 3.
Significant difference in weed densities was observed at 30, 60 DAS and at harvest to
different herbicide combinations treatments. Weed free treatment (HW at 20,40 and
60 DAS) recorded significantly lowest weed density of 1.7,2.2 and 1.3 per m2
at 30,
60 DAS and at harvest, respectively. Among different weed control treatments,
application of pendimethalin fb bispyribac fb manual weeding recorded significantly
lowest density at 30 and 60 DAS, but at harvest oxadiargyl fb bispyribac treated plots
recorded significantly lowest value of 5.6 per m2
followed by pyrazosulfuron fb
bispyribac (6.3) and pendimethalin fb bispyribac fb manual weeding (6.6). Weedy
check plots recorded significantly highest weed density at different stages of growth.
Weed density progressively increases with increase in age of the crop irrespective of
treatments (Table 3).

32
(c) Weed biomass:
The weed biomass at different growth stages of rice are presented in Table 3.
Different weed control methods exhibited significant effect at different growth stages
in weed biomass. Weed free treatment recorded significantly lowest weed biomass of
1.7, 1.6 and 1.7 g/m2
at 30, 60 DAS and at harvest, respectively. Among different
herbicide combinations, application of pendimethalin fb bispyribac fb manual
weeding exhibited significantly lowest weed biomass of 1.9, 2.2 and 4.6 g/m2 30,60
DAS and at harvest, respectively followed by oxadiargyl fb bispyribac treatment. The
weedy check plots showed highest weed biomass at all the stages of crop growth
(d) Yield, yield attributes and weed index:
The value of yield, yield attributes and weed index are presented in Table 3
and 4. Weed free treatment (HW at 20, 40 and 60 DAS) recorded significantly highest
yield of 4.47 t/ha where as weedy check treatment recorded the lowest yield (1.84
t/ha). Among different herbicide combinations, significantly higher grain yield of 4.40
t/ha was obtained with application of pendimethalin fb bispyribac fb manual weeding
which was at par with oxadiargyl fb bispyribac (4.32 t), pyrazosulfuron fb bispyribac
(4.27 t), pendimethalin fb bispyribac (4.10 t) and pendimethalin* fb manual weeding
(4.0 t/ha).The higher yield of different treatments are supported with higher yield
attributes . The value of effective tillers/m2, number of grains/ panicle and 1000 grain
weight are presented in Table 2. These characters were found to be significant due to
different weed control treatments. The Weed free (HW at 20, 40 and 60 DAS)
recorded significantly higher effective tillers/m2 (350.8) which was at par with
pendimethalin fb bispyribac fb manual weeding (345.7 per m2). Number of
grains/panicle was significantly higher with weed free treatment (117.8) and it was at
par with pendimethalin fb bispyribac fb manual weeding (115.5). Higher 1000 grain
weight was observed with weed free plots (24.5 g). The treatment with
pendimethalin fb bispyribac fb manual weeding received the second rank with respect
to 1000 grain weight (24.3 g). Weedy check treated plot recorded the significantly
lowest 1000 grain weight.
Application of pendimethalin fb bispyribac fb manual weeding recorded
lowest weed index of 1.56 % followed by oxadiargyl fb bispyribac (3.35 %). The
highest value of 58.71 % was obtained from weedy check treatment.

33
(e) Economics of weed management:
Net returns (Rs./ha) and B:C ratio are presented in Table1. Highest net return
and B:C ratio of Rs.18900/ha and 2.78 were obtained respectively from application of
pendimethalin fb bispyribac fb manual weeding followed by oxadiargyl fb bispyribac
(Rs17600/ha and 2.72 ).Weedy check recorded the (-ve) value of Rs 1300 with
respect to net reyurn/ha with B:C ratio of 1.94.
Conclusion
Weed free treatment (HW at 20, 40 and 60 DAS) recorded significantly
highest yield of 4.47 t/ha where as weedy check treatment recorded the lowest
yield(1.84 t/ha). Among different herbicide combinations, significantly higher
grain yield of 4.40 t/ha was obtained with application of pendimethalin fb
bispyribac fb manual weeding which was at par with oxadiargyl fb bispyribac
(4.32 t), pyrazosulfuron fb bispyribac (4.27 t), pendimethalin fb bispyribac
(4.10 t) and pendimethalin* fb manual weeding (4. t/ha).
Application of pendimethalin fb bispyribac fb manual weeding recorded
lowest weed index of 1.56 % followed by oxadiargyl fb bispyribac (3.35 %).
The highest value of 58.71 % was obtained from weedy check treatment
Highest net return and B:C ratio of Rs.18900/ha and 2.78 were obtained
respectively from application of pendimethalin fb bispyribac fb manual
weeding followed by oxadiargyl fb bispyribac (Rs17600/ha and 2.72 ).

34
Table3. Effect of different herbicides combinations on weed density, weed biomass, yield and economics in direct seeded rice (kharif 2014)
Treatment
Weed density (m-2
) Weed biomass (g/m2) Yield (t/ha) Weed
Index
(%)
Net Return
(Rs/ha)
B:C
ratio 30
DAS
60
DAS At harvest
30
DAS
60
DAS
At
harvest Grain Straw
T1 Bispyribac-Na 4.5(19.9) 5.2(26.5) 6.7(44.5) 3.1(9.3) 3.6(12.5) 5.7(31.5) 3.66 4.64 18.08 11500 2.39
T2 Pendimethalin* fb
bispyribac 4.3(17.7) 4.8(22.7) 6.4(40.3) 2.9(7.8) 3.0(8.6) 5.3(27.5) 4.10 5.45 8.26 14900 2.50
T3 Oxadiargyl fb bispyribac 3.3(10.7) 3.9(14.7) 5.5(29.7) 2.1(2.9) 2.5(5.8) 5.1(25.7) 4.32 5.74 3.35 17600 2.61
T4 Pyrazosulfuron fb
bispyribac 3.8(14.3) 5.1(25.3) 6.1(36.7) 2.7(6.7) 2.8(7.2) 5.2(26.8) 4.27 5.35 4.46 17100 2.59
T5
Pendimethalin* fb
bispyribac fb manual
weeding
2.4(5.3) 3.3(10.3) 6.2(38.3) 1.8(3.9) 2.1(3.8) 4.5(19.9) 4.40 5.82 1.56 18900 2.67
T6 Pendimethalin* fb
manual weeding 4.3(18.2) 4.9(23.8) 6.5(42.3) 2.9(7.7) 3.1(9.5) 5.3(27.5) 4.00 5.22 10.27 12500 2.39
T7 Bispyribac +
(chlorimuron + 4.3(18.2) 4.0(25.0) 6.6(42.5) 3.0(8.5) 3.2(9.8) 5.3(28.0) 3.84 5.00 14.06 13300 2.46

35
metsulfuron)
T8
Three mechanical
weedings (cono / rotary
weeder)
4.5(19.5) 5.1(25.5) 6.6(43.8) 3.0(8.7) 3.3(10.5) 5.5(29.8) 3.79 4.81 15.18 11300 2.35
T9 Weed free (HW at 20,
40 and 60 DAS) 1.7(2.7) 2.0(3.7) 1.4(1.9) 1.5(2.0) 1.4(1.9) 1.5(2.2) 4.47 5.29 - 12100 2.32
T10 Weedy check 8.1(65.7) 10.0(98.7) 10.8(116.7) 4.4(19.3) 4.6(20.8) 5.1(25.6) 1.84 2.25 58.71 -1300 2.04
SE(m)± 0.11 0.19 0.11 0.08 0.11 0.08 0.150 0.189 - - -
C.D (0.05) 0.34 0.55 0.33 0.24 0.31 0.24 0.443 0.561 - - -

36
Table 4. Effect of different herbicides combinations on plant height, effective
tillers/m2, number of grains/panicle and 1000 grain weight in direct seeded
rice (kharif 2014)
Treatments
Plant
height
(cm)
Effective
tillers/m2
Number of
grains/
panicle
1000 grain
weight (g)
T1 Bispyribac-Na 83.0 320.7 103.5 22.3
T2 Pendimethalin* fb
bispyribac 85.5 332.8 110.8 23.4
T3 Oxadiargyl fb bispyribac 86.5 340.5 115.0 23.8
T4 Pyrazosulfuron fb bispyribac 86.7 335.8 112.5 23.3
T5 Pendimethalin* fb
bispyribac fb manual
weeding
87.5 345.7 115.5 24.3
T6 Pendimethalin* fb manual
weeding 85.0 327.5 107.5 23.0
T7 Bispyribac + (chlorimuron +
metsulfuron) 84.3 324.9 106.7 22.8
T8 Three mechanical weedings
(cono / rotary weeder) 83.5 323.5 105.5 22.6
T9 Weed free (HW at 20, 40
and 60 DAS) 88.0 350.8 117.8 24.5
T10 Weedy check 75.5 230.5 90.5 20.5
SE(m)± 1.37 1.94 1.55 0.40
C.D (0.05) 4.08 5.77 4.60 1.80

37
3.3.3: Integrated weed management in ginger
Objectives:
To study the effect of integrated weed control measures against weeds and on
growth and yield of ginger
To study the phytotoxic effects on the crop, if any
Treatments:
Herbicides Dose Application time
T1 Pendimethalin
1.5 kg/ha After planting but
before mulching
T2 Oxyfluorfen 0.20 kg/ha After planting but
before mulching
T3 Pendimethalin fb hand
weeding
1.5 kg/ha After planting but
before mulching fb 30-
35 DAP
T4 Oxyfluorfen fb hand weeding 0.20 kg/ha After planting but
before mulching fb 30-
35 DAP
T5 Glyphosate
0.80 kg/ha Just before emergence
of sprouts of ginger
T6 Glyphosate+ pendimethalin 0.80 +1.5 kg/ha Just before emergence
of sprouts of ginger
T7 Glyphosate + oxyfluorfen 0.80 + 0.2 kg/ha Just before emergence
of sprouts of ginger
T8 Hand weeding (2)
- 30 and 60 DAP
T9 Un-weeded control
-
Design : RBD
Replication : Three
Plot size : 5 x 1 m2
Variety : Suruchi
Date of Sowing : 08.07.2014
Observations:
Still in field , data are to be analysed.

38
3.4.1: Studies on time of application of imazethapyr and its ready mix
combination with imazamox (Odyssey) against weeds in blackgram
Objectives:
To study the bio-efficacy of different herbicides against weeds and their effect
on growth and yield of blackgram.
To study the phytotoxic effects on the urd bean, if any.
To study the residual effect of herbicides applied in urd bean on succeeding
Treatments:
Herbicides Dose (g/ha) Time of application
T1 Imazethapyr 70 PRE
T2 Imazethapyr 80 PRE
T3 Imazethapyr 70 3-4 leaf stage
T4 Imazethapyr 80 3-4 leaf stage
T5 Imazethapyr + imazamox (RM) 70 PRE
T6 Imazethapyr + imazamox (RM) 80 PRE
T7 Imazethapyr + imazamox (RM) 70 3-4 leaf stage
T8 Imazethapyr + imazamox (RM) 80 3-4 leaf stage
T9 Pendimethalin 1000 PE
T10 Imazethapyr + pendimethalin (RM) 1000 PE
T11 Hoeing (2) - 20 & 40 DAS
T12 Weedy check -
Design : RBD
Replication : Three
Plot size : 7 x 4 m2
Variety : Prasad(BG-33-8)
Date of Sowing : 08.11.2014
Observations:
Yet to be harvested and data to be analysed

39
WS 3.6 Weed management in conservation agriculture systems(Rice-maize-
cowpea )
i) Experimental details
The long term experiment on weed management in conservation agriculture
system was initiated in kharif season, 2013 at Central Research Station, OUAT,
Bhubaneswar to monitor the weed dynamics, crop productivity, herbicide residues,
changes in physico-chemical and biological properties of soil health . The soil is
sandy clay loam, acidic, low in available N, P and medium in available K.
Treatment details:
Tillage (main plot) 1st crop (rice) 2
nd crop (rice) 3
rd crop
T1 – CT(Transplanted) CT -
T2 – CT (Transplanted) ZT ZT
T3 – CT (Direct-seeded) CT ZT
T4 – ZT (Direct-seeded) ZT ZT
T5 – ZT (Direct-seeded)+R ZT+R ZT
Weed control (subplot) H1 – Recommended herbicide
H2 – IWM(herbicide+manual weeding)
H3 – Unweeded control
Design : Strip plot,
Replication : Two
Plot size : 10×5 m2
Fertilizer dose :80:40:40 kg/ha in kharif 2014
Variety : Pratikhya
DON : 02/07/2014
DOT : 25/07/2014
DOS(DSR) : 23/06/2014

40
A) KHARIF RICE 2014
i) Results
a) Weed flora :
The floristic composition in Kharif season was dominated mostly by weeds
like .repens,E.crusgalli,E.colona,P.scorbiculatum,C.dactylon,M.quadrifolia,A.sessilis
L.parviflora among broadleaved weed, C. difformis,C.iria,C.rotundus and F.miliacea
among sedges.The floristic composition in both the system has been described in
b) Weed density & Weed dry weight
Kharif rice (Table 3)
The CT method of tillage recorded significantly the lowest weed density at 60
DAP over CT(Direct seeded) methods. The average weed dry weight (44.4 g/ m 2)
was found to be 35 % more than the weed dry weight (33 g/ m 2
) found in the CT
(Direct seeded plots)
The recommended practice (butachlor 1.5 kg ha-1
) significantly lowered the
weed densities (40.8 m-2
) over the unweedy check (113.4 m-2
) at 60 DAP and the
decrease was in the tune of 57 %. Imposition of mechanical weeding with
herbicide(butachlor 1.5 kg ha-1
) reduced the weed population significantly (64%) over
control which was at par with recommended herbicides(Table-6)
d) Grain yield and Economics (Table 7)
There was no significant difference was recorded in grain yield,gross & net
return among different tillage system at the first season. However practice of CT
(Direct seeded) system resulted the grain yield of (3.02 t/ ha) which was at par with
the CT (Transplanted) method. However the highest B: C ratio (1.72) was obtained in
the CT (direct seeded) method in comparison with CT(transplanted) method. Among
the weed management practices, the highest grain yield (3.43 t/ha) was recorded in
IWM which was at par with the application of recommended herbicides(3.32 t/ha) and
proved better (49%) than unweeded control. Among weed management practices, the
highest B:C ratio (1.94) was obtained with recommended herbicides and lowest B:C
ratio was with control(1.01)

41
g) Conclusions
Practice of CT(Transplanted) tillage methods reduced the weed densities over
ZT(Direct seeded) in the Kharif rice.
During the initial stages (60 DAP), application butachlor (1.5 kg ha-1
) reduced
the weed density by 57% over control and 64% in case of IWM over unweedy
check.
The yield reduction in ZT(Direct seeded) method was not significant
compared to CT method
Integration of ZT method and use of butachlor 1.5 kg ha-1
obtained the
maximum B: C ratio of in the kharif rice
o The composition weed seed bank in ZT was dominated with grasses (63%)
followed by broad leaf weeds (24%) and sedges (13%) and the corresponding
values in CT were 66%, 22% and 12%.
42
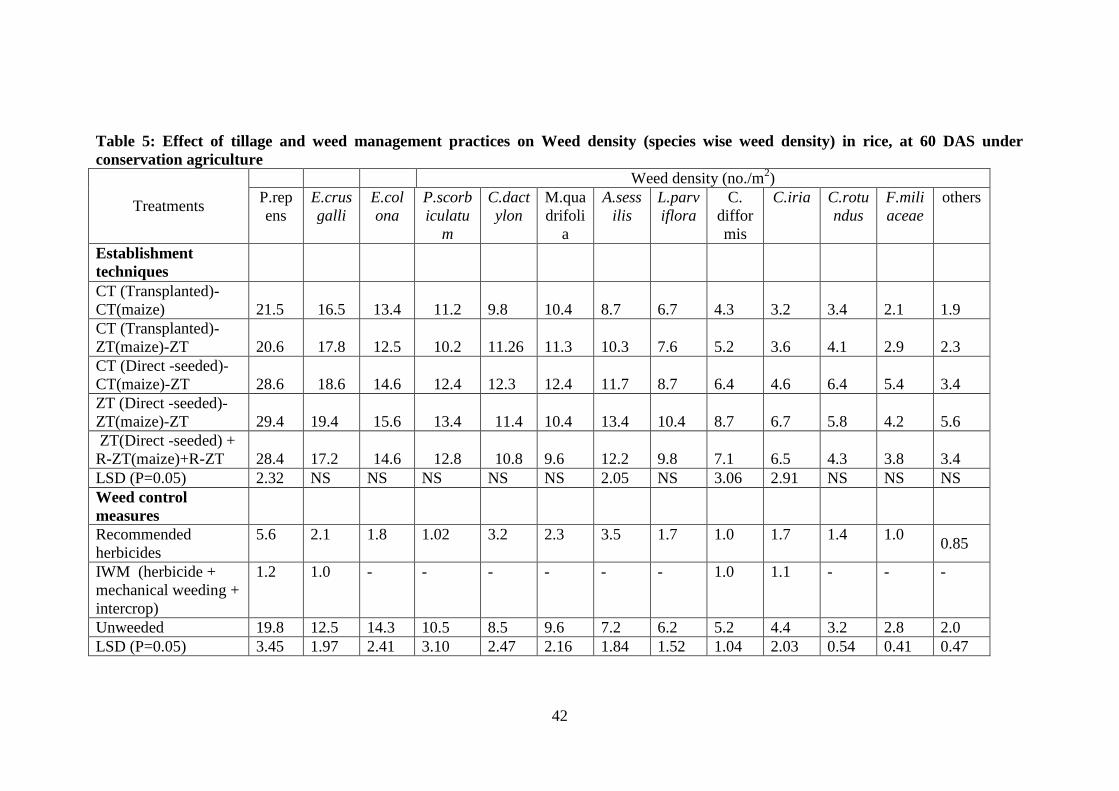
Table 5: Effect of tillage and weed management practices on Weed density (species wise weed density) in rice, at 60 DAS under
conservation agriculture
Treatments
Weed density (no./m2)
P.rep
ens
E.crus
galli
E.col
ona
P.scorb
iculatu
m
C.dact
ylon
M.qua
drifoli
a
A.sess
ilis
L.parv
iflora
C.
diffor
mis
C.iria C.rotu
ndus
F.mili
aceae
others
Establishment
techniques
CT (Transplanted)-
CT(maize) 21.5 16.5 13.4 11.2
9.8
10.4
8.7
6.7
4.3
3.2
3.4
2.1
1.9
CT (Transplanted)-
ZT(maize)-ZT 20.6 17.8 12.5 10.2
11.26
11.3
10.3
7.6
5.2
3.6
4.1
2.9
2.3
CT (Direct -seeded)-
CT(maize)-ZT 28.6 18.6 14.6 12.4
12.3
12.4
11.7
8.7
6.4
4.6
6.4
5.4
3.4
ZT (Direct -seeded)-
ZT(maize)-ZT 29.4 19.4 15.6 13.4 11.4
10.4
13.4
10.4
8.7
6.7
5.8
4.2
5.6
ZT(Direct -seeded) +
R-ZT(maize)+R-ZT 28.4 17.2 14.6 12.8 10.8
9.6
12.2
9.8
7.1
6.5
4.3
3.8
3.4
LSD (P=0.05) 2.32 NS NS NS NS NS 2.05 NS 3.06 2.91 NS NS NS
Weed control
measures
Recommended
herbicides
5.6 2.1 1.8 1.02 3.2 2.3 3.5 1.7 1.0 1.7 1.4 1.0 0.85
IWM (herbicide +
mechanical weeding +
intercrop)
1.2 1.0 - - - - - - 1.0 1.1 - - -
Unweeded 19.8 12.5 14.3 10.5 8.5 9.6 7.2 6.2 5.2 4.4 3.2 2.8 2.0
LSD (P=0.05) 3.45 1.97 2.41 3.10 2.47 2.16 1.84 1.52 1.04 2.03 0.54 0.41 0.47

43
Table 6: Effect of tillage and weed management practices on Weed growth in
rice at 60 DAS under conservation agriculture
Treatments Total Weed density
(no./m2)
Total Weed dry weight
(g/m2)
Establishment techniques
CT (Transplanted)-CT 79.4 32.45
CT (Transplanted)-ZT-ZT 81.3 33.64
CT (Direct -seeded)-CT-ZT 98.7 41.42
ZT (Direct -seeded)-ZT-ZT 108.4 47.32
ZT(Direct –seeded) + R-
ZT+R-ZT
102..6 44.6
LSD (P=0.05) 8.4 6.89
Weed control measures
Recommended herbicides 48.4 25.8
IWM (herbicide +
mechanical weeding +
intercrop)
40.8 27.1
Unweeded 113.4 38.5
LSD (P=0.05) 21.07 9.45
Table 7 : Effect of tillage and weed control methods on grain yield and economics
in rice
Treatments Yield
(t/ha)
Gross return Net return
Establishment
techniques
CT (Transplanted)-CT 3.15 44520 9520
CT (Transplanted)-ZT-ZT 3.23 48213 10231
CT (Direct -seeded)-CT-
ZT 3.05
42152 11245
ZT (Direct -seeded)-ZT-
ZT 2.99
41213 10895
ZT(Direct -seeded) + R-
ZT+R-ZT 3.02
42411 11895
LSD (P=0.05) NS NS
Weed control measures
Recommended herbicides 3.32 51621 12354
IWM (herbicide +
mechanical weeding) 3.43
53412 11987
Unweeded 2.30 34213 7542
LSD (P=0.05) 0.13

44
B) RABI MAIZE (2013-2014)
Variety : Nilesh hybrid
DOS (ZT): 07/12/2013
DOS (CT): 13/12/2013
DOH : 18/03/2014
Fertiliser: 100:50:50 kg/ha
ii) Results
a) Weed flora : The floristic composition of the experimental site during Rabi
(2013-14) season (Fig.1) was dominated with grasses (60.5%) followed by broad leaf
weeds (26.0%) and sedges (13.5%). There was a decreasing trend observed in
different categories of weeds from the year of initiation of the experiment. Panicum
repens (23.0 %), Echinochloa crusgalli (20.0 %) and Echinochloa colona (10.4 %)
were observed to be the dominant grasses. Marselia quadrifolia (6.0 %) and
Alternanthera sessilis (3.0 %) were the major broad leaf weeds. Cyperus difformis
Harvesting of rice in mini combine harvestor
conservation agriculture trial

45
0
10
20
30
40
50
60
70
Re
lati
ve
de
ns
ity
(%
)
Grasses B.leaf Sedges
Fig.1. Effect of tillage methods and weed control
practices on weed flora
Rabi Kharif
(6.9 %) and Cyperus iria (5.0 %) were the important sedges observed in the
experimental site. Other major weeds observed were Ludwigia parviflora, Leptochloa
chinensis, Sphenochloa zeylanica, Cyperus rotundus, Paspalum scrobiculatum and
Dactyloctenium aegyptium.
The composition weed flora in Kharif 2013 season was dominated mostly by
monocot weeds (Fig.1). However, an increase in densities of grasses (65.5%) and
decrease in densities of broadleaf weeds (22.5%) and sedges (12.0%) was observed
over Rabi season. Panicum repens (31.0 %), Echinochloa crusgalli (15.4 %) and
Echinochloa colona (10.3 %) were the dominant grasses. The major broad leaf weeds
were Marselia quadrifolia (10.8%), Alternanthera sessilis (3.5 %) and Cyperus
difformis (4.9 %) was the dominant sedges observed.
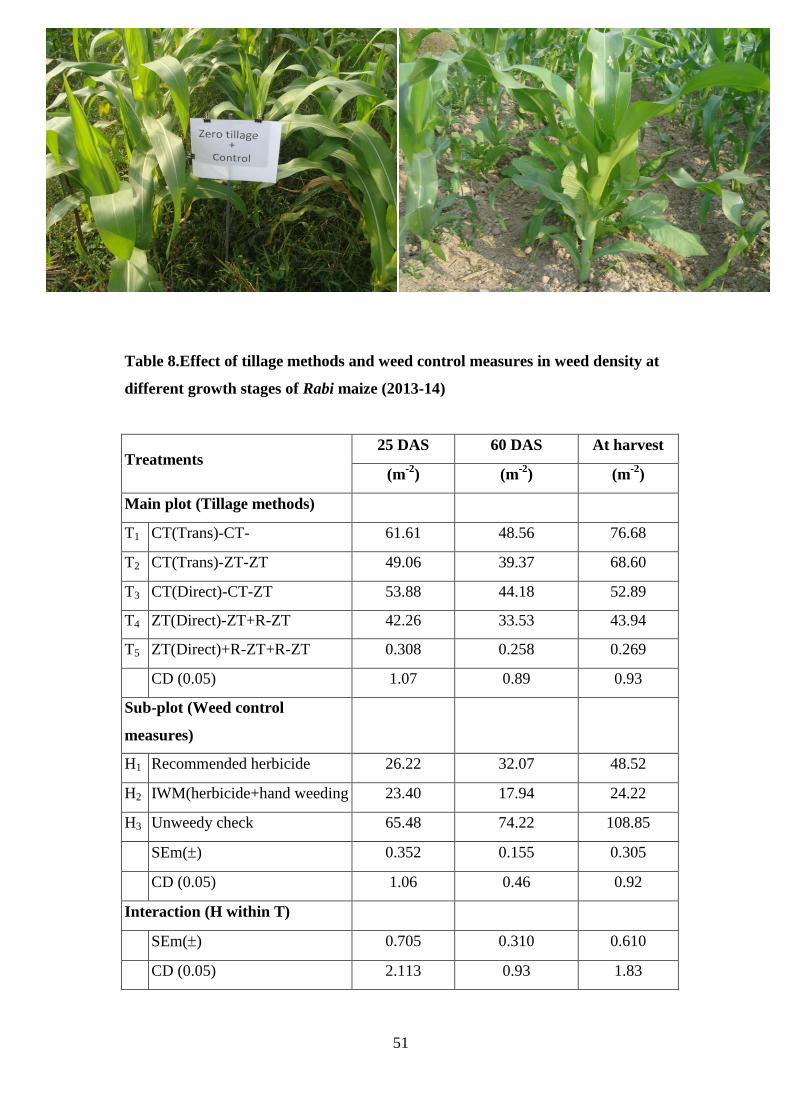
b) Weed density
Rabi maize
During the initial stages of crop growth (25 DAP), ZT(DSR)-ZT+R-ZT
recorded significantly the higher weed density (61.6 m-2
) followed by ZT(DSR)+R-
ZT+R-ZT method (53.9 m-2
) and CT(DSR)-CT-ZT(49.4 m-2
)and the density was
lowest CT(trans)-ZT-ZT method (42.3 m-2
). The weed densities at 60 DAP and at
harvest followed the similar trend with the lowest values of 33.5 m-2
and 43.9 m-2
,
respectively, in CT(trans)-ZT-ZT method and ZT(DSR)-ZT+R-ZT . Inclusion of CT
in the tillage methods reduced the weed densities in the tune of 21.1%, 19.6% and
28.1% respectively, during different growth stages over ZT-ZT method.
Among the various weed management practices, the IWM practice i.e
application of Pendimethalin 1.0 lit ha-1
with one manual weeding recorded
significantly the lowest weed density (23.4 m-2
) at 25 DAP as compared to sole

46
recommended herbicide appliaction i.e pendimethal;in 1.0 lit ha-1
(66.2 m-2
) and
unweedy check (65.5 m-2
). The practice of IWM however reduced the weed density
by 44.1% and 50.1% at later stages of crop growth (60 DAP and at harvest).
c) Weed biomass
Inclusion of CT in the tillage system reduced the weed biomass over zero
tillage in the tune of 22.0%, 19.8% and 25.5% at 25 DAP, 60 DAP and at harvest,
respectively, during rabi 2013-14 season. The corresponding decrease in kharif
season was in the tune of 16.2%, 17.5% and 21.2%.
The practice of IWM significantly reduced the weed biomass over
recommended herbicide in both rabi (60.9%) and kharif (57.7%) season during initial
stages of crop growth (25 DAP). However,herbicide with hand weeding reduced the
weed biomass by 33.7% over recommended practice in both the seasons at harvest.
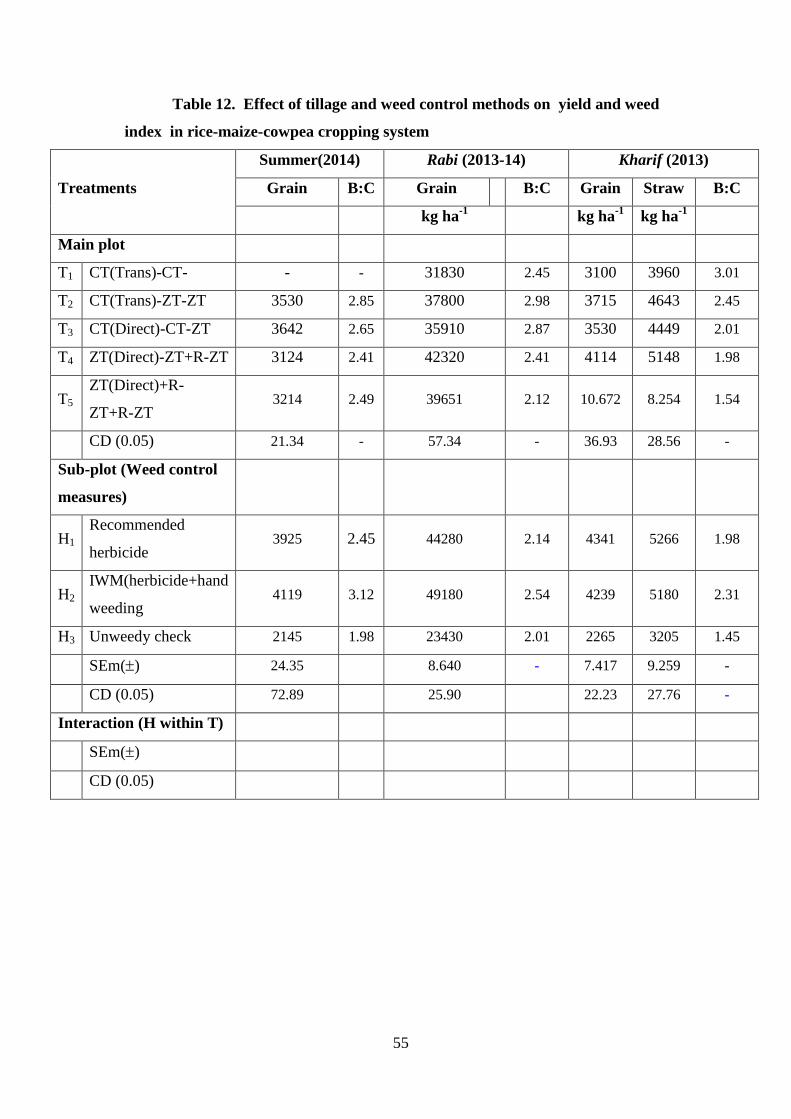
d) Grain yield and weed index
The practice of CT(trans)-ZT-ZT system of tillage recorded significantly
higher grain yield in both rabi (4232 kg/ha) kharif season (4114 kg/ha). Practice of
ZT(DSR)-ZT+R-ZT system resulted the lowest grain yield and the yield reduction
was in the tune of 24.7% as compared to CT-CT method in both the seasons. Among
the weed management practices, IWM(herbicide+manual weeding) proved better than
sole herbicide with yields of 4428 kg ha-1
in rabi and 4341 kg ha-1
in kharif season,
respectively. Weed index values were observed to be maximum in ZT-ZT-ZT system
(24.7%) and yield losses due to weeds were 47.5% in both the seasons.
e) Economics of weeding (Table 6, Fig 2)
Among various tillage systems, CT(trans)-ZT-ZT method recorded the highest
B:C ratio of 3.49 in the entire rice-maize-cowpea system followed by CT(DSR)-CT-
ZT method (2.48). The lowest value however was observed in ZT(DSR)-ZT+R-ZT
method (1.83). Use of pendimethalin 1 lit ha-1
with manual weeding produced better
B:C ratio (2.78) as compared to sole herbicide appliaction (2.57). The ZT-ZT-ZT
system along with use of herbicide obtained the maximum B:C ratio of 2.87 in rabi
maize and 2.82 in kharif rice as compared to other combinations of tillage and weed
management practices.

47
C)SUMMER COWPEA (2014)
Variety : Sylvania
DOS (ZT): 26/03/2014
Date of harvest: 15/05/2014
Fertiliser : 30/30/30
Grain yield and weed index
The practice of CT(trans)-ZT-ZT system of tillage recorded significantly
higher grain yield in both rabi (4232 kg/ha) kharif season (4114 kg/ha). Practice of
ZT(DSR)-ZT+R-ZT system resulted the lowest grain yield and the yield reduction
was in the tune of 24.7% as compared to CT-CT method in both the seasons. Among
the weed management practices, IWM(herbicide+manual weeding) proved better than
sole herbicide with yields of 4428 kg ha-1
in rabi and 4341 kg ha-1
in kharif season,
respectively. Weed index values were observed to be maximum in ZT-ZT-ZT system
(24.7%) and yield losses due to weeds were 47.5% in both the seasons.
f) Weed seed bank studies (Table 7, Fig.3 & 4)
The weed seed bank studies were conducted at the end of kharif rice as per the
given procedure. The weed composition in ZT was dominated with grasses (63%)
followed by broad leaf weeds (24%) and sedges (13%) and the corresponding values
in CT were 65%, 23% and 12%. Weed emergence was significantly lower in
butachlor treated plots under both ZT and CT methods and the decrease was in the
tune of 41.8% and 45.0%, respectively.
0
0.5
1
1.5
2
B:C ratio
T1 T2 T3 T4 T5 H1 H2 H3
Fig 2. Effect of tillage methods and weed
control practices on B:C ratio of the system

48
f) Weed seed bank studies (Table 9):
Category wise and species wise weed emergence from soil samples before
sowing of kharif rice was studied. The floristic composition of weed seed bank was
dominated with grasses (55.9 %) followed by broad leaf (30.8 %) and sedges (13.3%).
The dominant grasses observed are Echinochloa colona, Dactyloctenium aegyptium,
Digitaria ciliaris, Eleusine indica and Sporobolus diander. The major broadleaf
weeds are Ludwigia parviflora, Alternanthera sessilis and Cleome viscosa. Among
sedges, Cyperus rotundus, Cyperus iria and Fimbristylis miliaceae dominate the weed
seed bank. The weed densities were conspicuously higher in hand weeding plots (217
and 245 / m2). Application of herbicides with manual weeding reduced the weed
densities by 42.5% over sole herbiicde application.
Fig 3. Composition of weed seed bank in ZT, 2014
Grass 63%
BLW 24%
Sedges 13%
Fig 4. Composition of weed seed bank in CT, 2014
Grass 65%
BLW 23%
Sedges 12%

49
g) REY and economics of the rice – maize-cowpea system (Fig 6)
The establishment method CT to rice and ZT+R in maize and ZT in cowpea
produced the highest REY of 11.35 t/ha. But application of pretilachlor + hand
weeding(IWM) to rice and pendimethalin to maize of ZT+R with one hand weeding
and ZT with cowpea recorded the highest B:C ratio of 3.85.
f) Conclusion
At the initial stages of crop growth (25 DAS), use of herbicides with
recommended herbicide(H2) reduced the weed density by 70 % over
recommended herbicide i.e the treatment of pendimethalin 1.0 lit/ha recorded the
lowest weed density of 43.0 m-2
Fig 5. Effect of weed management on grain yield and WI in rice in kharif 2013
3603
3735
3478
3580
3423
3543
3200
3300
3400
3500
3600
3700
3800
T1 T2 T3 T4 T5
Grain yield kg ha
-1 )
0
1
2
3
4
5
6
7
8
9
Weed Index (%)
Grain yield WI
Fig 6. Effect of weed management on REY & B:C ratio
in rice – maize-cowpea system
1.54 1.6
1.85 1.75 1.79
1.69 1.66 1.76 1.75
9500
9700
9900
10100
10300
10500
10700
10900
11100
11300
11500
T1 T2 T3 T4 T5 H1 H2 H3
-1 )
0
0.2
0.4
0.6
0.8
1
1.2
1.4
1.6
1.8
2
B:C ratio
REY (kg / ha

50
The increase in weed biomass due to tillage system is in tune of 13.3 % at 25
DAS, 10.9 % at 60 DAS and by 8.0 % at harvest
Inclusion of OM over the years increased the grain yield in the tune of 3.4 % over the
treatments without OM and the grain yield of herbicidal treatments was at par
Two Hand Weeding along with OM to rice and hand weeding with earthing up in
groundnut produced the highest REY of 11.35 t/ha. But application of butachlor +
2,4D EE without OM to rice and alachlor to groundnut recorded the highest B:C
ratio of 1.85
Inclusion of CT in the tillage system reduces the weed densities by 18.3% to
26.4% during different stages of crop growth in the rice-rice system
During the initial stages (25 DAP), application butachlor (1.5 kg ha-1
) reduced
the weed density by 62% over unweedy check .
The yield reduction in ZT-ZT method was in the tune of 24.7% as compared
to CT-CT method
Integration of ZT-ZT method and use of butachlor 1.5 kg ha-1
obtained the
maximum B: C ratio of 1.85 in the rice-rice system
The composition weed seed bank in ZT was dominated with grasses (63%)
followed by broad leaf weeds (24%) and sedges (13%) and the corresponding
values in CT were 65%, 23% and 12%.
Sowing of maize in zero tillage machine in conservation agriculture trial
51
Table 8.Effect of tillage methods and weed control measures in weed density at
different growth stages of Rabi maize (2013-14)
Treatments 25 DAS 60 DAS At harvest
(m-2
) (m-2
) (m-2
)
Main plot (Tillage methods)
T1 CT(Trans)-CT- 61.61 48.56 76.68
T2 CT(Trans)-ZT-ZT 49.06 39.37 68.60
T3 CT(Direct)-CT-ZT 53.88 44.18 52.89
T4 ZT(Direct)-ZT+R-ZT 42.26 33.53 43.94
T5 ZT(Direct)+R-ZT+R-ZT 0.308 0.258 0.269
CD (0.05) 1.07 0.89 0.93
Sub-plot (Weed control
measures)
H1 Recommended herbicide 26.22 32.07 48.52
H2 IWM(herbicide+hand weeding 23.40 17.94 24.22
H3 Unweedy check 65.48 74.22 108.85
SEm() 0.352 0.155 0.305
CD (0.05) 1.06 0.46 0.92
Interaction (H within T)
SEm() 0.705 0.310 0.610
CD (0.05) 2.113 0.93 1.83

52
Table 9.Effect of tillage methods and weed control measures in weed density at
different growth stages of summer cowpea (2013-14)
Treatments 25 DAP 60 DAP At harvest
(m-2
) (m-2
) (m-2
)
Main plot (Tillage methods)
T1 CT(Trans)-CT- 69.82 52.50 76.87
T2 CT(Trans)-ZT-ZT 68.10 44.39 69.57
T3 CT(Direct)-CT-ZT 58.33 47.14 57.04
T4 ZT(Direct)-ZT+R-ZT 47.99 39.14 47.32
T5 ZT(Direct)+R-ZT+R-ZT 0.303 0.143 0.247
CD (0.05) 1.05 0.50 0.85
Sub-plot (Weed control
measures)
H1 Recommended herbicide 77.12 19.99 25.43
H2 IWM(herbicide+hand
weeding 28.80 35.25 50.61
H3 Unweedy check 77.26 82.14 112.06
SEm() 0.160 0.139 0.144
CD (0.05) 0.48 0.42 0.43
Interaction (H within T)
SEm() 0.321 0.278 0.288
CD (0.05) 0.96 0.83 0.86

53
Table 10. Effect of tillage methods and weed control measures in weed biomass
at different growth stages of rabi maize (2013-14)
Treatments 25 DAP 60 DAP At harvest
(g m-2
) (g m-2
) (g m-2
)
Main plot (Tillage methods)
T1 CT(Trans)-CT- 20.78 16.13 34.84
T2 CT(Trans)-ZT-ZT 17.39 13.61 32.58
T3 CT(Direct)-CT-ZT 18.68 14.54 26.57
T4 ZT(Direct)-ZT+R-ZT 15.19 11.79 23.22
T5 ZT(Direct)+R-ZT+R-ZT 0.2 0.067 0.352
CD (0.05) 0.69 0.23 1.22
Sub-plot (Weed control
measures)
H1 Recommended herbicide 22.17 7.86 16.25
H2 IWM(herbicide+hand
weeding 9.38 9.42 24.46
H3 Unweedy check 22.48 24.77 47.20
SEm() 0.08 0.082 0.310
CD (0.05) 0.24 0.25 0.93
Interaction (H within T)
SEm() 0.159 0.165 0.620
CD (0.05) 0.48 0.49 1.86

54
Table 11. Effect of tillage methods and weed control measures in weed biomass
at different growth stages of summer cowpea (2013-14)
Treatments 25 DAP 60 DAP At harvest
(g m-2
) (g m-2
) (g m-2
)
Main plot (Tillage methods)
T1 CT(Trans)-CT- 20.78 16.13 34.84
T2 CT(Trans)-ZT-ZT 17.39 13.61 32.58
T3 CT(Direct)-CT-ZT 18.68 14.54 26.57
T4 ZT(Direct)-ZT+R-ZT 15.19 11.79 23.22
T5 ZT(Direct)+R-ZT+R-ZT 0.2 0.067 0.352
CD (0.05) 0.69 0.23 1.22
Sub-plot (Weed control
measures)
H1 Recommended herbicide 22.17 7.86 16.25
H2 IWM(herbicide+hand
weeding 9.38 9.42 24.46
H3 Unweedy check 22.48 24.77 47.20
SEm() 0.08 0.082 0.310
CD (0.05) 0.24 0.25 0.93
Interaction (H within T)
SEm() 0.159 0.165 0.620
CD (0.05) 0.48 0.49 1.86
55
Table 12. Effect of tillage and weed control methods on yield and weed
index in rice-maize-cowpea cropping system
Treatments
Summer(2014) Rabi (2013-14) Kharif (2013)
Grain B:C Grain B:C Grain Straw B:C
kg ha-1
kg ha-1
kg ha-1
Main plot
T1 CT(Trans)-CT- - - 31830 2.45 3100 3960 3.01
T2 CT(Trans)-ZT-ZT 3530 2.85 37800 2.98 3715 4643 2.45
T3 CT(Direct)-CT-ZT 3642 2.65 35910 2.87 3530 4449 2.01
T4 ZT(Direct)-ZT+R-ZT 3124 2.41 42320 2.41 4114 5148 1.98
T5
ZT(Direct)+R-
ZT+R-ZT 3214 2.49 39651 2.12 10.672 8.254 1.54
CD (0.05) 21.34 - 57.34 - 36.93 28.56 -
Sub-plot (Weed control
measures)
H1 Recommended
herbicide 3925 2.45 44280 2.14 4341 5266 1.98
H2 IWM(herbicide+hand
weeding 4119 3.12 49180 2.54 4239 5180 2.31
H3 Unweedy check 2145 1.98 23430 2.01 2265 3205 1.45
SEm() 24.35 8.640 - 7.417 9.259 -
CD (0.05) 72.89 25.90 22.23 27.76 -
Interaction (H within T)
SEm()
CD (0.05)

56
STATION TRIAL
WS 3.8.8: Management of Mikania micrantha: a problematic weed in banana
Centre: Bhubaneswar
Treatments Dose Time of application
I. Oxyfluorfen
(0.05 kg /ha) PE.
II. Neemcake fb oxyfluorfen
200 kg/ha fb 0.05
kg/ha
At sowing fb PE
III. Oxyfluorfen fb paraquat 0.05 fb 0.25 kg/ha PE fb 50 DAP as directed
spray
IV. Glyphosate 5 l/ha 50 DAP as directed
spray
V. Manual weeding (3) 30,60,90 and 120 DAP
VI. Weedy check
Design: RBD Replication: 4
Treatment imposed , yet to be analysed
WS 3.8.9: Weed management in Jute
Centre: Bhubaneswar
Treatments Dose Time of application
1. 2,4-D+ butachlor 1.0 + 1.0 kg/ha As stale seed bed (7 days
before sowing
2. Glyphosate + 2,4-D 2.0 +1.0 kg/ha As stale seed bed (7 days
before sowing
3. Pretilachlor + paraquat 1.0 +0.5 kg/ha As stale seed bed (7 days
before sowing
4. Paraquat 0.5 kg/ha As stale seed bed (7 days
before sowing
5. Glyphosate + pyrazosulfuron
ethyl
2.0 + 0.09
kg/ha
As stale seed bed (7 days
before sowing
6. Quizalofop ethyl 0.05 kg/ha 21 DAS
7. Framers’ practice (2 HW) 20 and 40 DAS
8. Un-weeded control
Treatment couldn’t imposed last year , to be conducted this year

57
WS 4.1a. Management of Orobanche in Brinjal
A field trial as OFT on management of Orobanche in brinjal crop was initiated
in Orobanche infested vegetable tract of Cuttack disrict (Talabasta village) during
October, 2012 in farmers field. The objective of the study is to find out the effective
management practices for Orobanche in brinjal.
Name of the Farmer : Sri Prasana kumar Rout
Village : Alsua,Banki,Cuttack
Treatments:
T1-Neem cake 200 kg/ha at sowing fb pendimethalin 1.0 kg/ha as pre-em, 3 DAP
fb soil drenching of metalaxyl MZ 0.2 % at 20DAT
T2-Neem cake 200 kg/ha at sowing fb metribuzin 0.5 kg/ha pre-em, 3 DAP fb soil
drenching of metalaxyl MZ 0.2% at 20DAT
T3-Neem cake 200 kg/ha at sowing fb soil drenching of metalaxyl MZ 0.2% at
20DAT
T4-Ethoxysulfuron 50 and 50 g/ha as PRE and at 45 DAT
T5-Sulfosulfuron 25 and 25 g/ha at 15 and 45 DAT
T6-Weedy check
Plot size: 10mx10m, Date of planting: 01.09.2013
Results:
Some of the biological parameters recorded was presented in Table 1. The emergence
of the shoot takes around 49 days and there were on an average 5.2 shoots per a single
brinjal plant. The shoot of Orobanche goes up to a height of 14.3 cm. And the shoot
dries in 38 days. The parasite produces around 4500 seeds / floret and there were 40.0
florets per shoot
Table 1. Biology of Orobanche in brijal
Parameters Range Mean
Days to emergence of shoot above ground
(from date of planting)
43 - 56 49
No of shoots of parasite / plant 3 - 7.4 5.2
Shoot height(cm) 11.3 – 17.0 14.3
Days to flowering (from the date of planting) 50-60 55
Days to drying of shoot (from the date of emergence) 35-41 38

58
Dry weight / plant Stem 1.1 – 4.5 3.0
Florets 0.5-2.0 1.4
Seeds 0.30-1.36 0.76
Total 1.90 – 7.86 5.16
No. of florets / shoot 26 – 95 40.0
No. of seeds / floret 3500 – 5700 4500
No. of seeds / inflorescence 96400-
550200
280000
Orobanche density
Application of Neem cake 200 kg/ha at sowing fb pendimethalin 1.0 kg/ha as
pre-em, 3 DAP fb soil drenching of metalaxyl MZ 0.2 % at recorded significantly the
lowest number of Orobanche/plant ((9.2) at 30DAP which was at par with application
of neem cake 200 kg/ha (10.2). However, the practice of two hand weedings at 35 and
55 DAP recorded significantly the lowest density (10.2) at harvest and the reduction
in density was in the tune of 25% over application of pendimethalin.
Dry weight of Orobanche
The dry weight of Orobanche followed the similar trend as that of density
throughout the entire cropping cycle of brinjal. Use of Neem cake 200 kg/ha at
sowing fb pendimethalin 1.0 kg/ha as pre-em, 3 DAP fb soil drenching of metalaxyl
MZ 0.2 % at 20DAT and practice of two hand weeding (35 and 55 DAP) recorded the
lowest weed density of 5.2 and 10.6 g/plant at 30 DAP and at harvest, respectively.
Orobanche Control Efficiency and Yield
Application of Neem cake 200 kg/ha at sowing fb pendimethalin 1.0 kg/ha as
pre-em, 3 DAP fb soil drenching of metalaxyl MZ 0.2 % at 20DAT recoded the
highest Orobanche control efficiency (67.1%) at 30 DAP and practice of two hand
weeding was observed to be the best (64.3%) at harvest (Fig 1). Among weed
management practices, hand weeding twice recoded the highest yield (34.7 t/ha)
which was at par with the yield from the plots applied with neem cake 200 kg/ha at
sowing fb pendimethalin 1.0 kg/ha as pre-em, 3 DAP fb soil drenching of metalaxyl
MZ 0.2 % at 20DAT (34.3 t/ha). The lowest yield of 11.6 t/ha was obtained from the
control plot.

59
Conclusion:
The emergence of the Orobanche shoot takes around 49 days and it goes up to
a height of 14.3cm and produces 4500 seeds/floret
Application of neem cake 200 kg/ha at sowing fb pendimethalin 1.0 kg/ha as
pre-em, 3 DAP fb soil drenching of metalaxyl MZ 0.2 % at 20DAT recorded
the lowest density per brinjal plant (9.2) at 30 DAP followed by neem cake
200 kg/ha (10.2)
Among weed management practices, hand weeding twice recoded the highest
yield (34.7 t/ha) which was at par with the yield from the plots applied with
pendimethalin 1.0 kg/ha (34.3 t/ha)
WS 4.1c Management of Cuscuta in Niger
Cuscuta chinensis, a dreaded parasitic weed, is a serious threat in niger
growing areas such as the hilly tracts of South Eastern Ghat, Eastern Ghat High Lands
and Northern Plateau agro-climatic zones of the state. In order to find out suitable
and economic weed management practice for niger in these tracts, this experiment
was taken farmer’s field as OFT under Regional Research and Technology Transfer
Station, Semiliguda in the district of Koraput
Treatments:
T1: Pendimethalin 1.0 kg/ha – pre-em
T2: Stale seedbed fb pendimethalin 1.0 kg/ha – pre-em
T3: Imazethapyr 75 g/ha as PPI
Plot size: 3.8 m x 3.6 m
Date of sowing: 13.08.2013
Date of harvesting: 02.12.2013
Results (Table 1)
a) Germination of Cuscuta: Among the different weed control methods, Cuscuta
appeared as early as 12 DAS in Stale seedbed fb pendimethalin 1.0 kg/ha – pre-em
and it was delayed up to 18 DAS in the treatment of pendimethalin 1.0 kg/ha PE . The

60
germination of Cuscuta was less in Stale seedbed fb pendimethalin 1.0 kg/ha – pre-em
(2.0 no m-2
).
b) Density of Cuscuta: Among the herbicidal treatments, the treatment Stale seedbed
fb pendimethalin 1.0 kg/ha – pre-em recorded the lowest Cuscuta density of 3.2 / m2
and 12.4/m2
at 30 and 60 DAS followed by pendimethalin 1.0 kg/ha PE (4.3 and
13.1/m2).
Table 1. Effect of weed management on germination, density of Cuscuta
and yield of niger (2013s)
Treatments
Germination of
Cuscuta
Density of
Cuscuta (m-2
)
Yield of
niger B:C
ratio (DAS) No/m
2
30
DAS 60 DAS kg ha
-1
T1 : Pendimethalin 1.0 kg/ha –
pre-em 18.00 2.40 4.30 13.10 710.00 1.85
T2 :Stale seedbed fb
pendimethalin 1.0 kg/ha –
pre-em
12.00 2.00 3.20 12.40 792.50 1.71
T3 :Imazethapyr 75 g/ha as PPI 14.00 2.80 4.80 12.80 702.50 1.81
d) Yield and economics: The treatment of stale seed bed fb pendimethalin 1.0 kg/ha
PE recorded the highest grain yield of 792.5 kg ha-1
followed by pendimethalin 1.0
kg/ha PE (710 kg ha-1
). Stale seed bed fb pendimethalin 1.0 kg/ha PE increased the
grain yield of niger by 11.5% and 12.8%, respectively over pendimethalin 1.0 kg/ha –
pre-em and imazethapyr 75 g/ha as PPI.The treatment of pendimethalin 1.0 kg/ha PE
produced the highest B:C ratio (1.85) followed by imazethapyr 75 g/ha as PPI (1.81).
e) Conclusion:
Cuscuta appeared as early as 12 DAS in Stale seedbed fb pendimethalin 1.0
kg/ha – pre-em and it was delayed up to 18 DAS in the treatment of
pendimethalin 1.0 kg/ha PE . The germination of Cuscuta was less in Stale
seedbed fb pendimethalin 1.0 kg/ha – pre-em (2 no m-2
).
Stale seedbed fb pendimethalin 1.0 kg/ha – pre-em recorded the lowest
Cuscuta density of 3.2 / m2 and 12.4 /m
2 at 30 and 60 DAS followed by
pendimethalin 1.0 kg/ha PE (4.3 and 13.1 /m2).

61
Stale seed bed fb pendimethalin 1.0 kg/ha PE recorded the highest grain yield of
792.5 kg ha-1
followed by pendimethalin 1.0 kg/ha PE (710 kg ha-1
). Stale seed
bed fb pendimethalin 1.0 kg/ha PE increased the grain yield of niger by 11.5%
and 12.8%, respectively over pendimethalin 1.0 kg/ha – pre-em and imazethapyr
75 g/ha as PPI.The treatment of pendimethalin 1.0 kg/ha PE produced the highest
B:C ratio (1.85) followed by imazethapyr 75 g/ha as PPI (1.81).
Cuscuta in niger Stale seed bed fb pendimethalin 1.0 kg/ha PE
WS 4.2: Making of Parthenium free campus
To make the campus parhenium free the following activities have been taken
in the central farm in the first phase.
1. In large Partheniuminfested area in the
campus, spray of herbicides (glyphosate,
2,4-D metribuzin as per the requirement)
on emerging Partheniumseedlings after
pre-monsoon rains when
Partheniumgerminates.
2. Uprooting of Partheniumduring rainy
season, first from road side and
community land of the campus
and after that from crop fields
involving farm laboures,
agricultural students in general
and other faculty members.

62
3. Regular watch of campus for new emergence and their time to time uprooting
during rainy season before flowering.
4. Spot herbicide treatment of scattered Partheniumplants at regular interval in
the campus during summer and winter season.
WS 4.3: Biological control of water hyacinth by Neochetina bruchi
Methods: Two perennial ponds situated i.e one near to the airport of Bhubaneswar
and other at the central farm,OUAT have been selected and the weevils have been
released at the month of October.The observations will be taken up at next season
after its population build up.
Release of weevils neochitina bruchi

63
Spraying of fungus Alternnaria sp at the infested perrenial pond of farm site
Spraying of fungal solution in Eicchornia spp.

64
WS 5. Herbicide residues and environmental quality
WS 5.1 Herbiside residues in conservation agriculture 2014-15
i) Experimental details
The long term experiment on weed management in conservation agriculture
system was initiated in kharif season, 2013 at Central Research Station, OUAT,
Bhubaneswar to monitor the weed dynamics, crop productivity, herbicide residues,
changes in physico-chemical and biological properties of soil health . The soil is
sandy clay loam, acidic, low in available N, P and medium in available K.The nutrient
availability in the soil is low to medium due to acidic in nature .
Treatment details:
Tillage (main plot) 1st crop (rice) 2
nd crop (rice) 3
rd crop
T1 – CT(Transplanted) CT -
T2 – CT (Transplanted) ZT ZT
T3 – CT (Direct-seeded) CT ZT
T4 – ZT (Direct-seeded) ZT ZT
T5 – ZT (Direct-seeded)+R ZT +R
ZT
Weed control (subplot) H1 – Recommended herbicide
H2 – IWM(herbicide+mechanical weeding+intercrop)
H3 – Unweeded control
Design : Strip plot,
Replication : Two
Plot size : 10×5 m2
Fertilizer dose : 80:40:40 kg/ha in kharif
Since the experiment was initiated during Kharif 2013 only by taking rice. In rabi,
maize crop has been taken up and all the treatments have been imposed as per
technical programme.

65
WS 5.1: Herbicide residues in conservation agriculture (rice based cropping
System) (rice-maize-cowpea)
Persistence of Pretilachlor in groundnut
0
0.1
0.2
0.3
0.4
0.5
0 15 30 60 90 Harvest
Days after application
Res
idue
in m
g/kg
T1
T2
T3
T4
T5
T6
The pattern of persistence was almost equal in both the herbicides in all the
treatments but it was steeper in case of pretilachlor. After about 30 DAA pretilachlor
and about 60 DAA alachlor were not detected. Addition of organic matter decreased
the residue rapidly.The crop residue increases the organic carbon content in the soil
which decrease the residue rapidly.
LOQ=0.01mg/kg
LOD=0.001mg/kg
RESULTS:
a. Effect of herbicides on microbial population
b.
The bacteria and fungi populations in the soils are presented in Table 3, Fig. 1
& 2. The bacterial population of the soils varied from 20.0 to 25.0 x 10⁹ / g soil. The
presence of crop residues increases the microbial activity.Addition of crop residue
increases the moisture content of the soil which directly helps in microbial activity.
The weed control measures followed in kharif rice significantly changed the bacterial
population in soils. Application of pretilachlor reduced the bacterial population by 9.0
% and 7.0 % over hand weeded treatments (Fig.1). Application of organic matter in
the form of crop residue did help in stabilizing the bacterial population (24.2 x 10⁹)
and recorded an increase of 9.0 % over the treatments without organic matter (Fig. 2).
The population of fungi varied from 69.0 to 84.2 x 10⁵ /g soil. Similarly, application
of herbicides decreased the fungal population by 6.4 % to 9.5 % over hand weeded
treatments (Fig 1) and addition of crop residue enhanced the fungal population (79.2 x
105 / g soil) by 8.4 % (Fig. 2). The variations in fungal population due to herbicide
application both in kharif and Rabi were not significant.
The microbial populations with respect to treatments were in the order: zero
tillage) > pretilachlor 0.75 kg/ha.> > Hand weeding (twice)
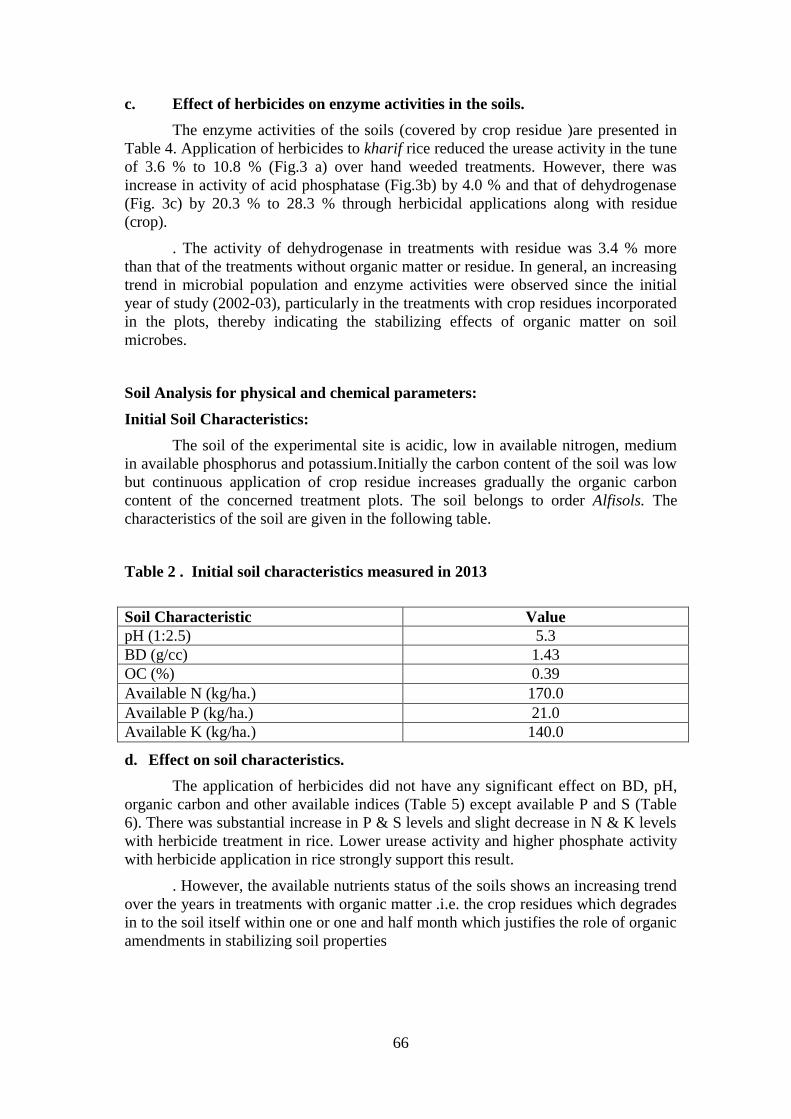
66
c. Effect of herbicides on enzyme activities in the soils.
The enzyme activities of the soils (covered by crop residue )are presented in
Table 4. Application of herbicides to kharif rice reduced the urease activity in the tune
of 3.6 % to 10.8 % (Fig.3 a) over hand weeded treatments. However, there was
increase in activity of acid phosphatase (Fig.3b) by 4.0 % and that of dehydrogenase
(Fig. 3c) by 20.3 % to 28.3 % through herbicidal applications along with residue
(crop).
. The activity of dehydrogenase in treatments with residue was 3.4 % more
than that of the treatments without organic matter or residue. In general, an increasing
trend in microbial population and enzyme activities were observed since the initial
year of study (2002-03), particularly in the treatments with crop residues incorporated
in the plots, thereby indicating the stabilizing effects of organic matter on soil
microbes.
Soil Analysis for physical and chemical parameters:
Initial Soil Characteristics:
The soil of the experimental site is acidic, low in available nitrogen, medium
in available phosphorus and potassium.Initially the carbon content of the soil was low
but continuous application of crop residue increases gradually the organic carbon
content of the concerned treatment plots. The soil belongs to order Alfisols. The
characteristics of the soil are given in the following table.
Table 2 . Initial soil characteristics measured in 2013
Soil Characteristic Value
pH (1:2.5) 5.3
BD (g/cc) 1.43
OC (%) 0.39
Available N (kg/ha.) 170.0
Available P (kg/ha.) 21.0
Available K (kg/ha.) 140.0
d. Effect on soil characteristics.
The application of herbicides did not have any significant effect on BD, pH,
organic carbon and other available indices (Table 5) except available P and S (Table
6). There was substantial increase in P & S levels and slight decrease in N & K levels
with herbicide treatment in rice. Lower urease activity and higher phosphate activity
with herbicide application in rice strongly support this result.
. However, the available nutrients status of the soils shows an increasing trend
over the years in treatments with organic matter .i.e. the crop residues which degrades
in to the soil itself within one or one and half month which justifies the role of organic
amendments in stabilizing soil properties

67
Conclusion
1. Application of herbicides to rice significantly reduced some of the microbial
attributes like fungal and bacterial population by 6.0 - 9.0 % and 7.0 - 9.0 %,
respectively.
2. Addition of crop residue enhanced the bacterial and fungal population by 9.0
% and 8.0 %, respectively.
3. The microbial population of treatments were inorder:zerotillage >
pretilacholor 0.75 kg / ha.> Hand weeding (twice)
4. In general, an increasing trend in microbial population and enzyme activities
was observed since the initial year of study (2013-14). Addition of organic
matter (crop residue) could not significantly influence the BD, pH, OC, and
nutrients like available N, available K and available S. However, the available
nutrients status of the soils shows an increasing trend over the years in
treatments with organic matter, which justifies the role of organic amendments
in stabilizing soil properties.
5. Use of herbicides in conjunction with crop residue improved soil fertility
through better microbial activity.Addition of crop residues increases the
organic carbon content on the soil which helps in increase in microbial activity
.

68

69

70
WS 5.4: Testing of persistence of herbicides in the farmers’ field (soil and
crop produce)
Objectives: To determine herbicide persistence in the farmer’s field.
Methodology: Soil and plant samples were collected from farmer’s field at harvest,
processed for residue analysis. Herbicide residues, if any are reported
Method of analysis: GC .Due to unavailability of any facility in the scheme and at
the university level itself, we have taken the help of CTCRI Bhubaneswar. It is very
difficult for us because they are almost denying for any help due to their overload
work and shortage of scientists.However it was managed any how for fewer samples
only by their scientists.
Location : Pipili, Puri district
Agro-climatic zone : East and South Eastern Coastal Plain
Season/Year : Kharif, 2014
Crop : Rice
Soil type : Sandy loam (deltaic alluvial soil)
i. Nutrient status N-low
P-medium
K-medium
ii. Recommended dose NPK: 60-30-30Kg/ha
Residue in crop (at harvest):
Grain : BDL , Straw : BDL
Residue in soil
a. Sampling days after herbicides application: 0, 20, 40, 60, 80, Harvest
b. Depth of sampling: 0-10 cm
c. Method of analysis : GC (ECD)
Table 4. Persistence of pretilachlor in soils of transplanted rice (Farmers’ field)
Sampling intervals (Days) Residue (ppm) at Dose 0.5kg/ha
0 0.236
20 BDL
40 BDL
60 BDL
80 BDL
Harvest BDL
BDL- below Detectable Level- <0.001 ppm
Detection limit: LOQ=0.01mg/kg, LOD=0.001mg/kg
Results
Soil samples collected from rice fields in pipili block of Puri district under sandy loam
soils did not have residue from 20 days after application of pretilachlor @ 0.5kg/ha.

71
On Farm Trials (2003-14 Rabi).
A. Rice
Four number of OFTs on transplanted rice were conducted during rabi 2003-14 at
Alasua,Banki,Cuttack districts and the findings are as follows:
Details on farmer’s name and villages
Sl.
No.
Name of the farmer Village
1 Kelu Biswal Alasua,Banki,Cuttack
2 Basudev Sardarsingh Alasua,Banki,Cuttack
3 Srinibas Parida Alasua,Banki,Cuttack
4 Bhagirathi Parida Alasua,Banki,Cuttack
Location of OFT - Alasua,Banki,Cuttack (East & South Eastern coastal Plane Zone)
Area - 3.0 ha
Situation - Irrigated
Cropping system followed - Rice - Rice
Soil type - Loam
Planting time – 18.01.2014 to 22.01.2014
Crop variety - Lalat
Fertilizer applied (kg/ha) : NPK - 80:40:40
Crop duration - 130 days
Other management practices - Application Monocrotophos and streptomyclin for
controlling pests
Observation on weed
Dominant weeds Weed dry weight (g/m2)
Oxadiargyl
(90 g/ha)
Pretilachlor
(1.0 kg/ha)
Farmers practice
Echinochloa crusgalli 8.5 9.7 12.5
Panicum repens 7.5 7.8 10.6
Ludwigia parviflora 13.5 13.8 16.8
Cyperus iria 5.2 4.8 11.2
Cyperous rotundus 3.5 3.7 10.8
Farmers Practice – Hand weeding at 25 and 45 DAP

72
Yield and economics (per hactare)
Parti-
culars
Yield (kg/ha) Cost of weeding (Rs/ha)
Oxadiargyl
(90 g/ha)
Pretilachlor
(1.0 kg/ha)
Farmers
practice
(1 HW)
Oxadiargyl
(90 g/ha)
Pretilachlor
(0.5kg/ha)
Farmers practice
(2 HW)
Grain 3570 3630 3100 650 725 2300
Straw 4320 4480 4280
Maximum yield of 3630 kg/ha was recorded in the plot applied with
pretilachlor 1.0 kg/ha followed by oxadiargyl 90 g/ha (3570 kg/ha). A net saving of
Rs 1575 - 1650/ ha was obtained in the plots treated with herbicides
B. Groundnut
Three OFTs on groundnut were conducted in Singhberhampur, Delanga, Puri area
during 2013-14 Rabi and the findings are as follows.
Details on farmer’s name and villages
Sl.
No
Name of the farmer Village
1 Chaitanya Behera Singhberhampur,Delang, Puri
2 Narayan Behera Singhberhampur,Delang, Puri
3 Rabindra Kumar Behera Singhberhampur,Delang, Puri
Location of OFT: Singhberhampur,Delang, Puri district (East and South-eastern
Coastal Plain)
Area - 2.0 ha
Situation - Irrigated
Cropping system followed - Rice-Groundnut
Soil type - Sandy loam
Sowing time - 07.12.09 to 11.12.09
Crop variety - AK 12-24, Smruti
Fertilizer applied - NPK – 20:40:40 kg/ha
Crop duration - 120-125 days (harvesting time - Last week of April,2010)

73
Other management practices - Application Chloropyriphos to control pests
Observation on weeds
Dominant weeds Weed dry weight (g/m2)
Butachlor
(1.0kg/ha)
Oxyflurfen
(0.05kg/ha)
Pendimethalin
(0.5kg/ha)
Farmers
practice
Echinochloa colona 13.2 12.8 12.9 22.5
Eclipta alba 8.8 9.3 9.4 17.2
Celosia argentea 11.8 7.8 10.3 23.8
Cynodon dactylon 6.9 7.8 7.9 15.8
Cyperous rotundus 6.5 6.8 7.2 13.5
Farmers Practice – 1 hoeing & weeding at 20 DAS
Celosia argentea was effectively controlled by oxyflurfen at 0.05 kg/ha
Yield and economics (per hactare)
Particulars
Yield (kg/ha) Cost of weeding (Rs/ha)
Butachlor
(1.0kg/ha)
Oxyflurfen
(0.05kg/ha)
Pendimethalin
(0.5kg/ha)
Farmers
practice
Butachlor
(1.0kg/ha)
Oxyflurfen
(0.05kg/ha)
Pendimethalin
(0.5kg/ha)
Farmers
practice
Pod 2280 2470 2350 1800 700 750 725 2700
Haulm 4000 4100 4080 3770
Highest yield was obtained in the plots applied with oxyfluorfen 0.05 kg /ha
(2470 kg/ha) followed by pendimethalin 0.5 kg/ha (2350 kg/ha). The saving in
weeding cost over farmers practice was in the tune of Rs 1950 to Rs 2000 / ha
Front line demonstration of herbicide to the farmers

74
FLD: 2014
1) Basic information to be recorded for each FLD
1. Farmer’s Name : Abhimanyu Pradhan
2. Address : Munida,Satyabadi,Puri
3. Size of holding
a. Irrigated land
b. Unirrigated land
:
:
:
1.0 Ac
1.0 Ac
:
5. Educational status : Illiterate/Primary school /High School/Graduate
6. Total income
a. Agriculture
b. Other sources
:
:
105000
75000
30000
7. Major cropping pattern followed :
i.Rice-Rice-Moongbean
ii.
iii.
8. Tick major constraints in respect to weed management
1. Lack of awareness about modern weed management technology √
2. Lack of technical know how to implement modern weed management technology
3. Unavailability of herbicides/spraying tools/improved mechanical tools etc.
4. Psychological fear about use of Chemicals √
5. Intentional choice of using household manpower
6. Any other (specify)
9. Response of farmers to the demonstrated technology
Unsatisfied/Partially Satisfied/Fully Satisfied
10. Economic analysis:
Particulars Farmers Practice Demonstrated technology
1. Cost of production (Rs/ha) 16000 18450
2. Yield (q/ha) 30 42
3. Net profit (Rs/ha) 19350 29275
4. B:C ratio 1.94 2.97

75
1. Farmer’s Name : Harihar Dixit
2. Address : Munida,Satyabadi,Puri
3. Size of holding
c. Irrigated land
d. Unirrigated land
:
:
:
1.5 Ac
1.5 Ac
:
5. Educational status : Illiterate/Primary school /High School/Graduate
6. Total income
c. Agriculture
d. Other sources
:
:
85000
58000
27000
7. Major cropping pattern followed :
i.Rice-Rice-Moongbean
ii.
iii.
8. Tick major constraints in respect to weed management
7. Lack of awareness about modern weed management technology √
8. Lack of technical know how to implement modern weed management technology
9. Unavailability of herbicides/spraying tools/improved mechanical tools etc.
10. Psychological fear about use of Chemicals √
11. Intentional choice of using household manpower
12. Any other (specify)
9. Response of farmers to the demonstrated technology
Unsatisfied/Partially Satisfied/Fully Satisfied
10. Economic analysis:
Particulars Farmers Practice Demonstrated technology
1. Cost of production (Rs/ha) 18000 16450
2. Yield (q/ha) 35 45
3. Net profit (Rs/ha) 14350 28275
4. B:C ratio 1.84 2.97

76
Over all analysis of FLD data by individual AICRP WC Centre
Year : 2014
Season : Kharif
Name of crop: Rice
Name of technology demonstrated: Application of Bispyribac Sodium @ 200
ml/ha
Total number of demonstration : 10
Mean of % increase in yield over FP: 32 %
Mean B:C ratio : 2.45
Remarks of PI in respect to overall performance of the demonstrated
technology
Major cropping system followed
a. Rice - pulses (Horsegram / Greengram / Blackgram) / groundnut (50%)
b. Rice - rice (20%)
c. Rice - vegetables (10%)
d. Rice - fallow (20%)
List 5 major constraints in crop production
i. Poor economic condition
ii. Weed menace
iii. Non availability of inputs in time during growing season
iv. Lack of awareness on modern agro-technologies
v. Frequency of drought due to long dry spells during monsoon
Extent of yield gain (q/ha)
Crops High Medium Low
Upland rice 5% (>30 q/ha) 40% (25 - 30 q/ha) 55% (<25 q/ha)
Transplanted rice 10% (>35 q/ha) 40% (30-35 q/ha) 50% (<30 q/ha)
Groundnut - 30% (15-18 q/ha) 70% (<15 q/ha)

77
Weed management
Crop (a) Intercultivation Number Cost
Rice (upland) Chemical (10%) Butachlor 1.0 kg/ha Rs 850 / ha
Mannual (90%)
(35no./ha)
Behushaning (20DAS) +
HW (45DAS)
Rs. 3800 /ha
(Wages/ day) Rs 150 / day
Crop (b) Intercultivation
Groundnut Chemical (10%) Oxyfluorfen 0.04 kg/ha
(10%) + hoeing at 40DAS
Rs 1500 / ha
Mannual (90%) HW (20DAS) + hoeing
(40DAS)
Rs 3000 /ha
(Wages/ day) Rs 850 / ay
Level of satisfaction
Crop Satisfactory Partially Satisfied Not Satisfied
Upland rice 55% 25% 20
Groundnut 55% 30% 15
Transplanted rice 40% 50% 10
Brief report:
The study on ‘Impact analysis on weed management’ was carried out in
munida village of sakhigopal block of Puri district. The farmers have mostly marginal
holding size with medium family size. The dominant cropping systems practiced are
rice - pulses / groundnut, rice - vegetables and rice - rice (irrigated patch - 20%). The
major production constraints are lack of exposures, unavailability of inputs in time,
weed menace and uncertainty of monsoon. The yields of the crops are low in 60% of
the areas and the farmers are spending Rs 1500 - 2150 /ha more in manual weeding.
Most of the farmers are not satisfied with the traditional method of weed
management.

78
TSP: Tribal sub Plan
Amount
earmarked for
TSP(LAKH)
Expenditure
during
month(Lakh)
Activities Target group:
beneficiary(no.)
Place Physical assets
created
Impact
11.32 (Including the
revalidated amount
of 6.84 lakh of year
2012-13))
6.84 Farm
machinaries
&
implements
for good
agriculture
practices to
increase
their
livilihood
by
enhancing
their farm
incomes.
224 farm
families
Village:
Dandiposi
and
saraposi
Block:
Ghatagaon
District:
Keonjhar
One set of Farm
implements (i.e
Improved sickle,
Khurpa, cono
weeder, trench
ho,sprayer,
Improved spade,
polythene sheet,
first aid box
with medicine
etc.) to each
farm families of
the tribal village.
I t is
being
studied at
what
extent
their
agricultur
al farm
income
with their
livelihoo
d is
enhanced
Distribution of agri-implements to tribal farmer under TSP

79
LIST OF PUBLICATIONS
1. Mishra M M and Dash R. 2013. Assessment of field demonstation on
chemical weed control practices in transplanted rice. Indian journal of weed
sciences.45(3).156-158
2. Dash R and Mishra M M. 2014. Evaluation of bio-efficacy of Halosulfuron
methyl against sedges in bottle gourd. Indian Journal of weed
sciences.(Accepted for publication,vide letter
no.IJWS/Acceptance/2014,dated 17/07/2014)
3. Dash R, Mishra M M and Ranasingh N. 2015. Management of cuscuta in
niger under south eastern hilly regions of Odisha. Environment and
Ecology.33 (1):605-606
POPULAR ARTICLES
1. Dr. M.M.Mishra, R.Dash and M.M.Behera ‘Gajara Ghasa O ehara Nirakaran’
in Oriya Daily, Sambad, August, 2010
Conference/Symposium/Workshop
1. Dash R, Mishra MM and Behera MM. Evaluation of bioefficacy of
halosulfuron-methyl against sedges in bottle gourd .Biennial conference of
Indian society of weed sciences on emerging challenges on weed
management, held during 15-17th
Feb, 2014 at Jabalpur. Extended summaries.
pp-296
2. Mishra MM, Dash R and Behera MM. Management of cuscuta in Niger under
south eastern hilly regions of Odisha .Biennial conference of Indian society of
weed sciences on emerging challenges on weed management held during 15-
17th
Feb, 2014 at Jabalpur. Extended summaries. pp-297
3. Behera MM, Dash R and Mishra MM. Effect of different herbicides on soil
microbial population in transplanted rice. Biennial conference of Indian
society of weed sciences on emerging challenges on weed management held
during 15-17th
Feb, 2014 at Jabalpur. Extended summaries. pp-166

80
List of Training/Awareness campaign:
Title of the training programme
Target audience
(Researcher /
extension
officer / farmers
/ students /
inputs suppliers
/ others)
Number Period
As Trainer
/ Co-
trainer /
Organizer
1. Weed management for
Rice and groundnut
2. Recent Advances in weed management
technologies in different crops
Farmers of different
areas district in
Minor Irrigation
office, Bhubaneswar
-do-
25
20
2013-2014
Trainer
-do-
Participation in Krushak Mela :
Location Period No. of farmers Your specific role
DAO office, Sakhigopal
1 day 60 As trainer
Training conducted by the scientist of AICRP-WC

81
Awards/Recognitions/Students guided:
Courses taught:
Dr.R.Dash,Jr.Agronomist
Courses taught
B.SC(FORESTRY): SAF-215 : Pr incip les o f crop product ion
B.SC(FORESTRY FPW-324 : Weed management in nursery and plantat i ion crops
B.SC(FORESTRY NPM-425: Pr incip les o f weed management
B.SC(FORESTRY Ag-227: Weed management
B.SC(Agr iculture) AS-111; Fundamental o f agr icul tura l stat is t ics
Students guided: 01(M.Sc(Ag.) student
d) Visit of dignitaries
16.10.2014 : Hon;ble Vice Chancellor, OUAT, Dean of research and Dean, Extension Education visite our trial.
XV. Linkage and collaboration:
Directorate of Weed Science Research (ICAR), Jabalpur
Department of Agriculture, Govt. of Orissa
Department of Horticulture, Govt. of Orissa
Public sectors like SAIL, HAL, NTPS, Indian RareEarth Ltd, Chilka Development Authority
ICAR Institutes operating in the state (CIFA, CRRI, Tuber Research)
Other State Agricultural Universities
Herbicide manufacturers
NGOs and farmers of different district of our state
Visit of hon,ble vice chancellor,OUAT