Embed Size (px)
Citation preview

Mkt. Cap Price Cons. Current EBITDA Estimates Val. (EV/EBITDA)Company Name Ticker (MM) Rating Price Target Next FY 2014 2015 2016 2015 2016 Acerinox ACX SM €3,218.9 HOLD €12.30 €13.00 €515.0 €435.6 €492.0 €516.0 7.8x 7.2xAperam APAM NA €1,890.8 BUY €24.21 €30.00 $569.0 $531.8 $579.0 $686.8 4.2x 3.0xOutokumpu OUT1V FH €1,932.1 BUY €4.64 €6.00 €495.0 €212.6 €525.3 €727.9 7.1x 4.7x
Initiating Coverage
Europe | European Steel 8 January 2015
European SteelEuro Stainless Hitting Turning Point; InitiateAPAM & OUT1V at Buy, ACX at Hold
EQU
ITY R
ESEARC
H EU
ROPE
Seth Rosenfeld, CFA *Equity Analyst
+44 (0) 20 7029 8772 [email protected] LaFemina, CFA §
Equity Analyst+44 (0) 20 7029 8131 [email protected]
Alan Spence, CFA *Equity Associate
+44 (0) 20 7029 8311 [email protected]
* Jefferies International Limited § Jefferies LLC
Key Takeaway
The Euro stainless steel sector is hitting a turning point in 2015, leadingto gradually rising steel prices and strong earnings growth. Through acombination of self-help and environmental factors, base prices should bedriven by rising capacity utilisation rates, supportive nickel prices andpotential protectionist policy developments. We initiate coverage of APAM andOUT1V at Buy, and ACX at Hold.
Capacity utilisation rates hitting a turning point. Following several years ofrestructuring led by consolidation and capacity closures, the Euro stainless steel industryis now hitting an inflection point. Led by OUT1V and with additional closures from APAMand TKA, 30% of regional melt capacity should be shuttered by 2016, and utilisation ratesshould grow from just 65% in 2010-11 towards 81% by 2017. As utilisation rates rise, pricingdiscipline should significantly improve and base prices gradually increase, leading to 110%aggregate EBITDA growth 2014-17 and driving our above-consensus forecasts.
Nickel strength to support stainless prices and volumes. Implementation of theIndonesian ore export ban in 2014 was a watershed moment, removing the largest globalsupplier of nickel ores. However, last year proved to be a year of two halves as Chinesesteelmakers drew down large nickel inventories and Filipino exports soared. In 2015-17,the nickel market should gradually tighten as Chinese inventories are depleted and Filipinoproduction stagnates, leading to a marked reduction in NPI production. USD-strength andmacro volatility may serve as a cap in 2015, but 2016-17 will see more significant upside.
Rising protectionism a potential catalyst. Europe has faced a deluge of importsin recent years, rising from <20% of demand pre-2010 to 30% in 2014. While laggingpeers in enacting protectionist measures, the EC instigated two investigations last year, andinitial anti-dumping policies should be announced in 1H15. Tellingly, if Europe returned tohistorical import levels, this would imply a 3% increase in domestic capacity utilisation.
Aperam – Quality operator at discount to peers (Buy, PT €30). APAM remainsthe highest-quality Euro stainless steelmaker, with consistently sector-leading margins andcapacity utilisation. With strong FCF generation and a de-levered balance sheet, APAM ispositioned to restart divi payments ahead of expectations. Trading at an unmerited valuationdiscount to peers (4.2x 2015 EV/EBITDA), APAM is one of our top sector picks.
Outokumpu – Turnaround nearing (Buy, PT €6). OUT1V is nearing two key inflectionpoints. In Europe, the final steps in a multi-year restructuring process should push utilisationrates >90% by 2016. In the US, commercial ramp-up of Calvert should also be completedby 2016, driving earnings and cash generation growth. As FCF yield rises from 11% to 17%in the coming two years, OUT1V should benefit from rapid de-leveraging and a growingvaluation discount to peers (EV/EBITDA falling from 7.1x to 4.7x in 2015-16).
Acerinox – Fully valued with US risks (Hold, PT €13). While ACX has historicallybenefited from strong demand and margins in the US, this business is likely to come underpressure as OUT1V ramps up operations at Calvert. Further, with the Asian stainless marketupset by high Chinese exports and an unstable raw materials situation, ACX's growth atBahru remains unclear. Trading at a valuation premium versus peers (7.8x 2015 EV/EBITDA),we believe ACX is already fully valued.
Jefferies does and seeks to do business with companies covered in its research reports. As a result, investors should be aware that Jefferies may have a conflictof interest that could affect the objectivity of this report. Investors should consider this report as only a single factor in making their investment decision.Please see analyst certifications, important disclosure information, and information regarding the status of non-US analysts on pages 88 to 91 of this report.

Contents EXECUTIVE SUMMARY ................................................................................................................ 3 VALUATION ................................................................................................................................. 8 EURO STAINLESS MARKET DEVOPMENTS .................................................................................. 12
Demand growth outlook – Steady she goes… ............................................................................. 12 Production growth – China still on the rise, but growth rate slowing ........................................ 17 European capacity utilisation rising ............................................................................................ 19
STAINLESS STEEL PRICE DRIVERS ............................................................................................... 24 Nickel tightness expected in 2016-17 ......................................................................................... 28 Chinese cost competitiveness waning ........................................................................................ 33 Regional trade flows – Rising protectionism ............................................................................... 37
APERAM – HIGH QUALITY, LOW VALUATION ............................................................................. 40 OUTOKUMPU – REACHING RESTRUCTURING INFLECTION POINT ............................................... 52 ACERINOX – LEADING US EXPOSURE, BUT GROWTH OUTLOOK UNCLEAR .................................. 69 APPENDIX 1: STAINLESS STEEL GRADES ..................................................................................... 82 APPENDIX 2: LONG VIEWS ......................................................................................................... 84
Natural Resources
Initiating Coverage
8 January 2015
page 2 of 91 , Equity Analyst, +44 (0) 20 7029 8772, [email protected] Rosenfeld, CFA
Please see important disclosure information on pages 88 - 91 of this report.

Executive Summary Following a volatile 2014, the European stainless steel industry faces a variety of catalysts
in 2015-16 that may provide for strong outperformance relative to the carbon steel
industry and broader European equity markets. With unique industry tailwinds from
expected capacity shutdowns, nickel price strength and rising regional protectionism, the
stainless steel sector is well placed for the year ahead. Across the sector, our top picks are
Aperam, due to its inexpensive valuation and high-quality asset base and Outokumpu,
due to its dramatic turnaround potential in 2015-16. We are more cautious on Acerinox,
due to its premium valuation and risk to US market share.
European Restructuring Reaching Turning Point in 2015-16
The European stainless steel industry is now at a turning point following several years of
gradual restructuring led by M&A-driven consolidation and subsequent capacity closures.
These steps should lead to significantly higher utilisation rates and pricing power in the
two years ahead. Outokumpu’s acquisition of ThyssenKrupp’s Inoxum stainless steel
business in 2012 was a key shift for the industry, increasing Outokumpu’s European
market share from 27% to 44% with a positive immediate impact on pricing discipline in
the region. Subsequent to acquisition, Outokumpu has planned shutdowns of 40% of its
meltshop capacity, and these efforts have been supported by additional planned plant
closures from Aperam and ThyssenKrupp.
In total, there has been 2.5mt of announced meltshop capacity closed by the big four
European stainless steelmakers since 2012 and to be completed by 2016, equivalent to
30% of total initial capacity. As a result of these actions, capacity utilisation rates have
increased significantly in the European stainless steel market. Looking back, utilisation
rates were as low as 54% in 2009, leading to a severe fall in stainless base prices and
significant contraction in steelmaker margins in the following years. With significant
capacity removed, utilisation rates should increase towards 70% by 2016 and surpass
80% by 2017 when these closures are completed. In this environment, upstream
operations should run efficiently, downstream rolling lines should remain sufficiently
booked and sales teams will not be pressured to compete on price in order to maximise
sales volumes.
Nickel Price Leverage Likely to Support Stainless Prices and Volumes in 2016+
The implementation of the Indonesian ore export ban in early 2014 was a watershed
moment in the global nickel market, immediately impacting the world’s largest nickel
supplier (Indonesia made up 34% of global mined production in 2013). With Indonesian
exports severely reduced, the Chinese stainless steel industry has had to cope with
reduced access to these low cost ores and significantly reduced production of nickel pig
iron (NPI). However, 2014 was a year of two halves as early concerns over the impact of
the export ban were ultimately offset by continued high Chinese nickel ore inventories
and the growth of low grade Filipino nickel exports.
2015 should see the beginning of significant tightening in the nickel market, with the
nickel price expected to hit multi-year highs in 2016-17. Chinese inventories of nickel ore,
built-up prior to implementation of the Indonesian export ban, are expected to be
depleted in 2Q15. Further, following a massive ramp-up in Filipino nickel exports
throughout 2014, we expect volume growth to stagnate as high-graded mines are run
dry and inventories are drawn down. While the Filipino monsoon season is likely to
elevate price expectations in the very near term (Q1 is generally seasonally strong for
nickel), the market balance will only fundamentally tighten in late 2015-2016.
As nickel prices increase in the years ahead, we expect European stainless steelmaker
profitability to rise as customers seek to re-stock ahead of alloy surcharge hikes, leading to
higher steelmaker utilisation rates, improved pricing power and rising base prices.
Following several years of aggressive
restructuring and plant closures, the
Euro stainless industry should see
significant improvement in capacity
utilisation rates in the coming two
years. Utilisation rates should near
70% in 2016 and surpass 80% in
2017, leading to improved fixed cost
management and stronger pricing
discipline.
As the impact of the Indonesian ore
export ban is fully felt, we expect
Chinese NPI production volumes to
fall and for the global nickel market
to significantly tighten. Higher nickel
prices should lead to a period of
rising alloy surcharges and higher
base prices for Euro steelmakers.
Euro stainless steelmakers should
benefit in the years ahead from rising
stainless prices and margins as a
result of past restructuring/plant
closures, a tightening nickel market
and potential implementation of
protectionist measures.
Natural Resources
Initiating Coverage
8 January 2015
page 3 of 91 , Equity Analyst, +44 (0) 20 7029 8772, [email protected] Rosenfeld, CFA
Please see important disclosure information on pages 88 - 91 of this report.

Further, as nickel prices rise and Chinese NPI production falls, domestic Chinese
steelmaker cost competitiveness will quickly reduce, and we see potential for an
alleviation of historically high import pressures in Western markets.
Rising Protectionism in Europe a Potential Catalyst
As Chinese stainless steelmaking capacity has rapidly ramped-up in recent years, China
has emerged as a leading exporter to global markets, significantly disrupting local
producers’ pricing power, capacity utilisation rates and profits. In Europe, imports have
grown from sub-20% of domestic demand pre 2010 to roughly 30% of demand in 2014,
led by a massive surge in Chinese imports.
While numerous countries have enacted new protectionist measures in recent years
seeking to stem the rise of imports, Europe has been notably slow to act. However, there
are signs that this is beginning the change in Europe as the EC has now taken up two
separate investigations (an anti-dumping investigation against imports from China and
Taiwan and an anti-subsidy investigation against imports from China of cold-rolled
stainless products), with final decisions expected in the first half of 2015.
Looking forward, a decision should be announced by the EC on the first anti-dumping
measures by the end of Q1 and on the second anti-subsidy measures by the end of Q2. In
both cases, new policy could be implemented by 3Q15, potentially significantly
improving supply/demand dynamics within the domestic European stainless steel market
within the very foreseeable future. Tellingly, if Europe returned to a normal historical level
of net imports, this would imply a 3% uptick in capacity utilisation rates for the industry
with considerable upside in stainless base prices and steelmaker margins.
Demand Picture Mixed but Moving in the Right Direction
While western demand for carbon steels fell precipitously following the global financial
crisis (European demand down more than 30% from peak to trough), stainless steel
demand has been significantly more stable (falling by only 21%) buoyed by the product’s
more balanced end-market exposures to both industrial end-markets (food industry,
chemicals, oil & gas, transport) and consumer products (white goods, catering
equipment, medical) that make up over 45% of demand. As a result, even as fixed asset
investment has wavered, global stainless steel demand has continued to grow at roughly
5% pa over recent decades.
Looking specifically at Europe and the US, while stainless steel demand has been unstable
in recent years, we believe that western markets hit an inflection point in 2013 and have
since shown sustainable strength over the past year. In 2014, European apparent stainless
steel demand grew by roughly 5% and US demand grew by 6% driven by solid
underlying real growth and also boosted by restocking as nickel prices rose rapidly
through H1. Looking into 2015, apparent steel demand in Europe and NAFTA is expected
to remain strong but at a slightly lower pace YoY, at 3% and 4% respectively, driving
gradually higher capacity utilisation rates for steelmakers.
Aperam – Stable Quality Operator at Discount to Peers
(Buy, PT €30)
Aperam stands out as perhaps the highest-quality European stainless steelmaker, with a
history of sector-leading capacity utilisation rates and EBITDA margins. Looking into 2015,
Aperam should be well positioned to benefit from gradual demand growth in Europe with
further volume upside across business areas. In addition, Brazilian operations should
benefit from a continued alleviation of Chinese import pressures following recent
protectionist measures given the company’s dominant local market share. While demand
trends may be lacklustre, Aperam’s cost-cutting track record should also continue to be a
key earnings driver.
Potential policy action by the EC to
implement new anti-dumping/anti-
subsidy duties against Chinese and
Taiwanese stainless imports could
serve to significantly reduce import
pressure in the Euro stainless market
in the coming months. A return to
historical levels of net imports would
imply a further 3% increase in
domestic capacity utilisation rates.
While the European macro outlook is
far from rosy, we expect regional
stainless demand to continue to
grow by low single digits in the
coming years buoyed by the
product’s high exposure to
consumer goods, which make up
over 45% of demand.
Aperam is one of our top picks in
light of its sector-leading FCF yield,
high-quality balance sheet and
potential to restart dividend
payments in the near term.
Natural Resources
Initiating Coverage
8 January 2015
page 4 of 91 , Equity Analyst, +44 (0) 20 7029 8772, [email protected] Rosenfeld, CFA
Please see important disclosure information on pages 88 - 91 of this report.
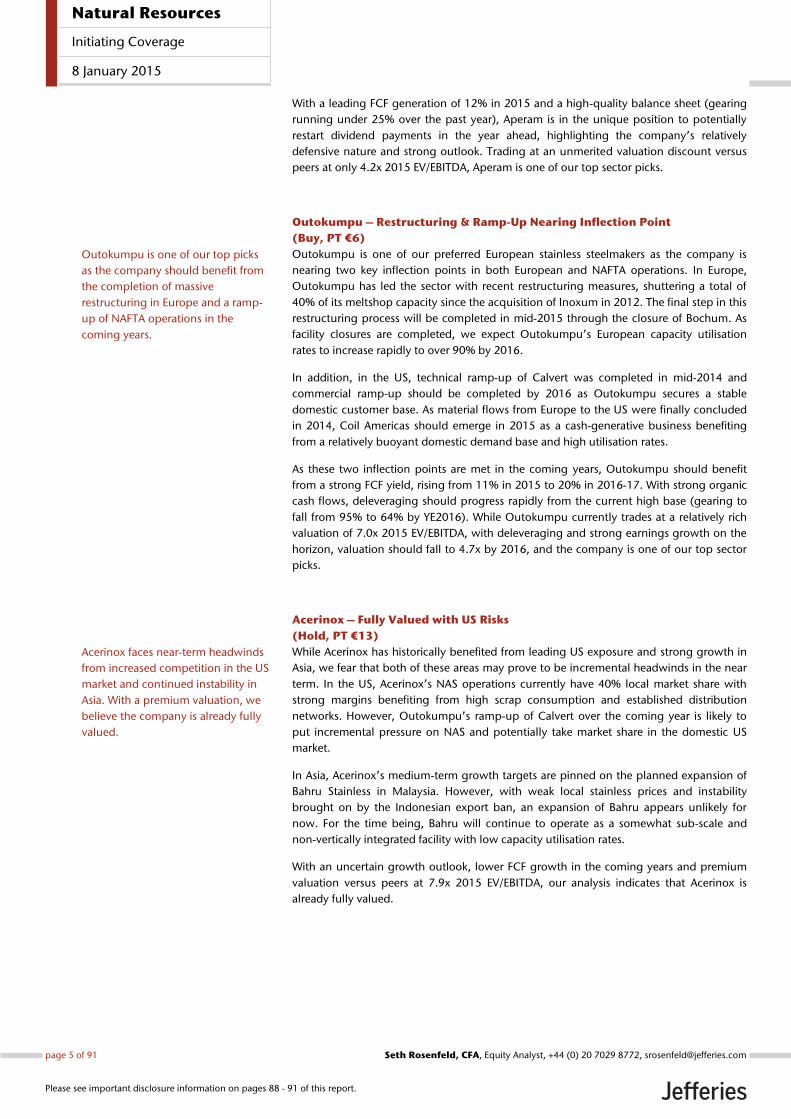
With a leading FCF generation of 12% in 2015 and a high-quality balance sheet (gearing
running under 25% over the past year), Aperam is in the unique position to potentially
restart dividend payments in the year ahead, highlighting the company’s relatively
defensive nature and strong outlook. Trading at an unmerited valuation discount versus
peers at only 4.2x 2015 EV/EBITDA, Aperam is one of our top sector picks.
Outokumpu – Restructuring & Ramp-Up Nearing Inflection Point
(Buy, PT €6)
Outokumpu is one of our preferred European stainless steelmakers as the company is
nearing two key inflection points in both European and NAFTA operations. In Europe,
Outokumpu has led the sector with recent restructuring measures, shuttering a total of
40% of its meltshop capacity since the acquisition of Inoxum in 2012. The final step in this
restructuring process will be completed in mid-2015 through the closure of Bochum. As
facility closures are completed, we expect Outokumpu’s European capacity utilisation
rates to increase rapidly to over 90% by 2016.
In addition, in the US, technical ramp-up of Calvert was completed in mid-2014 and
commercial ramp-up should be completed by 2016 as Outokumpu secures a stable
domestic customer base. As material flows from Europe to the US were finally concluded
in 2014, Coil Americas should emerge in 2015 as a cash-generative business benefiting
from a relatively buoyant domestic demand base and high utilisation rates.
As these two inflection points are met in the coming years, Outokumpu should benefit
from a strong FCF yield, rising from 11% in 2015 to 20% in 2016-17. With strong organic
cash flows, deleveraging should progress rapidly from the current high base (gearing to
fall from 95% to 64% by YE2016). While Outokumpu currently trades at a relatively rich
valuation of 7.0x 2015 EV/EBITDA, with deleveraging and strong earnings growth on the
horizon, valuation should fall to 4.7x by 2016, and the company is one of our top sector
picks.
Acerinox – Fully Valued with US Risks
(Hold, PT €13)
While Acerinox has historically benefited from leading US exposure and strong growth in
Asia, we fear that both of these areas may prove to be incremental headwinds in the near
term. In the US, Acerinox’s NAS operations currently have 40% local market share with
strong margins benefiting from high scrap consumption and established distribution
networks. However, Outokumpu’s ramp-up of Calvert over the coming year is likely to
put incremental pressure on NAS and potentially take market share in the domestic US
market.
In Asia, Acerinox’s medium-term growth targets are pinned on the planned expansion of
Bahru Stainless in Malaysia. However, with weak local stainless prices and instability
brought on by the Indonesian export ban, an expansion of Bahru appears unlikely for
now. For the time being, Bahru will continue to operate as a somewhat sub-scale and
non-vertically integrated facility with low capacity utilisation rates.
With an uncertain growth outlook, lower FCF growth in the coming years and premium
valuation versus peers at 7.9x 2015 EV/EBITDA, our analysis indicates that Acerinox is
already fully valued.
Outokumpu is one of our top picks
as the company should benefit from
the completion of massive
restructuring in Europe and a ramp-
up of NAFTA operations in the
coming years.
Acerinox faces near-term headwinds
from increased competition in the US
market and continued instability in
Asia. With a premium valuation, we
believe the company is already fully
valued.
Natural Resources
Initiating Coverage
8 January 2015
page 5 of 91 , Equity Analyst, +44 (0) 20 7029 8772, [email protected] Rosenfeld, CFA
Please see important disclosure information on pages 88 - 91 of this report.

Exhibit 1: Comparison of Production Capacities
*Production Capacities are after respective restructuring plans Source: Company Data, Jefferies
Exhibit 2: Historical Capacity Utilisation Rates
Source: Company Data, Jefferies
Exhibit 3: Comparison of YoY EBITDA Growth Rates
*Outokumpu’s large 2015 EBITDA growth (~500%) due to low base in 2014 Source: Company Data, FactSet, Jefferies
0
500
1,000
1,500
2,000
2,500
3,000
3,500
4,000
4,500
Melting Shop Hot Rolling Cold Rolling
(000s t)
Acerinox Aperam Outokumpu
0%
20%
40%
60%
80%
100%
2007 2008 2009 2010 2011 2012 2013 2014E 2015E 2016E 2017E
Utilisation
Acerinox Aperam Outokumpu
-50%
0%
50%
100%
150%
200%
2014E 2015E 2016E 2017E
EBITDA Growth
Acerinox Aperam Outokumpu
Acerinox, Aperam and Outokumpu
are three of the largest stainless
steelmakers globally with collective
19% global market share and 79%
European market share. While
Outokumpu is in the process of
shuttering some Euro melt capacity,
Acerinox is considering an expansion
of its Asian operations.
Aperam has historically benefited
from the highest capacity utilisation
rates across the group. Outokumpu
should also benefit from rapidly
rising utilisation rates in the coming
two years as Euro restructuring
efforts are completed.
Coming off a very depressed base,
Outokumpu offers the highest
earnings growth outlook across the
group as restructuring efforts are
complete and US operations ramp-
up.
Across the sector, we forecast 112%
aggregate EBITDA growth from 2014
to 2017.
Natural Resources
Initiating Coverage
8 January 2015
page 6 of 91 , Equity Analyst, +44 (0) 20 7029 8772, [email protected] Rosenfeld, CFA
Please see important disclosure information on pages 88 - 91 of this report.

Exhibit 4: Historical EBITDA/tonne Comparison (2008-17E)
Source: Company Data, FactSet, Jefferies
Exhibit 5: Comparison of Medium-Term FCF Yields (2014-17E)
Source: Company Data, FactSet, Jefferies
(400)
(200)
0
200
400
2008 2009 2010 2011 2012 2013 2014E 2015E 2016E 2017E
(€/t)
Acerinox Aperam Outokumpu
-20%
-15%
-10%
-5%
0%
5%
10%
15%
20%
25%
2014E 2015E 2016E 2017E
FCF Yield
Acerinox Aperam Outokumpu
While Acerinox and Aperam have
historically had sector-leading
EBITDA/tonne margins, Outokumpu
may quickly catch-up with its peers
over the coming two years.
Aperam should continue to benefit
from very strong FCF yields moving
forward. Outokumpu, however,
should benefit from rapidly rising
FCF generation over the coming two
years, albeit from a very low base,
and may surpass Aperam by 2017.
Natural Resources
Initiating Coverage
8 January 2015
page 7 of 91 , Equity Analyst, +44 (0) 20 7029 8772, [email protected] Rosenfeld, CFA
Please see important disclosure information on pages 88 - 91 of this report.

Valuation 2014 proved to be a highly volatile year for the European stainless steel sector as initially
bullish sentiment on end-market demand and nickel price strength in H1 were quickly
replaced by macro instability and weak nickel prices through H2. While stainless
steelmaker equities are well off the highs reached in Q2, all three companies saw
impressive equity performance over the past year, raising the question of whether they
have further to go in 2015.
While equity share prices have appreciated over the past year, valuations remain roughly
stable across the Euro stainless steel sector as forward EV/EBITDA multiples averaged 8.1x
during the past 12 months. At present, stainless steelmakers average 6.7x forward
EV/EBITDA as share price strength has been offset by balance sheet deleveraging and
expectations for gradual earnings growth. Across our coverage universe, Aperam is by far
the least expensive and Acerinox is the most expensive, now appearing fully valued. While
Outokumpu appears expensive on 2015 multiples, the company’s rapid earnings growth
(from a low base) should lead to significantly lower valuation 2016+.
Exhibit 6: European Steel Comparable Valuations
*Weighted averages are based on market capitalisations **All estimates are based on calendar year although ThyssenKrupp and Voestalpine report on a fiscal year different from the calendar year ***All EV/EBITDA multiples are based on consolidated values Source: Company Data, FactSet, Jefferies estimates
Exhibit 7: Historical EV/EBITDA Stainless Steel Sector
Source: Bloomberg, FactSet, Company Data, Jefferies
Current Price Upside/ Current
Company Ticker Rating Price Target Downside 2014E 2015E 2016E 2014E 2015E 2016E Divi Yield P/NPV
Acerinox ACX SM Hold € 12.36 € 13.00 5% 23.0x 15.0x 12.6x 9.0x 7.8x 7.2x 3.6% 1.01x
Aperam APAM NA Buy € 23.95 € 30.00 25% 21.7x 11.4x 7.3x 5.2x 4.2x 3.0x 0.7% 0.79x
ArcelorMittal MT NA Buy € 8.67 € 13.00 50% 54.1x 13.4x 9.9x 4.9x 4.3x 3.9x 2.1% 0.57x
Evraz EVR LN Underperform 147p 100p -32% 31.9x 10.8x 9.1x 5.0x 4.9x 4.4x 0.0% 1.40x
Kloeckner & Co KCO GY Hold € 8.90 € 10.00 12% 31.7x 14.6x 10.6x 6.9x 5.5x 4.6x 2.2% 0.92x
Outokumpu OUT1V FH Buy € 4.64 € 6.00 29% N/A 45.2x 8.9x 39.4x 7.1x 4.7x 0.0% 0.64x
Salzgitter SZG GY Hold € 22.36 € 26.00 16% N/A 12.2x 7.3x 2.6x 1.9x 1.4x 0.9% 0.52x
SSAB SSABA SS Hold SEK 44.30 SEK 55.00 24% N/A 19.9x 10.3x 10.6x 7.6x 5.7x 0.0% 0.99x
ThyssenKrupp TKA GY Buy € 20.81 € 26.00 25% 34.4x 19.2x 15.9x 6.6x 4.6x 4.2x 0.5% 1.01x
Voestalpine VOE AV Buy € 31.53 € 37.00 17% 9.6x 8.9x 7.7x 5.5x 5.1x 4.6x 3.1% 0.82x
Weighted Average 27% 32.4x 15.8x 11.1x 7.4x 5.0x 4.3x 1.5% 0.83x
P/E EV/EBITDA
0.0x
10.0x
20.0x
30.0x
40.0x
50.0x
60.0x
70.0x
2010 2011 2012 2013 2014
Historical Current Historical Average
Despite strong equity performance
in 2014, the Euro stainless steel
sector remains attractively valued.
Across our coverage, Aperam is by
far the least expensive, while
Acerinox appears fully valued with a
premium valuation. Outokumpu
should benefit from rapid earnings
growth and a fall in valuation
multiples over the coming year.
While the Euro stainless steel sector
averaged 8.1x forward EV/EBITDA
throughout the course of 2014, the
sector is currently trading at 6.7x as
share price strength over the past
year has been offset by balance sheet
deleveraging and expectations for
gradual earnings growth.
Natural Resources
Initiating Coverage
8 January 2015
page 8 of 91 , Equity Analyst, +44 (0) 20 7029 8772, [email protected] Rosenfeld, CFA
Please see important disclosure information on pages 88 - 91 of this report.

Exhibit 8: Historical EV/EBITDA Carbon Steel Sector
Source: Bloomberg, FactSet, Company Data, Jefferies
Exhibit 9: Forecast EV/EBITDA Valuation (2013-17E)
*Years of negative multiples shown as zero, Outokumpu 2014E multiple (~50x) due to low base EBITDA Source: Company Data, FactSet, Jefferies
Exhibit 10: Forecast FCF Yield (2013-17E)
Source: Company Data, FactSet, Jefferies
0.0x
5.0x
10.0x
15.0x
20.0x
2005 2006 2007 2008 2009 2010 2011 2012 2013 2014
Historical Current Historical Average
0.0x
5.0x
10.0x
15.0x
20.0x
2013 2014E 2015E 2016E 2017E
EV/EBITDA
Acerinox Aperam Outokumpu
-20%
-15%
-10%
-5%
0%
5%
10%
15%
20%
25%
2013 2014E 2015E 2016E 2017E
FCF Yield
Acerinox Aperam Outokumpu
While Outokumpu has historically
traded at a significant valuation
premium to peers, the company’s
EV/EBITDA multiple is expected to
rapidly fall over the coming two
years, bringing it back in line with
peers.
Aperam is expected to continue to
be the least expensive stock in our
coverage universe, while Acerinox
should remain fully valued.
Aperam should continue to have
very strong FCF generation over the
coming years, but Outokumpu
should see the most rapid FCF
growth across the group, coming
from a very low base.
The carbon steel sector is currently
trading at a lower valuation than the
stainless sector, averaging 4.7x 2015
EV/EBITDA at present.
Natural Resources
Initiating Coverage
8 January 2015
page 9 of 91 , Equity Analyst, +44 (0) 20 7029 8772, [email protected] Rosenfeld, CFA
Please see important disclosure information on pages 88 - 91 of this report.

Exhibit 11: Forecast Net Debt/EBITDA (2013-17E)
*Years of negative multiples shown as zero Source: Company Data, FactSet, Jefferies
Exhibit 12: Historical Net Gearing (2013-17E)
Source: Company Data, FactSet, Jefferies
Exhibit 13: Historical Dividend Yield (2008-17E)
Source: Company Data, FactSet, Jefferies
0.0x
5.0x
10.0x
15.0x
20.0x
25.0x
2013 2014E 2015E 2016E 2017E
Net Debt/EBITDA
Acerinox Aperam Outokumpu
-50%
0%
50%
100%
150%
200%
2013 2014E 2015E 2016E 2017E
Net Gearing
Acerinox Aperam Outokumpu
0%
2%
4%
6%
8%
10%
12%
2008 2009 2010 2011 2012 2013 2014E 2015E 2016E 2017E
Divi Yield
Acerinox Aperam Outokumpu
As Outokumpu’s FCF generation
ramps up, we expect the company’s
balance sheet to rapidly de-lever,
reducing a key risk previously facing
the company.
Aperam benefits from the highest-
quality balance sheet in the group
with a consistent 20%-25% gearing
ratio in recent years. With continued
strong FCF generation expected, we
believe the company may turn net
cash over the coming two years.
Acerinox stands out as the only
consistent dividend payer in the
group. However, we believe Aperam
also has the potential to restart
dividend payments this year as the
company’s net debt targets are met.
Natural Resources
Initiating Coverage
8 January 2015
page 10 of 91 , Equity Analyst, +44 (0) 20 7029 8772, [email protected] Rosenfeld, CFA
Please see important disclosure information on pages 88 - 91 of this report.

Exhibit 14: Historical Return on Capital Employed (2008-17E)
Source: Company Data, FactSet, Jefferies
Exhibit 15: EBITDA Estimates vs Consensus
*Underlying EBITDA Source: Company Data, Bloomberg, Jefferies
Exhibit 16: Price Target Methodology
Source: FactSet, Jefferies
-20%
-15%
-10%
-5%
0%
5%
10%
15%
2008 2009 2010 2011 2012 2013 2014E 2015E 2016E 2017E
ROCE
Acerinox Aperam Outokumpu
Acerinox EBITDA Estimates (€m) 4Q14E 2014E 2015E 2016E
Jefferies 83 436 492 516
Consensus 86 435 515 562
% Difference -4% 0% -4% -8%
Aperam EBITDA Estimates (US$m) 4Q14E 2014E 2015E 2016E
Jefferies 102 532 579 687
Consensus 97 527 569 639
% Difference 5% 1% 2% 7%
Outokumpu EBITDA Estimates (€m) 4Q14E* 2014E* 2015E 2016E
Jefferies 53 213 525 728
Consensus 54 214 495 680
% Difference -3% -1% 6% 7%
Company 2014E 2015E Price Target
Acerinox 436 492 8.2x 4,035 3,425 € 13.09 € 13.00
Aperam 532 579 5.2x 3,011 2,793 € 30.03 € 30.00
Outokumpu 92 525 8.1x 4,255 2,501 € 6.01 € 6.00
EBITDA
Target Multiple Enterprise Value
Implied equity
value
Implied equity
value per share
Acerinox and Aperam stand out with
the strongest ROCE in the group.
Outokumpu should also see
significant growth in ROCE in the
coming two years as restructuring
measures are completed.
Natural Resources
Initiating Coverage
8 January 2015
page 11 of 91 , Equity Analyst, +44 (0) 20 7029 8772, [email protected] Rosenfeld, CFA
Please see important disclosure information on pages 88 - 91 of this report.

Euro Stainless Market Devopments While the stainless steel market makes up only a small proportion of global steel volumes,
the European stainless industry faces several unique dynamics that may help drive
improving pricing power and steelmaker margins over the coming years. The following
sections aim to discuss some of these factors including the prospect for domestic
European stainless steel demand improvement, the outlook for a potential slowdown in
global supply growth following years of rising Chinese exports, and lastly the prospects
for significant restructuring in the domestic European stainless steel industry that should
come to the fore in 2015-16.
Demand growth outlook – Steady she goes… Like carbon steel, stainless steel demand growth has been strongly correlated to GDP and
IP growth over recent decades. With stainless steel usage concentrated in the food and
beverage, chemicals and transport sectors, demand is tightly linked to industrial activity.
However, while stainless steel demand is heavily exposed to fixed asset investment and
various processing industries, unlike carbon steel, stainless steel has notably greater
exposure to early cycle consumer-led products including washing machines and
dishwashers, cutlery, and other kitchen equipment. In total, these consumer items,
together with medical end-markets, make up 45% of stainless steel demand globally.
Exhibit 17: Global Stainless Steel Consumption by End-Market
Source: Outokumpu, SMR, Jefferies
In addition, stainless steel is used in the “upgrading” of various end-market products from
white goods to infrastructure, providing more wear resistant, decorative and longer-life
qualities. As a result of this transition, stainless steel consumption has grown at a faster
pace than many other industrial commodities as stainless takes market share from carbon
steels and other alternative products. Remarkably, since 1950, global stainless steel
demand has seen a compound annual growth rate of 6%, bringing total consumption to
33mt in 2014. In addition, since 1980, global stainless steel demand has grown at over
twice the growth rate of carbon steel products.
Consumer Goods &
Medical, 45%
Chemical/
Petrochemical &
Energy, 17%
Automotive &
Heavy Transport,
11%
Infrastructure, 15%
Industrial & Heavy
Industry, 9%Others, 3%
The stainless steel sector stands out
due to its strong exposure to
consumer goods including cutlery,
white goods and medical products,
which together make up 45% of
global consumption.
Natural Resources
Initiating Coverage
8 January 2015
page 12 of 91 , Equity Analyst, +44 (0) 20 7029 8772, [email protected] Rosenfeld, CFA
Please see important disclosure information on pages 88 - 91 of this report.

Exhibit 18: Growth of Stainless Steel and Alternative Metals (CAGR, 1980-
2012)
Source: ISSF, Jefferies
While global stainless steel demand has continued to grow at a steady pace for many
years, on a regional basis the picture is somewhat more complex as rapid demand growth
in China since the global financial crisis has offset a much weaker demand outlook in
Europe and the US over this period.
In Europe, stainless steel demand fell by 30% from 2007 to a trough in 2009, rebounded
sharply in 2010 and more gradually thereafter. In 2013, European demand, however, still
remained 21% below 2007 levels. In the first nine months of 2014, European apparent
consumption of stainless steel grew by an impressive 7% YoY driven by a decent level of
underlying real demand growth and buoyed by significant customer restocking in
expectation of higher stainless prices driven by rising nickel spot prices. But, by year-end,
apparent demand growth stood at just 5% YoY as inventory destocking continued
through H2. Looking into 2015, we expect European stainless steel demand to grow at
3% YoY, a slightly higher rate than carbon steel demand reflecting the product’s more
balanced end-market exposures and our expectation of supportive nickel prices in the
year ahead.
In the US, stainless steel demand fell by 37% from 2007 to a trough in 2009 and has
rebounded quickly since then. In 2013, US demand was 15% above 2007 levels.
Subsequently, a demand recovery that began in 2013 has continued over the past year,
providing a relatively strong order backlog for US-based manufacturers, with lead times
reaching 12-14 weeks in Q3 2014. Notably, transport, energy and autos remain the
leading sectors for stainless steel demand in the US. Looking into 2015, we expect
stainless steel demand to grow at 4%, roughly in line with the forecast rate of carbon steel
demand growth.
While China is now firmly established as the key end market for stainless steel, making up
44% of global demand, we expect the pace of growth to slow considerably moving
forward, albeit from a much higher base. Stainless steel in China faces some positive
trends that differentiate the outlook from carbon steel, with positive correlation to rising
consumer demand as the national economy transitions away from being principally fixed
asset investment driven. However, with per capita consumption already at a high level,
we expect the pace of growth to normalise relative to historical levels, from an average
11% CAGR over the past four years to under 7% CAGR in the medium term.
2.3
2.6
2.5
3.5
2.6
5.6
Lead
Copper
Zinc
Aluminium
Carbon Steel
Stainless Steel
%
Partly as a result of stainless steel’s
balanced exposures across industrial
and consumer-related end-markets,
stainless demand has grown at a
much faster pace than other key
commodities over the past three
decades.
In Europe, we expect apparent
stainless steel demand to rise by 3%
in 2015, down from 5% in 2014 as a
result of a weaker macro backdrop
and more stable nickel prices.
In the US, we expect apparent
stainless steel demand to rise by 4%
in 2015, down from 6% in 2014 as a
stabilisation in autos demand is
offset by a pick-up in construction
and white goods.
After years of break-neck demand
growth, Chinese apparent stainless
steel demand growth is likely to slow
from an average 11% CAGR over the
past four years to under 7% CAGR in
the medium term.
Natural Resources
Initiating Coverage
8 January 2015
page 13 of 91 , Equity Analyst, +44 (0) 20 7029 8772, [email protected] Rosenfeld, CFA
Please see important disclosure information on pages 88 - 91 of this report.

Exhibit 19: Global Cold-Rolled Stainless Steel Demand
Source: CRU, Jefferies
Exhibit 20: Cold-Rolled Stainless Steel Demand Growth Rates
Source: CRU, Jefferies
Exhibit 21: Stainless Steel Demand per Capita (2013)
Source: SMR, ISSF, Outokumpu, World Bank, Eurostat
0
5
10
15
20
25
30
2006 2007 2008 2009 2010 2011 2012 2013 2014E 2015E 2016E 2017E 2018E 2019E
Mt
Western Europe USA Brazil China India Japan Other
-40%
-30%
-20%
-10%
0%
10%
20%
30%
40%
50%
2006 2008 2010 2012 2014E 2016E 2018E
Demand Growth
European Union United States Brazil China India Japan
0
2
4
6
8
10
12
Brazil US China Western Europe
(kg/capita)
China has been the predominant
driver of global stainless steel
demand growth over the past
decade, now making up 44% of
global demand.
While Brazilian stainless steel
demand growth has disappointed
over the past year, we see an
attractive medium-term demand
growth outlook in the region as
demand per capita remains well
below other emerging and
developed countries. Growth should
benefit from the “upgrading” of
various industrial and consumer
products in the coming years.
Natural Resources
Initiating Coverage
8 January 2015
page 14 of 91 , Equity Analyst, +44 (0) 20 7029 8772, [email protected] Rosenfeld, CFA
Please see important disclosure information on pages 88 - 91 of this report.

Exhibit 22: Correlation of Euro GDP Growth vs Cold-Rolled
Stainless Steel Demand Growth (2001-2013)
Source: IMF, Eurostat, CRU, Jefferies
Exhibit 23: Correlation of Euro IP vs Cold-Rolled Stainless
Steel Demand Growth (2001-2013)
Source: IMF, Eurostat, CRU, Jefferies
Exhibit 24: EU Composite PMI
Source: Markit, Jefferies
Exhibit 25: German New Orders
Source: Eurostat, Jefferies
Exhibit 26: European Economic Sentiment Indicator
Source: DG ECFIN, Jefferies
Exhibit 27: German Business Sentiment
Source: ifo, Jefferies
R² = 0.367
-30%
-20%
-10%
0%
10%
20%
30%
40%
-6% -4% -2% 0% 2% 4% 6%
Sta
inle
ss S
teel D
em
and
Gro
wth
GDP Growth
R² = 0.5156
-30%
-20%
-10%
0%
10%
20%
30%
40%
-15% -10% -5% 0% 5% 10%
Sta
inle
ss S
teel D
em
and
Gro
wth
Industrial Production Growth
30
35
40
45
50
55
60
65
Dec-09 Dec-10 Dec-11 Dec-12 Dec-13 Dec-14
Eurozone PMI Composite Output Index
-40
-30
-20
-10
0
10
20
30
40
Oct-09 Oct-10 Oct-11 Oct-12 Oct-13 Oct-14
Germany Manufacturing Orders YoY % Change (SA)
60
70
80
90
100
110
120
Nov-08 Nov-09 Nov-10 Nov-11 Nov-12 Nov-13 Nov-14
Germany Greece Italy
Spain France
80
85
90
95
100
105
110
115
120
Dec-09 Dec-10 Dec-11 Dec-12 Dec-13 Dec-14
Germany: ifo Business Climate Index (SA, 2005=100)
Natural Resources
Initiating Coverage
8 January 2015
page 15 of 91 , Equity Analyst, +44 (0) 20 7029 8772, [email protected] Rosenfeld, CFA
Please see important disclosure information on pages 88 - 91 of this report.

Exhibit 28: Acerinox Revenue by
Region (2013)
Source: Company Data, Jefferies
Exhibit 29: Aperam Revenue by Region
(2013)
Source: Company Data, Jefferies
Exhibit 30: Outokumpu Revenue by
Region (2013)
Source: Company Data, Jefferies
Spain
9%
Rest of
Europe
28%
Americas
49%
Africa
6%
Asia
8%
Other
0%
Brazil
23%
Other
Americas
8%
Germany
21%Italy
9%
France
8%
Other
Europe
23%
Asia &
Africa
8%
Finland
3%
Germany
24%
Sweden
3%
UK
7%
Other
Europe
29%
North
America
19%
Asia and
Australia
14%
Other
Countries
1%
Natural Resources
Initiating Coverage
8 January 2015
page 16 of 91 , Equity Analyst, +44 (0) 20 7029 8772, [email protected] Rosenfeld, CFA
Please see important disclosure information on pages 88 - 91 of this report.

Production growth – China still on the rise, but growth rate slowing As in the case of carbon steel, the stainless steel industry has drastically changed over the
past decade as Chinese production capacity expanded at a break-neck pace, growing to
become by far the world’s largest steel producer and a key source of export volumes to
meet global demand. As Chinese domestic steel production has risen, export volumes
have quickly grown and we have seen falling consolidation in global steelmaking
capacity, leading to lower utilisation rates, lower base prices and reduced margins for
European steelmakers.
Looking historically, global stainless steel production has grown at a relatively stable pace,
averaging a 6% CAGR from 1950 to 2014. And notably, since 2001, global production has
continued at the same 6% CAGR, overcoming the volatility of the global financial crisis.
However, the geographic mix of this growth has significantly changed as Chinese growth
skyrocketed at a 37% CAGR vs the rest of world at just 0.8% CAGR in this period. Chinese
stainless slab production rose from just 1.8mt in 2004 to 17.1mt in 2014, and moved
from just 9% to 51% of global production. At the same time, European stainless slab
production fell to just 5.3mt in 2013 from a peak of 7.6mt in 2006.
Exhibit 31: Stainless Steel Production - China vs. Rest of
World
Source: Wood Mackenzie, Jefferies
Exhibit 32: Carbon Steel Production - China vs. Rest of
World
Source: WSA, Jefferies
The rise of Chinese stainless steel production capacity has been largely driven by easy
availability of low-grade nickel ores from Indonesia, which Chinese steelmakers use to
produce nickel pig iron (NPI). As discussed in greater detail later in this report, NPI
historically provided Chinese steelmakers a considerable input cost advantage over
Western steelmakers that rely on a combination of stainless scrap and virgin raw materials
(chrome, nickel etc) to produce equivalent stainless steel products.
However, as last year’s Indonesian nickel ore export ban is gradually being felt, a tipping
point may soon be reached in China’s relative cost base for stainless steel production.
With access to NPI reduced and nickel prices elevated in the years ahead, we expect it will
be increasingly difficult for China to undercut global peers in the export market, and this
may lead to an absolute slowdown in Chinese production volumes. While China will
continue to sit on massive stainless steelmaking capacity, the country’s past reliance on
exports to boost domestic steelmaker margins may become increasingly challenging in
the year ahead.
As in the case of carbon steel, we remain cautious on the prospects for a “rationalisation”
of Chinese stainless steel production capacity, and risks remain that China will continue to
act as a spoiler of global steelmaker margins. Tellingly, even as NPI access dissipates,
Chinese steelmakers plan to grow domestic melt capacity by 16% YoY in 2015. However,
0
5
10
15
20
25
30
35
40
2000 2002 2004 2006 2008 2010 2012
Mt
Rest of World China
0
200
400
600
800
1,000
1,200
1,400
1,600
1,800
2000 2002 2004 2006 2008 2010 2012
Mt
Rest of World China
China has been the key driver of
global stainless steel production
growth over the past several
decades, now making up 51% of
global production.
The recently enacted Indonesian ore
export ban may serve to put
pressure on domestic Chinese
stainless steel production as
steelmakers’ historical input cost
advantage disappears. However,
with forecast 16% meltshop capacity
growth in the coming year, we fear
that Chinese steelmakers will still
chase after volumes and market
share at the expense of prices.
Natural Resources
Initiating Coverage
8 January 2015
page 17 of 91 , Equity Analyst, +44 (0) 20 7029 8772, [email protected] Rosenfeld, CFA
Please see important disclosure information on pages 88 - 91 of this report.

for the medium term we see a compelling catalyst for potential change in strategy in the
Chinese stainless steel market as margins are significantly impacted by nickel market
tightness.
Looking outside China into Western markets, production growth in these regions should
also remain relatively subdued in the years ahead. As demand gradually rebounds, we
predict that steel production in Europe and the Americas will grow in tandem, helping
push capacity utilisation rates back towards pre-crisis levels.
Importantly, however, incremental steelmaking capacity growth in Western markets
should be limited to null in the medium term. With demand still lacklustre and margins
well below historical levels, the returns on incremental greenfield investment are
insufficient to incentivise new production capacity. The returns on brownfield investments
(product quality upgrades, incremental volume growth, etc.) may prove more attractive,
but still be limited by stressed steelmaker balance sheets. In this environment, European
steelmakers should benefit as small rises in production drive an outsized impact on their
bottom lines.
Exhibit 33: Top 5 Stainless Producing Countries (2009)
Source: Wood Mackenzie, Jefferies
Exhibit 34: Top 5 Stainless Producing Countries (9M14)
Source: Wood Mackenzie, Jefferies
Exhibit 35: Global Stainless Slab Melting Capacity by Top Producers
Source: Company Data, Outokumpu, SMR, Jefferies
USA
12%
China
11%
Korea
11%
India
9%
Germany
8%
RoW
49%
China
50%
India
8%
Japan
8%
USA
6%
Korea
5%
Row
23%
Tisco, 10%
Outokumpu,
8%
Posco, 8%
Baosteel, 8%
Yusco, 7%
Acerinox, 6%Aperam, 4%
Other, 48%
Globally, the top five stainless
steelmakers make up 41% of slab
melting capacity.
Natural Resources
Initiating Coverage
8 January 2015
page 18 of 91 , Equity Analyst, +44 (0) 20 7029 8772, [email protected] Rosenfeld, CFA
Please see important disclosure information on pages 88 - 91 of this report.

European capacity utilisation rising The European stainless steel industry is in the midst of a dramatic restructuring process
brought about by consolidation and subsequent capacity closures. While Outokumpu has
clearly taken the lead, the industry as a whole has also proven supportive in recent years
with additional steps made by Aperam and ThyssenKrupp. As a result of these efforts, we
see potential for the domestic European stainless industry to emerge in 2015/16 with
stronger pricing discipline, higher achieved base prices and fixed cost leverage benefits.
The European turnaround story can largely be traced back to Outokumpu’s acquisition of
ThyssenKrupp’s stainless steel business Inoxum in 2012. The merger of Outokumpu and
Inoxum helped immediately improve consolidation within the domestic market as
Outokumpu’s meltshop market share rose from 28% to 44%. As domestic demand
remained poor during this period, consolidation on its own was a key positive for the
industry, improving pricing discipline among a group of producers that were all beset
with low capacity utilisation rates.
Exhibit 36: European Meltshop Capacity Pre-Inoxum Deal
Source: Company Data, Jefferies
Exhibit 37: European Meltshop Capacity Post-Inoxum Deal
Source: Company Data, Jefferies
Exhibit 38: European Meltshop Capacity Pre- and Post-Inoxum Deal
Source: Company Data, Jefferies
Interestingly, this degree of consolidation is far superior to that seen in the European
carbon steel market, where ArcelorMittal remains the dominant player with just 26%
market share across steel products, and no other steelmaker surpasses 10% market share.
In this environment, we have seen continued poor production and pricing discipline as
steelmakers compete on price to take market share and there remains insufficient
incentive to drive permanent capacity closures.
Outokumpu
27%
ThyssenKrupp
34%
Acerinox
12%
Aperam
24%
Industeel
3%
Outokumpu
44%
ThyssenKrupp
19%
Acerinox
13%
Aperam
21%
Industeel
3%
0
2
4
6
8
10
Pre-Inoxum Post-Inoxum
Mt
Outokumpu ThyssenKrupp Acerinox Aperam Industeel
Ongoing restructuring efforts in the
Euro stainless steel sector have
served to significantly improve
industry consolidation and should
also lead to a notable increase in
capacity utilisation rates. On our
estimates, capacity utilisation rates
should rise from <65% in 2014
towards 70% in 2016 and over 80%
by 2017.
Following Outokumpu’s acquisition
of Inoxum in 2012, Outokumpu’s
meltshop market share grew from
28% to 44% of the regional total,
leading to improved pricing
discipline.
Natural Resources
Initiating Coverage
8 January 2015
page 19 of 91 , Equity Analyst, +44 (0) 20 7029 8772, [email protected] Rosenfeld, CFA
Please see important disclosure information on pages 88 - 91 of this report.

While consolidation on its own was a step in the right direction for the European stainless
industry, the more dramatic steps were announced subsequent to merger as Outokumpu
set to remove 1.4mtpa of melting capacity, 1.3mtpa of hot-rolling capacity and 500ktpa
of cold-rolling capacity from its combined European operating base. Recognising that
rationalising melt shop capacity is the most significant step from a cost management
perspective, Outokumpu closed the Krefeld meltshop in December 2013, taking out
600ktpa of excess capacity, and has plans to close Bochum by mid-2015, taking out
another 800ktpa of capacity.
Looking specifically at melting, these steps served to reduce Outokumpu’s capacity by
40% and reduce total regional capacity by 16%. As a result of these efforts, even in a flat
demand environment, Outokumpu now expects to achieve melting capacity utilisation of
>90% and cold-rolling utilisation of >85%. 2015 should finally see the fruition of these
efforts for Outokumpu.
While Outokumpu has been the most aggressive in capacity closures, the company has
not been completely alone as both Aperam and ThyssenKrupp have also moved forward
with various efforts to remove excess capacity in recent years. In the case of Aperam, prior
to its spin-out from ArcelorMittal, its melt shops at Ardoise and Isbergues were closed,
removing 1.1mtpa of capacity. Subsequent to spin-out, in 2011, Aperam shut down some
of its upstream capacity at Genk (mothballing 400ktpa of capacity) and also permanently
shuttered some downstream capacity at Isbergues. In total, these efforts served to reduce
the number of tools/mills in operation from 29 to 17 and cut slab capacity by 1.5mtpa. As
a result, Aperam is currently operating at roughly 85%-90% capacity utilisation in Europe,
up significantly from the roughly 65% utilisation rate achieved prior to spin-out from
ArcelorMittal.
Lastly, ThyssenKrupp is the latest company to pursue further capacity closures in Europe
having announced in summer 2014 plans to cut capacity at Terni roughly in half. This
should remove 750ktpa of EAF melt shop capacity and provide management with
additional flexibility to slightly expand cold-rolling capacity through a capital efficient
brownfield investment programme.
In total, we have seen 2.5mt of meltshop capacity closed from the big four European
stainless steelmakers in recent years, equivalent to 30% of total original capacity. As a
result of these actions, capacity utilisation rates have increased significantly in the
European stainless steel market. Utilisation rates were as low as 54% in 2009, leading to a
severe fall in stainless base prices and significant contraction in steelmaker margins in the
following years. With roughly 30% of capacity removed, utilisation rates should increase
towards 70% by 2016 and over 80% by 2017. In this environment, upstream operations
should run efficiently, downstream rolling lines should remain sufficiently booked and
sales teams will not be pressured to compete on price in order to maximise sales volumes.
European meltshop closures have
been announced by Outokumpu,
Aperam and ThyssenKrupp in recent
years. In total, these steelmakers
plan to shutter 2.5mt of capacity,
equivalent to 30% of total original
capacity.
With roughly 30% of original
capacity removed, European
utilisation rates should increase
towards 70% by 2016 and over 80%
by 2017.
Natural Resources
Initiating Coverage
8 January 2015
page 20 of 91 , Equity Analyst, +44 (0) 20 7029 8772, [email protected] Rosenfeld, CFA
Please see important disclosure information on pages 88 - 91 of this report.

Exhibit 39: Expected Capacity Closures Among Leading European Producers
Source: Company Data, Jefferies
Exhibit 40: European Stainless Steel Slab Production and Capacity (2010-2019E) (kt)
Source: Company Data, CRU, Wood Mackenzie, ISSF, Jefferies
Company Plant Country Installations
Original
capacity
(ktpa)
Original
capacity
record date
Reduction in
capacity (ktpa) Reduction date Description
Outokumpu Krefeld Germany Melt shop 600 2012 600 Dec 2013 Complete closure
Outokumpu Bochum Germany Melt shop 800 2013 800 2015 Complete closure
Outokumpu Krefeld/Benrath Germany CR shop 660 2012 310 2015/2016 Transferring some cold-rolled production from
Benrath to Krefeld and closing Benrath thereafter
Outokumpu Dillenburg Germany CR shop 220 2012 70 2015 Partial closure of downstream capacity
Outokumpu Tornio Finland CR shop (AP line) NA NA 200 2014 Impact on Annealing & Pickling line
Aperam Isbergues France CR shop (HAP line 3, CR
mills 1/2, CAP line 2,
Skin pass mill)
350 2010 100 Jan 2011 Long-term suspension of traditional cold roll
mill resulting in decreased CR capacity
Aperam Gueugnon France CR shop (CR mill 2, BA
line 6, Skin pass mill 2)
400 2010
Aperam Genk Belgium CR shop (CR mill 4, CAP
line 1, Skin pass mill 2)
600 2010
Aperam Genk Belgium Melt shop (EAF1 and
VOD 1-2)
1,100 2011 400 Oct 2011 Mothballing of melt shop process prior to
continuous casting - final melt shop capacity
not reduced. This partial capacity closure was
aimed at increasing utilisation at Chatelet - the
company's most efficient facility.
ThyssenKrupp Terni Italy Melt shop 1,500 2014 750 Oct 2015 to Sep
2016
Plan to close one of two EAFs while increasing
investment in downstream CR lines
80 Jan 2011
Mothballing – not considered reduction in CR
capacity as the equipment can be put to work
on-demand
Company Country Plant 2010 2011 2012 2013 2014E 2015E 2016E 2017E 2018E 2019E
Capacity
Aperam
Aperam Belgium Chatelet 1,000 1,000 1,000 1,000 1,000 1,000 1,000 1,000 1,000 1,000
Aperam Belgium Genk 1,100 1,100 700 700 700 700 700 700 700 700
Aperam France Ardoise 0 0 0 0 0 0 0 0 0 0
Aperam France Isbergues 0 0 0 0 0 0 0 0 0 0
Outokumpu
Outokumpu Finland Tornio 1,600 1,600 1,600 1,450 1,450 1,450 1,450 1,450 1,450 1,450
Outokumpu Sweden Avesta 500 500 500 450 450 450 450 450 450 450
Outokumpu UK Sheffield 350 350 350 450 450 450 450 450 450 450
Outokumpu Germany Bochum 800 800 800 350 0 0 0 0
Outokumpu Germany Krefeld 600 400 0 0 0 0 0 0
Outokumpu Sweden Degerfors 0 0 0 0 0 0 0 0 0 0
Outokumpu Italy Terni 1,500
ThyssenKrupp
ThyssenKrupp Italy Terni 1,500 1,500 N/A 1,500 1,500 1,500 750 750 750 750
ThyssenKrupp Germany Bochum 800 800
ThyssenKrupp Germany Krefeld 600 600
Acerinox
Acerinox Europa Spain Palmones 1,067 1,067 1,067 1,067 1,067 1,067 1,067 1,067 1,067 1,067
Industeel
Industeel Belgium Charleroi 220 220 220 220 220 220 220 220 220 220
Total Capacity 8,737 8,737 8,337 8,037 7,637 7,187 6,087 6,087 6,087 6,087
Total Mothballed Capacity 400 400 400 400 400 400 400 400
Total Real Capacity 8,737 8,737 8,737 8,437 8,037 7,587 6,487 6,487 6,487 6,487
Western Europe Production 5,637 5,575 5,590 5,262 5,150 5,092 4,918 4,939 5,058 5,177
Functional Capacity Utilisation 65% 64% 64% 63% 64% 67% 68% 81% 83% 85%
Real Total Capacity Utilisation 65% 64% 64% 60% 61% 63% 65% 76% 78% 80%
Natural Resources
Initiating Coverage
8 January 2015
page 21 of 91 , Equity Analyst, +44 (0) 20 7029 8772, [email protected] Rosenfeld, CFA
Please see important disclosure information on pages 88 - 91 of this report.

Exhibit 41: Historical European Meltshop Capacity Utilisation
Source: Company Data, CRU, Wood Mackenzie, ISSF, Jefferies
Exhibit 42: Historical Meltshop Capacity Utilisation Rates - Big 3
Source: Company Data, Jefferies estimates
Exhibit 43: Historical Global Meltshop Capacity Utilisation
Source: CRU, Wood Mackenzie, ISSF, Jefferies
0%
20%
40%
60%
80%
100%
0
2
4
6
8
10
2001 2003 2005 2007 2009 2011 2013 2015E 2017E 2019E
(%)Mt
Production (LHS) Capacity (LHS) Capacity Utilisation (RHS)
0%
20%
40%
60%
80%
100%
2007 2008 2009 2010 2011 2012 2013 2014E 2015E 2016E 2017E
Utilisation
Acerinox Aperam Outokumpu
0%
20%
40%
60%
80%
100%
0
10
20
30
40
50
60
2004 2006 2008 2010 2012 2014E 2016E 2018E
(%)Mt
Production (LHS) Capacity (LHS) Capacity Utilisation (RHS)
While Aperam has historically
benefited from sector leading
capacity utilisation rates,
Outokumpu should see a rapid
increase in utilisation rates over the
coming two years as its European
operations are fully restructured.
While the European stainless
industry should benefit from a
significant improvement in capacity
utilisation rates in the coming two
years, the global industry will remain
beset by continued capacity growth
in China, weighing on global
utilisation rates and pricing
discipline.
With two major further meltshop
closures planned for 2015-16
(Bochum, Terni), regional capacity
utilisation rates should reach 80% in
2017.
Natural Resources
Initiating Coverage
8 January 2015
page 22 of 91 , Equity Analyst, +44 (0) 20 7029 8772, [email protected] Rosenfeld, CFA
Please see important disclosure information on pages 88 - 91 of this report.

Exhibit 44: Global Stainless Steel Production and Capacity (2010-2019E)
Source: CRU, Wood Mackenzie, ISSF, Jefferies
2010 2011 2012 2013 2014E 2015E 2016E 2017E 2018E 2019E
000s t
Melting Capacity
Western Europe 8,737 8,737 8,737 8,437 8,037 7,587 6,487 6,487 6,487 6,487
USA 3,401 3,401 3,457 4,132 4,301 4,301 4,301 4,301 4,301 4,301
Brazil 680 680 680 680 680 680 680 680 680 680
China 13,793 15,868 17,673 23,385 26,600 30,870 32,720 32,720 32,720 32,720
India 2,200 2,633 3,530 3,530 3,530 3,530 3,530 3,580 3,730 3,930
Japan 3,146 3,146 3,146 3,146 2,876 2,876 2,876 2,876 2,876 2,876
Other 4,901 4,901 4,901 5,201 5,201 5,201 5,201 5,201 5,201 5,201
World Total Melting Capacity 36,858 39,365 42,124 48,512 51,225 55,045 55,795 55,845 55,995 56,195
Slab Production
Western Europe 5,637 5,575 5,590 5,262 5,150 5,092 4,918 4,939 5,058 5,177
USA 1,570 1,907 2,000 2,323 2,456 2,551 2,648 2,745 2,839 2,930
Brazil 405 376 368 397 405 416 430 447 467 488
China 9,508 10,785 12,347 14,946 15,939 17,069 18,237 19,446 20,695 22,006
India 1,672 1,781 1,941 2,104 2,258 2,416 2,603 2,810 3,018 3,241
Japan 2,671 2,490 2,395 2,409 2,491 2,532 2,574 2,621 2,670 2,724
Other 5,216 3,475 3,497 3,294 3,819 4,194 4,589 4,822 4,998 5,189
World Total Slab Production 26,680 26,389 28,138 30,736 32,518 34,269 36,000 37,831 39,744 41,755
Slab Production Growth
Western Europe 20% -1% 0% -6% -2% -1% -3% 0% 2% 2%
USA 19% 21% 5% 16% 6% 4% 4% 4% 3% 3%
Brazil 21% -7% -2% 8% 2% 3% 3% 4% 4% 5%
China 30% 13% 14% 21% 7% 7% 7% 7% 6% 6%
India 6% 7% 9% 8% 7% 7% 8% 8% 7% 7%
Japan 30% -7% -4% 1% 3% 2% 2% 2% 2% 2%
Other 51% -33% 1% -6% 16% 10% 9% 5% 4% 4%
World Total Slab Production 29% -1% 7% 9% 6% 5% 5% 5% 5% 5%
Global Capacity Utilisation 72% 67% 67% 63% 63% 62% 65% 68% 71% 74%
Global Capacity Utilisation (1-Yr lag) 76% 72% 71% 73% 67% 67% 65% 68% 71% 75%
Production - CR Sheet
Western Europe 3,155 3,198 3,115 2,995 3,144 3,227 3,304 3,383 3,463 3,545
USA 1,006 1,265 1,342 1,581 1,671 1,736 1,801 1,868 1,932 1,994
Brazil 278 262 261 280 286 294 304 316 330 345
China 6,302 6,752 7,791 9,296 9,914 10,617 11,343 12,096 12,873 13,688
India 1,217 1,285 1,379 1,472 1,579 1,690 1,821 1,966 2,111 2,267
Japan 1,550 1,448 1,374 1,398 1,445 1,469 1,494 1,521 1,549 1,580
Other 3,203 3,198 3,305 3,490 3,662 3,838 3,958 4,098 4,267 4,448
World Total CR Sheet Production 16,710 17,408 18,567 20,512 21,701 22,870 24,025 25,248 26,524 27,866
Apparent Consumption - CR Sheet
Western Europe 2,868 2,886 2,715 2,646 2,778 2,851 2,919 2,989 3,060 3,132
USA 1,020 1,270 1,296 1,482 1,567 1,628 1,689 1,752 1,811 1,869
Brazil 300 265 286 302 308 316 327 340 355 371
China 6,251 6,565 7,545 8,775 9,358 10,021 10,707 11,417 12,150 12,920
India 1,350 1,413 1,522 1,606 1,724 1,844 1,987 2,145 2,304 2,474
Japan 1,137 1,067 1,045 1,101 1,138 1,157 1,177 1,198 1,220 1,245
Other 3,677 3,747 3,994 4,413 4,631 4,845 5,000 5,177 5,383 5,602
World Total CR Sheet Apparent Consumption 16,603 17,214 18,404 20,326 21,504 22,663 23,807 25,019 26,284 27,614
Implied Net Export / (Import) - CR Sheet
Western Europe 287 312 400 349 366 376 385 394 404 413
USA (13) (5) 46 98 104 108 112 116 120 124
Brazil (23) (3) (25) (22) (22) (23) (23) (24) (25) (27)
China 51 187 246 522 556 596 636 679 722 768
India (133) (128) (143) (135) (144) (155) (167) (180) (193) (207)
Japan 413 381 329 296 306 312 317 323 329 335
Natural Resources
Initiating Coverage
8 January 2015
page 23 of 91 , Equity Analyst, +44 (0) 20 7029 8772, [email protected] Rosenfeld, CFA
Please see important disclosure information on pages 88 - 91 of this report.

Stainless Steel Price Drivers Unlike carbon steels, stainless steel prices are derived through a combination of two
components – the base price and alloys surcharge. Base prices are negotiated between
steelmakers and customers, and generally reflect a combination of local supply/demand
balance and regional capacity utilisation rates. Alloys surcharges, on the other hand, are
meant to directly reflect movements in spot prices for key alloy materials including nickel,
chrome and moly (though note that nickel generally makes up roughly 60% of total raw
materials cost base). While nickel is principally used in austenitic grades and is not used in
ferritic grades, it remains a key driver for benchmark stainless transaction prices across the
industry.
In Europe, the weak demand and capacity utilisation situation can be clearly seen in the
historical deterioration of base prices, which have fallen from an average of €1,390/tonne
in the years before the global financial crisis 2000-2007 to average just €1,066/t in 2009-
13 and trough below €1,000/t in 2H13. European base prices finished 2014 €65/t higher
than 2013-trough levels, reflecting a gradual improvement in capacity utilisation rates,
decent real demand growth and restocking activity in H1 driven by rising nickel prices.
Exhibit 45: N. European Stainless Steel Pricing Structure
Source: Platts, Jefferies
Exhibit 46: US Stainless Steel Pricing Structure
Source: Platts, Jefferies
Exhibit 47: Stainless Steel Input Costs
Source: Outokumpu, Jefferies
From a theoretical level, nickel prices should not drive profitability for steelmakers as the
cost is passed through to customers via the alloy surcharge system. However, while base
prices should ostensibly be the sole diver of steelmaker profits, the price of nickel is crucial
0
1,000
2,000
3,000
4,000
Dec-07 Dec-08 Dec-09 Dec-10 Dec-11 Dec-12 Dec-13 Dec-14
€/t
Base Surcharge
0
1,000
2,000
3,000
4,000
5,000
6,000
Dec-07 Dec-08 Dec-09 Dec-10 Dec-11 Dec-12 Dec-13 Dec-14
US$/t
Base Surcharge
Raw Material -
Nickel
36%
Raw Material -
Other
24%
Energy & Other
Consumables
12%
Personnel
10%
Freight,
Maintenance,
Rent/Leases, SG&A,
D&A
7%
Other
11%
Over the coming years, we expect
stainless steel prices to rise as a
tightening global nickel market leads
to higher alloys surcharges and as
improved capacity utilisation rates
lead to higher base prices.
Nickel is the single largest input cost
in stainless steelmaking, making up
roughly 60% of the total raw
materials input cost base.
Natural Resources
Initiating Coverage
8 January 2015
page 24 of 91 , Equity Analyst, +44 (0) 20 7029 8772, [email protected] Rosenfeld, CFA
Please see important disclosure information on pages 88 - 91 of this report.

for the profitability of the European stainless steel industry due to the somewhat circular
relationship between nickel prices, alloys surcharges, base prices and steelmaker margins.
Historically, as nickel prices rise and customers await an increase in alloys surcharges, we
often see a restocking cycle take effect as customers try to build inventories ahead of a rise
in surcharges. As a result, this restocking can positively lead to higher utilisation rates,
which can in turn drive stronger base prices. Of course, the flip side of this argument is
that during periods of weakening nickel prices, customers are then in a position to
destock existing inventories in expectation of lower alloy premiums available in the future.
Indeed, as nickel prices weakened in 2H14, this situation was magnified for stainless
steelmakers as customers largely stepped out of the market, reversing a period of double-
digit apparent demand growth in the first half of the year.
Exhibit 48: Historical European Stainless Steel Inventory Cycle, 2008-2014
Source: Aperam, SBB, Eurofer
Due to these various factors, there is a crucial cycle of higher nickel prices, expectation of
higher alloys surcharges, customer restocking, higher utilisation rates, and higher base
prices. In this environment, while steelmaker profitability should be driven exclusively by
base prices and not by movements in alloys prices, there has been a notable positive
correlation historically between nickel prices and stainless base prices. As we expect the
nickel market to gradually tighten through the course of 2015 and achieve multi-year
highs in 2016-17, we are positive on the medium-term outlook for European stainless
steel prices.
Exhibit 49: Summary of North European Stainless Steel and Nickel Prices (2010-17E)
Source: Platts, Jefferies
2010 2011 2012 2013 2014 1Q15E 2Q15E 3Q15E 4Q15E 2015E 2016E 2017E
Base (€/t) 1,135 1,085 1,046 996 1,032 1,050 1,050 1,075 1,075 1,063 1,100 1,150
Surcharge (€/t) 1,516 1,682 1,388 1,161 1,262 1,328 1,331 1,358 1,414 1,358 1,435 1,506
Transaction (€/t) 2,652 2,767 2,434 2,157 2,293 2,378 2,381 2,433 2,489 2,420 2,535 2,656
Nickel (US$/t) 21,827 22,905 17,533 15,045 16,885 16,000 16,000 17,000 17,000 16,500 18,000 19,000
Nickel (US$/lb) 9.90 10.39 7.95 6.82 7.66 7.26 7.26 7.71 7.71 7.48 8.16 8.62
While nickel prices are hypothetically
directly passed on to consumers
through the alloys surcharge
mechanism, rising nickel prices can
lead to an attractive cycle of
customer restocking, higher
steelmaker utilisation rates and
improved base prices.
As nickel prices gradually tighten
over the coming two years and as
Euro meltshop capacity utilisation
rates rise, we expect European
stainless steel prices to increase.
Natural Resources
Initiating Coverage
8 January 2015
page 25 of 91 , Equity Analyst, +44 (0) 20 7029 8772, [email protected] Rosenfeld, CFA
Please see important disclosure information on pages 88 - 91 of this report.

Exhibit 50: Correlation of Nickel vs Northern Europe Base Price (2004-2014)
Source: Platts, Jefferies
Exhibit 51: Correlation of Euro Utilisation Rate vs Northern Europe Base Price
(2000-2013)
Source: Platts, Wood Mackenzie, CRU, ISSF, Jefferies
Correlation = 0.4753
R² = 0.2259
600
800
1,000
1,200
1,400
1,600
1,800
2,000
0 5,000 10,000 15,000 20,000 25,000 30,000 35,000 40,000 45,000N
ort
hern
Eu
rop
e B
ase P
rice
(€
/t)
Nickel (€/t)
Correlation = 0.8524
R² = 0.7265
0
200
400
600
800
1,000
1,200
1,400
1,600
1,800
40% 50% 60% 70% 80% 90% 100%
N.
Euro
pe B
ase P
rice
(€
/t)
Europe Capacity Utilisation (%)
Despite being hypothetically
unrelated, there is a strong
correlation between nickel prices
and stainless base prices…
…and there is an even stronger
correlation between meltshop
utilisation rates and base prices. As
restructuring measures continue
over the coming two years, we
expect steelmakers to be able to
negotiate gradually higher base
prices.
Natural Resources
Initiating Coverage
8 January 2015
page 26 of 91 , Equity Analyst, +44 (0) 20 7029 8772, [email protected] Rosenfeld, CFA
Please see important disclosure information on pages 88 - 91 of this report.

Exhibit 52: Acerinox Share Price Correlation to Nickel Price (2011-2014)
Source: Bloomberg, Jefferies
Exhibit 53: Aperam Share Price Correlation to Nickel Price (2011-2014)
Source: Bloomberg, Jefferies
Exhibit 54: Outokumpu Share Price Correlation to Nickel Price (2011-2014)
Source: Bloomberg, Jefferies
Correlation = 0.6495
R² = 0.4219
0
2
4
6
8
10
12
14
16
0 5,000 10,000 15,000 20,000 25,000 30,000 35,000A
ceri
no
x S
har
e P
rice
(€
)
Nickel Price (US$/t)
Correlation = 0.6439
R² = 0.4146
0
5
10
15
20
25
30
35
0 5,000 10,000 15,000 20,000 25,000 30,000 35,000
Ap
era
m S
har
e P
rice
(€
)
Nickel Price (US$/t)
Correlation = 0.9377
R² = 0.8782
0
5
10
15
20
25
30
35
0 5,000 10,000 15,000 20,000 25,000 30,000 35,000
Ou
toku
mp
u S
har
e P
rice
(€
)
Nickel Price (US$/t)
While there are many unique
company-specific drivers to the
Acerinox, Aperam and Outokumpu
investment cases, all three equities
have historically been very highly
correlated to the nickel price.
Outokumpu notably has the highest
correlation to the nickel price.
Natural Resources
Initiating Coverage
8 January 2015
page 27 of 91 , Equity Analyst, +44 (0) 20 7029 8772, [email protected] Rosenfeld, CFA
Please see important disclosure information on pages 88 - 91 of this report.

Nickel tightness expected in 2016-17 While the nickel price has long proven highly volatile, we expect the market to gradually
tighten through the course of 2015 and hit multi-year highs in 2016-17 as the impact of
the Indonesian export ban is fully felt. Key to the nickel market balance is the fate of
Chinese NPI production. Based on our analysis, a contraction in NPI production is
inevitable and we forecast a 17% drop in 2015 to 370kt, based on the assumption that
Chinese port ore stocks will be largely depleted by mid-year (providing enough ore to
produce 70kt of NPI) and that Filipino ore exports remain roughly stable YoY (providing
enough ore to produce 300kt of NPI). However, there is a huge lack of visibility on these
factors, and we believe that these uncertainties, combined with high LME stocks and risks
from slower Chinese growth, will temper rallies in the near term. But, with the market on
track to move into big deficits in 2016+ there is still significant nickel price upside from
current levels, and this could be priced into Euro stainless steelmaker equities in the
coming year.
The Indonesian export ban on unprocessed ores, enacted at the beginning of 2014,
served to effectively reverse a multi-year trend of quickly rising Indonesian nickel supply.
Indonesian nickel exports rose rapidly since 2010, peaking at over 30% of global supply in
2013, largely in the form of low grade nickel ores that were used by Chinese steelmakers
to produce nickel pig iron (NPI). Access to this low cost NPI gave Chinese steelmakers a
decided input cost advantage over global peers, helped support the rapid ramp-up of
domestic stainless steelmaking capacity and led to a massive surge in stainless exports
from China into western markets.
However, the removal of Indonesian nickel supply from the global market should serve to
significantly tighten the supply/demand balance and help push prices higher in the years
ahead. Surprising many, 2014 proved to be a year of two halves in the nickel market as
early expectations of supply shortfalls and aggressive customer restocking in H1 were
ultimately stalled by the unexpected growth of nickel ore exports from the Philippines,
which largely replaced lost Indonesian supply. However, these Filipino ores are lower
grade than Indonesian ores (1.4%-1.5% vs 1.8%-1.9% on average) and therefore already
ate into the Chinese steelmakers’ historical input cost advantage.
Moving forward, the three key uncertainties in the nickel market are the degree to which
Filipino exports can continue to replace lost Indonesian volumes, at what point Chinese
inventories of nickel ores are fully drawn down and when we should expect new blast
furnace NPI capacity within Indonesia to be finally ramped-up.
Exhibit 55: Chinese Imports of Nickel Ore (Mt) from Philippines and Indonesia
and % of Total Nickel Imports
Source: Bloomberg, Jefferies
First, looking at Filipino supply, total nickel production rose by 70% in 2014 equating to
nearly 20% of global mined nickel supply over the course of the year. This ramp-up was
60%
65%
70%
75%
80%
85%
90%
95%
100%
0.0
1.0
2.0
3.0
4.0
5.0
6.0
7.0
8.0
2008 2009 2010 2011 2012 2013 2014
(%)Mt
Philippines Indonesia % of Nickel Imports
Nickel analysis compiled in
conjunction with Jefferies Bache
commodities strategist Gayle Berry.
The recently implemented
Indonesian ore export ban should
lead to a significantly tighter nickel
market in the years ahead as Chinese
nickel inventories are drawn down
and Filipino nickel export growth
slows. While 2015 is likely to be a
year of transition as low nickel
supply is partly offset by USD-
strength and weak demand, 2016-17
may see significantly higher nickel
prices.
The Indonesian ore export ban led to
a near complete collapse in
Indonesian nickel ore exports over
the past year. However, these
volumes were largely replaced by
exports from the Philippines, helping
temporarily stabilise the domestic
Chinese NPI market.
Natural Resources
Initiating Coverage
8 January 2015
page 28 of 91 , Equity Analyst, +44 (0) 20 7029 8772, [email protected] Rosenfeld, CFA
Please see important disclosure information on pages 88 - 91 of this report.

made possible partly by the existence of non-traditional iron ore mines in the country,
which were brought online in recent years of high iron ore prices, and were therefore
available to transition towards mining combined ferrous nickel ores over the past year.
However, we expect Filipino volume growths to slow in 2015 as high-graded domestic
mines are run dry and domestic inventories are drawn down.
Second, looking at Chinese nickel ore inventories, we estimate that Chinese port stocks of
nickel ore are sufficient to fuel NPI production roughly through the first quarter of 2015.
However, these inventories are increasingly weighted towards lower grade volumes,
which should increase input costs for NPI producers. Also, as volumes are reduced, NPI
producers will be forced to rely more heavily on low-grade Filipino nickel ore imports or
ultimately reduce NPI production.
Exhibit 56: Chinese Inventories of Nickel Ore - Mid and High Grade (kt)
Source: Glencore Investor Day Presentation, December 2014
Lastly, looking at Indonesian NPI production capacity, as of mid-2014 there were seven
projects totalling 140ktpa of capacity slated to begin production in 2015. However, it has
become clear in recent months that only one of these projects is still likely to come online
in the coming year – the 30ktpa Tsingshan/Bintang Delapan JV. Other projects, while still
ostensibly under development, have been pushed out to 2016 and beyond. As a result,
we believe that the upcoming period of nickel market tightness may actually extend into
2017. While it is realistic to assume that a portion of this production is realised, there is a
high degree of uncertainty not least because of issues such as permitting, infrastructure,
finance and technical challenges.
As the supply of Filipino nickel ore stagnates and domestic Chinese inventories are drawn
down in the year ahead, Chinese NPI production should be strangled by a lack of raw
materials feed. This should lead to a decided tightening of the global nickel
supply/demand balance and higher prices beginning in 2H15 and continuing into 2016-
17. For European stainless steelmakers, we expect these higher nickel prices to lead to
strong customer demand ahead of restocking cycles, higher base prices and improved
steelmaker margins.
While Chinese steelmakers prepared
for the implementation of the
Indonesian ore export ban by
building up significant nickel
inventories in late 2013, these
inventories have been slowly drawn
down over the past year. By 2Q15,
we expect Chinese nickel ore
inventories, particularly inventories
of high grade ores, to be largely
depleted.
Natural Resources
Initiating Coverage
8 January 2015
page 29 of 91 , Equity Analyst, +44 (0) 20 7029 8772, [email protected] Rosenfeld, CFA
Please see important disclosure information on pages 88 - 91 of this report.
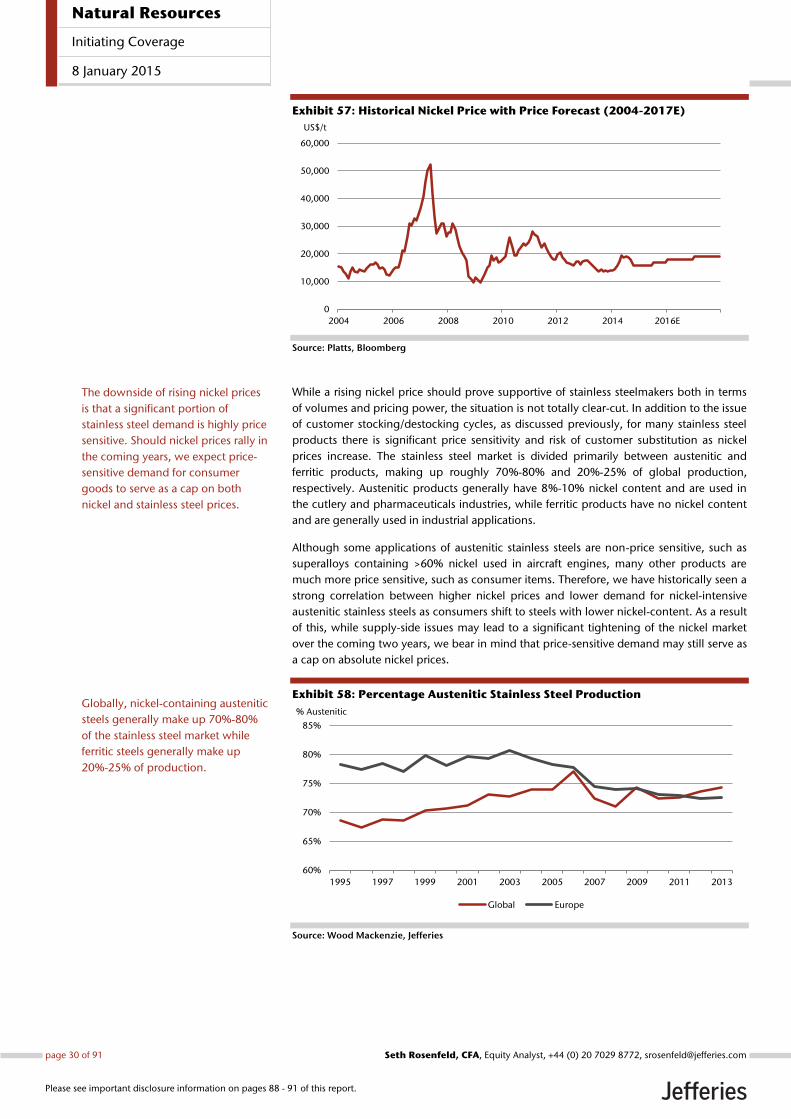
Exhibit 57: Historical Nickel Price with Price Forecast (2004-2017E)
Source: Platts, Bloomberg
While a rising nickel price should prove supportive of stainless steelmakers both in terms
of volumes and pricing power, the situation is not totally clear-cut. In addition to the issue
of customer stocking/destocking cycles, as discussed previously, for many stainless steel
products there is significant price sensitivity and risk of customer substitution as nickel
prices increase. The stainless steel market is divided primarily between austenitic and
ferritic products, making up roughly 70%-80% and 20%-25% of global production,
respectively. Austenitic products generally have 8%-10% nickel content and are used in
the cutlery and pharmaceuticals industries, while ferritic products have no nickel content
and are generally used in industrial applications.
Although some applications of austenitic stainless steels are non-price sensitive, such as
superalloys containing >60% nickel used in aircraft engines, many other products are
much more price sensitive, such as consumer items. Therefore, we have historically seen a
strong correlation between higher nickel prices and lower demand for nickel-intensive
austenitic stainless steels as consumers shift to steels with lower nickel-content. As a result
of this, while supply-side issues may lead to a significant tightening of the nickel market
over the coming two years, we bear in mind that price-sensitive demand may still serve as
a cap on absolute nickel prices.
Exhibit 58: Percentage Austenitic Stainless Steel Production
Source: Wood Mackenzie, Jefferies
0
10,000
20,000
30,000
40,000
50,000
60,000
2004 2006 2008 2010 2012 2014 2016E
US$/t
60%
65%
70%
75%
80%
85%
1995 1997 1999 2001 2003 2005 2007 2009 2011 2013
% Austenitic
Global Europe
The downside of rising nickel prices
is that a significant portion of
stainless steel demand is highly price
sensitive. Should nickel prices rally in
the coming years, we expect price-
sensitive demand for consumer
goods to serve as a cap on both
nickel and stainless steel prices.
Globally, nickel-containing austenitic
steels generally make up 70%-80%
of the stainless steel market while
ferritic steels generally make up
20%-25% of production.
Natural Resources
Initiating Coverage
8 January 2015
page 30 of 91 , Equity Analyst, +44 (0) 20 7029 8772, [email protected] Rosenfeld, CFA
Please see important disclosure information on pages 88 - 91 of this report.

Exhibit 59: Correlation of Nickel Price vs % Nickel Content (1995-2013)
Source: Wood Mackenzie, Jefferies
Exhibit 60: Acerinox Production Split
by Product
Source: Company Data, Jefferies
Exhibit 61: Aperam Production Split by
Product
Source: Company Data, Jefferies
Exhibit 62: Outokumpu Production
Split by Product
Source: Company Data, Jefferies
Correlation = -0.6309
R² = 0.3981
0%
2%
4%
6%
8%
10%
$0 $5,000 $10,000 $15,000 $20,000 $25,000 $30,000 $35,000 $40,000N
icke
l C
on
ten
t (%
)
LME Nickel Price (US$/t)
Austenitic
65%
Ferritic
35%
Austenitic
65%
Ferritic
35%
Austenitic
(CrNi)
58%
Austenitic
(CrNiMo)
17%
Ferritic
19%
Duplex
3%
Other
3%
Historically, as nickel prices have
rallied, the average nickel content of
global stainless steel production has
reduced considerably. This price-
sensitive demand can serve as a cap
on nickel prices, even in an
environment of supply-side driven
tightness.
Natural Resources
Initiating Coverage
8 January 2015
page 31 of 91 , Equity Analyst, +44 (0) 20 7029 8772, [email protected] Rosenfeld, CFA
Please see important disclosure information on pages 88 - 91 of this report.

Exhibit 63: Jefferies Refined Nickel Market Balance
Source: Wood Mackenzie, Bloomberg, Jefferies Metals Strategy
Exhibit 64: Top 10 Mine Capacity Additions
Source: Wood Mackenzie, Jefferies Metals Strategy
Kt 2011 2012 2013 2014E 2015F 2016F
Global Refined Production 1,646 1,763 2,002 1,979 1,976 2,004
Global NPI 267 307 499 448 370 300
China 454 513 734 698 610 600
Russia 266 256 245 236 250 190
Global Refined Consumption 1,611 1,684 1,825 1,935 2,015 2,092
China 712 771 919 979 1,037 1,100
USA 130 138 141 150 158 162
Europe 353 351 346 359 363 363
Global Balance 35 79 177 45 -40 -88
Total Implied Stocks 317 396 573 618 578 490
Stocks to Consumption Ratio (weeks) 10.2 12.2 16.3 16.6 14.9 12.2
LME Nickel Price (US$/t) 22,905 17,533 15,045 16,885 16,500 18,000
Total Refined Production Growth 12.4% 7.1% 13.5% -1.1% -0.2% 1.4%
Total Refined Consumption Growth 7.1% 4.5% 8.4% 6.0% 4.2% 3.8%
China Refined Production Growth 31.1% 12.8% 43.2% -4.9% -12.6% -1.6%
China Refined Consumption Growth 22.4% 8.4% 19.1% 6.5% 6.0% 6.0%
Smelter Country Net Change in Capacity (Kt) 2013 2014 2015 2016
Ambatovy Madagascar 30 29 42 55 60
Koniambo New Caledonia 28 13 14 28 41
Taganito Philippines 26 5 25 30 32
Eagle USA 26 0 3 22 26
Onca-Puma Brazil 21 6 22 24 27
Tagaung Taung Myanmar 17 1 11 17 18
Fenix Guatemala 17 0 2 9 17
Soroaka Indonesia 15 84 88 97 99
Ramu P. New Guinea 11 14 21 27 25
Codemin (Niquelandia) Brazil 11 0 10 11 11
Natural Resources
Initiating Coverage
8 January 2015
page 32 of 91 , Equity Analyst, +44 (0) 20 7029 8772, [email protected] Rosenfeld, CFA
Please see important disclosure information on pages 88 - 91 of this report.

Chinese cost competitiveness waning The Chinese stainless steel market has developed rapidly over the past decade, taking
advantage of low cost Indonesian nickel ores and domestic nickel pig iron (NPI)
production capacity to produce finished stainless steel products at a much lower cost than
international competitors. Chinese steelmakers’ cost advantage comes principally from
the fact that in the purchase of Indonesian nickel ores, the contained iron ore and chrome
content is essentially supplied for “free.” As a result, Chinese steelmakers maximising their
use of NPI have a significant input cost advantage over a comparable European mill using
stainless scrap, as seen below.
Exhibit 65: Chinese Melting Cost Advantage vs Euro Mills
Source: CRU, OE, Jefferies
Chinese steelmakers’ input cost advantage widened notably in recent years as the
domestic steel industry improved its own processing capacity for NPI. As Chinese NPI
capacity increased roughly five-fold since 2008, the country’s NPI production cost base
has moved even further down the cost curve through the development of new rotary kiln
electric furnaces (RKEF), now making up well over half of domestic Chinese production
capacity. RKEF-based NPI production costs roughly $16,000/t versus EAF-based NPI
production costs of roughly $18,500/t. With the added benefits of low-cost Indonesian
ores, Chinese NPI production may cost as low as $15,000/t.
Exhibit 66: Nickel Pig Iron Cost Curve (US$/t)
Source: Aperam, SBB *NPI = Nickel Pig Iron; BF= Blast Furnace; EAF = Electric Arc Furnace; RKEF = Rotary Kiln Electric Furnace
Exhibit 67: Nickel Pig Iron Production by Process (000s t)
Source: Aperam, Eramet, SBB
0%
5%
10%
15%
20%
25%(400)
(350)
(300)
(250)
(200)
(150)
(100)
(50)
0
Feb
-13
Mar-
13
Ap
r-1
3
May-
13
Jun
-13
Jul-
13
Au
g-1
3
Sep
-13
Oct
-13
No
v-1
3
Dec-
13
Jan
-14
Feb
-14
Mar-
14
Ap
r-1
4
May-
14
Jun
-14
Jul-
14
Au
g-1
4
Sep
-14
Oct
-14
No
v-1
4
Dec-
14
(%)(US$/t)
China - Europe Differential (RHS) China Discount to Europe (RHS)
Chinese steelmakers have historically
benefited from a significant input
cost advantage over Western peers
given Chinese consumption of NPI
using Indonesian nickel ores, which
comes with “free” iron ore and
chrome content.
Chinese steelmakers’ melting cost
advantage rose in recent years
through the development of low-
cost RKEF-based NPI production
capacity. While the cost advantage
has begun to fall in recent months, it
still remains considerable at nearly
$100/t in December. Looking
forward, we expect this cost
advantage to close as NPI production
costs rise in 2015-17.
Natural Resources
Initiating Coverage
8 January 2015
page 33 of 91 , Equity Analyst, +44 (0) 20 7029 8772, [email protected] Rosenfeld, CFA
Please see important disclosure information on pages 88 - 91 of this report.

Exhibit 68: Chinese NPI as Proportion of Total Nickel Consumption
Source: Wood Mackenzie, Jefferies
However, the Indonesian nickel export ban that was enacted at the beginning of 2014
should over time have a significant impact on the domestic Chinese stainless steel
industry. As a result of the export ban, Indonesia can no longer export unprocessed
products, such as raw nickel ores, significantly driving up the production cost of Chinese
NPI in addition to the NPI spot price in the global market. As seen in the exhibit above, the
raw materials cost differential between a Chinese stainless steelmaker using NPI and a
European mill using stainless scrap peaked in May 2014 and has trended down in recent
months, though it notably has not totally disappeared. Looking forward, as access to NPI
dries up, Chinese steelmakers will need to shift to other raw materials inputs including
stainless scrap, FeNi and stainless cathode, much of which will need to be imported and
will prove more expensive than historical NPI production.
While investors and analysts started 2014 with a very bullish view for the impact of this
export ban on global NPI and nickel prices, the year turned out to be one of two halves. In
the first half, largely investment-driven interests pushed the nickel price to multi-year
highs, hitting a peak of $20,995/t. However, the market remained fairly loose as the
Chinese had built significant inventories of NPI ores in expectation of the implementation
of the export ban.
In addition, as nickel prices strengthened, Filipino nickel exports also quickly rose. These
Filipino ores are significantly lower grade than Indonesian nickel ores, and as a result are
significantly more expensive to process into NPI and provide less nickel on a grade
equivalent basis. Net-net, Filipino ore should help temporarily cushion the Chinese
stainless market, but given the lower quality differentials, we do not expect Filipino ores
to fully make up for lost volumes from Indonesia.
As discussed in previous sections, we expect Chinese inventories of high-grade Indonesian
nickel ores to be largely drawn down by mid-2015. Once these inventories are drawn
down, Chinese steelmakers will become increasingly reliant on lower-grade and higher-
cost Filipino ores moving into the second half of 2015. As a result, the nickel market may
finally see a delayed impact from the export ban starting in 2015. Also, we believe that
Chinese stainless steelmakers will finally have a significant cost squeeze in the coming
months, which may serve to significantly dent their historical cost advantage versus global
stainless peers.
0%
10%
20%
30%
40%
50%
60%
2000 2001 2002 2003 2004 2005 2006 2007 2008 2009 2010 2011 2012 2013
(%)
In order to maximize the cost
benefits of NPI, consumption of NPI
has grown to meet over 50% of total
Chinese nickel consumption over the
past decade. Looking forward, as
access to Indonesian and Filipino
nickel ores falls, Chinese
consumption of NPI should also fall
and force steelmakers to increasingly
consume refined nickel metal and
stainless scrap.
Natural Resources
Initiating Coverage
8 January 2015
page 34 of 91 , Equity Analyst, +44 (0) 20 7029 8772, [email protected] Rosenfeld, CFA
Please see important disclosure information on pages 88 - 91 of this report.

Exhibit 69: Chinese Nickel Pig Iron Production
Source: Wood Mackenzie, Jefferies estimates
Exhibit 70: Chinese Nickel Pig Iron Pricing (10-15%,
US$/mtu)
Source: Bloomberg, Jefferies
Chinese steelmakers have historically used their competitive input cost advantage to
support rapidly growing stainless exports into global markets. As seen below, Western
Europe has been a growth area for Chinese exporters, rising from 16% to 22% of Chinese
exports in recent years. North America, meanwhile, despite having stronger underlying
demand over this period, has actually become a less significant end market for Chinese
exports, falling from 32% to 10% of Chinese exports, largely due to the growth of
protectionist measures over this period. As we believe these export volumes, particularly
those sent to Europe, are relatively low margin for Chinese steelmakers, we see potential
for a significant fall in export volumes in the years ahead as Chinese steelmakers’ NPI-
based cost advantage deteriorates.
Exhibit 71: Chinese Cold-Rolled Stainless Steel Flat Products Exports
*2014 is 9M14 annualised Source: CRU, Jefferies
0
100
200
300
400
500
600
2000 2002 2004 2006 2008 2010 2012 2014E 2016E
000s t
-
50
100
150
200
250
300
350
Dec-10 Dec-11 Dec-12 Dec-13 Dec-14
US$/mtu
0
200
400
600
800
1,000
1,200
1,400
2004 2005 2006 2007 2008 2009 2010 2011 2012 2013 2014*
000s t
Chinese exports of stainless steel
have risen dramatically over the past
decade as domestic capacity growth
has skyrocketed and steelmakers
have benefited from the NPI-based
input cost advantage. As NPI costs
rise in the coming years, we see
potential for a significant slowdown
in Chinese stainless exports. Lower
Chinese stainless exports would
alleviate a major pressure in the
Western European steel market.
Natural Resources
Initiating Coverage
8 January 2015
page 35 of 91 , Equity Analyst, +44 (0) 20 7029 8772, [email protected] Rosenfeld, CFA
Please see important disclosure information on pages 88 - 91 of this report.

Exhibit 72: Chinese Cold-Rolled Stainless Steel Exports by
Destination (2008)
Source: CRU, Jefferies
Exhibit 73: Chinese Cold-Rolled Stainless Steel Exports by
Destination (9M14)
Source: CRU, Jefferies
Asia
39%
Western
Europe
16%
North
America
32%
C&S America
2%
Eastern
Europe
1%
CIS
4%
Other
6%
Asia
54%
Western
Europe
22%
North
America
10%
C&S America
2%
Eastern
Europe
2%
CIS
3%
Other
7%
Natural Resources
Initiating Coverage
8 January 2015
page 36 of 91 , Equity Analyst, +44 (0) 20 7029 8772, [email protected] Rosenfeld, CFA
Please see important disclosure information on pages 88 - 91 of this report.

Regional trade flows – Rising protectionism As China has grown to be the world’s largest steel producer, we have seen rising
dislocation between steel supply/demand balances and steel pricing by region, and China
has quickly become a crucial exporter of steel products into global markets. China’s
export growth has been driven by a variety of factors including excess domestic
steelmaking capacity as a result of years of rapid capacity development outpacing
demand growth rates, high pricing spreads between regions through which Chinese
steelmakers can secure superior prices abroad and, lastly, strong cost advantages for
Chinese steelmakers as a result of access to low cost NPI production.
Exhibit 74: Historical Stainless Steel Prices (CR 304)
Source: Platts, Jefferies
Exhibit 75: Regional Price Disparities
Source: Platts, Jefferies
Due to a combination of these factors, China grew from being a net importer of 1.9mt of
stainless steel in 2001 to a net exporter of 1.4mt in 2013. Europe has been a key
destination for Chinese stainless export growth over this period, and as European stainless
imports have nearly tripled we have seen Chinese volumes make up the majority of this
volume growth.
A rise in imports into the Eurozone has come at the clear expense of domestic steelmakers
that have rapidly lost market share. Imports have grown from 21% in 2010 to roughly
30% of domestic European demand in 2014. Of this, Asian imports rose from 15% to over
21% of demand. Interestingly, the situation in stainless steel is even more acute than that
in carbon steel where imports have remained fairly stable just above 20% and Chinese
imports remain well under 5% of domestic demand.
Exhibit 76: Historical European Stainless Steel Imports by Source
Source: ISSF, Jefferies
1,000
2,000
3,000
4,000
5,000
Dec-08 Dec-09 Dec-10 Dec-11 Dec-12 Dec-13 Dec-14
US$/t
United States China
Northern Europe Southern Europe
(1,000)
(750)
(500)
(250)
0
250
500
750
1,000
1,250
Dec-08 Dec-09 Dec-10 Dec-11 Dec-12 Dec-13 Dec-14
US$/t
N. Europe - China S. Europe - China US - China
0
200
400
600
800
1,000
1,200
1,400
1,600
1,800
2002 2003 2004 2005 2006 2007 2008 2009 2010 2011 2012 2013
(000s t)
NAFTA Latin America Eastern Europe Middle East Africa Asia Others
European imports of stainless steel
have nearly doubled over the past
decade, with Chinese imports being
the key driver of this growth.
Since 2010, imports grew from 21%
to roughly 30% of domestic
European demand, taking market
share from domestic producers and
putting pressure on local base
prices.
China has grown to be the world’s
largest net exporter of stainless steels
over the past decade, driven by high
excess domestic production
capacity, large pricing spreads
between regions and a strong NPI-
based cost advantage.
Natural Resources
Initiating Coverage
8 January 2015
page 37 of 91 , Equity Analyst, +44 (0) 20 7029 8772, [email protected] Rosenfeld, CFA
Please see important disclosure information on pages 88 - 91 of this report.

Exhibit 77: European Cold-Rolled Stainless Steel Imports as
% of Demand (EU27)
Source: CRU, Jefferies
Exhibit 78: European Carbon Steel Imports as % of Demand
Source: World Steel Association, Jefferies
Protectionist measures on the rise
As Chinese exports have risen in recent years, there has been a growth in protectionist
measures from countries that serve as key end markets for these volumes. In just the past
two years, Brazil, India, Russia, Vietnam and the US, among others, have all implemented
new restrictions on the import of Chinese stainless steel products. In most cases the
restrictions are product specific, ranging from stainless pipes to flat product, and have a
fixed-term structure, generally extending up to five years. However, the message is clear
that governments around the world have responded to a deluge of steel imports by trying
to disincentivise further volume growth in an attempt to protect domestic producers.
While numerous countries have enacted new protectionist measures, Europe has been
notably slow to act, and it is partly for this reason that we have seen continued import
growth in recent months. However, there are signs that this is beginning the change in
Europe as the EC has now taken up two separate investigations, with final decisions
expected in the first half of 2015.
In June 2014, in response to complaints made by Eurofer, the EC announced that it is
analysing anti-dumping proceedings against imports from China and Taiwan of cold-
rolled stainless steel products. And, in August 2014, the EC announced that it is analysing
anti-subsidy proceedings against imports from China of cold-rolled stainless steel
products.
We expect a decision to be announced by the EC along with provisional duties on the first
anti-dumping measures by the end of Q1 2015 and a decision to be announced on the
second anti-subsidy measures by the end of Q2. In both cases, new policy along with
permanent tariffs could be implemented by 3Q15, potentially significantly improving the
supply/demand dynamics in the domestic European stainless steel market within the very
foreseeable future. Tellingly, if Europe returned to historical levels of imports, this would
imply a roughly 3% increase in capacity utilisation for the industry with considerable
upside in stainless base prices and steelmaker margins.
There is clearly significant binary risk in an investment thesis based on a potential shift in
governmental import policy. However, we are somewhat reassured by the EC’s decision
to take on not one but two investigations in recent months as base prices and steelmaker
margins have remained well below historical levels. Further, following announcement of
these cases, and prior to any protective measures potentially being imposed in 2015,
recent months have seen a further increase in stainless steel imports from both Taiwan
and China, highlighting the ongoing pressure these regions put on the domestic Euro
steel industry.
0%
10%
20%
30%
40%
2007 2008 2009 2010 2011 2012 2013
% Imports from Asia % Imports from Rest of World 0%
10%
20%
30%
40%
2007 2008 2009 2010 2011 2012 2013
The EC is now conducting two anti-
dumping proceedings against
stainless imports from China and
Taiwan with preliminary results
expected by the end of Q1 2015.
Should the EC enact new
protectionist measures and Europe
return to a more normal level of
imports, this would imply a roughly
3% increase in regional capacity
utilisation rates.
Natural Resources
Initiating Coverage
8 January 2015
page 38 of 91 , Equity Analyst, +44 (0) 20 7029 8772, [email protected] Rosenfeld, CFA
Please see important disclosure information on pages 88 - 91 of this report.

Exhibit 79: Current Duties and Investigations in European Stainless
Source: European Commission trade defence publications Notes: 1) All new duties are imposed on a provisional basis for six months and are ratified thereafter generally for five years, after which expiry reviews are conducted. 2) Change in duty is calculated wrt to the final duty imposed upon ratification.
Product Type Countries/ Region
Duty typeImposition
date/status1Existing level Change in duty2
Stainless steel bars Countervailing 22-Dec-10Imposed CV duties up to
4.3%India
Stainless seamless steel
pipes and tubes Anti dumping 29-Jun-11
Imposed AD duties up to
71.9%China
Stainless steel fasteners
and partsAnti dumping 04-Jan-12 Up to 27.4%
Originally imposed in 2006 –
continued upon conclusion of
expiry review in the following
slabs:
11.4-27.4% China
8.8-23.6% Taiwan
Stainless steel fasteners
and partsAnti dumping 07-Mar-13
27.4% – extension of AD
duties on China due to
circumvention by
transhipment
Philippines
Stainless steel wires Countervailing 08-May-13Imposed CV duties up to
3.7%India
Stainless steel wires Anti dumping 08-May-13Imposed AD duties up to
12.5%India
Stainless steel flat products Anti dumping 26-Jun-14
Registration made
mandatory – possibility of 10-
25% of AD duties by Sep
2015
China, Taiwan
Stainless steel flat products Anti subsidy 14-Aug-14
Registration made
mandatory – possibility of 40-
50% of AS duties by Sep 2015
China
Import duties
Natural Resources
Initiating Coverage
8 January 2015
page 39 of 91 , Equity Analyst, +44 (0) 20 7029 8772, [email protected] Rosenfeld, CFA
Please see important disclosure information on pages 88 - 91 of this report.

Aperam – High Quality, Low Valuation Aperam was created in 2011 as a spin-out of ArcelorMittal, the world’s largest steelmaker.
Aperam is a leading producer of stainless steels with annual melting capacity of 2.5mtpa
in addition to capacity for specialty nickel alloys and electrical steels. The company is the
second largest stainless steel producer in Europe and the fourth largest nickel alloys
producer globally. In addition, Aperam is the market leader in Brazil with over 70% market
share as the only local stainless steel producer across LatAm. With a high-quality and
relatively stable business mix, we believe that Aperam’s current valuation discount versus
sector peers is unmerited. Aperam is one of our preferred Euro stainless steel equities.
Key Takeaways
Defensive, high-quality operations with sector-leading capacity utilisation rate
following past meltshop closures and ongoing restructuring of finishing lines.
Dominant market share in Brazilian/LatAm market. Highly profitable division
despite poor domestic demand due to protectionist anti-dumping measures.
Leading market share in high-margin specialty nickel alloys and electrical steel
industries with differentiated product qualities.
Highest-quality balance sheet and strongest FCF yield in sector. Aperam should
be positioned to restart dividend payments in the year ahead.
Product exposure Aperam’s shipments are divided between three major business lines including Stainless &
Electrical, Services & Solutions and Alloys & Specialities. The vast majority of steelmaking
capacity is held within the Stainless & Electrical division, producing predominately
standard-grade stainless steels (produced in both Europe and Brazil) in addition to
premium-grade electrical steels (produced in Brazil). While Aperam does not explicitly
report a breakdown by end market, the company is highly exposed to the aerospace,
auto, catering, construction, white goods and oil & gas industries. From a product-type
perspective, while the broader stainless steel market is generally 70% austenitic/30%
ferritic, Aperam is reportedly slightly more exposed to ferritics than the global market.
Aperam also has leading market share in the production of specialty nickel alloys, which
make up a small minority of shipments but are a significant margin contributor. Notably,
growth in these niche markets has outpaced that of broader commodity stainless steels
and benefited from stronger margins due to high barriers to entry. Specialty nickel alloys
are sold in the form of bars, semis, cold-rolled strips, wire and wire rods, and plate. Within
this division, Aperam has strong exposure to LNG tankers, special welding and
continuously variable transmission belts.
Exhibit 80: Aperam Net Sales by Division
Source: Company Data, Jefferies
51% 49% 47% 46%
40% 39% 40% 41%
9% 11% 12% 12%
0%
20%
40%
60%
80%
100%
2010 2011 2012 2013
Stainless & Electrical Services & Solutions Alloys & Specialities
APAM NA
Rating: Buy
PT: €30
Aperam is one of our top sector picks
as its high-quality operations benefit
from sector-leading FCF yield, a low-
risk balance sheet and potential
restart of divi payments.
The majority of Aperam’s production
is stainless and electrical steels with
exposure to the aerospace, auto and
catering industries, among others.
However, Aperam also has leading
market share in the specialty nickel
alloys industry.
Natural Resources
Initiating Coverage
8 January 2015
page 40 of 91 , Equity Analyst, +44 (0) 20 7029 8772, [email protected] Rosenfeld, CFA
Please see important disclosure information on pages 88 - 91 of this report.

Aperam’s Services & Solutions business serves primarily as a distribution arm ensuring
continued close relationship with key customers across the Euro region. In an
environment of increasing import pressure, this distribution capacity is particularly
important to ensure that Aperam can maintain stable production volumes and steady
sales. In addition to basic distribution, the Services & Solutions business also aims to
capture some downstream activity through its Tubes and Precision Strip operations
including cutting, bending, pickling and annealing activities, which can further enhance
divisional margins.
Geographic diversification Aperam’s European stainless steelmaking facilities are based in Belgium and France. In
Belgium, Aperam has two EAF meltshops in Genk and Chatelet. Operations at Genk also
include a cold-rolling mill while operations at Chatelet also include a hot-rolling mill. In
addition, Aperam has two cold-rolling mills in France, located in Guegnon and Isbergues.
Importantly, outside Europe, Aperam also has leading exposure to Latin America as the
only local stainless steel producer in Brazil, with dominant market share. The company’s
Timoteo facility produces a full range of stainless and electrical steels in addition to limited
volumes of special carbon steels. Timoteo includes a melt shop with two blast furnaces
and an EAF, a stainless cold-rolling shop, a strip mill and an electrical steel cold-rolling
shop.
Exhibit 81: Aperam Sales by Region, 2013
Source: Company Data, Jefferies
While the Brazilian economy has notably slowed in the past year, raising continued
concerns over the demand outlook for both carbon and stainless steels, domestic stainless
steel market conditions have actually notably improved in the past year since the
implementation of new import duties and anti-dumping rights. Crucially, these measures,
implemented in autumn 2013, should help reduce the impact of imports on the domestic
market (previously running at 30% of domestic demand 2-3 years back) and help support
a more stable market environment over the next five years for domestic suppliers.
Impressively, despite relatively weak current demand within the Brazilian market, Aperam
is currently running at 85%-90% capacity utilisation in the region, positively boosting
realised margins.
Brazil, 23%
Other Americas, 8%
Germany, 21%Italy, 9%
France, 8%
Other Europe, 23%
Asia & Africa, 8%
In addition to strong European
market share, Aperam is also the
only local stainless steel producer in
Brazil (and across Latin America)
with dominant market share.
Natural Resources
Initiating Coverage
8 January 2015
page 41 of 91 , Equity Analyst, +44 (0) 20 7029 8772, [email protected] Rosenfeld, CFA
Please see important disclosure information on pages 88 - 91 of this report.

Exhibit 82: Brazilian Import and Anti-Dumping Duties
Source: Company Data, Jefferies
Aperam’s operations in Brazil and Europe have also benefited in recent periods from Fx
swings, with both the Brazilian Real and Euro weakening versus the US Dollar. While steel
prices and nearly all raw materials used in steelmaking are linked to the USD within the
global steel market, other input costs are denominated in local Brazilian and Euro
currency, making Aperam’s operations more cost competitive versus global peers. As
noted by management in years past, a 1% change in the BRL leads to a c.$3m change in
annual operating costs while a 1% change in the Euro leads to a c.$8m change in annual
operating costs.
Cost cutting and asset optimisation Since the spin-out of Aperam from ArcelorMittal in 2011, Aperam has implemented
ongoing cost-cutting programmes dubbed the “Leadership Journey.” Originally targeting
total cost savings of $250m, this programme has been consistently upsized over the past
three years, now targeting $475m of total savings by completion in 2015. As of 3Q14,
$415m of savings had been achieved, with the remainder to be achieved in the coming
year.
Over recent years, cost cutting at Aperam has been driven by a combination of
restructuring (reducing the number of production lines and focus on most efficient
operations), efficiency driven capex (allowing for workforce reductions) and performance-
related projects (optimising raw materials and making operations leaner). In addition, this
past year Aperam expanded these objectives to also include debottlenecking and
productivity enhancement in order to improve capacity utilisation and respond to
gradually improving demand. With these latest measures, Aperam believes it can begin to
gradually increase volumes, as needed, even with a reduced workforce that has fallen by
nearly 15% since 2010.
While management aims to retain the entirety of these cost-cutting measures, we believe
this is highly unlikely and note that the target stands out significantly versus most Euro
Steel sector peers, which target 30%-50% cost-cutting retention. Realistically, Aperam has
shown that successful past cost cutting has, at the very least, helped compensate for
deteriorating base prices and also added additional margins to underlying earnings.
Product Type Import duties AD duties Exporting country
Stainless steel flat
products
Decreased to 14% from
25% in October 2013
Imposed $236-1,077/t duties for five
years beginning 4 October 2013.
Applicable on CR 304 and 430
grades, 0.35-4.75mm thickness.
China, Finland,
Germany, Korea, Taiwan
and Vietnam
Stainless steel welded
tubes14%
Imposed up to $911/t duties for five
years beginning 29 July 2013.China and Taiwan
Electrical steel NGO 14%
Imposed $133-567/t duties for five
years beginning 17 July 2013.
Released partially on 15 August 2014
for one year for 45kt of imports.
China, Korea and Taiwan
Electrical steel GODecreased to 14% from
25% in October 2013_ _
While Brazilian stainless demand
growth remains lacklustre given
poor macroeconomic trends, the
domestic stainless market has
benefited from new protectionist
measures implemented in autumn
2013.
In a relatively weak European
demand environment over recent
years, Aperam’s cost-cutting
programmes have been the key
driver of earnings growth. The
current programme targets $475m
of total savings to be completed in
2015.
Natural Resources
Initiating Coverage
8 January 2015
page 42 of 91 , Equity Analyst, +44 (0) 20 7029 8772, [email protected] Rosenfeld, CFA
Please see important disclosure information on pages 88 - 91 of this report.

Exhibit 83: Aperam Cost Savings Targets "Leadership Journey"
Source: Company Data, Jefferies
Perhaps most impressively, Aperam’s efforts to drive asset restructuring have helped
significantly improve capacity utilisation rates over recent years, even in an environment
of weak European demand. First, Aperam shut down its upstream production capacity at
Ardoise and Isbergues prior to spin-out from ArcelorMittal. Through these steps, Aperam’s
melt shop capacity was reduced by 1.1mtpa, and remaining capacity of 2.1mtpa was
concentrated within operations at Genk and Chatelet.
In addition, in the years since spin-out, Aperam idled further upstream capacity at Genk
(mothballing another 400ktpa of melt shop capacity) and some downstream capacity, as
shown in the exhibit below (including permanent shutdown of 100ktpa of capacity at
Isbergues and mothballing of 80ktpa of capacity at Guegnon and Genk). These efforts
have served to reduce the number of tools/mills in operation from 29 to 17. As a result of
these efforts, Aperam is currently operating at roughly 85%-90% capacity utilisation in
Europe, up significantly from the roughly 65% utilisation rate achieved at the time of spin-
out from ArcelorMittal.
Exhibit 84: Aperam Downstream Rationalisation in Europe
Source: Company Data
3373 123
176204 231 251 276 299 324 349 369 385 401 415250
250 250350
350 350 350
350 425 425 425
425475 475 475
13%
29%
49% 50%58%
66%72%
79%70%
76%82%
87%81% 84% 87%
0%
20%
40%
60%
80%
100%
0
100
200
300
400
500
600
700
800
1Q
2011
2Q
2011
3Q
2011
4Q
2011
1Q
2012
2Q
2012
3Q
2012
4Q
2012
1Q
2013
2Q
2013
3Q
2013
4Q
2013
1Q
2014
2Q
2014
3Q
2014
$mm
Achieved savings Target savings Success rate - right axis
Aperam has achieved an impressively
high “success rate” in hitting cost-
cutting targets over recent years.
While management’s goal to retain
the entirety of these cost-cutting
measures (versus peers who
generally target 30%-50% retention)
is a challenge, the company has a
good track record regardless.
Through a variety of restructuring
measures in recent years, Aperam
has shuttered a total of 1.5mt of melt
capacity (1.1mt shut down, 0.4mt
mothballed) and 180kt of finishing
capacity (100kt shut down, 80kt
mothballed).
Natural Resources
Initiating Coverage
8 January 2015
page 43 of 91 , Equity Analyst, +44 (0) 20 7029 8772, [email protected] Rosenfeld, CFA
Please see important disclosure information on pages 88 - 91 of this report.
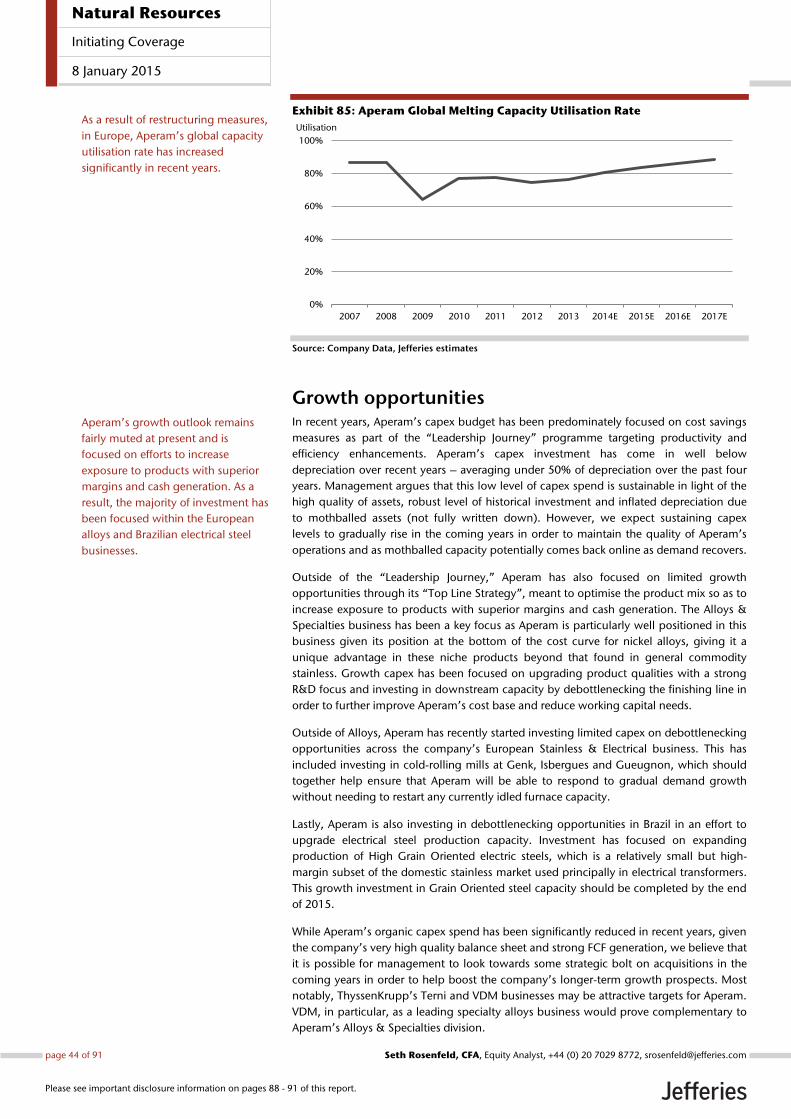
Exhibit 85: Aperam Global Melting Capacity Utilisation Rate
Source: Company Data, Jefferies estimates
Growth opportunities In recent years, Aperam’s capex budget has been predominately focused on cost savings
measures as part of the “Leadership Journey” programme targeting productivity and
efficiency enhancements. Aperam’s capex investment has come in well below
depreciation over recent years – averaging under 50% of depreciation over the past four
years. Management argues that this low level of capex spend is sustainable in light of the
high quality of assets, robust level of historical investment and inflated depreciation due
to mothballed assets (not fully written down). However, we expect sustaining capex
levels to gradually rise in the coming years in order to maintain the quality of Aperam’s
operations and as mothballed capacity potentially comes back online as demand recovers.
Outside of the “Leadership Journey,” Aperam has also focused on limited growth
opportunities through its “Top Line Strategy”, meant to optimise the product mix so as to
increase exposure to products with superior margins and cash generation. The Alloys &
Specialties business has been a key focus as Aperam is particularly well positioned in this
business given its position at the bottom of the cost curve for nickel alloys, giving it a
unique advantage in these niche products beyond that found in general commodity
stainless. Growth capex has been focused on upgrading product qualities with a strong
R&D focus and investing in downstream capacity by debottlenecking the finishing line in
order to further improve Aperam’s cost base and reduce working capital needs.
Outside of Alloys, Aperam has recently started investing limited capex on debottlenecking
opportunities across the company’s European Stainless & Electrical business. This has
included investing in cold-rolling mills at Genk, Isbergues and Gueugnon, which should
together help ensure that Aperam will be able to respond to gradual demand growth
without needing to restart any currently idled furnace capacity.
Lastly, Aperam is also investing in debottlenecking opportunities in Brazil in an effort to
upgrade electrical steel production capacity. Investment has focused on expanding
production of High Grain Oriented electric steels, which is a relatively small but high-
margin subset of the domestic stainless market used principally in electrical transformers.
This growth investment in Grain Oriented steel capacity should be completed by the end
of 2015.
While Aperam’s organic capex spend has been significantly reduced in recent years, given
the company’s very high quality balance sheet and strong FCF generation, we believe that
it is possible for management to look towards some strategic bolt on acquisitions in the
coming years in order to help boost the company’s longer-term growth prospects. Most
notably, ThyssenKrupp’s Terni and VDM businesses may be attractive targets for Aperam.
VDM, in particular, as a leading specialty alloys business would prove complementary to
Aperam’s Alloys & Specialties division.
0%
20%
40%
60%
80%
100%
2007 2008 2009 2010 2011 2012 2013 2014E 2015E 2016E 2017E
Utilisation
As a result of restructuring measures,
in Europe, Aperam’s global capacity
utilisation rate has increased
significantly in recent years.
Aperam’s growth outlook remains
fairly muted at present and is
focused on efforts to increase
exposure to products with superior
margins and cash generation. As a
result, the majority of investment has
been focused within the European
alloys and Brazilian electrical steel
businesses.
Natural Resources
Initiating Coverage
8 January 2015
page 44 of 91 , Equity Analyst, +44 (0) 20 7029 8772, [email protected] Rosenfeld, CFA
Please see important disclosure information on pages 88 - 91 of this report.

Balance sheet & FCF generation While the majority of the European steel industry has faced significant balance sheet
problems since the global financial crisis, leading to rights issuances and distressed asset
sales, Aperam has uniquely stood out with a defensive balance sheet in recent years. Since
being spun out from ArcelorMittal, Aperam has benefited from a consistently high-quality
balance sheet with net gearing remaining between 20% and 30% and currently running
at the bottom end of this range.
Cash flow from operations has improved considerably over the past three years, driven by
ongoing cost cutting and productivity enhancement measures, while capex has also fallen
significantly with annual sustaining capex reduced from roughly $175m to just $100m
following recent capacity reductions. As a result, Aperam management has successfully
reduced net debt from a post-spin-out peak of $1.1b in 2011 to a YE2014 target of
$550m. From this quality base, strong ongoing FCF generation on our forecasts may
make it is possible for Aperam to turn net cash positive over the coming two years.
Exhibit 86: Aperam Debt and Gearing
Source: Company Data, Jefferies
Looking forward, management aim to continue to reduce net debt and also particularly
focus on opportunities to lower debt costs by refinancing currently high interest rate high
yield bonds. Looking at Aperam’s debt maturity profile, a high yield bond previously
maturing in 2016 was already paid down in October 2014 while two convertible bonds
are outstanding in 2017 and 2019 and a high yield bond is outstanding in 2018.
Exhibit 87: Aperam Debt Maturity Schedule as of 30 September (US$m)
*Taking into account repayment of 2016 HY bond, completed on 1 October 2014 ** Assuming convertible bonds 2017&2019 reimbursement Source: Aperam
4.0 4.23.6 3.4 3.5
3.2 3.2 3.2 3.1 2.9 3.0 3.0 3.0 3.12.9
0.91.1
1.0 0.9 0.90.9 1.0 0.8 0.8 0.8 0.8 0.7 0.7 0.7
0.6
22%
27%29%
26% 25%
28%
31%
26%27%
29%27%
23% 23%21% 21%
0%
5%
10%
15%
20%
25%
30%
35%
0
1
2
3
4
5
6
7
8
1Q
2011
2Q
2011
3Q
2011
4Q
2011
1Q
2012
2Q
2012
3Q
2012
4Q
2012
1Q
2013
2Q
2013
3Q
2013
4Q
2013
1Q
2014
2Q
2014
3Q
2014
$bn
Equity Net Debt Gearing – right axis
Aperam stands out with the highest-
quality balance sheet in the Euro
stainless steel sector. Gearing has
remained steadily between 20% and
25% over recent quarters.
Natural Resources
Initiating Coverage
8 January 2015
page 45 of 91 , Equity Analyst, +44 (0) 20 7029 8772, [email protected] Rosenfeld, CFA
Please see important disclosure information on pages 88 - 91 of this report.
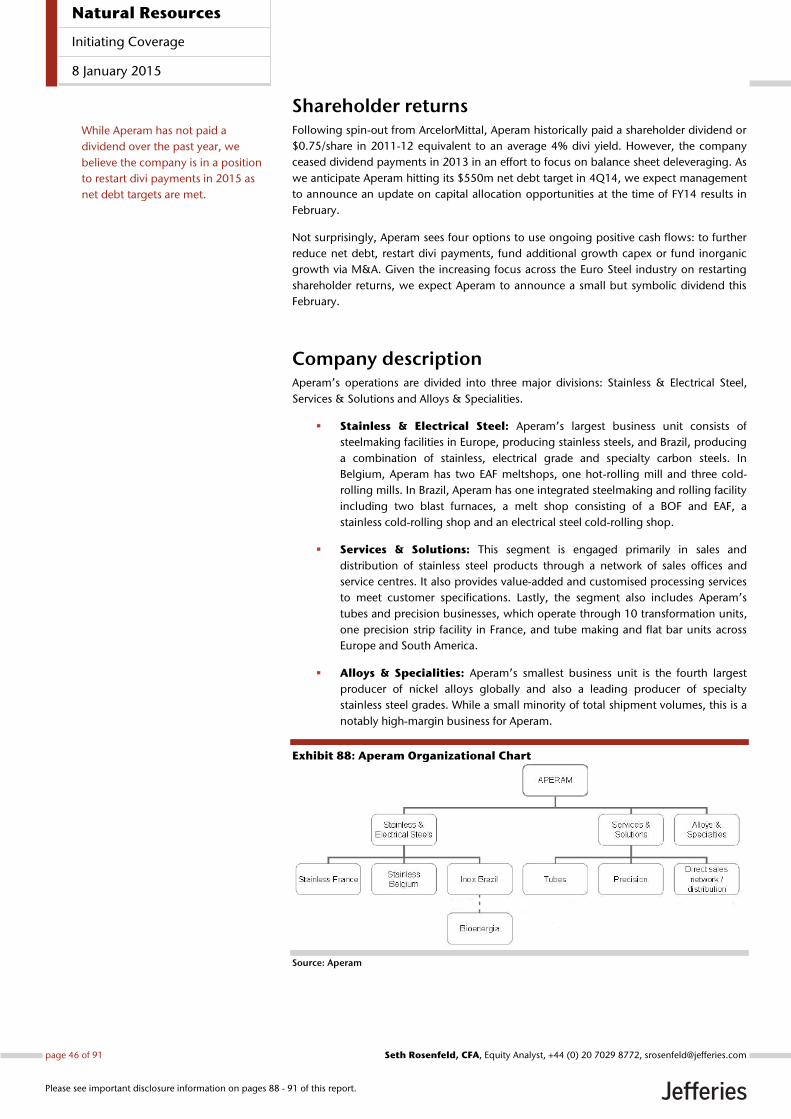
Shareholder returns Following spin-out from ArcelorMittal, Aperam historically paid a shareholder dividend or
$0.75/share in 2011-12 equivalent to an average 4% divi yield. However, the company
ceased dividend payments in 2013 in an effort to focus on balance sheet deleveraging. As
we anticipate Aperam hitting its $550m net debt target in 4Q14, we expect management
to announce an update on capital allocation opportunities at the time of FY14 results in
February.
Not surprisingly, Aperam sees four options to use ongoing positive cash flows: to further
reduce net debt, restart divi payments, fund additional growth capex or fund inorganic
growth via M&A. Given the increasing focus across the Euro Steel industry on restarting
shareholder returns, we expect Aperam to announce a small but symbolic dividend this
February.
Company description Aperam’s operations are divided into three major divisions: Stainless & Electrical Steel,
Services & Solutions and Alloys & Specialities.
Stainless & Electrical Steel: Aperam’s largest business unit consists of
steelmaking facilities in Europe, producing stainless steels, and Brazil, producing
a combination of stainless, electrical grade and specialty carbon steels. In
Belgium, Aperam has two EAF meltshops, one hot-rolling mill and three cold-
rolling mills. In Brazil, Aperam has one integrated steelmaking and rolling facility
including two blast furnaces, a melt shop consisting of a BOF and EAF, a
stainless cold-rolling shop and an electrical steel cold-rolling shop.
Services & Solutions: This segment is engaged primarily in sales and
distribution of stainless steel products through a network of sales offices and
service centres. It also provides value-added and customised processing services
to meet customer specifications. Lastly, the segment also includes Aperam’s
tubes and precision businesses, which operate through 10 transformation units,
one precision strip facility in France, and tube making and flat bar units across
Europe and South America.
Alloys & Specialities: Aperam’s smallest business unit is the fourth largest
producer of nickel alloys globally and also a leading producer of specialty
stainless steel grades. While a small minority of total shipment volumes, this is a
notably high-margin business for Aperam.
Exhibit 88: Aperam Organizational Chart
Source: Aperam
While Aperam has not paid a
dividend over the past year, we
believe the company is in a position
to restart divi payments in 2015 as
net debt targets are met.
Natural Resources
Initiating Coverage
8 January 2015
page 46 of 91 , Equity Analyst, +44 (0) 20 7029 8772, [email protected] Rosenfeld, CFA
Please see important disclosure information on pages 88 - 91 of this report.
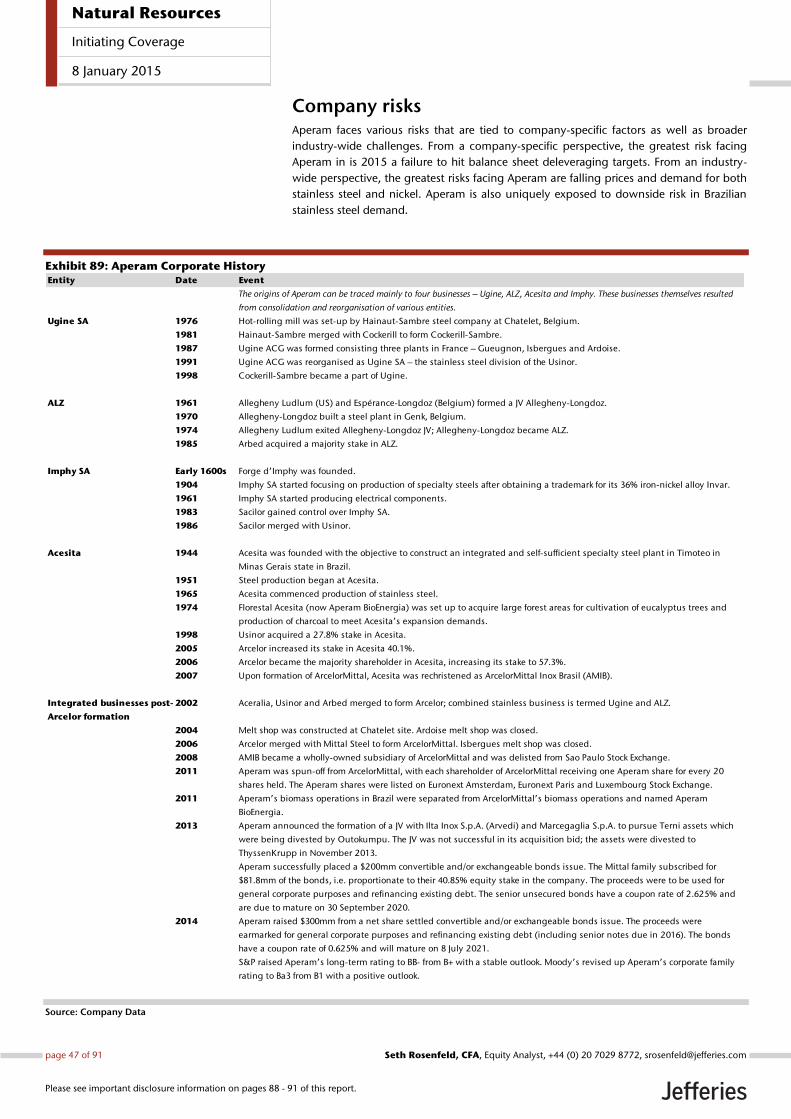
Company risks Aperam faces various risks that are tied to company-specific factors as well as broader
industry-wide challenges. From a company-specific perspective, the greatest risk facing
Aperam in is 2015 a failure to hit balance sheet deleveraging targets. From an industry-
wide perspective, the greatest risks facing Aperam are falling prices and demand for both
stainless steel and nickel. Aperam is also uniquely exposed to downside risk in Brazilian
stainless steel demand.
Exhibit 89: Aperam Corporate History
Source: Company Data
Entity Date Event
The origins of Aperam can be traced mainly to four businesses – Ugine, ALZ, Acesita and Imphy. These businesses themselves resulted
from consolidation and reorganisation of various entities.
Ugine SA 1976 Hot-rolling mill was set-up by Hainaut-Sambre steel company at Chatelet, Belgium.
1981 Hainaut-Sambre merged with Cockerill to form Cockerill-Sambre.
1987 Ugine ACG was formed consisting three plants in France – Gueugnon, Isbergues and Ardoise.
1991 Ugine ACG was reorganised as Ugine SA – the stainless steel division of the Usinor.
1998 Cockerill-Sambre became a part of Ugine.
ALZ 1961 Allegheny Ludlum (US) and Espérance-Longdoz (Belgium) formed a JV Allegheny-Longdoz.
1970 Allegheny-Longdoz built a steel plant in Genk, Belgium.
1974 Allegheny Ludlum exited Allegheny-Longdoz JV; Allegheny-Longdoz became ALZ.
1985 Arbed acquired a majority stake in ALZ.
Imphy SA Early 1600s Forge d’Imphy was founded.
1904 Imphy SA started focusing on production of specialty steels after obtaining a trademark for its 36% iron-nickel alloy Invar.
1961 Imphy SA started producing electrical components.
1983 Sacilor gained control over Imphy SA.
1986 Sacilor merged with Usinor.
Acesita 1944 Acesita was founded with the objective to construct an integrated and self-sufficient specialty steel plant in Timoteo in
Minas Gerais state in Brazil.
1951 Steel production began at Acesita.
1965 Acesita commenced production of stainless steel.
1974 Florestal Acesita (now Aperam BioEnergia) was set up to acquire large forest areas for cultivation of eucalyptus trees and
production of charcoal to meet Acesita’s expansion demands.
1998 Usinor acquired a 27.8% stake in Acesita.
2005 Arcelor increased its stake in Acesita 40.1%.
2006 Arcelor became the majority shareholder in Acesita, increasing its stake to 57.3%.
2007 Upon formation of ArcelorMittal, Acesita was rechristened as ArcelorMittal Inox Brasil (AMIB).
Integrated businesses post-
Arcelor formation
2002 Aceralia, Usinor and Arbed merged to form Arcelor; combined stainless business is termed Ugine and ALZ.
2004 Melt shop was constructed at Chatelet site. Ardoise melt shop was closed.
2006 Arcelor merged with Mittal Steel to form ArcelorMittal. Isbergues melt shop was closed.
2008 AMIB became a wholly-owned subsidiary of ArcelorMittal and was delisted from Sao Paulo Stock Exchange.
2011 Aperam was spun-off from ArcelorMittal, with each shareholder of ArcelorMittal receiving one Aperam share for every 20
shares held. The Aperam shares were listed on Euronext Amsterdam, Euronext Paris and Luxembourg Stock Exchange.
2011 Aperam’s biomass operations in Brazil were separated from ArcelorMittal’s biomass operations and named Aperam
BioEnergia.
2013 Aperam announced the formation of a JV with Ilta Inox S.p.A. (Arvedi) and Marcegaglia S.p.A. to pursue Terni assets which
were being divested by Outokumpu. The JV was not successful in its acquisition bid; the assets were divested to
ThyssenKrupp in November 2013.
Aperam successfully placed a $200mm convertible and/or exchangeable bonds issue. The Mittal family subscribed for
$81.8mm of the bonds, i.e. proportionate to their 40.85% equity stake in the company. The proceeds were to be used for
general corporate purposes and refinancing existing debt. The senior unsecured bonds have a coupon rate of 2.625% and
are due to mature on 30 September 2020.
2014 Aperam raised $300mm from a net share settled convertible and/or exchangeable bonds issue. The proceeds were
earmarked for general corporate purposes and refinancing existing debt (including senior notes due in 2016). The bonds
have a coupon rate of 0.625% and will mature on 8 July 2021.
S&P raised Aperam’s long-term rating to BB- from B+ with a stable outlook. Moody’s revised up Aperam’s corporate family
rating to Ba3 from B1 with a positive outlook.
Natural Resources
Initiating Coverage
8 January 2015
page 47 of 91 , Equity Analyst, +44 (0) 20 7029 8772, [email protected] Rosenfeld, CFA
Please see important disclosure information on pages 88 - 91 of this report.

Exhibit 90: Aperam Management Biographies
Source: Company Data
Name Position Profile
Mr Timoteo Di Maulo Chief Executive Officer (CEO) Mr DiMaulo took on the role of Aperam’s CEO on 1 January 2015, upon the retirement of previous CEO Mr
Philippe Darmayan. Previous to being CEO, Mr Di Maulo took on the role of Chief Commercial and Sourcing
Officer in May 2012 after earlier serving as the CEO of Services & Solutions since 2005. His association with
Aperam dates back to 1990, when he joined Ugine (the stainless division of Usinor). Mr Di Maulo holds an
MBA from Bocconi University, Italy and is an Italian citizen.
Mr Sandeep Jalan Chief Financial Officer (CFO) Mr Jalan was appointed CFO in January 2014. Mr Jalan joined ArcelorMittal in 1999. Prior to assuming the
role of Aperam’s CFO, he was the CFO of ArcelorMittal Long Carbon Europe. Mr Jalan holds a BCom degree
from Banaras Hindu University, India. He also holds Chartered Accountant (equivalent to CPA) and
Company Secretary qualifications from Indian institutes. Mr Jalan is an Indian citizen.
Mr Frederico Ayres Lima Commercial Director, Stainless &
Electrical Steel South America
Mr Ayres has held the current position since 2009 and is designated to become the COO of same division
beginning 1 December 2014, replacing Mr Clenio Guimarães who is leaving the company. Prior to his
current role, Mr Ayres was a General Manager in the division. Mr Ayres holds engineering and MSc
qualifications from Universidade Federal de Minas Gerais (Federal University of Minas Gerais), Brazil. He also
has an Executive MBA from Fundação Getulio Vargas (Getulio Vargas Foundation). He is a Brazilian citizen.
Mr Jean-Paul Rouffiac Chief Operating Officer (COO),
Stainless & Electrical Steel Europe
Mr Rouffiac has been the COO of Stainless & Electrical Steel Europe since May 2012. He was the CEO of the
division since 2007 before becoming COO. He joined Usinor in 1978 and has since held various senior
management positions across departments. Mr Rouffiac holds educational qualifications from Sciences Po
and Pantheon-Sorbonne University, France. He is a French citizen.
Ms Johanna Van
Sevenant
Chief Executive Officer (CEO),
Services & Solutions
Ms Van Sevenant assumed her current role on 1 November 2014. Prior to this appointment, she shared the
responsibilities for HR, Communications and Sustainability since 2011. She joined Usinor in 2001. Ms Van
Sevenant is a Master of Political Science and Business Administration from Université Libre de Bruxelles (Free
University of Brussels), Belgium. She has another post-graduate degree in Tax Law from HEC Saint Louis
Bruxelles. She is a Belgian citizen.
Mr Frédéric Mattei Chief Executive Officer (CEO),
Alloys and Specialties
Mr Mattei took the charge as CEO of Alloys and Specialities on 1 June 2014. His latest engagement prior to
the appointment was as CEO of Salzgitter Mannesmann Stainless Tubes – France since July 2013. He
graduated from Ecole Nationale des Ponts et Chaussées (National School of Bridges and Roads), France. He
also did an executive MBA from ESCP. Mr Mattei is a French citizen.
Ms Vanisha Mittal
Bhatia
Head of Strategy Ms Vanisha Mittal Bhatia joined Aperam in April 2011 and is Responsible for Strategy. She has a degree in
business administration from the European Business School and a master's in South Asian studies from the
School of Oriental and African Studies, London. She has completed corporate internships at Mittal Shipping
Ltd, Mittal Steel Hamburg GmbH and an internet-based venture capital fund. Vanisha Mittal Bhatia is a
member of the Board of Directors of ArcelorMittal. She is also the daughter of Mr. Lakshmi N. Mittal. Ms. Mittal
Bhatia is a citizen of India.
Mr Nicolas Changeur Chief Marketing Officer Mr Nicolas Changeur was appointed Chief Marketing Officer for Stainless & Electrical Steel as from 1
November 2014. Nicolas Changeur joined the Group in 2003 as Head of strategy ofJ&L,USA. He then held
various positions inside the stainless segment in strategy and in operations in Europe and inSouth America.
Prior to joining the Group, Mr. Changeur spent 2 years as Senior Associate at AT Kearney a strategy
consulting firm. Until July 2012, Mr. Changeur was in charge of Services & Solutions Tubes & Bars. He was
appointed, Chief Marketing Officer, effective July 2012. Nicolas Changeur is a citizen of France.
Mr. Bernard Hallemans Chief Technology Officer Mr Bernard Hallemans was appointed Chief Technical Officer as from 1 November 1 2014. Bernard
Hallemand joined the Group in 1995 as a research and metallurgical engineer. He conducted different R&D,
quality and process improvement projects in the stainless steelmaking, hot rolling and cold rolling areas
until 2001. From the Ugine & ALZ merger in 2002 to 2007, he was responsible for the setup and
management of the customer service department of the Genk plant and later of the Division Industry within
Stainless Europe. In 2008, he moved to Châtelet, heading the Châtelet plant. He was appointed Plant
Manager of Genk, effective January 15, 2012. Bernard graduated as a Metallurgical Engineer from KU
Leuven, where he worked for 4 years as a research assistant while finishing his PhD in Materials Science. He
holds a European Executive MBA from ESCP-EAP Paris. Bernard Hallemans is a citizen of Belgium.
Natural Resources
Initiating Coverage
8 January 2015
page 48 of 91 , Equity Analyst, +44 (0) 20 7029 8772, [email protected] Rosenfeld, CFA
Please see important disclosure information on pages 88 - 91 of this report.

Exhibit 91: Aperam Segmental Summary
Source: Company Data, Bloomberg, Factset, Jefferies
2009 2010 2011 2012 2013 1Q14 2Q14 3Q14 4Q14E 2014E 2015E 2016E 2017E
Stainless & Electrical Steel
Steel Shipments (000s t) 1,374 1,638 1,675 1,611 1,650 453 449 422 443 1,767 1,822 1,877 1,933
Revenue (US$m) 3,185 4,431 5,068 4,180 4,001 1,104 1,162 1,116 1,162 4,544 4,850 5,376 5,620
Adj. EBITDA (US$m) 202 289 264 121 235 100 124 109 77 410 449 536 493
Adj. EBITDA margin (%) 6% 7% 5% 3% 6% 9% 11% 10% 7% 9% 9% 10% 9%
Adj. EBITDA per tonne (US$/t) 147 176 158 75 142 221 276 258 173 232 246 286 255
EBIT (US$m) (157) 8 (32) (147) (22) 34 76 62 27 199 206 285 235
Capex (US$m) 77 81 110 91 102 17 16 17 35 85 84 85 85
Services & Solutions
Steel Shipments (000s t) 575 652 662 661 679 197 188 171 174 730 738 760 783
Revenue (US$m) 1,758 2,327 2,603 2,173 2,189 623 630 584 558 2,395 2,453 2,753 2,971
Adj. EBITDA (US$m) 13 83 15 21 9 23 30 21 17 91 92 110 126
Adj. EBITDA margin (%) 1% 4% 1% 1% 0% 4% 5% 4% 3% 4% 4% 4% 4%
Adj. EBITDA per tonne (US$/t) 23 127 23 32 13 117 160 123 96 124 125 145 161
EBIT (US$m) (40) 53 (18) (8) (25) 17 24 15 11 67 66 83 99
Capex (US$m) 20 15 20 31 11 2 2 4 12 20 20 20 20
Alloys & Specialties
Steel Shipments (000s t) 27 33 37 37 37 9 9 8 8 34 35 37 38
Revenue (US$m) 435 529 721 659 641 149 163 141 149 602 652 738 804
Adj. EBITDA (US$m) 16 42 70 56 60 15 20 12 13 60 59 74 80
Adj. EBITDA margin (%) 4% 8% 10% 8% 9% 10% 12% 9% 9% 10% 9% 10% 10%
Adj. EBITDA per tonne (US$/t) 593 1,289 1,918 1,514 1,622 1,685 2,174 1,600 1,596 1,777 1,660 2,009 2,105
EBIT (US$m) (1) 36 64 50 50 13 17 11 12 53 54 69 75
Capex (US$m) 13 5 12 23 12 3 1 3 12 19 20 20 20
Other & Adjustment
Steel Shipments (000s t) (529) (582) (625) (626) (638) (184) (180) (168) (170) (702) (705) (726) (748)
Revenue (US$m) (1,143) (1,683) (2,047) (1,751) (1,711) (482) (511) (488) (474) (1,955) (2,027) (2,262) (2,416)
Adj. EBITDA (US$m) -5 (4) 50 19 (12) (9) (10) (5) (5) (29) (21) (33) (36)
Adj. EBITDA margin (%) 0% 0% -2% -1% 1% 2% 2% 1% 1% 1% 1% 1% 1%
EBIT (US$m) (9) (4) 38 2 (14) (10) (10) (6) (6) (32) (25) (37) (40)
Capex (US$m) 5 0 16 16 0 0 0 0 0 0 0 0 0
Group
Steel Shipments (000s t) 1,447 1,741 1,749 1,683 1,728 475 466 433 456 1,830 1,890 1,947 2,006
Revenue (US$m) 4,235 5,604 6,345 5,261 5,120 1,394 1,444 1,353 1,395 5,586 5,928 6,605 6,980
Adj. EBITDA (US$m) 226 410 399 217 292 129 164 137 102 532 579 687 664
Adj. EBITDA margin (%) 5% 7% 6% 4% 6% 9% 11% 10% 7% 10% 10% 10% 10%
Adj. EBITDA per tonne (US$/t) 156 235 228 129 169 272 352 316 223 291 306 353 331
EBIT (US$m) (207) 93 52 (103) (11) 54 107 82 44 287 301 400 369
Capex (US$m) 115 101 158 161 125 22 19 24 59 124 124 125 125
Net Debt (US$m) 1,763 959 878 816 690 689 663 591 532 532 217 (171) (528)
Natural Resources
Initiating Coverage
8 January 2015
page 49 of 91 , Equity Analyst, +44 (0) 20 7029 8772, [email protected] Rosenfeld, CFA
Please see important disclosure information on pages 88 - 91 of this report.

Exhibit 92: Aperam Income Statement (2009-2017E)
Source: Company Data, Jefferies
US$ millions 2009 2010 2011 2012 2013 2014E 2015E 2016E 2017E
Sales 4,235 5,604 6,345 5,261 5,120 5,586 5,928 6,605 6,980
Cost of Sales (4,009) (5,194) (5,946) (5,044) (4,828) (5,054) (5,349) (5,919) (6,315)
EBITDA 226 410 399 217 292 532 579 687 664
Depreciation & Amortization (333) (317) (311) (320) (303) (245) (278) (286) (295)
Operating Income/(Loss) (107) 93 88 (103) (11) 287 301 400 369
(Loss) Income from Other Investments and Associates 2 9 2 2 (1) (45) - - -
Net Interest Expense and Other Net Financing Costs (2) (9) (120) (74) (118) (102) (25) (17) (10)
Interest Income - - - - - 1 3 8 14
Interest Expense - - - - - (8) (29) (25) (24)
Net Foreign Exchange Result and Derivative Gains / (Losses) - 9 (42) (2) (13) (5) - - -
Other Income / (Expense) (100) - (35) - - - - - -
Result Before Taxes (207) 102 (107) (177) (143) 135 275 383 359
Income Taxes Benefit (Expense) 57 3 48 66 44 (33) (80) (77) (72)
Net Result (150) 105 (59) (111) (99) 102 195 307 288
Attributable to Equity Holders of the Company (150) 104 (60) (111) (100) 102 195 307 288
Non-Controlling Interest - 1 1 - 1 - - - -
Earnings per share:
- basic (US$) - - (0.77) (1.42) (1.28) 1.31 2.50 3.93 3.68
- diluted (US$) - - (0.77) (1.42) (1.28) 1.31 2.50 3.93 3.68
Dividend per share (US$) - - 0.75 0.75 - 0.20 0.75 1.18 1.11
Average shares outstanding - basic ('000s) - - 78,050 78,050 78,050 78,050 78,050 78,050 78,050
Average shares outstanding - diluted ('000s) - - 78,050 78,050 78,050 78,050 78,050 78,050 78,050
Consolidated EBITDA 226 410 399 217 292 532 579 687 664
Consolidated EBITDA % 5.3% 7.3% 6.3% 4.1% 5.7% 9.5% 9.8% 10.4% 9.5%
Attributable EBITDA 226 406 406 217 295 532 579 687 664
Consolidated EBIT (107) 93 88 (103) (11) 287 301 400 369
Consolidated EBIT % -2.5% 1.7% 1.4% -2.0% -0.2% 5.1% 5.1% 6.1% 5.3%
Attributable EBIT (107) 92 89 (103) (11) 287 301 400 369
Effective tax rate (%) 28% N/A 45% 37% 31% 24% 29% 20% 20%
Natural Resources
Initiating Coverage
8 January 2015
page 50 of 91 , Equity Analyst, +44 (0) 20 7029 8772, [email protected] Rosenfeld, CFA
Please see important disclosure information on pages 88 - 91 of this report.
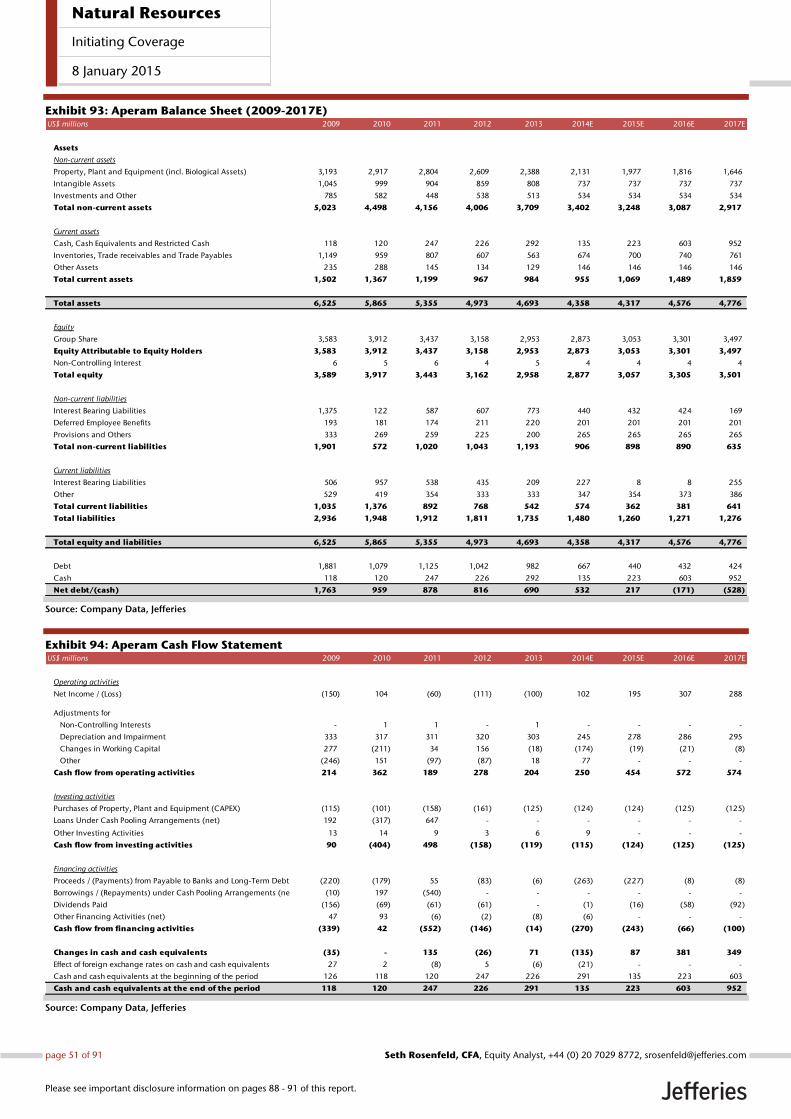
Exhibit 93: Aperam Balance Sheet (2009-2017E)
Source: Company Data, Jefferies
Exhibit 94: Aperam Cash Flow Statement
Source: Company Data, Jefferies
US$ millions 2009 2010 2011 2012 2013 2014E 2015E 2016E 2017E
Assets
Non-current assets
Property, Plant and Equipment (incl. Biological Assets) 3,193 2,917 2,804 2,609 2,388 2,131 1,977 1,816 1,646
Intangible Assets 1,045 999 904 859 808 737 737 737 737
Investments and Other 785 582 448 538 513 534 534 534 534
Total non-current assets 5,023 4,498 4,156 4,006 3,709 3,402 3,248 3,087 2,917
Current assets
Cash, Cash Equivalents and Restricted Cash 118 120 247 226 292 135 223 603 952
Inventories, Trade receivables and Trade Payables 1,149 959 807 607 563 674 700 740 761
Other Assets 235 288 145 134 129 146 146 146 146
Total current assets 1,502 1,367 1,199 967 984 955 1,069 1,489 1,859
Total assets 6,525 5,865 5,355 4,973 4,693 4,358 4,317 4,576 4,776
Equity
Group Share 3,583 3,912 3,437 3,158 2,953 2,873 3,053 3,301 3,497
Equity Attributable to Equity Holders 3,583 3,912 3,437 3,158 2,953 2,873 3,053 3,301 3,497
Non-Controlling Interest 6 5 6 4 5 4 4 4 4
Total equity 3,589 3,917 3,443 3,162 2,958 2,877 3,057 3,305 3,501
Non-current liabilities
Interest Bearing Liabilities 1,375 122 587 607 773 440 432 424 169
Deferred Employee Benefits 193 181 174 211 220 201 201 201 201
Provisions and Others 333 269 259 225 200 265 265 265 265
Total non-current liabilities 1,901 572 1,020 1,043 1,193 906 898 890 635
Current liabilities
Interest Bearing Liabilities 506 957 538 435 209 227 8 8 255
Other 529 419 354 333 333 347 354 373 386
Total current liabilities 1,035 1,376 892 768 542 574 362 381 641
Total liabilities 2,936 1,948 1,912 1,811 1,735 1,480 1,260 1,271 1,276
Total equity and liabilities 6,525 5,865 5,355 4,973 4,693 4,358 4,317 4,576 4,776
Debt 1,881 1,079 1,125 1,042 982 667 440 432 424
Cash 118 120 247 226 292 135 223 603 952
Net debt/(cash) 1,763 959 878 816 690 532 217 (171) (528)
US$ millions 2009 2010 2011 2012 2013 2014E 2015E 2016E 2017E
Operating activities
Net Income / (Loss) (150) 104 (60) (111) (100) 102 195 307 288
Adjustments for
Non-Controlling Interests - 1 1 - 1 - - - -
Depreciation and Impairment 333 317 311 320 303 245 278 286 295
Changes in Working Capital 277 (211) 34 156 (18) (174) (19) (21) (8)
Other (246) 151 (97) (87) 18 77 - - -
Cash flow from operating activities 214 362 189 278 204 250 454 572 574
Investing activities
Purchases of Property, Plant and Equipment (CAPEX) (115) (101) (158) (161) (125) (124) (124) (125) (125)
Loans Under Cash Pooling Arrangements (net) 192 (317) 647 - - - - - -
Other Investing Activities 13 14 9 3 6 9 - - -
Cash flow from investing activities 90 (404) 498 (158) (119) (115) (124) (125) (125)
Financing activities
Proceeds / (Payments) from Payable to Banks and Long-Term Debt (220) (179) 55 (83) (6) (263) (227) (8) (8)
Borrowings / (Repayments) under Cash Pooling Arrangements (net) (10) 197 (540) - - - - - -
Dividends Paid (156) (69) (61) (61) - (1) (16) (58) (92)
Other Financing Activities (net) 47 93 (6) (2) (8) (6) - - -
Cash flow from financing activities (339) 42 (552) (146) (14) (270) (243) (66) (100)
Changes in cash and cash equivalents (35) - 135 (26) 71 (135) 87 381 349
Effect of foreign exchange rates on cash and cash equivalents 27 2 (8) 5 (6) (21) - - -
Cash and cash equivalents at the beginning of the period 126 118 120 247 226 291 135 223 603
Cash and cash equivalents at the end of the period 118 120 247 226 291 135 223 603 952
Natural Resources
Initiating Coverage
8 January 2015
page 51 of 91 , Equity Analyst, +44 (0) 20 7029 8772, [email protected] Rosenfeld, CFA
Please see important disclosure information on pages 88 - 91 of this report.
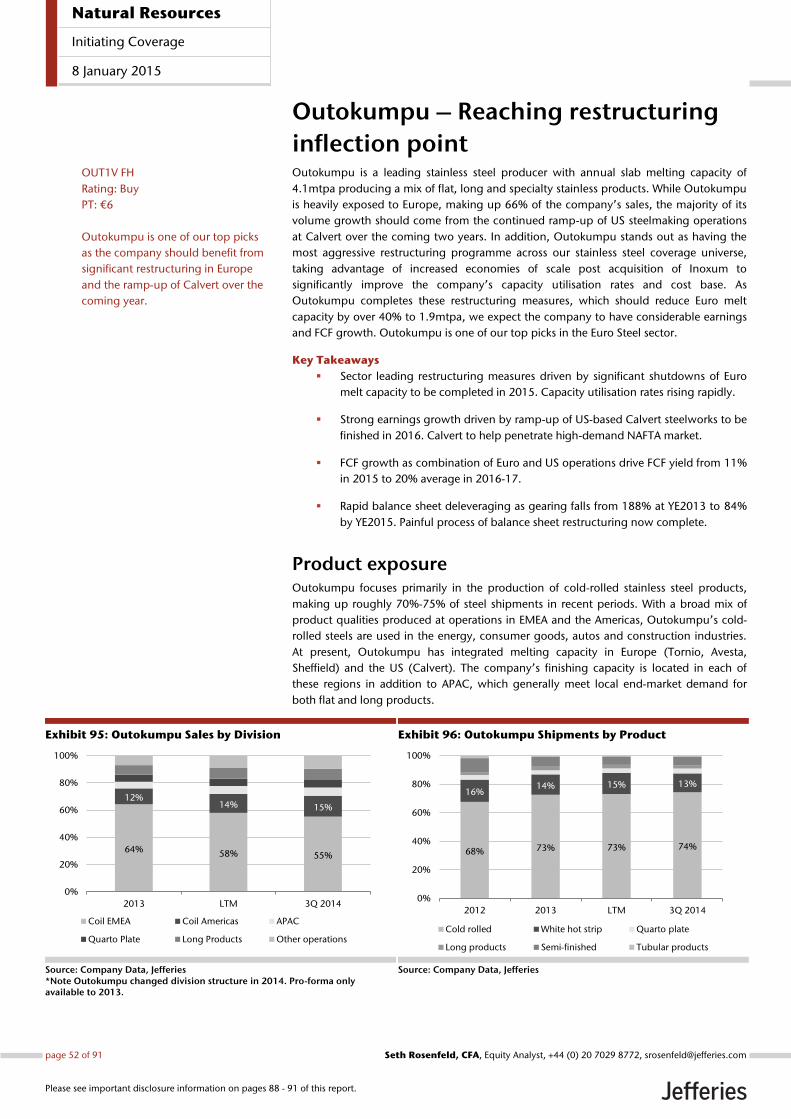
Outokumpu – Reaching restructuring
inflection point Outokumpu is a leading stainless steel producer with annual slab melting capacity of
4.1mtpa producing a mix of flat, long and specialty stainless products. While Outokumpu
is heavily exposed to Europe, making up 66% of the company’s sales, the majority of its
volume growth should come from the continued ramp-up of US steelmaking operations
at Calvert over the coming two years. In addition, Outokumpu stands out as having the
most aggressive restructuring programme across our stainless steel coverage universe,
taking advantage of increased economies of scale post acquisition of Inoxum to
significantly improve the company’s capacity utilisation rates and cost base. As
Outokumpu completes these restructuring measures, which should reduce Euro melt
capacity by over 40% to 1.9mtpa, we expect the company to have considerable earnings
and FCF growth. Outokumpu is one of our top picks in the Euro Steel sector.
Key Takeaways
Sector leading restructuring measures driven by significant shutdowns of Euro
melt capacity to be completed in 2015. Capacity utilisation rates rising rapidly.
Strong earnings growth driven by ramp-up of US-based Calvert steelworks to be
finished in 2016. Calvert to help penetrate high-demand NAFTA market.
FCF growth as combination of Euro and US operations drive FCF yield from 11%
in 2015 to 20% average in 2016-17.
Rapid balance sheet deleveraging as gearing falls from 188% at YE2013 to 84%
by YE2015. Painful process of balance sheet restructuring now complete.
Product exposure Outokumpu focuses primarily in the production of cold-rolled stainless steel products,
making up roughly 70%-75% of steel shipments in recent periods. With a broad mix of
product qualities produced at operations in EMEA and the Americas, Outokumpu’s cold-
rolled steels are used in the energy, consumer goods, autos and construction industries.
At present, Outokumpu has integrated melting capacity in Europe (Tornio, Avesta,
Sheffield) and the US (Calvert). The company’s finishing capacity is located in each of
these regions in addition to APAC, which generally meet local end-market demand for
both flat and long products.
Exhibit 95: Outokumpu Sales by Division
Source: Company Data, Jefferies *Note Outokumpu changed division structure in 2014. Pro-forma only available to 2013.
Exhibit 96: Outokumpu Shipments by Product
Source: Company Data, Jefferies
64% 58% 55%
12%14% 15%
0%
20%
40%
60%
80%
100%
2013 LTM 3Q 2014
Coil EMEA Coil Americas APAC
Quarto Plate Long Products Other operations
68% 73% 73% 74%
16%14% 15% 13%
0%
20%
40%
60%
80%
100%
2012 2013 LTM 3Q 2014
Cold rolled White hot strip Quarto plate
Long products Semi-finished Tubular products
OUT1V FH
Rating: Buy
PT: €6
Outokumpu is one of our top picks
as the company should benefit from
significant restructuring in Europe
and the ramp-up of Calvert over the
coming year.
Natural Resources
Initiating Coverage
8 January 2015
page 52 of 91 , Equity Analyst, +44 (0) 20 7029 8772, [email protected] Rosenfeld, CFA
Please see important disclosure information on pages 88 - 91 of this report.

The acquisition of Inoxum in 2012 served to significantly expand Outokumpu’s product
offerings, giving the company one of the broadest product portfolios in the market. Prior
to Inoxum, Outokumpu was heavily exposed to commodity grade austenitic steels used in
heavy industry, with the majority of sales to distributors and only 25%-30% of sales direct
to customers. Post-Inoxum, Outokumpu currently sells roughly 60% of volumes directly
to end-market customers and has significantly increased production of higher-margin
ferritic grades with exposure to the auto and white goods industries.
Exhibit 97: Direct Sales to End-Customers (2013)
Note: Direct sales represented 55% of total sales in 2013 Source: Company Data, Jefferies
Exhibit 98: Deliveries by Product Grade (2013)
Source: Company Data, Jefferies
In addition to a leading stainless steel business, Outokumpu operates the only chrome
mine in Europe at the Kemi Mine in Finland. Concentrate from Kemi is processed at the
company’s connected Ferrochrome Works, consisting of a sintering plant and three
smelting furnaces, and then used directly in steelmaking operations at Tornio, just 35km
away. With the benefits of this local and vertically integrated access to chrome, Tornio is
one of the lowest cost stainless steel production sites across Europe.
In 2013, Outokumpu invested in a third smelting furnace, doubling production to
530ktpa and allowing Kemi to now supply raw materials for all group production
globally, making up roughly 80% of output. All excess chrome production volumes are
sold to third parties, making up roughly 20% of production.
Consumer goods,
21%
Automotive, 17%
Architecture &
Building, 5%
Metal Processing,
21%
Heavy Industries,
29%
Other, 7%
Austenitic (CrNi)
58%
Austenitic (CrNiMo)
17%
Ferritic
19%
Duplex
3%
Other
3%
The acquisition of Inoxum in 2012
significantly increased Outokumpu’s
exposure to ferritic grades of
stainless steel, increasing exposure to
autos and white goods industries.
Outside of steelmaking, Outokumpu
also has a large chrome mine in
Finland, which provides for attractive
vertically integrated cost benefits for
European operations.
Natural Resources
Initiating Coverage
8 January 2015
page 53 of 91 , Equity Analyst, +44 (0) 20 7029 8772, [email protected] Rosenfeld, CFA
Please see important disclosure information on pages 88 - 91 of this report.
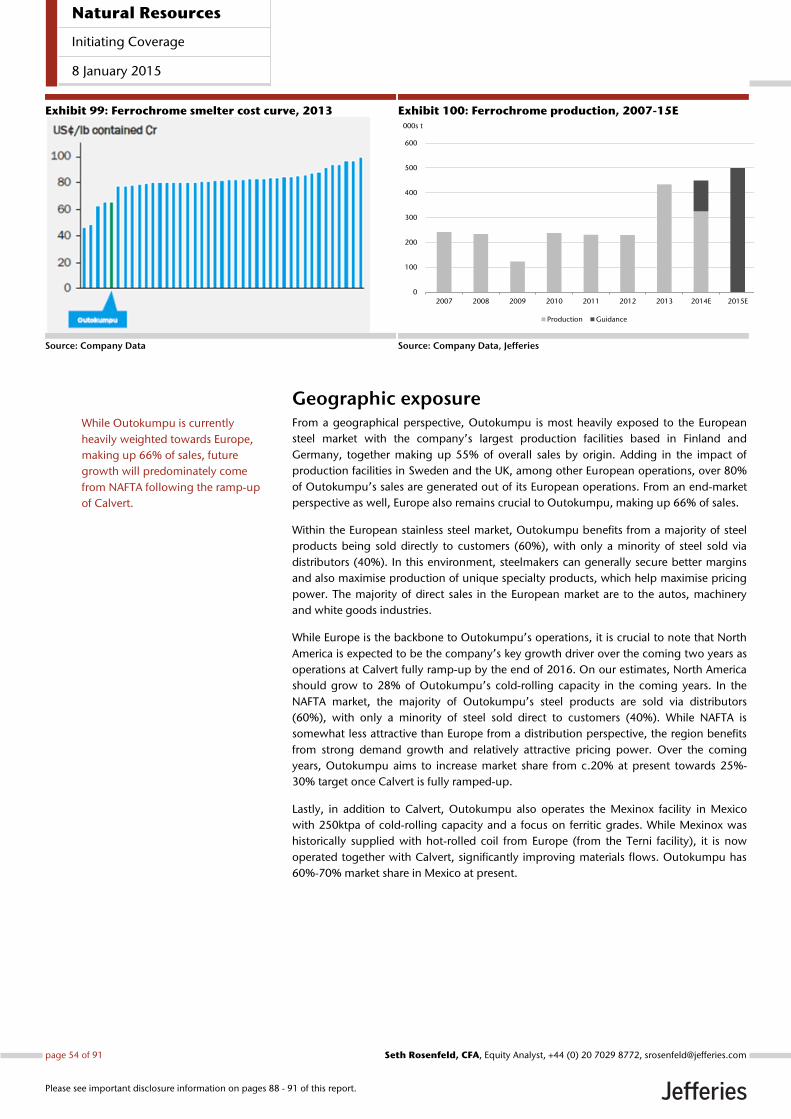
Exhibit 99: Ferrochrome smelter cost curve, 2013
Source: Company Data
Exhibit 100: Ferrochrome production, 2007-15E
Source: Company Data, Jefferies
Geographic exposure From a geographical perspective, Outokumpu is most heavily exposed to the European
steel market with the company’s largest production facilities based in Finland and
Germany, together making up 55% of overall sales by origin. Adding in the impact of
production facilities in Sweden and the UK, among other European operations, over 80%
of Outokumpu’s sales are generated out of its European operations. From an end-market
perspective as well, Europe also remains crucial to Outokumpu, making up 66% of sales.
Within the European stainless steel market, Outokumpu benefits from a majority of steel
products being sold directly to customers (60%), with only a minority of steel sold via
distributors (40%). In this environment, steelmakers can generally secure better margins
and also maximise production of unique specialty products, which help maximise pricing
power. The majority of direct sales in the European market are to the autos, machinery
and white goods industries.
While Europe is the backbone to Outokumpu’s operations, it is crucial to note that North
America is expected to be the company’s key growth driver over the coming two years as
operations at Calvert fully ramp-up by the end of 2016. On our estimates, North America
should grow to 28% of Outokumpu’s cold-rolling capacity in the coming years. In the
NAFTA market, the majority of Outokumpu’s steel products are sold via distributors
(60%), with only a minority of steel sold direct to customers (40%). While NAFTA is
somewhat less attractive than Europe from a distribution perspective, the region benefits
from strong demand growth and relatively attractive pricing power. Over the coming
years, Outokumpu aims to increase market share from c.20% at present towards 25%-
30% target once Calvert is fully ramped-up.
Lastly, in addition to Calvert, Outokumpu also operates the Mexinox facility in Mexico
with 250ktpa of cold-rolling capacity and a focus on ferritic grades. While Mexinox was
historically supplied with hot-rolled coil from Europe (from the Terni facility), it is now
operated together with Calvert, significantly improving materials flows. Outokumpu has
60%-70% market share in Mexico at present.
0
100
200
300
400
500
600
2007 2008 2009 2010 2011 2012 2013 2014E 2015E
000s t
Production Guidance
While Outokumpu is currently
heavily weighted towards Europe,
making up 66% of sales, future
growth will predominately come
from NAFTA following the ramp-up
of Calvert.
Natural Resources
Initiating Coverage
8 January 2015
page 54 of 91 , Equity Analyst, +44 (0) 20 7029 8772, [email protected] Rosenfeld, CFA
Please see important disclosure information on pages 88 - 91 of this report.

Exhibit 101: Outokumpu Sales by Origin, 2013
Source: Company Data, Jefferies
Exhibit 102: Outokumpu Sales by Destination, 2013
Source: Company Data, Jefferies
Exhibit 103: Outokumpu Geographic Breakdown of Operations
Source: Company Data
Cost cutting and asset optimisation Core to the Outokumpu investment case in recent years has been its multi-pronged
approach to cost cutting and restructuring, which we expect to finally have a significant
positive impact on the bottom line beginning in 2015. In total, management targets cost
savings of €550m by 2017 (with €470m to be achieved in 2015) in addition to €400m of
working capital improvements. Cost-cutting programmes are primarily concentrated in
EMEA (c.80% of total) where there was the majority of overlap with Inoxum, but also
include cost cutting and headcount reduction efforts elsewhere in Outokumpu’s asset
portfolio. These steps will also serve to reduce the company’s European melting capacity
by over 40%, significantly improving utilisation rates.
Cost cutting and restructuring programmes can be separated into three key components
including:
Inoxum merger synergies
P250 cost cutting
EMEA Industrial Plan
Inoxum synergies: The acquisition of Inoxum from ThyssenKrupp in 2012 provided
Outokumpu with increased presence in the Americas and Asia, expanded its product
portfolio into ferritic grades and also expanded the company’s customer base from
Finland
31%
Germany
24%
Sweden
13%
UK
7%
Other Europe
6%
North
America
13%
Asia and
Australia
5%
Other
Countries
1% Germany
24%
Other Europe
29%
North
America
19%
Sweden
3%
UK
7%
Finland
3%
Asia and
Australia
14%
Other
Countries
1%
Outokumpu has implemented the
most aggressive restructuring
programme across our stainless
coverage universe, targeting €550m
of cost savings and €400m of
working capital improvements.
Natural Resources
Initiating Coverage
8 January 2015
page 55 of 91 , Equity Analyst, +44 (0) 20 7029 8772, [email protected] Rosenfeld, CFA
Please see important disclosure information on pages 88 - 91 of this report.

industrial segments to also include customer goods and appliances. While Inoxum and
Outokumpu’s product portfolios were largely complementary prior to acquisitions, there
were some overlaps in market presence. As a result, at the time of merger, Outokumpu
management targeted production capacity optimisation in Europe through the closure of
melt shops at Krefeld and Bochum in order to reduce excess capacity and improve
utilisation rates.
As part of this effort, the Krefeld melt shop was closed in December 2013, taking out
600ktpa of excess melting capacity. In addition, the Bochum melt shop was scheduled for
closure in 2016, taking out another 800ktpa of capacity.
Through these efforts, Outokumpu targeted annual synergies of €200m, and impressively
these are now on track to be completed two years ahead of schedule in FY15 rather than
FY17. In 2013, synergies beat targets coming in at €95m vs target of €75m and in 2014
management target total synergies of €170m. Impressively, the fundamental steps have
already been made for Outokumpu to achieve further cost gains in the year ahead, so
execution risk is limited.
P250 cost cutting: In response to the weak European stainless steel market outlook in
early 2013, Outokumpu announced the P150 cost-savings programme. P150 was meant
to act as a supplement to the Inoxum synergy plan (as discussed above) with a focus on
reducing fixed and variable costs through cutting the number of production shifts,
outsourcing support functions and centralising steel distribution. This plan originally
sought to target €150m in cost savings via headcount reductions (2,500 reduction from
2013-17), lower G&A expenses, and improved IT and procurement management. After
already achieving €180m of savings by 3Q14, the programme was recently upsized to
target €250m in savings by the end of 2015.
While headcount reductions have somewhat lagged expectations due to protracted union
negotiations, leaving the company one quarter behind targets, management expects to
be back on schedule in mid-2015 and to finish these headcount reductions by 2017.
Exhibit 104: Outokumpu Headcount Reductions
Source: Company Data
EMEA Industrial Plan: As the original Inoxum synergies were still in the process of
being realised, Outokumpu management announced in October 2013 a further EMEA
Industrial Plan that went even further to reduce excess production capacity and improve
cost competitiveness. Most importantly, closing of the Bochum melt shop was accelerated
to 2014 from the original 2016 time frame (though this was later pushed back to 2Q15
due to union negotiations).
In addition to the closure of Bochum, the EMEA Industrial Plan calls for a reduction of
annealing and pickling capacity at Tornio by 200ktpa in 2015, reduction of cold-rolling
capacity at Benrath by 300-350ktpa by 2016, and the closure of service centres in Spain
0
2,000
4,000
6,000
8,000
10,000
12,000
14,000
2012 2013 3Q14 2017E
-766 -176-3,500
Outokumpu targets 3,500
headcount reductions in the coming
years made up of 2,500 cuts from
the P250 programme and 1,000 cuts
from the EMEA Industrial Plan. While
reductions are currently one quarter
behind schedule, management
expects to be back on-track by mid-
2015.
Natural Resources
Initiating Coverage
8 January 2015
page 56 of 91 , Equity Analyst, +44 (0) 20 7029 8772, [email protected] Rosenfeld, CFA
Please see important disclosure information on pages 88 - 91 of this report.

and Germany. These steps will reduce a total of 1,000 jobs in Europe and drive cost
savings of €100m pa from the EMEA Industrial Plan to be realised from 2017 onwards.
As a result of these various restructuring measures, we expect Outokumpu to emerge
with a significantly improved operating base, having right-sized its production capacity
for the current demand environment. As shown below, by the completion of these
industrial measures, Outokumpu will have removed 1.4mt of melting capacity, 1.3mt of
hot-rolling capacity and 500ktpa of cold-rolling capacity from its European operating
base. This will see European melt shop capacity utilisation rise to >90% and cold-rolling
utilisation rise to >85% with significant positive impact on profitability, based on our
analysis.
Exhibit 105: Outokumpu Europe Restructuring
Source: Company Data
Exhibit 106: Outokumpu Global Capacity Utilisation Rate
Source: Company Data, Jefferies
0%
20%
40%
60%
80%
100%
2007 2008 2009 2010 2011 2012 2013 2014E 2015E 2016E 2017E
Utilisation
As European restructuring efforts
come to a close in 2015-16,
Outokumpu will have reduced
melting capacity by 42%, reduced
hot-rolling capacity by 36% and
reduced finishing capacity by 23%.
With meltshop capacity closures
completed in the coming two years,
we expect Outokumpu’s global
capacity utilisation rates to rise to
over 80% from below 60% at
present.
Natural Resources
Initiating Coverage
8 January 2015
page 57 of 91 , Equity Analyst, +44 (0) 20 7029 8772, [email protected] Rosenfeld, CFA
Please see important disclosure information on pages 88 - 91 of this report.

Growth opportunities Looking forward, the single most important area of growth for Outokumpu is the ramp-
up of steelmaking operations at Calvert, which were purchased as part of its acquisition of
Inoxum from ThyssenKrupp. Prior to Inoxum, Outokumpu had very limited operations in
the US with only sales operations located domestically, which distributed finished steel
products from the company’s European operations.
The acquisition of Calvert from ThyssenKrupp brought Outokumpu a large-scale
steelmaking operation with melting capacity of 900ktpa, hot-rolling capacity of 870ktpa
(on long-term contract from MT/Nippon) and cold-rolling capacity of 350ktpa. The facility
was built by ThyssenKrupp as part of its botched Steel Americas investment for a total of
€1.2b with all capex completed prior to acquisition. While the rolling mill at Calvert
began production in late 2010 and the melt shop started operations in 2012, commercial
production has ramped-up far slower than expected in years since with lower-than-
targeted capacity utilisation rates and disappointing earnings. Looking forward, we expect
2015 to be a key turning point for Outokumpu at Calvert.
Following some technical/electrical issues in mid-2014 affecting one of three cold-rolling
lines, technical ramp-up of Calvert was completed in late 2014 including expansion to
ferritic and 72” width products. Following this technical ramp-up, Calvert is now
operating at roughly 50% utilisation rate at the melt shop. With technical ramp-up largely
complete, commercial ramp-up is the crucial next step and is expected to be completed
by 2016 as Outokumpu secures a stable and high quality domestic customer base,
making 2015 a key transition year for the operations. Once fully ramped-up, Outokumpu
targets 25%-30% market share in the NAFTA region, up from c.20% at present.
Exhibit 107: Coil Americas - Growing Product Portfolio
Source: Company Data
The theme of materials flow is crucial to the outlook for Calvert. Over recent years,
Calvert’s melting capacity has operated at low utilisation rates as Outokumpu was forced
to sustain production at Terni (Italy) and ship feedstock to operations in the US and
Mexico. With the last contractual shipment from Terni received in March 2014, Calvert is
increasingly self-sufficient in terms of feedstock needs. Concurrently, the increase in cold-
rolled production at Calvert has eliminated the need for imports of cold-rolled products
from the EMEA mills into the Americas. Eliminating imports of both feedstock and finished
cold-rolled products has reduced lead times (to four weeks from five months), operational
costs and working capital needs, thus improving customer convenience as well as
profitability.
The key driver of volume growth at
Outokumpu over the coming two
years is ramp-up of the US-based
Calvert steelworks.
While Outokumpu has already
developed a foothold in the NAFTA
market through operation of
Mexinox in recent years, the addition
of Calvert should provide
Outokumpu with a sector-leading
product suite.
Natural Resources
Initiating Coverage
8 January 2015
page 58 of 91 , Equity Analyst, +44 (0) 20 7029 8772, [email protected] Rosenfeld, CFA
Please see important disclosure information on pages 88 - 91 of this report.

Exhibit 108: Improving Material Flow Driven by Calvert Ramp-Up
Source: Company Data
From a fundamental perspective, Calvert should over time become one of the most
competitive steelmaking operations in Outokumpu’s portfolio. Calvert produces mostly
austenitic grades of stainless steel with roughly 70% sold into the relatively attractive US
market and with high exposure to the strong domestic auto, heavy industry and
chemicals markets. From a cost perspective, Calvert is also very well positioned with a
particularly high percentage of stainless steel scrap (80%-85%) used in production and
low transport costs given close proximity to scrap suppliers in the US.
Balance sheet & FCF generation Working capital management: As discussed earlier, Outokumpu has developed a
very successful track record of cost cutting over the past three years, targeting roughly
€470m of annualised cost savings in 2015 and upsizing current cost-cutting targets to
€550m by 2017. In addition to these cost-cutting programmes, reduction in working
capital has been another key management focus since the first major programme was
announced in 2011 targeting a €250m release of excess cash tied in inventories by mid-
2013, thus reducing the inventory days to 90 from 100.
Outokumpu’s initial working capital programme was very effective, exceeding the
original target by around €350m by end of 2012, thus freeing a total €600m from
inventories (as compared with June 2011) and reducing inventory days to 87. Further
working capital reduction of €286m resulted from improved management of payables/
receivables, and the programme was called-off at end of the year (due to attainment of
targets and acquisition of Inoxum) with the intent of introducing a substitute in some
time.
In early 2013, Outokumpu announced a new working capital management programme
meant to reduce working capital by a further €300m over the subsequent two years.
While implementation was initially disrupted by necessary inventory build due to higher
raw materials prices, in 3Q14 management reconfirmed 2014 targets and further
extended the programme to target an additional €100m of working capital reduction by
the end of 2015.
Profitability of Outokumpu’s Coil
Americas business unit was
historically hampered by the
required import of slabs and cold-
rolled products from Europe. With
material flows from Europe to the US
now cut off and Coil Americas
operating on an independent basis,
we expect profitability to rapidly
increase in the coming years.
As part of Outokumpu’s cost-cutting
efforts in recent years, the company
has significantly reduced working
capital and inventory days.
Natural Resources
Initiating Coverage
8 January 2015
page 59 of 91 , Equity Analyst, +44 (0) 20 7029 8772, [email protected] Rosenfeld, CFA
Please see important disclosure information on pages 88 - 91 of this report.

Exhibit 109: Outokumpu Inventory Days
Source: Company Data
Improved liquidity: While Outokumpu’s balance sheet has been somewhat strained
since the time of the global financial crisis, financial restructuring has gained steam
following acquisition of Inoxum. First, over the past two years, Outokumpu has extended
the maturity schedules on roughly €1.5b of outstanding debt, with most terms now
pushed out until 2017 after a €250m bond offering in September 2014 pushed out
maturities. Second, over the past three years, Outokumpu has opportunistically divested
its stakes in small non-core assets, raising over €400m.
Exhibit 110: Outokumpu Disposal History
Source: Company Data, Jefferies
Lastly, as part of Outokumpu’s negotiations with ThyssenKrupp over the final handling of
its acquisition of Inoxum last year, the two parties agreed to the cancellation of a €1.3b
ThyssenKrupp loan note in exchange for Terni and VDM, significantly reducing
Outokumpu’s gearing from 188% to 76% from YE2013 to 1Q14. At the same time as
these transactions with ThyssenKrupp, Outokumpu also completed a €640m rights issue
in April 2014 in order to further strengthen its balance sheet and liquidity.
Date Asset Consideration Buyer
Dec 2013 Luvata loan receivable $157mm cash Proventus Capital
Dec 2013 Electricity distribution network at Tornio site,
Finland
€63mm cash InfraVia European Fund II
Sep 2012 10 of 20 European stock operations ~€15-20mm Amari
Jun 2012 Brass rod plant in Drünen, Netherlands
Dec 2011 Rights to royalties from the Forrestania nickel
and precious metals resources
€23mm Western Areas NL
Nov 2011 Whole of its 50% stake in Nordic Brass Gusum
brass mill, Sweden
Jun 2011 Whole of the 4.3% stake in Talvivaara Mining
Company Plc
€60mm cash Solidium Oy
Jun 2011 1/5th of the 20% stake in Talvivaara Sotkamo
Ltd
€60mm Talvivaara Mining
Company Plc
May 2011 Whole of 15% holding in Tibnor AB €44mm cash SSAB
While Outokumpu still has a
somewhat strained balance sheet,
management has made great
success in reducing gearing and
terming out existing debt over the
past year.
Natural Resources
Initiating Coverage
8 January 2015
page 60 of 91 , Equity Analyst, +44 (0) 20 7029 8772, [email protected] Rosenfeld, CFA
Please see important disclosure information on pages 88 - 91 of this report.
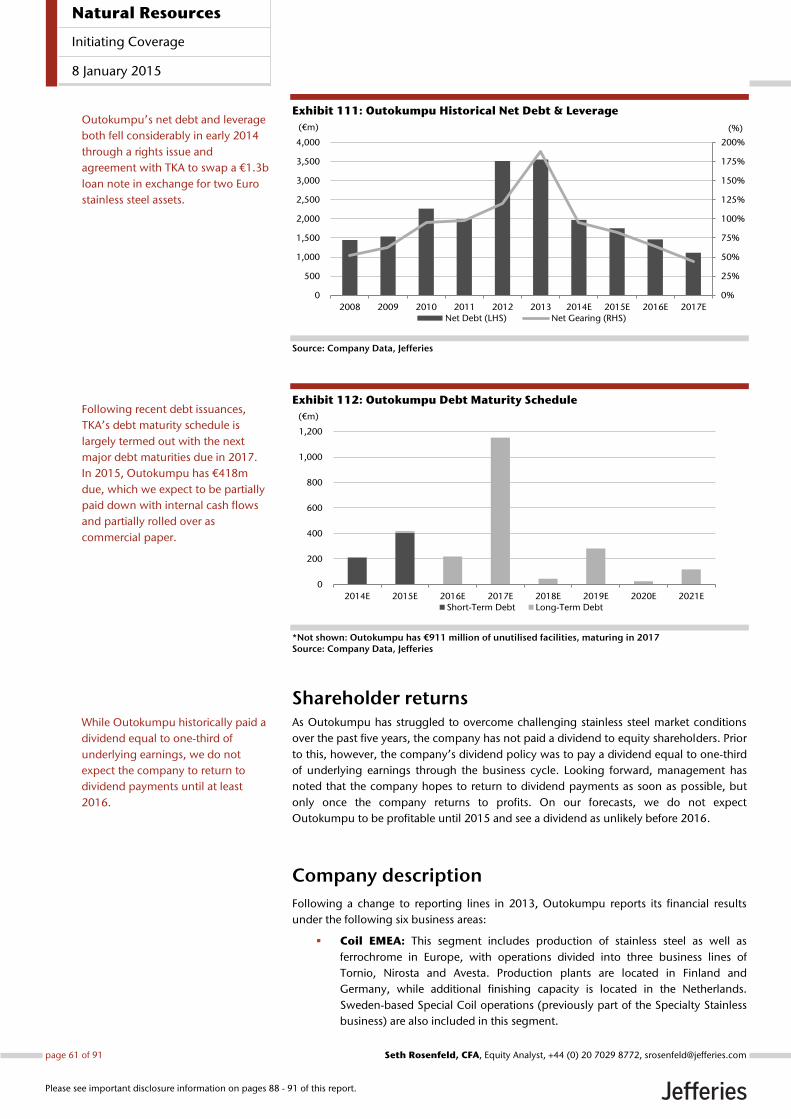
Exhibit 111: Outokumpu Historical Net Debt & Leverage
Source: Company Data, Jefferies
Exhibit 112: Outokumpu Debt Maturity Schedule
*Not shown: Outokumpu has €911 million of unutilised facilities, maturing in 2017 Source: Company Data, Jefferies
Shareholder returns As Outokumpu has struggled to overcome challenging stainless steel market conditions
over the past five years, the company has not paid a dividend to equity shareholders. Prior
to this, however, the company’s dividend policy was to pay a dividend equal to one-third
of underlying earnings through the business cycle. Looking forward, management has
noted that the company hopes to return to dividend payments as soon as possible, but
only once the company returns to profits. On our forecasts, we do not expect
Outokumpu to be profitable until 2015 and see a dividend as unlikely before 2016.
Company description
Following a change to reporting lines in 2013, Outokumpu reports its financial results
under the following six business areas:
Coil EMEA: This segment includes production of stainless steel as well as
ferrochrome in Europe, with operations divided into three business lines of
Tornio, Nirosta and Avesta. Production plants are located in Finland and
Germany, while additional finishing capacity is located in the Netherlands.
Sweden-based Special Coil operations (previously part of the Specialty Stainless
business) are also included in this segment.
0%
25%
50%
75%
100%
125%
150%
175%
200%
0
500
1,000
1,500
2,000
2,500
3,000
3,500
4,000
2008 2009 2010 2011 2012 2013 2014E 2015E 2016E 2017E
(%)(€m)
Net Debt (LHS) Net Gearing (RHS)
0
200
400
600
800
1,000
1,200
2014E 2015E 2016E 2017E 2018E 2019E 2020E 2021E
(€m)
Short-Term Debt Long-Term Debt
Outokumpu’s net debt and leverage
both fell considerably in early 2014
through a rights issue and
agreement with TKA to swap a €1.3b
loan note in exchange for two Euro
stainless steel assets.
Following recent debt issuances,
TKA’s debt maturity schedule is
largely termed out with the next
major debt maturities due in 2017.
In 2015, Outokumpu has €418m
due, which we expect to be partially
paid down with internal cash flows
and partially rolled over as
commercial paper.
While Outokumpu historically paid a
dividend equal to one-third of
underlying earnings, we do not
expect the company to return to
dividend payments until at least
2016.
Natural Resources
Initiating Coverage
8 January 2015
page 61 of 91 , Equity Analyst, +44 (0) 20 7029 8772, [email protected] Rosenfeld, CFA
Please see important disclosure information on pages 88 - 91 of this report.

Coil Americas: This business area consists of stainless steel production units in
the US and Mexico, and a service centre in Argentina. The largest contributor to
the Coil Americas business is the integrated steelmaking operation at Calvert,
consisting of melting, hot-rolling and cold-rolling capacity. Production from
Calvert is used domestically in the US market and is also finished at local cold-
rolling facilities at Mexinox.
APAC: The APAC business area comprises a cold-rolling facility and also
coil/plate service centre in China, as well as a coil service centre in Australia. The
segment mostly produces stainless steel flat products for the Chinese market.
The Shanghai Krupp Stainless (SKS) business is a 60:40 JV with Baosteel.
Quarto Plate: This business area consists of quarto plates (hot-rolled plates)
produced in Sweden and in the US.
Long Products: Outokumpu produces long products at integrated melting
and casting operations in the UK, as well as in rolling and finishing units in
Sweden and the US.
Other operations: This business area earns revenue from the sale of electricity
and services to third parties as well as internal commissions. These activities are
not allocated to the five main business areas and also include business
development and corporate management expenses.
Exhibit 113: Outokumpu Organizational Chart
Source: Outokumpu
Company risks Outokumpu faces various risks that are tied to company-specific factors as well as broader
industry-wide challenges. From a company-specific perspective, the greatest risks facing
Outokumpu in 2015 are a failure to successfully ramp-up operations at Calvert on
schedule and budget, and a failure to further de-lever its balance sheet in line with
expectations. From an industry-wide perspective, the greatest risks facing Outokumpu are
falling prices and demand for both stainless steel and nickel.
Natural Resources
Initiating Coverage
8 January 2015
page 62 of 91 , Equity Analyst, +44 (0) 20 7029 8772, [email protected] Rosenfeld, CFA
Please see important disclosure information on pages 88 - 91 of this report.

Exhibit 114: Outokumpu Corporate History
Source: Company Data
Date Event
1910 Copper ore deposit was discovered at Kuusjärvi , a town in Eastern Finland. Production started a few years later and gathered
pace after World War I. The company was a state-owned enterprise.
1930s Outokumpu became a limited company in 1932 to boost development of its operations. In subsequent years, it built an
integrated copper chain by opening a new electric smelting plant and a metal works to refine raw copper, and became one of
the top five producers of copper in Europe.
1950s-1960s Outokumpu started many new nickel, zinc and copper mines and cobalt works in Finland, together with refining operations. In
1960, the company began mining Chromium ore in Kemi and feeding it into its ferrochrome smelter in nearby Tornio. Thus, the
company secured access to all key raw materials of stainless steel during these years.
1976 The company commenced stainless steel production at Tornio.
1980s Outokumpu embarked on a spate of international acquisitions to supplement its depleting resource base in Finland. It began
operating the Viscaria copper mine in Sweden in 1982. The company bought 75% stake in Tara zinc mine in Ireland in 1986 and
gained full control in 1989 when Irish government sold the remaining 25% stake. It also acquired a number of semi-product
facilities in Spain, Sweden and USA around this time.
1988 Outokumpu shares were listed on Helsinki stock exchange.
2000 The group decided to focus on stainless steel and sell its other operations in due course. In line with this, the group agreed to a
merger of Outokumpu Steel and Avesta Sheffield to form AvestaPolarit, an independent stainless steel company, in which the
group held 52.4% stake.
2002 AvestaPolarit became a wholly-owned subsidiary of Outokumpu as the latter bought 23.2% stake of Corus as well as the
remaining minority stake through a redemption offer. AvestaPolarit shares were delisted from Stockholm and Helsinki stock
exchanges.
2004 The group sold its zinc and copper mining and smelting operations to the Swedish company Boliden.
2005 Outokumpu sold its fabricated copper products business (excluding the tube and brass division) Outokumpu Copper Products
to private equity firm Nordic Capital for €599mm. It also divested its entire shareholding in Boliden.
Oct 2006 The group spun-off metals and minerals processing technology solutions business Outokumpu Technology by listing it on
Helsinki stock exchange and selling 88% stake in a public offer. Outokumpu Technology changed its name to Outotec in April
2007.
Apr 2008 Outokumpu completely exited copper business by selling its copper tube and brass division to Cupori Group for € 50mm.
Dec 2012 The company completed acquisition of ThyssenKrupp stainless steel subsidiary Inoxum for €2.7bn, subject to the condition laid
down by the European Commission for sale of Terni assets . Outokumpu’s earlier product range comprised mainly austenitic and
duplex grades, while that of Inoxum was focused on ferritic grades and high-performance alloys. The deal comprised €1bn cash,
€1.25bn loan note and shares. As a result of the share consideration (~621mm shares), ThyssenKrupp became a major
shareholder in Outokumpu, holding 29.9% stake.Major operations acquired included Nirosta business unit with assets in
Germany, Calvert and Mexinox in the US, Shanghai Krupp Stainless JV in China, Terni in Italy and VDM in Germany.
Jan 2013 Tubinoxia increased its share in the OSTP (Outokumpu Stainless Tubular Products) JV by 15% to 51%, lowering Outokumpu’s
stake to 49%. The JV arrangement was initially agreed upon in July 2011, wherein Tubinoxia began with a 36% stake in OSTP,
which was completely owned by Outokumpu previously.
30 Nov 2013 The company announced the divestment of Terni (remedy) assets and VDM business (after strategic review) to ThyssenKrupp in
exchange for cancellation of the loan note it furnished to the latter while acquiring Inoxum (~€1.27bn as of 30 September 2013).
The divestment was completed on 28 February 2014. Concurrently, ThyssenKrupp divested its 29.9% shareholding in
Outokumpu to comply with the European Commission requirements. Part of that stake was acquired by Solidium, which now
became Outokumpu’s largest shareholder with 29.9% stake.
Natural Resources
Initiating Coverage
8 January 2015
page 63 of 91 , Equity Analyst, +44 (0) 20 7029 8772, [email protected] Rosenfeld, CFA
Please see important disclosure information on pages 88 - 91 of this report.
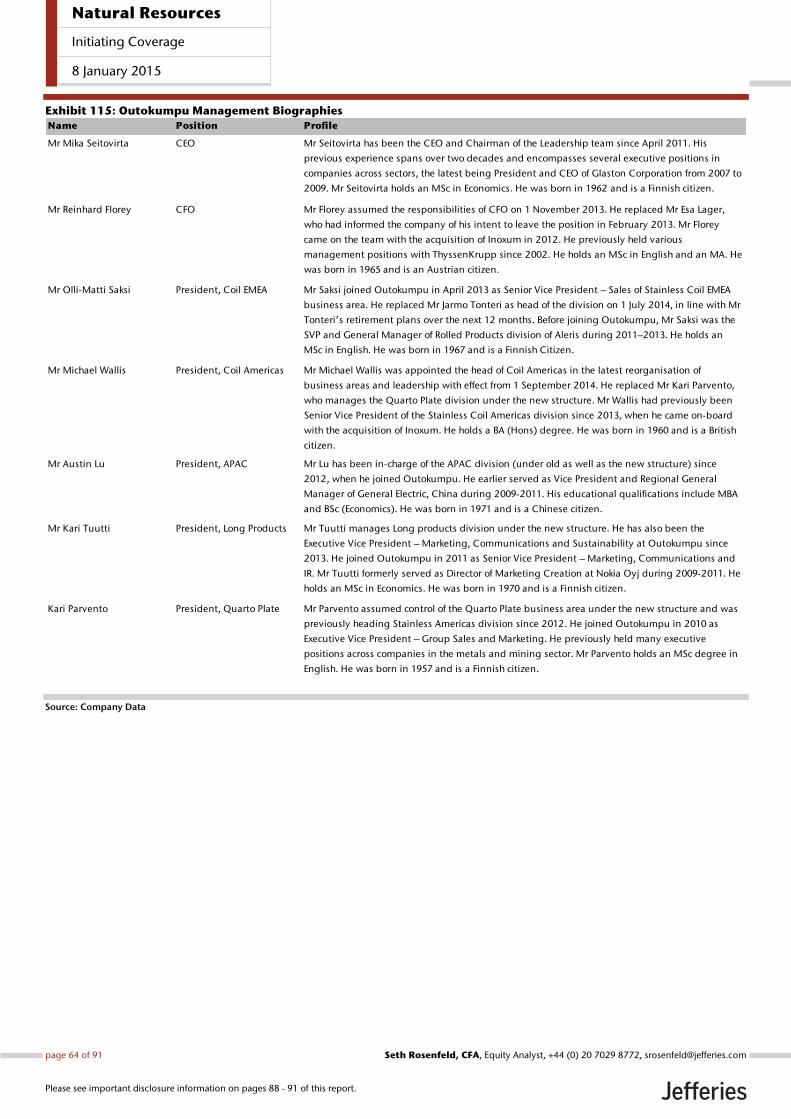
Exhibit 115: Outokumpu Management Biographies
Source: Company Data
Name Position Profile
Mr Mika Seitovirta CEO Mr Seitovirta has been the CEO and Chairman of the Leadership team since April 2011. His
previous experience spans over two decades and encompasses several executive positions in
companies across sectors, the latest being President and CEO of Glaston Corporation from 2007 to
2009. Mr Seitovirta holds an MSc in Economics. He was born in 1962 and is a Finnish citizen.
Mr Reinhard Florey CFO Mr Florey assumed the responsibilities of CFO on 1 November 2013. He replaced Mr Esa Lager,
who had informed the company of his intent to leave the position in February 2013. Mr Florey
came on the team with the acquisition of Inoxum in 2012. He previously held various
management positions with ThyssenKrupp since 2002. He holds an MSc in English and an MA. He
was born in 1965 and is an Austrian citizen.
Mr Olli-Matti Saksi President, Coil EMEA Mr Saksi joined Outokumpu in April 2013 as Senior Vice President – Sales of Stainless Coil EMEA
business area. He replaced Mr Jarmo Tonteri as head of the division on 1 July 2014, in line with Mr
Tonteri’s retirement plans over the next 12 months. Before joining Outokumpu, Mr Saksi was the
SVP and General Manager of Rolled Products division of Aleris during 2011–2013. He holds an
MSc in English. He was born in 1967 and is a Finnish Citizen.
Mr Michael Wallis President, Coil Americas Mr Michael Wallis was appointed the head of Coil Americas in the latest reorganisation of
business areas and leadership with effect from 1 September 2014. He replaced Mr Kari Parvento,
who manages the Quarto Plate division under the new structure. Mr Wallis had previously been
Senior Vice President of the Stainless Coil Americas division since 2013, when he came on-board
with the acquisition of Inoxum. He holds a BA (Hons) degree. He was born in 1960 and is a British
citizen.
Mr Austin Lu President, APAC Mr Lu has been in-charge of the APAC division (under old as well as the new structure) since
2012, when he joined Outokumpu. He earlier served as Vice President and Regional General
Manager of General Electric, China during 2009-2011. His educational qualifications include MBA
and BSc (Economics). He was born in 1971 and is a Chinese citizen.
Mr Kari Tuutti President, Long Products Mr Tuutti manages Long products division under the new structure. He has also been the
Executive Vice President – Marketing, Communications and Sustainability at Outokumpu since
2013. He joined Outokumpu in 2011 as Senior Vice President – Marketing, Communications and
IR. Mr Tuutti formerly served as Director of Marketing Creation at Nokia Oyj during 2009-2011. He
holds an MSc in Economics. He was born in 1970 and is a Finnish citizen.
Kari Parvento President, Quarto Plate Mr Parvento assumed control of the Quarto Plate business area under the new structure and was
previously heading Stainless Americas division since 2012. He joined Outokumpu in 2010 as
Executive Vice President – Group Sales and Marketing. He previously held many executive
positions across companies in the metals and mining sector. Mr Parvento holds an MSc degree in
English. He was born in 1957 and is a Finnish citizen.
Natural Resources
Initiating Coverage
8 January 2015
page 64 of 91 , Equity Analyst, +44 (0) 20 7029 8772, [email protected] Rosenfeld, CFA
Please see important disclosure information on pages 88 - 91 of this report.

Exhibit 116: Outokumpu Segmental Summary (2013-2017E)
Source: Company Data, Bloomberg, Factset, Jefferies
2013 1Q14 2Q14 3Q14 4Q14E 2014E 2015E 2016E 2017E
Coil EMEA
Stainless Steel Deliveries (000s t) 1,855 469 443 413 434 1,759 1,728 1,607 1,574
Revenue (€m) 5,067 1,169 1,161 1,134 1,209 4,673 4,779 4,739 4,860
EBITDA (€m) 55 (54) 58 74 67 145 384 485 513
EBITDA Margin (%) 1.1% -4.6% 5.0% 6.5% 5.6% 3.1% 8.0% 10.2% 10.6%
EBITDA per tonne (€/t) 30 (115) 131 179 155 83 222 302 326
EBIT (€m) (166) (134) 7 27 18 (82) 192 304 336
Capex (€m) 80 9 19 18 30 76 60 60 60
Coil Americas
Stainless Steel Deliveries (000s t) 466 135 143 147 103 528 554 576 599
Revenue (€m) 907 254 291 316 243 1,104 1,240 1,355 1,452
EBITDA (€m) (201) (19) 1 (12) (34) (64) 26 86 101
EBITDA Margin (%) -22% -7% 0% -4% -14% -6% 2% 6% 7%
EBITDA per tonne (€/t) (431) (141) 7 (82) (328) (121) 47 149 169
EBIT (€m) (269) (36) (17) (29) (50) (132) (46) 11 24
Capex (€m) 44 2 2 3 12 19 20 20 20
APAC
Stainless Steel Deliveries (000s t) 183 48 58 60 60 226 240 249 259
Revenue (€m) 387 88 118 124 136 466 549 569 611
EBITDA (€m) 8 (2) 4 2 9 13 79 83 95
EBITDA Margin (%) 2% -2% 3% 2% 7% 3% 14% 15% 16%
EBITDA per tonne (€/t) 44 (42) 69 33 150 58 331 333 368
EBIT (€m) (8) (5) 1 (2) 6 0 67 70 82
Capex (€m) 4 0 0 0 5 5 12 12 12
Quarto Plate
Stainless Steel Deliveries (000s t) 83 24 25 24 23 96 115 138 145
Revenue (€m) 407 102 114 113 104 433 528 659 724
EBITDA (€m) 2 2 (5) (1) (7) (11) 5 30 52
EBITDA Margin (%) 0% 2% -4% -1% -7% -3% 1% 5% 7%
EBITDA per tonne (€/t) 24 83 (200) (42) (304) (114) 45 217 360
EBIT (€m) (17) (2) (9) (6) (12) (29) (19) 3 24
Capex (€m) 34 2 5 2 12 21 32 32 32
Long Products
Stainless Steel Deliveries (000s t) 214 65 80 60 61 266 276 287 298
Revenue (€m) 556 149 203 171 169 692 768 831 904
EBITDA (€m) (4) 2 16 10 0 28 48 63 84
EBITDA Margin (%) -1% 1% 8% 6% 0% 4% 6% 8% 9%
EBITDA per tonne (€/t) (19) 31 200 167 4 106 175 220 281
EBIT (€m) (11) 0 14 8 (1) 21 44 58 79
Capex (€m) 8 1 2 2 5 10 20 20 20
Other Operations/Eliminations
Stainless Steel Deliveries (000s t) (215) (65) (74) (60) (58) (257) (248) (243) (245)
Revenue (€m) (578) (145) (133) (60) (45) (383) (343) (371) (430)
EBITDA (€m) (25) (7) (4) (6) (3) (20) (17) (19) (21)
EBITDA Margin (%) 4% 5% 3% 10% 7% 5% 5% 5% 5%
EBIT (€m) (39) (11) (6) (7) (5) (29) (25) (27) (32)
Capex (€m) 13 1 5 0 5 11 12 12 12
Group
Stainless Steel Deliveries (000s t) 2,586 676 675 644 623 2,618 2,664 2,613 2,631
Revenue (€m) 6,746 1,617 1,754 1,798 1,818 6,987 7,522 7,782 8,121
EBITDA (€m) (165) (78) 70 67 33 92 525 728 824
EBITDA Margin (%) -2% -5% 4% 4% 2% 1% 7% 9% 10%
EBITDA per tonne (€/t) (59) (111) 100 100 50 34 190 267 301
EBIT (€m) (510) (188) (10) (9) (44) (251) 212 420 513
Capex (€m) 183 15 33 25 69 142 156 156 156
Net Debt (€m) 3,556 1,734 2,068 2,068 1,991 1,991 1,773 1,483 1,130
Natural Resources
Initiating Coverage
8 January 2015
page 65 of 91 , Equity Analyst, +44 (0) 20 7029 8772, [email protected] Rosenfeld, CFA
Please see important disclosure information on pages 88 - 91 of this report.

Exhibit 117: Outokumpu Income Statement (2009-2017E)
Note: Other operating income, costs and expenses and other operating expenses are included in cost of sales for forecast periods Source: Company Data, Jefferies
€ millions 2009 2010 2011 2012 2013 2014E 2015E 2016E 2017E
Sales 2,611 4,229 5,009 4,536 6,745 6,987 7,522 7,782 8,121
Cost of Sales (2,764) (4,051) (4,879) (4,504) (6,847) (6,931) (7,309) (7,362) (7,608)
Gross Margin (153) 178 130 32 (102) 56 212 420 513
Other Operating Income 28 45 47 25 31 43 - - -
Costs and Expenses (281) (279) (315) (315) (400) (260) - - -
Other Operating Expenses (32) (28) (113) (130) (40) (89) - - -
EBIT (438) (84) (251) (388) (510) (251) 212 420 513
Share of results in associated companies and JVs (12) (10) (5) - (1) 7 - - -
Financial Income and Expenses
Interest Income 17 16 33 13 13 5 3 10 11
Interest Expense (38) (53) (98) (79) (209) (133) (82) (78) (69)
Market Price Gains and Losses (2) 4 (120) (64) (38) (17) - - -
Other Financial Income 5 13 248 2 - 1 - - -
Other Financial Expenses (6) (29) (52) (10) (76) (82) (80) (80) (80)
Total Financial Income and Expenses (24) (49) 11 (138) (311) (226) (159) (149) (138)
Result Before Taxes (474) (143) (245) (526) (822) (470) 54 271 375
Income Taxes Benefit (Expense) 142 19 65 (12) (10) (6) (11) (54) (75)
Net result from Continuing Operations (332) (124) (180) (538) (832) (475) 43 217 300
Net result from Discontinued Operations (4) - - - (171) 11 - - -
Net Result (336) (124) (180) (538) (1,003) (464) 43 217 300
Attributable to Equity Holders of the Company (336) (123) (175) (535) (996) (460) 43 217 300
Non-Controlling Interest - (1) (5) (3) (7) (4) - - -
Earnings per share:
- basic (€) (1.86) (0.68) (0.62) (0.46) (0.48) (1.32) 0.10 0.52 0.72
- diluted (€) (1.86) (0.68) (0.62) (0.46) (0.48) (1.32) 0.10 0.52 0.72
Dividend per share (€) 0.35 0.25 - - - - - 0.10 0.18
Average shares outstanding - basic ('000s) 180,826 181,970 280,527 1,156,005 2,077,080 349,156 416,374 416,374 416,374
Average shares outstanding - diluted ('000s) 180,826 181,970 280,527 1,156,005 2,077,080 349,156 416,374 416,374 416,374
Consolidated EBITDA (212) 172 89 (50) (165) 92 525 728 824
Consolidated EBITDA % -8% 4% 2% -1% -2% 1% 7% 9% 10%
Underlying EBITDA - - - - - 213 525 728 824
Consolidated EBIT (438) (84) (251) (388) (510) (251) 212 420 513
Consolidated EBIT % -17% -2% -5% -9% -8% -4% 3% 5% 6%
Attributable EBIT (438) (83) (244) (386) (506) (249) 212 420 513
Effective tax rate (%) 30% 13% 27% N/A N/A -1% 20% 20% 20%
Natural Resources
Initiating Coverage
8 January 2015
page 66 of 91 , Equity Analyst, +44 (0) 20 7029 8772, [email protected] Rosenfeld, CFA
Please see important disclosure information on pages 88 - 91 of this report.
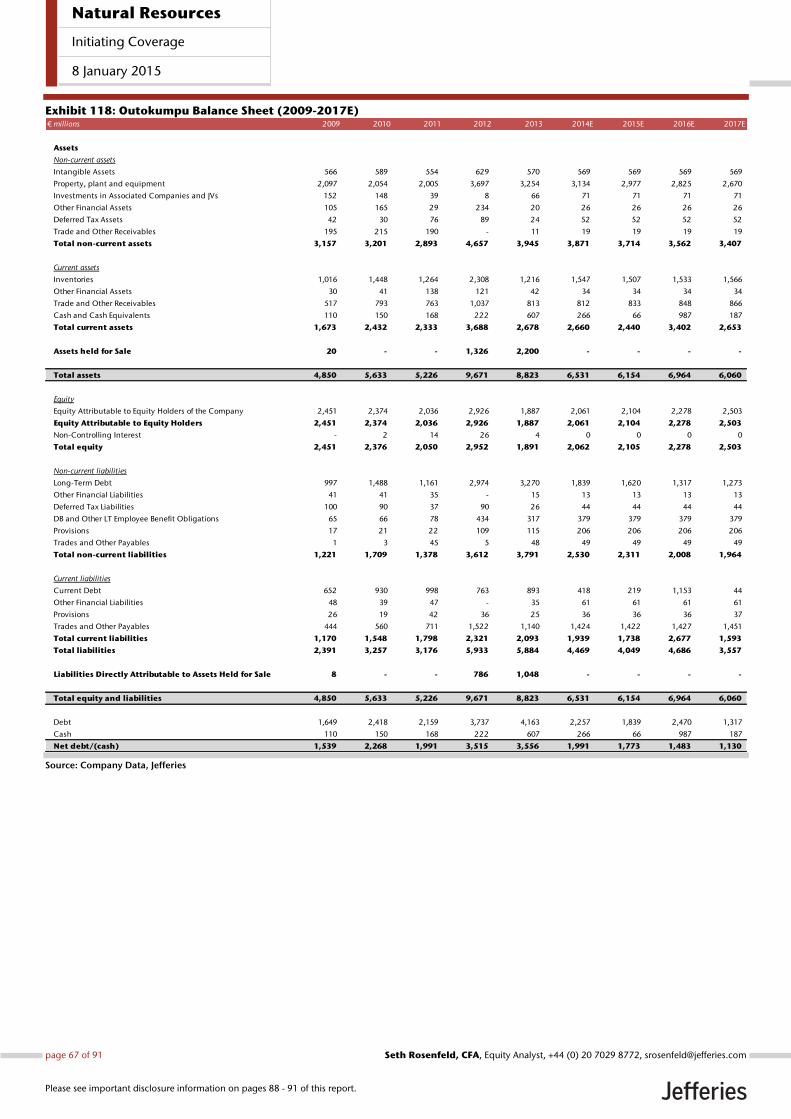
Exhibit 118: Outokumpu Balance Sheet (2009-2017E)
Source: Company Data, Jefferies
€ millions 2009 2010 2011 2012 2013 2014E 2015E 2016E 2017E
Assets
Non-current assets
Intangible Assets 566 589 554 629 570 569 569 569 569
Property, plant and equipment 2,097 2,054 2,005 3,697 3,254 3,134 2,977 2,825 2,670
Investments in Associated Companies and JVs 152 148 39 8 66 71 71 71 71
Other Financial Assets 105 165 29 234 20 26 26 26 26
Deferred Tax Assets 42 30 76 89 24 52 52 52 52
Trade and Other Receivables 195 215 190 - 11 19 19 19 19
Total non-current assets 3,157 3,201 2,893 4,657 3,945 3,871 3,714 3,562 3,407
Current assets
Inventories 1,016 1,448 1,264 2,308 1,216 1,547 1,507 1,533 1,566
Other Financial Assets 30 41 138 121 42 34 34 34 34
Trade and Other Receivables 517 793 763 1,037 813 812 833 848 866
Cash and Cash Equivalents 110 150 168 222 607 266 66 987 187
Total current assets 1,673 2,432 2,333 3,688 2,678 2,660 2,440 3,402 2,653
Assets held for Sale 20 - - 1,326 2,200 - - - -
Total assets 4,850 5,633 5,226 9,671 8,823 6,531 6,154 6,964 6,060
Equity
Equity Attributable to Equity Holders of the Company 2,451 2,374 2,036 2,926 1,887 2,061 2,104 2,278 2,503
Equity Attributable to Equity Holders 2,451 2,374 2,036 2,926 1,887 2,061 2,104 2,278 2,503
Non-Controlling Interest - 2 14 26 4 0 0 0 0
Total equity 2,451 2,376 2,050 2,952 1,891 2,062 2,105 2,278 2,503
Non-current liabilities
Long-Term Debt 997 1,488 1,161 2,974 3,270 1,839 1,620 1,317 1,273
Other Financial Liabilities 41 41 35 - 15 13 13 13 13
Deferred Tax Liabilities 100 90 37 90 26 44 44 44 44
DB and Other LT Employee Benefit Obligations 65 66 78 434 317 379 379 379 379
Provisions 17 21 22 109 115 206 206 206 206
Trades and Other Payables 1 3 45 5 48 49 49 49 49
Total non-current liabilities 1,221 1,709 1,378 3,612 3,791 2,530 2,311 2,008 1,964
Current liabilities
Current Debt 652 930 998 763 893 418 219 1,153 44
Other Financial Liabilities 48 39 47 - 35 61 61 61 61
Provisions 26 19 42 36 25 36 36 36 37
Trades and Other Payables 444 560 711 1,522 1,140 1,424 1,422 1,427 1,451
Total current liabilities 1,170 1,548 1,798 2,321 2,093 1,939 1,738 2,677 1,593
Total liabilities 2,391 3,257 3,176 5,933 5,884 4,469 4,049 4,686 3,557
Liabilities Directly Attributable to Assets Held for Sale 8 - - 786 1,048 - - - -
Total equity and liabilities 4,850 5,633 5,226 9,671 8,823 6,531 6,154 6,964 6,060
Debt 1,649 2,418 2,159 3,737 4,163 2,257 1,839 2,470 1,317
Cash 110 150 168 222 607 266 66 987 187
Net debt/(cash) 1,539 2,268 1,991 3,515 3,556 1,991 1,773 1,483 1,130
Natural Resources
Initiating Coverage
8 January 2015
page 67 of 91 , Equity Analyst, +44 (0) 20 7029 8772, [email protected] Rosenfeld, CFA
Please see important disclosure information on pages 88 - 91 of this report.

Exhibit 119: Outokumpu Cash Flow Statement
Source: Company Data, Jefferies
€ millions 2009 2010 2011 2012 2013 2014E 2015E 2016E 2017E
Operating activities
Net Result for the Year (336) (124) (180) (535) (1,004) (465) 43 217 300
Adjustments for
Depreciation and Amortization 211 235 235 335 347 347 313 308 311
Other Non-Cash Adjustments (215) (91) 46 142 497 149 90 123 133
Change in Working Capital 548 (477) 309 393 297 (25) 18 (35) (27)
Dividends Received 3 2 5 - 2 3 - - -
Interest Received 8 2 3 4 3 5 3 10 11
Interest Paid (57) (42) (75) (71) (105) (117) (82) (78) (69)
Income Taxes Paid 36 (2) (6) - (3) 2 (11) (54) (75)
Cash flow from operating activities 198 (497) 337 268 33 (102) 374 490 584
Investing activities
Purchases of Assets (209) (159) (197) (303) (287) (158) (156) (156) (156)
Proceeds from the sale of subsidiaries, net of cash - - - (896) (1) (51) - - -
Proceeds from the sale of assets (8) 12 84 1 187 16 - - -
Other investing cash flow - - - - (7) 1 - - -
Cash flow from investing activities (217) (147) (113) (1,198) (108) (193) (156) (156) (156)
Financing activities
Rights issue 4 - - 971 - 640 - - -
Borrowings of long-term debt 69 694 178 611 1,114 1,019 - - -
Repayment of long-term debt (345) (181) (371) (396) (708) (1,245) (219) (303) (44)
Change in current debt 212 209 (123) (188) 52 (454) (199) 934 (1,109)
Other financing cash flow (36) (46) 111 (3) 1 (0) - (43) (75)
Cash flow from financing activities (96) 676 (205) 995 459 (41) (418) 588 (1,228)
Changes in cash and cash equivalents (115) 32 19 65 384 (335) (200) 922 (800)
Effect of foreign exchange rates on cash and cash equivalents 3 6 - (11) (11) 6 - - -
Discontinued Operations Net Change in Cash Effect - - - - 12 (12) - - -
Cash and cash equivalents at the beginning of the period 224 112 150 168 222 607 266 66 987
Cash and cash equivalents at the end of the period 112 150 169 222 607 266 66 987 187
Natural Resources
Initiating Coverage
8 January 2015
page 68 of 91 , Equity Analyst, +44 (0) 20 7029 8772, [email protected] Rosenfeld, CFA
Please see important disclosure information on pages 88 - 91 of this report.

Acerinox – Leading US Exposure, But
Growth Outlook Unclear Acerinox is one of the leading global stainless steel producers with annual slab melting
capacity of 3.5mtpa and cold-rolling capacity of 2.4mtpa, producing a mix of flat and
long stainless steel products. With over 40% of sales coming from the US, Acerinox has
among the highest exposures to the relatively buoyant US market across our coverage
universe. In addition, the ongoing ramp-up of Bahru Stainless in Malaysia should help
provide Acerinox exposure to the relatively high-growth Asian market. While Acerinox is a
high-quality operator, in light of the company’s premium valuation and risk to US market
share, the company is not one of our preferred Euro stainless steel equities.
Key Takeaways
Historically benefited from leading market share in the buoyant US market.
However, the company could lose market share as Calvert ramps up in 2015-16.
The key growth driver for Acerinox is the potential expansion of Bahru Stainless.
However, this project is currently delayed due to regional instability.
Sector-leading shareholder returns having consistently paid a dividend equating
to c.4% divi yield. We see low risk to this divi moving forward.
With a premium valuation and uncertain growth outlook, we believe Acerinox is
already fairly valued.
Product trends While Acerinox has fared relatively better than many industry peers in years since the
global financial crisis, the impact of global slowdown in stainless steel demand is clearly
reflected in Acerinox’s historical production and capacity utilisation trends. Annual melt
shop production declined 30% from 2.6mt in 2006 to a trough of 1.8mt in 2009, with
operations at Campo de Gibraltar registering the largest slump in output (down 43%)
during this period. While European demand fell more than other regions in this period, all
three of Acerinox’s operations were ultimately significantly hit due to the ill-timed ramp-
up of capacity in years just prior to the global financial crisis at Columbus (South Africa) in
2007 and at NAS (US) in 2006 and 2008.
In the years since the global financial crisis, Acerinox’s crude steel production has
gradually recovered to a post-crisis trough of 1.8mt in 2009 to 2.4mt in 2014E driven by a
particularly strong resurgence in the North American stainless markets. At present, NAS is
running at near full capacity utilisation rates, well above Acerinox’s other operations and
above industry averages.
Exhibit 120: Acerinox Production and Capacity Utilisation
Source: Company Data, Jefferies
0%
10%
20%
30%
40%
50%
60%
70%
80%
90%
100%
0
500
1,000
1,500
2,000
2,500
3,000
3,500
4,000
Utilisation (%)Production (kt)
Melting HR CR Melting% HR% CR%
ACX SM
Rating: Hold
PT: €13
With a premium valuation, risks to
market share in the US and an
uncertain growth outlook in Asia, we
believe Acerinox is already fairly
valued.
Natural Resources
Initiating Coverage
8 January 2015
page 69 of 91 , Equity Analyst, +44 (0) 20 7029 8772, [email protected] Rosenfeld, CFA
Please see important disclosure information on pages 88 - 91 of this report.

Across operations, the vast majority of Acerinox’s production, 85% in 2013, is made up of
flat-rolled products that are used in the autos, white goods and heavy industrials
industries. Flat products are produced at facilities in South Africa, Europe, the US and
Malaysia. The remaining 15% of volumes are long products used primarily in the
construction sector. Long products production is based exclusively in Spain and the US,
feeding primarily into local domestic markets.
Exhibit 121: Acerinox Revenue by Product Segment, 2009-
1H14
Source: Company Data, Jefferies
Exhibit 122: Acerinox EBITDA by Product Segment, 2013
Source: Company Data, Jefferies
By product grade, Acerinox produces primarily austenitic stainless steels with 200 series
and 300 series steels making up over 70% of total production. Ferritic stainless steels
make up just 25% of Acerinox’s total production in recent periods. Across operations,
Campo de Gibraltar, NAS and Bahru produce primarily austenitics while Columbus is
more heavily weighted towards ferritics. As a result of this product mix, Acerinox has
notably high exposure to the nickel price, being a key alloy component of austenitic
products, and can face somewhat higher stainless steel price volatility than peers.
Exhibit 123: Acerinox Product Types
Source: Company Data, Jefferies
Geographic diversification Across our coverage universe, Acerinox has perhaps the most diverse geographical mix of
production sites with core operations the US, Spain and South Africa, and a new growth
business in Malaysia. Acerinox has three steel production sites producing solely flat
products, Acerinox Europa, Columbus Stainless South Africa and Bahru Stainless Malaysia.
US-based NAS produces both flat and long products, while two smaller factories – Roldan
and Inoxfil, both in Spain – produce only long products. From these production sites,
Acerinox supplies distribution centres dispersed throughout the world including South
America, Africa, Eastern Europe and China. By geography, Acerinox currently has roughly
15% market share in Europe, 40% market share in the US and 12% market share in
ASEAN.
88% 85% 85% 86% 86% 85% 85%
10% 13% 15% 14% 14% 14% 15%
0%
20%
40%
60%
80%
100%
2009 2010 2011 2012 2013 LTM 1H 2014
Flat Products Long Products Others Unallocated
Flat Product
78%
Long Product
22%
Grade Production
Cr C Ni Mn
Austenitic
200 series 17-20% <0.1% 1-6% 5.5-10% 20%
300 series 17-20% <0.1% 6-22% <2% 53%
Ferritic 16-18% <0.1% - <2% 25%
Duplex 22-23% <0.03% 4-7% <2% 2%
Alloying Element
Acerinox stands out in our coverage
universe with leading exposure to
both the US and Asian markets given
their operations at NAS and Bahru
stainless.
Natural Resources
Initiating Coverage
8 January 2015
page 70 of 91 , Equity Analyst, +44 (0) 20 7029 8772, [email protected] Rosenfeld, CFA
Please see important disclosure information on pages 88 - 91 of this report.

In particular, Acerinox stands out for its leading exposure and dominant market share in
the relatively buoyant North American market. From a raw materials perspective, NAS is
structurally advantaged due to its easy access to scrap in the Mid-West with port capacity
directly on the Ohio River. With these benefits, NAS is able to operate with a particularly
high scrap consumption ratio well above local peers, reducing the need for higher cost
virgin raw materials. NAS also benefits from power costs roughly 50% lower than in
Spain, and we see potential for further power cost reduction driven by energy deflation in
the US shale gas boom. Lastly, from a demand perspective, NAS benefits from its close
access to Chicago, a key end market within the industrials sector for austenitic steels (80%
of NAS production). Impressively, as a result of these drivers NAS operates at near 100%
utilisation rate and has been a key driver of Acerinox’s earnings resilience in recent years.
Exhibit 124: Acerinox Geographic Distribution of
Production Assets and Product Flow
Source: Company Data
Exhibit 125: Acerinox Revenue by Region, 2013
Source: Company Data, Jefferies
Growth opportunities Beginning with Acerinox’s development of NAS in the early 1990s, management has
consistently approached growth capex with a staged approach in an attempt to minimise
capex overruns and reduce execution risk. In early 2008, Acerinox announced a new
strategic plan meant to drive production and earnings growth spanning from 2008 to
2020, focused on the development of Malaysia-based Bahru Stainless. The growth plan
for Bahru was divided into four phases with the first two focused on building cold-rolling
capacity expected to cost $680m and be completed by the end of 2013. Impressively,
despite the disruption of the global financial crisis, Acerinox was able to complete this
development on schedule and on budget.
Having begun ramp-up of cold-rolled steel production in 2013, Bahru Stainless now has
400kt of production capacity. Looking forward, further capex is meant to expand Bahru to
1.0mt of melting and hot-rolling capacity and 600ktpa of cold-rolling capacity in the
coming years, subject to further project approvals, for a total cost of roughly $800-900m.
Management announced in autumn 2014 that a final decision on this expansion would
be delayed subject to stabilisation of the South East Asian stainless market, which has
been impacted by weak prices and high Chinese exports, and also recently unsettled by
changes in Indonesian nickel production. While building hot-rolled capacity on its own is
not hugely value accretive, a move to ultimately make Bahru vertically integrated, rather
than processing hot-rolled steels currently shipped from Columbus South Africa’s
operations, should help further lower opex at Bahru and make the plant more competitive
within the Asian market.
While ramp-up of cold-rolling capacity at Bahru Stainless has progressed well in recent
years, given continued challenging market conditions, capacity utilisation remains low at
just 50% and the operation is only EBITDA breakeven at these levels. Based on current
Spain
9%
Rest of Europe
28%
Americas
49%
Africa
6%
Asia
8%
Other
0%
The key growth driver for Acerinox is
the potential ramp-up of production
capacity at Bahru stainless, which
currently has cold-rolled capacity of
400ktpa. A decision to expand Bahru
to include hot-rolling and meltshop
capacities was recently delayed in
light of continued weak Asian market
dynamics and instability brought on
by the Indonesian ore export ban.
Natural Resources
Initiating Coverage
8 January 2015
page 71 of 91 , Equity Analyst, +44 (0) 20 7029 8772, [email protected] Rosenfeld, CFA
Please see important disclosure information on pages 88 - 91 of this report.

capacity, Bahru Stainless has 26% market share within Malaysia and 12% market share
across the ASEAN region, with exports making up 64% of total shipments. Importantly,
given Bahru’s strategic waterfront location, the plant is well located to minimise
transport-related costs of raw materials and also cut down transport time and cost to key
customers in Thailand, Vietnam, Indonesia and the Philippines, which should help the
business in years to come.
Across operations, Acerinox at present has production capacity of 3.5mtpa in melting,
3.1mtpa in flat HRC, 0.4mtpa in long hot-rolled products and 2.4mtpa in CRC. Should the
company succeed in reaching its 2020 targets through further investment in Bahru
Stainless, total capacity should increase to 4.5mtpa in melting, 4.1mtpa in HRC and
2.7mtpa in CRC.
Exhibit 126: Acerinox Global Production Capacity
Source: Company Data, Jefferies estimates
Exhibit 127: Acerinox Target Production Capacity - 2020
Source: Company Data, Jefferies
Exhibit 128: Acerinox Global Melting Capacity Utilisation Rate
Source: Company Data, Jefferies estimates
0
500
1,000
1,500
2,000
2,500
3,000
3,500
4,000
2000 2002 2004 2006 2008 2010 2012 2014E
Kt
Melting HR CR
Capacity - ktpa Melting Hot Rolling Cold Rolling
Acerinox Europa 1,100 900 670
NAS 1,400 1,200 850
Columbus 1,000 1,000 545
Bahru 1,000 1,000 600
Group Total 4,500 4,100 2,665
0%
20%
40%
60%
80%
100%
2007 2008 2009 2010 2011 2012 2013 2014E 2015E 2016E 2017E
Utilisation
Natural Resources
Initiating Coverage
8 January 2015
page 72 of 91 , Equity Analyst, +44 (0) 20 7029 8772, [email protected] Rosenfeld, CFA
Please see important disclosure information on pages 88 - 91 of this report.

Cost cutting and asset optimisation Beginning in 2009, Acerinox began a major cost optimisation programme, dubbed the
“Excellence Plan,” to be executed in three distinct stages. While many global steelmakers
have announced cost-cutting and restructuring programmes in recent years, we are
impressed with the clear targets and quantified results of Acerinox’s programme.
The first phase of the “Excellence Plan” was focused on improving Acerinox’s general
production process in order to advance product quality and reduce variable operating
costs. In phase two, the emphasis was extended to include steel trading and distribution.
In this regard, Acerinox targeted a new working capital strategy focused on increasing the
payment period to suppliers and reducing the collection period from customers while
continuing the previous focus on inventory minimisation. Lastly, phase three, which was
completed in 2014, has continued this recent focus on working capital. Throughout these
past three phases of cost optimisation, Acerinox has had an impressive track record in
achieving targeted cost savings, reaching an over a 70% success rate.
In December 2014, Acerinox announced a fourth stage of this “Excellence Plan”, targeting
an incremental €70m in savings per year. This last stage is meant to focus on further
improving the group’s variable cost base in 2015-16.
Exhibit 129: Cost Optimisation Programme Track Record
Source: Company Data, Jefferies
Exhibit 130: Cost Optimisation Plan by Driver
Source: Company Data, Jefferies
Despite these successful cost-cutting measures, Acerinox still faces relatively significant
cost inflation pressures in its Spanish and South African operations. In Spain, electricity
Phase Period Defined Focus Areas Targeted annual
savings (€ mm)
Achieved
savings (€ mm)
Success
rate
I 2009-2010 * improvements of quality and
process
133 97 73%
* inventories management
* reduction of costs, and
* better use of the synergies among
factories and service centres of the
Group
II 2011-2012 * improvement of plant efficiency 90 53 58%
* purchasing management, and
* attaining excellence within the
supply chain
III 2013-2014 * excellence in operations 60 53 88%
* excellence in managing working
capital* excellence in the supply chain, and
* commercial excellence
Operations
Excellence, 58%
Working Capital
Excellence, 12%
Supply Chain
Excellence, 23%
Commercial
Excellence, 7%
Acerinox has implemented four cost-
savings programmes in recent years
with an impressive 70% success rate
to date.
Natural Resources
Initiating Coverage
8 January 2015
page 73 of 91 , Equity Analyst, +44 (0) 20 7029 8772, [email protected] Rosenfeld, CFA
Please see important disclosure information on pages 88 - 91 of this report.

costs have increased by roughly 30% since 2011 and the company forecasts a further
10%-15% YoY increase in 2015.
In South Africa, Acerinox faces significant cost pressures with access to raw materials,
labour and electricity. Given the lack of domestic stainless scrap availability, Acerinox must
rely much more heavily on raw materials here than at other facilities. Despite this
domestic scrap shortfall, Acerinox is very well positioned with a wholly owned
ferrochrome mine and processing plant, making Columbus the most efficient plant in the
group for the production of ferritic grades. In addition, Acerinox has seen double-digit
annual inflation in both energy and labour costs over recent years, putting pressure on
group margins. Given ongoing country-wide cost inflation across the South African
industrial sector, we do not believe that Acerinox will be able to offset these rising input
costs in the coming years.
Balance sheet & FCF generation A crucial focus of Acerinox’s past cost-optimisation programmes has been taking a more
proactive approach towards working capital management. And, as a result of these
efforts, total working capital has fallen by 74% from 2006 to 3Q14, leading to strong FCF
generation and also balance sheet deleveraging over this period.
Exhibit 131: Acerinox Working Capital Management (€m)
Source: Company Data, Jefferies
Exhibit 132: Acerinox Inventory and Working Capital
Turnover
Source: Company Data, Jefferies
As a result of these deleveraging efforts during 2010-13, when net debt fell by 51%,
Acerinox’s balance sheet is now in solid shape with gearing running at 45% as of 3Q14.
Looking forward, we forecast that gearing will remain relatively stable in a 30%-40%
range as management seeks to roll-over short-term debt to extend the maturity of loans
towards 2017-18. A key swing factor, however, will be management’s decision whether
or not to invest in further capacity growth at Bahru stainless, which is unlikely to be fully
covered with operating cash flows, and will therefore lead to a period of higher gearing.
(1,200)
(700)
(200)
300
800
1,300
1,800
2,300
2,800
(1,500)
(1,000)
(500)
0
500
1,000
1,500
2,000
2,500
3,000
3,500
2006 2007 2008 2009 2010 2011 2012 2013 9M14
Inventories Trade Debtors
Trade Creditors Working Capital - RHS
3.3 3.5 3.1 2.4
3.6 3.8 4.6 5.0
5.2
3.0 3.2 3.0 2.3
3.8 4.3
6.6
11.8
10.2
0
2
4
6
8
10
12
14
2006 2007 2008 2009 2010 2011 2012 2013 9M14
Days
Inventory Turnover Working Capital Turnover
Natural Resources
Initiating Coverage
8 January 2015
page 74 of 91 , Equity Analyst, +44 (0) 20 7029 8772, [email protected] Rosenfeld, CFA
Please see important disclosure information on pages 88 - 91 of this report.

Exhibit 133: Historical Net Debt & Net Gearing
Source: Company Data, FactSet, Jefferies
Exhibit 134: Acerinox Debt Maturity Schedule
Source: Company Data, Jefferies *As of 3Q14 Results, assumes refinancing in 2016 with longer maturity debt
Shareholder returns Despite challenges in the global stainless steel industry in recent years, Acerinox has
maintained a stable progressive dividend programme, with divi payments made annually
and paid out via either cash or script divis. Since 2008, Acerinox has averaged a 3%
dividend yield. In July 2014, Acerinox distributed a divi of €0.449 per share through a
scrip dividend; 51% of shareholders chose to take on new shares rather than receive cash.
Historically management has noted its desire to grow dividends by a small amount
annually but ensure that it will not need to cut the dividend even in a weaker market
environment, and we expect this informal strategy to continue moving forward. In
addition, while Acerinox has paid dividends partly in shares in recent years, management
has noted its desire to return to a fully cash dividend should the market environment
sustainably improve.
0%
10%
20%
30%
40%
50%
60%
70%
0
200
400
600
800
1,000
1,200
2008 2009 2010 2011 2012 2013 2014E 2015E 2016E 2017E
(%)(€m)
Net Debt (LHS) Net Gearing (RHS)
0
100
200
300
400
500
600
700
800
2014E 2015E 2016E 2017E 2018E+
(€M)
Unlike many steel sector peers,
Acerinox stands out for having
consistently paid a dividend in recent
years. We expect divis to remain
roughly stable at current levels in the
medium term.
Through aggressive working capital
management efforts, Acerinox has
driven impressive balance sheet
deleveraging in recent years. We
expect gearing to stay in a 20%-40%
range in the medium term.
Natural Resources
Initiating Coverage
8 January 2015
page 75 of 91 , Equity Analyst, +44 (0) 20 7029 8772, [email protected] Rosenfeld, CFA
Please see important disclosure information on pages 88 - 91 of this report.

Exhibit 135: Acerinox Historical Dividend & Issue Premium
Source: Company Data, Jefferies estimates
Exhibit 136: Acerinox Historical Dividend Yield
Source: Company Data, Factset, Jefferies estimates
Company description
Acerinox’s operations are divided into five operating segments with exposure across
Europe, the US, South Africa and Asia. Across these facilities, Acerinox has melting capacity
of 3.5mtpa, hot-rolled capacity of 3.1mtpa and cold-rolled capacity of 2.4mtpa.
Acerinox Europa (Spain) is an integrated steelmaking site with a melting
capacity of 1.1mtpa. Dating back to 1970, this was the founding plant of
Acerinox at Campo de Gibraltar. In addition to producing flat products, the
plant also supplies billets to Roldan factories for production of long products.
Starting in 2008, Acerinox began a large-scale investment programme for a
comprehensive upgrade of the plant meant to improve plant performance and
output quality.
Columbus Stainless (South Africa) is an integrated production facility with
melting and hot-rolling capacity of 1mtpa and cold-rolling capacity of 600ktpa.
Founded in 1966, Columbus is Africa’s only producer of flat stainless steel
products. Acerinox first invested in Columbus in 2002 and subsequently
invested in two expansion phases to take total capacity to 1mtpa by 2007. In
addition to supplying finished steel products to primarily the African and Latin
American market, Columbus is also the main feedstock of hot-rolled coil to
Bahru Stainless.
Bahru Stainless (Malaysia) is Acerinox’s newest production facility as
development began in 2008 and first production started in early 2012. Raw
materials (primarily hot-rolled black coil) are sourced primarily from Columbus
Stainless and to a lesser extent Acerinox Europe and other Asian manufacturers.
The first two phases of development were completed in early 2013, bringing
total capacity to 400ktpa. Looking forward, Acerinox plans to increase melt
capacity to 1mtpa and cold-rolling capacity to 600ktpa.
North American Stainless (USA) is Acerinox’s largest production facility
with melting, hot-rolling and cold-rolling capacities of 1.4mtpa, 1.2mtpa and
0.9mtpa, respectively. NAS is the largest producer of stainless steel in the US,
and as regional US demand has far outstripped European demand in recent
years, NAS has emerged as Acerinox’s most profitable plant with significantly
higher capacity utilisation rates. Given NAS’s access to a large developed
domestic stainless scrap market in the US, NAS uses a higher percentage of scrap
than other operations, improving its relative cost base.
0.00
0.10
0.20
0.30
0.40
0.50
0.60
2008 2009 2010 2011 2012 2013 2014E 2015E 2016E 2017E
(€/sh)
Dividend Issue Premium
0%
1%
2%
3%
4%
5%
2008 2009 2010 2011 2012 2013 2014E 2015E 2016E 2017E
(Divi Yield)
Natural Resources
Initiating Coverage
8 January 2015
page 76 of 91 , Equity Analyst, +44 (0) 20 7029 8772, [email protected] Rosenfeld, CFA
Please see important disclosure information on pages 88 - 91 of this report.

Roldan and Inoxfil (Spain) both focus on the production of long products
including bars, wire rods and angles with production capacity of 200ktpa. Billet
feedstock is supplied from Acerinox Europe at Campo de Gibraltar. Production at
Roldan and Inoxfil was significantly hit by continued poor domestic European
demand, and these facilities continue to have amongst the lowest capacity
utilisation rates across Acerinox’s portfolio.
Exhibit 137: Acerinox Organizational Chart
Source: Acerinox
Company risks Acerinox faces various risks that are tied to company-specific factors as well as broader
industry-wide challenges. From a company-specific perspective, the greatest risk facing
Acerinox in 2015 is increasing competition and potential market share loss in the North
American market following Outokumpu’s ramp-up of Calvert. From an industry-wide
perspective, the greatest risks facing Acerinox are falling prices and demand for both
stainless steel and nickel. The greatest upside risk to our otherwise cautious thesis on
Acerinox is stronger than expected global demand growth that could lead to rapid
expansion in Acerinox’s European, South African and Malaysian operations.
Natural Resources
Initiating Coverage
8 January 2015
page 77 of 91 , Equity Analyst, +44 (0) 20 7029 8772, [email protected] Rosenfeld, CFA
Please see important disclosure information on pages 88 - 91 of this report.

Exhibit 138: Acerinox Corporate History
Source: Company Data
Exhibit 139: Acerinox Management Biographies
Source: Company Data
Date Event
30 Sep 1970 Acerinox S.A. was founded in Spain, with a single plant at El Campo de Gibraltar (now under Acerinox Europa).
1973 The Company started the cold rolling department.
1976 Melting shop and port were established.
1986 Hot-rolling department was set up.
30 Oct 1986 Acerinox stock was listed on Madrid and Barcelona stock exchanges.
1990 North American Stainless (NAS) was established in Kentucky, USA.
1 Feb 2002 Acerinox acquired 64% stake in Columbus Stainless (Middelburg, South Africa) from BHP Billiton, Anglo American and the South
African Industrial Development Corporation (IDC) for around $220mm.
2003 The long products rolling mill of NAS was inaugurated.
13 May 2005 The Company purchased Highveld Steel & Vanadium’s 12% stake in Columbus Stainless for €47.5mm, increasing its
shareholding in Columbus to 76%.
6 Mar 2008 Acerinox announced the establishment of a new stainless steel production plant in Johor Bahru, Malaysia (67% stake), jointly
with Nisshin Steel (30%) and Metal One (3%).
4 Feb 2009 Nisshin Steel increased its stake in Acerinox to 15% from 11.3%.
Feb 2009 In response to tough market conditions, the company initiated Excellence Plan 2009-2010 which included better inventory
management, cost reduction and use of the synergies among group facilities. The plan was targeted at generating recurring
cost savings of €133mm annually 2011 onwards.
20 May 2009 Acerinox acquired Yick Hoe Metal Industries, the largest stainless steel trading company in Malaysia, as a part of its strategy for
increasing traction in the Asian markets.
2008-2010 The Company implemented a series of temporal labour adjustment plans, and working time and job reduction policies across
locations.Feb 2011 Second cost savings initiative Excellence Plan II 2011-2012 was launched aimed at generating savings of €90mm annually 2013
onwards.
10 Jun 2011 The factory at El Campo de Gibraltar and service centres located in Spain were segregated from the parent company to a new
fully-owned subsidiary Acerinox Europa. With this reorganization, the parent company Acerinox became a holding company,
running all industrial businesses through subsidiaries.
12 Dec 2011 Production started at Bahru Stainless in Malaysia.
Dec 2012 Acerinox approved Excellence Plan III for 2013-2014 targeting annual recurring savings of €60mm from 2015 onwards. Of this,
recurrent savings of €41mm were achieved in 2013, indicating 68% achievement in the first year.
7 May 2013 Phase II production started at Bahru Stainless.
2013 Acerinox opened new commercial offices in Dubai (UAE), Bangkok (Thailand), Manila (Philippines), Taipei (Taiwan), Hanoi
(Vietnam) and Surabaya (Indonesia), thus further consolidating presence in Asia.
4 July 2014 UBS Limited placed Casa Grande de Cartagena’s three percent stake in Acerinox (7,714,386 shares) among qualified investors for
€13 per share.
18 Dec 2014 Acerinox approved Excellence Plan IV for 2015-16 targeting annual recurring savings of €70mm from 2016 onwards.
Name Position Profile
Mr Bernardo Velázquez
Herreros
CEO Mr Herreros assumed the responsibility of CEO of Acerinox in July 2010. He replaced Mr Rafael
Naranjo Olmedo who retained the position of Chairman of the Board of Directors. Mr Herreros'
appointment followed the good governance recommendations aimed at separating the positions
of the CEO and the Chairman. Prior to that, he was serving as Managing Director of the group
since 2007. He was the Planning Director of Acerinox from 2005 to 2007. Mr Herreros also serves
as the Chairman of Acerinox Europa and Bahru Stainless. He holds a degree in Industrial
Engineering from ICAI, Spain.
Mr Antonio Fernandez
Pacheco
Managing Director Mr Pacheco joined Acerinox on 1977. Prior to his appointment as Managing Director in September
2010, Mr Pacheco was serving as the CEO of NAS.
Mr Miguel Ferrandis Torres Financial Director Mr Torres joined Acerinox in 1995.
Mr Daniel Azpitarte Commercial Director Mr Azpitarte was appointed Commercial Director in October 2014. He is a Mining Engineer from
the Polytechnic University of Madrid and since 1996 has held various positions in the Sales
Department. He was also previously Corporate Planning Director.
Mr Luis Gimeno Valledor General Counsel Mr Valledor was appointed Director of Acerinox (U.K.) Limited in January 2009. He was born in
July 1960.
Natural Resources
Initiating Coverage
8 January 2015
page 78 of 91 , Equity Analyst, +44 (0) 20 7029 8772, [email protected] Rosenfeld, CFA
Please see important disclosure information on pages 88 - 91 of this report.
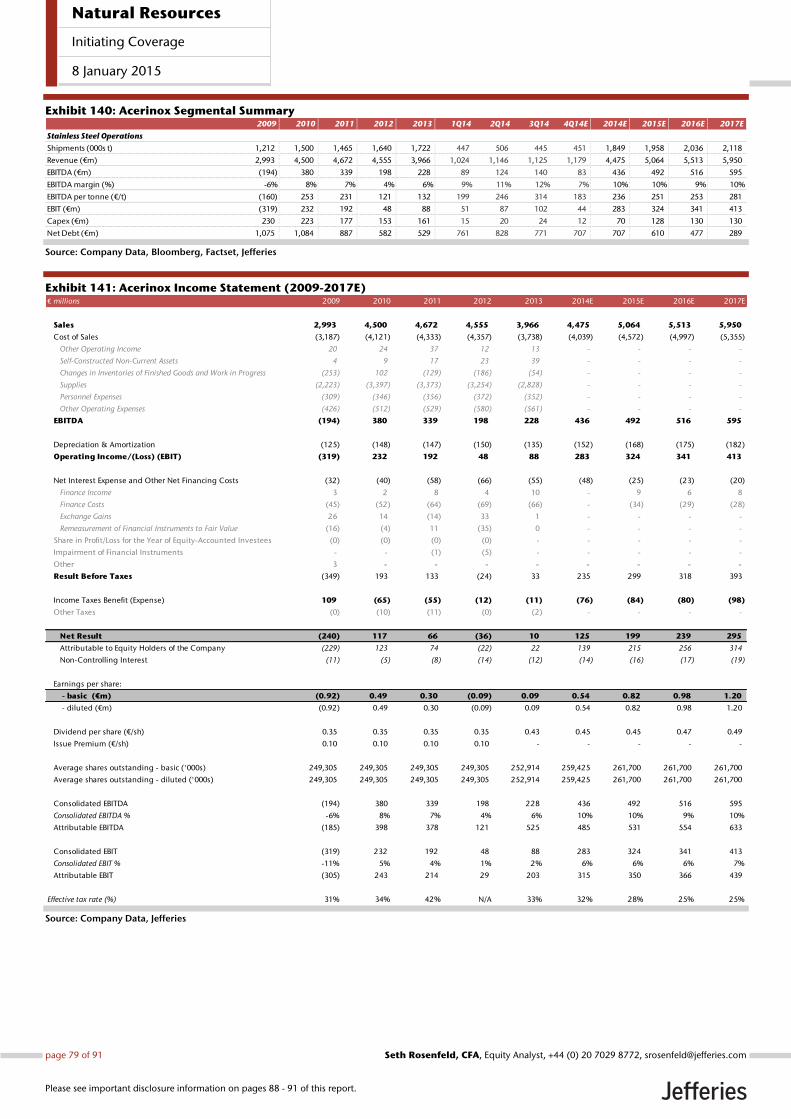
Exhibit 140: Acerinox Segmental Summary
Source: Company Data, Bloomberg, Factset, Jefferies
Exhibit 141: Acerinox Income Statement (2009-2017E)
Source: Company Data, Jefferies
2009 2010 2011 2012 2013 1Q14 2Q14 3Q14 4Q14E 2014E 2015E 2016E 2017E
Stainless Steel Operations
Shipments (000s t) 1,212 1,500 1,465 1,640 1,722 447 506 445 451 1,849 1,958 2,036 2,118
Revenue (€m) 2,993 4,500 4,672 4,555 3,966 1,024 1,146 1,125 1,179 4,475 5,064 5,513 5,950
EBITDA (€m) (194) 380 339 198 228 89 124 140 83 436 492 516 595
EBITDA margin (%) -6% 8% 7% 4% 6% 9% 11% 12% 7% 10% 10% 9% 10%
EBITDA per tonne (€/t) (160) 253 231 121 132 199 246 314 183 236 251 253 281
EBIT (€m) (319) 232 192 48 88 51 87 102 44 283 324 341 413
Capex (€m) 230 223 177 153 161 15 20 24 12 70 128 130 130
Net Debt (€m) 1,075 1,084 887 582 529 761 828 771 707 707 610 477 289
€ millions 2009 2010 2011 2012 2013 2014E 2015E 2016E 2017E
Sales 2,993 4,500 4,672 4,555 3,966 4,475 5,064 5,513 5,950
Cost of Sales (3,187) (4,121) (4,333) (4,357) (3,738) (4,039) (4,572) (4,997) (5,355)
Other Operating Income 20 24 37 12 13 - - - -
Self-Constructed Non-Current Assets 4 9 17 23 39 - - - -
Changes in Inventories of Finished Goods and Work in Progress (253) 102 (129) (186) (54) - - - -
Supplies (2,223) (3,397) (3,373) (3,254) (2,828) - - - -
Personnel Expenses (309) (346) (356) (372) (352) - - - -
Other Operating Expenses (426) (512) (529) (580) (561) - - - -
EBITDA (194) 380 339 198 228 436 492 516 595
Depreciation & Amortization (125) (148) (147) (150) (135) (152) (168) (175) (182)
Operating Income/(Loss) (EBIT) (319) 232 192 48 88 283 324 341 413
Net Interest Expense and Other Net Financing Costs (32) (40) (58) (66) (55) (48) (25) (23) (20)
Finance Income 3 2 8 4 10 - 9 6 8
Finance Costs (45) (52) (64) (69) (66) - (34) (29) (28)
Exchange Gains 26 14 (14) 33 1 - - - -
Remeasurement of Financial Instruments to Fair Value (16) (4) 11 (35) 0 - - - -
Share in Profit/Loss for the Year of Equity-Accounted Investees (0) (0) (0) (0) - - - - -
Impairment of Financial Instruments - - (1) (5) - - - - -
Other 3 - - - - - - - -
Result Before Taxes (349) 193 133 (24) 33 235 299 318 393
Income Taxes Benefit (Expense) 109 (65) (55) (12) (11) (76) (84) (80) (98)
Other Taxes (0) (10) (11) (0) (2) - - - -
Net Result (240) 117 66 (36) 10 125 199 239 295
Attributable to Equity Holders of the Company (229) 123 74 (22) 22 139 215 256 314
Non-Controlling Interest (11) (5) (8) (14) (12) (14) (16) (17) (19)
Earnings per share:
- basic (€m) (0.92) 0.49 0.30 (0.09) 0.09 0.54 0.82 0.98 1.20
- diluted (€m) (0.92) 0.49 0.30 (0.09) 0.09 0.54 0.82 0.98 1.20
Dividend per share (€/sh) 0.35 0.35 0.35 0.35 0.43 0.45 0.45 0.47 0.49
Issue Premium (€/sh) 0.10 0.10 0.10 0.10 - - - - -
Average shares outstanding - basic ('000s) 249,305 249,305 249,305 249,305 252,914 259,425 261,700 261,700 261,700
Average shares outstanding - diluted ('000s) 249,305 249,305 249,305 249,305 252,914 259,425 261,700 261,700 261,700
Consolidated EBITDA (194) 380 339 198 228 436 492 516 595
Consolidated EBITDA % -6% 8% 7% 4% 6% 10% 10% 9% 10%
Attributable EBITDA (185) 398 378 121 525 485 531 554 633
Consolidated EBIT (319) 232 192 48 88 283 324 341 413
Consolidated EBIT % -11% 5% 4% 1% 2% 6% 6% 6% 7%
Attributable EBIT (305) 243 214 29 203 315 350 366 439
Effective tax rate (%) 31% 34% 42% N/A 33% 32% 28% 25% 25%
Natural Resources
Initiating Coverage
8 January 2015
page 79 of 91 , Equity Analyst, +44 (0) 20 7029 8772, [email protected] Rosenfeld, CFA
Please see important disclosure information on pages 88 - 91 of this report.

Exhibit 142: Acerinox Balance Sheet (2009-2017E)
Source: Company Data, Jefferies
€ millions 2009 2010 2011 2012 2013 2014E 2015E 2016E 2017E
Assets
Non-current assets
Goodwill 69 69 69 69 69 69 69 69 69
Other Intangible Assets 9 10 7 7 7 7 7 7 7
Property, Plant & Equipment 1,755 1,979 1,986 2,020 1,893 1,869 1,829 1,785 1,733
Available-for-Sale Financial Assets 13 18 12 7 9 10 10 10 10
Deferred Tax Assets 154 149 165 203 218 200 200 200 200
Other Non-Current Financial Assets 2 11 12 2 4 4 4 4 4
Total non-current assets 2,002 2,236 2,251 2,308 2,200 2,161 2,121 2,076 2,024
Current assets
Inventories 1,154 1,337 1,119 870 730 982 1,024 1,069 1,111
Trade and Other Receivables 332 529 510 430 414 517 539 563 585
Other Current Financial Assets 9 11 17 17 12 98 98 98 98
Current Tax Assets 46 14 8 8 6 9 9 9 9
Cash and Cash Equivalents 73 114 165 583 630 440 177 392 440
Total current assets 1,616 2,005 1,820 1,907 1,791 2,046 1,847 2,131 2,244
Total assets 3,618 4,240 4,071 4,216 3,991 4,207 3,968 4,207 4,268
Equity
Subscribed Capital 62 62 62 62 64 64 64 64 64
Share Premium 156 131 106 81 81 81 81 81 81
Reserves 1,871 1,544 1,559 1,536 1,478 1,574 1,574 1,574 1,574
Profit/Loss for the Year (229) 123 74 (22) 22 97 211 344 529
Translation Differences (226) (57) (55) (89) (209) (194) (194) (194) (194)
Other - (25) (25) - - - - - -
Equity Attributable to Equity Holders 1,635 1,778 1,721 1,568 1,437 1,608 1,720 1,869 2,055
Non-Controlling Interest 117 146 160 145 116 113 97 80 61
Total equity 1,753 1,924 1,881 1,713 1,553 1,736 1,834 1,949 2,116
Non-current liabilities
Deferred Income 6 7 5 6 5 6 6 6 6
Loans and Borrowings 543 725 707 895 751 787 569 729 629
Non-Current Provisions 44 15 14 14 14 13 13 13 13
Deferred Tax Liabilities 205 237 242 226 200 197 197 197 197
Other non-Current Financial Liabilities 2 9 20 38 21 105 105 105 105
Total non-current liabilities 800 992 988 1,178 991 1,109 890 1,050 950
Current liabilities
Loans and Borrowings 605 472 344 269 408 360 219 140 100
Trade and Other Payables 456 828 844 1,006 980 888 911 953 988
Current Tax Liabilities 0 11 3 12 14 9 9 9 9
Other Current Financial Liabilities 5 13 11 38 45 104 104 104 104
Total current liabilities 1,065 1,324 1,202 1,325 1,447 1,362 1,244 1,207 1,201
Total liabilities 1,865 2,317 2,190 2,503 2,438 2,471 2,134 2,257 2,152
Total equity and liabilities 3,618 4,240 4,071 4,216 3,991 4,207 3,968 4,207 4,268
Debt 1,148 1,197 1,051 1,164 1,159 1,147 787 869 729
Cash 73 114 165 583 630 440 177 392 440
Net debt/(cash) 1,075 1,084 887 582 529 707 610 477 289
Natural Resources
Initiating Coverage
8 January 2015
page 80 of 91 , Equity Analyst, +44 (0) 20 7029 8772, [email protected] Rosenfeld, CFA
Please see important disclosure information on pages 88 - 91 of this report.
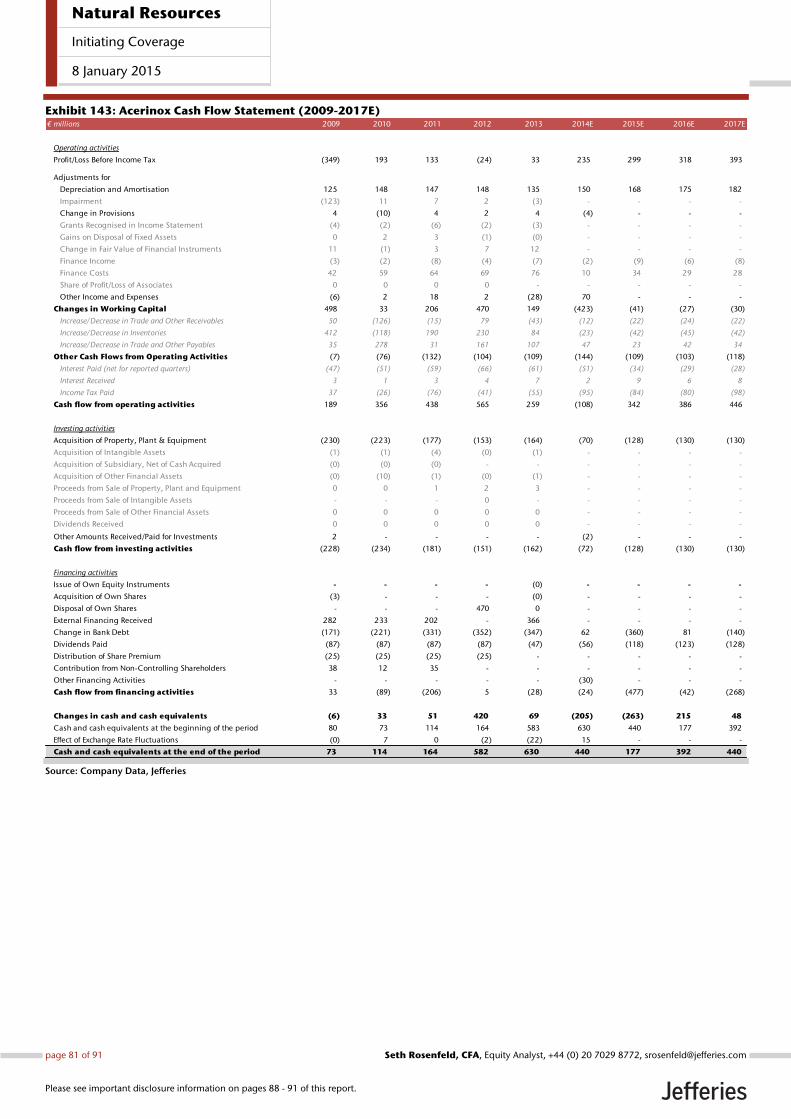
Exhibit 143: Acerinox Cash Flow Statement (2009-2017E)
Source: Company Data, Jefferies
€ millions 2009 2010 2011 2012 2013 2014E 2015E 2016E 2017E
Operating activities
Profit/Loss Before Income Tax (349) 193 133 (24) 33 235 299 318 393
Adjustments for
Depreciation and Amortisation 125 148 147 148 135 150 168 175 182
Impairment (123) 11 7 2 (3) - - - -
Change in Provisions 4 (10) 4 2 4 (4) - - -
Grants Recognised in Income Statement (4) (2) (6) (2) (3) - - - -
Gains on Disposal of Fixed Assets 0 2 3 (1) (0) - - - -
Change in Fair Value of Financial Instruments 11 (1) 3 7 12 - - - -
Finance Income (3) (2) (8) (4) (7) (2) (9) (6) (8)
Finance Costs 42 59 64 69 76 10 34 29 28
Share of Profit/Loss of Associates 0 0 0 0 - - - - -
Other Income and Expenses (6) 2 18 2 (28) 70 - - -
Changes in Working Capital 498 33 206 470 149 (423) (41) (27) (30)
Increase/Decrease in Trade and Other Receivables 50 (126) (15) 79 (43) (12) (22) (24) (22)
Increase/Decrease in Inventories 412 (118) 190 230 84 (23) (42) (45) (42)
Increase/Decrease in Trade and Other Payables 35 278 31 161 107 47 23 42 34
Other Cash Flows from Operating Activities (7) (76) (132) (104) (109) (144) (109) (103) (118)
Interest Paid (net for reported quarters) (47) (51) (59) (66) (61) (51) (34) (29) (28)
Interest Received 3 1 3 4 7 2 9 6 8
Income Tax Paid 37 (26) (76) (41) (55) (95) (84) (80) (98)
Cash flow from operating activities 189 356 438 565 259 (108) 342 386 446
Investing activities
Acquisition of Property, Plant & Equipment (230) (223) (177) (153) (164) (70) (128) (130) (130)
Acquisition of Intangible Assets (1) (1) (4) (0) (1) - - - -
Acquisition of Subsidiary, Net of Cash Acquired (0) (0) (0) - - - - - -
Acquisition of Other Financial Assets (0) (10) (1) (0) (1) - - - -
Proceeds from Sale of Property, Plant and Equipment 0 0 1 2 3 - - - -
Proceeds from Sale of Intangible Assets - - - 0 - - - - -
Proceeds from Sale of Other Financial Assets 0 0 0 0 0 - - - -
Dividends Received 0 0 0 0 0 - - - -
Other Amounts Received/Paid for Investments 2 - - - - (2) - - -
Cash flow from investing activities (228) (234) (181) (151) (162) (72) (128) (130) (130)
Financing activities
Issue of Own Equity Instruments - - - - (0) - - - -
Acquisition of Own Shares (3) - - - (0) - - - -
Disposal of Own Shares - - - 470 0 - - - -
External Financing Received 282 233 202 - 366 - - - -
Change in Bank Debt (171) (221) (331) (352) (347) 62 (360) 81 (140)
Dividends Paid (87) (87) (87) (87) (47) (56) (118) (123) (128)
Distribution of Share Premium (25) (25) (25) (25) - - - - -
Contribution from Non-Controlling Shareholders 38 12 35 - - - - - -
Other Financing Activities - - - - - (30) - - -
Cash flow from financing activities 33 (89) (206) 5 (28) (24) (477) (42) (268)
Changes in cash and cash equivalents (6) 33 51 420 69 (205) (263) 215 48
Cash and cash equivalents at the beginning of the period 80 73 114 164 583 630 440 177 392
Effect of Exchange Rate Fluctuations (0) 7 0 (2) (22) 15 - - -
Cash and cash equivalents at the end of the period 73 114 164 582 630 440 177 392 440
Natural Resources
Initiating Coverage
8 January 2015
page 81 of 91 , Equity Analyst, +44 (0) 20 7029 8772, [email protected] Rosenfeld, CFA
Please see important disclosure information on pages 88 - 91 of this report.

Appendix 1: Stainless Steel Grades
Exhibit 144: Stainless Steel Grades
Source: Acerinox, Jefferies
Austenitic
Austenitic steels are characterized by good corrosion resistance, durability, formability and
weldability due to the chromium and nickel content. These are used most widely of all the
stainless steel grades and account for around 70% of the global production. They are
primarily non-magnetic and depending on the nickel content, become slightly magnetic
when cold worked. Austenitic stainless steels are classified into two major SAE grade
series:
200s – These are chromium-nickel-manganese alloys of steel, wherein
manganese acts as a partial low-cost replacement of nickel.
300s – These are primarily chromium-nickel alloys of steel.
Austenitic steels are used in automotive trims, cookware, food and beverage equipment,
processing equipment and a range of industrial applications. An enhancement of alloying
metals (such as nickel and molybdenum) results in very high levels of corrosion resistance,
strength and ductility. Such grades are known as Superaustenitic and are very expensive
due to high alloy content.
Ferritic
Ferritic steels are primarily chromium alloys of steel, with insignificant traces of other
alloying elements. As the name suggests, these steels are mostly magnetic. They are
corrosion resistant due to their chromium content, but are not amenable to heat
treatment or welding. This inability somewhat limits the use of these steels. Some typical
end markets for these high corrosion and heat resistance products are automobile
exhausts, petrochemicals, heat exchangers and furnaces.
Martensitic
This grade of steels shares some characteristics with Ferritic. However, higher level of
carbon imparts much higher strength and toughness, and makes Martensitic steels
amenable to heat treatment. Uses include situations where the strength of the steel is
more important than its resistance to corrosion, for instance, cutlery, sports knives and
multi-purpose tools.
Ferritic and Martensitic steels are included under 400s SAE grade series.
Precipitation Hardening (PH)
In addition to chromium and nickel, these steels contain significant amounts of other
alloying elements such as aluminium, copper, niobium and tantalum. The alloying
elements, together with an array of heat treatments (known as Precipitation Hardening),
make these steels extremely hard and strong; however, corrosion resisting properties are
retained. These properties of PH steels are required in harsh conditions in the aerospace,
petrochemical, petroleum, paper, dairy and food processing industries, and in
applications such as boat shafting.
Grade
Cr C Ni Mn
Austenitic
200 series 17-20% <0.1% 1-6% 5.5-10%
300 series 17-20% <0.1% 6-22% <2%
Ferritic 16-18% <0.1% - <2%
Duplex 22-23% <0.03% 4-7% <2%
Alloying Element
Natural Resources
Initiating Coverage
8 January 2015
page 82 of 91 , Equity Analyst, +44 (0) 20 7029 8772, [email protected] Rosenfeld, CFA
Please see important disclosure information on pages 88 - 91 of this report.

PH steels are classified under 600s SAE series and are further divided into two grades –
martensitic and semi-austenitic.
Duplex
Duplex steels contain a combination of austenite and ferrite in their crystalline structure,
thus making them more strong, corrosion resistant and ductile than both grades. These
steels act as a low-cost substitute for Superaustenitic steels in many applications as their
characteristics and performance are similar to those of Superaustenitic steels despite lower
alloy content.
Natural Resources
Initiating Coverage
8 January 2015
page 83 of 91 , Equity Analyst, +44 (0) 20 7029 8772, [email protected] Rosenfeld, CFA
Please see important disclosure information on pages 88 - 91 of this report.
Appendix 2: Long Views
Natural Resources
Initiating Coverage
8 January 2015
page 84 of 91 , Equity Analyst, +44 (0) 20 7029 8772, [email protected] Rosenfeld, CFA
Please see important disclosure information on pages 88 - 91 of this report.

Long Term Financial Metrics
2015-16E EBIT Margin 5.6%
2015-16E ROE 7.8%
2015-16E Free Cash Flow Yield 13.6%
Earnings multiples for steel companies are
typically highest when fundamentals are
adverse and earnings are depressed, and
lowest when fundamentals are positive and
earnings are high.
Other Considerations
Aperam stands out as perhaps the highest-
quality European stainless steelmaker,
with a history of sector-leading capacity
utilisation rates and EBITDA margins.
Brazilian operations should benefit from
continued alleviation of Chinese import
pressures following recent protectionist
measures given the company’s dominant
local market share.
1 Year Forward EV/EBITDA
Source: Factset, Company Data
0.0x
5.0x
10.0x
15.0x
20.0x
2011 2012 2013 2014
Aperam was created in 2011 as a spin-out of ArcelorMittal, the world’s largest steelmaker.
Aperam is a leading producer of stainless steels with annual melting capacity of 2.5mtpa in
addition to capacity for specialty nickel alloys and electrical steels. The company is the
second largest stainless steel producer in Europe and the fourth largest nickel alloys
producer globally. In addition, Aperam is the market leader in Brazil with over 70% market
share as the only local stainless steel producer across Latin America. With a high quality
and relatively stable business mix, we believe that Aperam’s current valuation discount
versus sector peers is unmerited. Aperam is one of our preferred Euro stainless steel
equities.
Factors that could be supportive of
Aperam’s share price include:
A rebound in global stainless steel
demand
Anti-dumping measures by the EC
lead a significant reduction of imports
from Asia
Nickel price increases lead to
customer restocking
Once net debt target is met (expected
in 4Q14) strategy going forward will
be discussed – return to dividend,
further reductions in debt, or growth
Catalysts
Target Investment Thesis
Recent years of industry restructuring
lead to higher European utilisation
rates, improving pricing power for
domestic producers
2015-17 should see a gradual
tightening of the nickel market
Global economy continues to grow
moderately, driven by emerging
market economies
2015E EBITDA: US$579m; Target
Multiple 5.2x; Price Target €30.00
Upside Scenario
Global growth surprises to the upside,
increasing demand for stainless steel
products
European Commission (EC)
announces new anti-dumping/anti-
subsidy duties against China and
Taiwan, cutting imports and
improving Euro pricing power
Price Target €34.00, driven by a 10%
increase to forecast base prices, target
multiple held constant
Downside Scenario
While we have high conviction in our
target investment thesis, it is possible
that global growth could surprise to
the downside, which could lead to
further weakness in stainless demand
and lower-than-expected prices
Imports from Asia continue to grow,
weighing further on European
utilisation rates, prices and profitability
Price Target €20.00, driven by a 10%
decrease to forecast base prices and
20% target multiple decrease
Long Term Analysis
Scenarios
Group EV/EBITDAs (2015E)
Source: Factset, Jefferies estimates
0.0x
2.0x
4.0x
6.0x
8.0x
10.0x
Acerinox Aperam Outokumpu
EV/EBITDA vs EBIT Margin (2015E)
Source: Factset, Jefferies estimates
ACX APAM
OUT1V
0%
2%
4%
6%
8%
3.0x 5.0x 7.0x 9.0x
Recommendation / Price Target
Ticker Rec. PT
ACX SM Hold €13.00
APAM NA Buy €30.00
OUT1V FH Buy €6.00
Company Description
THE LO
NG
VIE
W
Peer Group
Aperam
Buy: €30.00 Price Target
Natural Resources
Initiating Coverage
8 January 2015
page 85 of 91 , Equity Analyst, +44 (0) 20 7029 8772, [email protected] Rosenfeld, CFA
Please see important disclosure information on pages 88 - 91 of this report.

Long Term Financial Metrics
2015-16E EBIT Margin 4.1%
2015-16E ROE 5.7%
2015-16E Free Cash Flow Yield 14.3%
Earnings multiples for steel companies are
typically highest when fundamentals are
adverse and earnings are depressed, and
lowest when fundamentals are positive and
earnings are high.
* Low or negative EBITDA in prior periods made
the metric unsuitable for comparison
Other Considerations
Technical ramp-up of Calvert was
completed in mid-2014 and commercial
ramp-up should be completed by 2016 as
Outokumpu secures a stable domestic
customer base. As material flows from
Europe were finally concluded in 2014,
Coil Americas should emerge in 2015 as a
cash-generative business benefiting from a
relatively buoyant domestic demand base
and high utilisation rates.
1 Year Forward EV/EBITDA*
Source: Factset, Company Data
0.0x
5.0x
10.0x
15.0x
20.0x
Mar-14 May-14 Jul-14 Sep-14 Nov-14
Outokumpu is a leading stainless steel producer with annual slab melting capacity of
4.1mtpa producing a mix of flat, long and specialty stainless products. While Outokumpu
is heavily exposed to Europe, making up 66% of sales, the majority of volume growth
should come from the continued ramp-up of US steelmaking operations at Calvert over the
coming two years. In addition, Outokumpu stands out as having the most dramatic and
proactive restructuring program across our coverage universe, taking advantage of
increased economies of scale post acquisition of Inoxum to significantly improve the
company’s capacity utilisation rates and cost base.
Factors that could be supportive of
Outokumpu’s share price include:
A rebound in global stainless steel
demand
Anti-dumping measures by the EC
lead a significant reduction of imports
from Asia
Nickel price increases lead to
customer restocking
Smooth ramp-up of Calvert, boosting
volumes and profitability
Sooner-than-expected increase in
shareholder returns
Catalysts
Target Investment Thesis
Recent years of industry restructuring
lead to higher European utilisation
rates, improving pricing power for
domestic producers
2015-17 should see a gradual
tightening of the nickel market
Global economy continues to grow
moderately, driven by emerging
market economies
2015E EBITDA: €525m; Target
Multiple 8.1x; Price Target €6.00
Upside Scenario
Global growth surprises to the upside,
increasing demand for stainless steel
products
European Commission (EC)
announces new anti-dumping/anti-
subsidy duties against China and
Taiwan, cutting imports and
improving Euro pricing power
Price Target €10.00, driven by a 10%
increase to forecast base prices, target
multiple held constant
Downside Scenario
While we have high conviction in our
target investment thesis, it is possible
that global growth could surprise to
the downside, which could lead to
further weakness in stainless demand
and lower-than-expected prices
Imports from Asia continue to grow,
weighing further on European
utilisation rates, prices and profitability
Price Target €2.00, driven by a 10%
decrease to forecast base prices, target
multiple held constant
Long Term Analysis
Scenarios
Group EV/EBITDAs (2015E)
Source: Factset, Jefferies estimates
0.0x
2.0x
4.0x
6.0x
8.0x
10.0x
Acerinox Aperam Outokumpu
EV/EBITDA vs EBIT Margin
Source: Factset, Jefferies estimates
ACX APAM
OUT1V
0%
2%
4%
6%
8%
3.0x 5.0x 7.0x 9.0x
Recommendation / Price Target
Ticker Rec. PT
ACX SM Hold €13.00
APAM NA Buy €30.00
OUT1V FH Buy €6.00
Company Description
THE LO
NG
VIE
W
Peer Group
Outokumpu
Buy: €6.00 Price Target
Natural Resources
Initiating Coverage
8 January 2015
page 86 of 91 , Equity Analyst, +44 (0) 20 7029 8772, [email protected] Rosenfeld, CFA
Please see important disclosure information on pages 88 - 91 of this report.

Long Term Financial Metrics
2015-16E EBIT Margin 6.3%
2015-16E ROE 13.1%
2015-16E Free Cash Flow Yield 7.3%
Earnings multiples for steel companies are
typically highest when fundamentals are
adverse and earnings are depressed, and
lowest when fundamentals are positive and
earnings are high.
Other Considerations
While Acerinox has historically benefited
from leading US exposure and high
growth in Asia, we fear that both of these
areas may prove to be incremental
headwinds in the near term.
1 Year Forward EV/EBITDA
Source: Factset, Company Data
0.0x
5.0x
10.0x
15.0x
20.0x
25.0x
2010 2011 2012 2013 2014
Acerinox is one of the leading global stainless steel producers with annual slab melting
capacity of 3.5mtpa and cold rolling capacity of 2.4mtpa, producing a mix of flat and long
stainless steel products. With over 40% of sales coming from the US, Acerinox has amongst
the highest exposures to the relatively buoyant US market across our coverage universe. In
addition, the ongoing ramp-up of Bahru Stainless in Malaysia should help provide Acerinox
exposure to the relatively high-growth Asian market. While Acerinox is a high quality
operator, in light of the company’s premium valuation and risk to US market share, the
company is not one of our preferred Euro stainless steel equities. The company is
headquartered in Madrid, Spain.
Factors which could be supportive of
Acerinox’s share price include the
following:
A rebound in global stainless steel
demand
Anti-dumping measures by the EC
lead a significant reduction of imports
from Asia
Nickel price increases lead to
customer restocking
Greater-than-expected dividend
growth (past increases have been
quite modest)
Catalysts
Target Investment Thesis
Recent years of industry restructuring
lead to higher European utilisation
rates, improving pricing power for
domestic producers
2015-17 should see a gradual
tightening of the nickel market
Global economy continues to grow
moderately, driven by emerging
market economies
2015E EBITDA: €492m; Target
Multiple 8.2x; Price Target €13.00
Upside Scenario
Global growth surprises to the upside,
increasing demand for stainless steel
products
European Commission (EC)
announces new anti-dumping/anti-
subsidy duties against China and
Taiwan, cutting imports and
improving Euro pricing power
Price Target €16.00, driven by a 10%
increase in forecast base prices, target
multiple held constant
Downside Scenario
While we have high conviction in our
target investment thesis, it is possible
that global growth could surprise to
the downside, which could lead to
further weakness in stainless demand
and lower-than-expected prices
Imports from Asia continue to grow,
weighing further on European
utilisation rates, prices and profitability
Price Target €10.00, driven by a 10%
decrease in forecast base prices, target
multiple held constant
Long Term Analysis
Scenarios
Group EV/EBITDAs (2015E)
Source: Factset, Jefferies estimates
0.0x
2.0x
4.0x
6.0x
8.0x
10.0x
Acerinox Aperam Outokumpu
EV/EBITDA vs EBIT Margin (2015E)
Source: Factset, Jefferies estimates
ACX APAM
OUT1V
0%
2%
4%
6%
8%
3.0x 5.0x 7.0x 9.0x
Recommendation / Price Target
Ticker Rec. PT
ACX SM Hold €13.00
APAM NA Buy €30.00
OUT1V FH Buy €6.00
Company Description
THE LO
NG
VIE
W
Peer Group
Acerinox
Hold: €13.00 Price Target
Natural Resources
Initiating Coverage
8 January 2015
page 87 of 91 , Equity Analyst, +44 (0) 20 7029 8772, [email protected] Rosenfeld, CFA
Please see important disclosure information on pages 88 - 91 of this report.

Company DescriptionAcerinox manufactures and distributes hot and cold-rolled stainless steel products with plants in Spain, the United States and South Africa.Products are marketed primarily in Europe, Asia and the Americas. The company is headquartered in Madrid, Spain.
Aperam is a stainless steel producer with 2.5 million tonnes of flat stainless steel capacity in Europe and Brazil. Production capacity isconcentrated in six facilities located in Brazil, Belgium and France. Aperam was created in January 2011 as as the result of a spin-off of thestainless and specialty steel businesses from ArcelorMittal.
Outokumpu is a stainless steel producer with cold-rolling capacity of 2.6 million tonnes and production facilities across all continents. Thecompany is headquartered in Espoo, Finland.
Analyst Certification:I, Seth Rosenfeld, CFA, certify that all of the views expressed in this research report accurately reflect my personal views about the subjectsecurity(ies) and subject company(ies). I also certify that no part of my compensation was, is, or will be, directly or indirectly, related to the specificrecommendations or views expressed in this research report.I, Christopher LaFemina, CFA, certify that all of the views expressed in this research report accurately reflect my personal views about the subjectsecurity(ies) and subject company(ies). I also certify that no part of my compensation was, is, or will be, directly or indirectly, related to the specificrecommendations or views expressed in this research report.I, Alan Spence, CFA, certify that all of the views expressed in this research report accurately reflect my personal views about the subject security(ies) andsubject company(ies). I also certify that no part of my compensation was, is, or will be, directly or indirectly, related to the specific recommendationsor views expressed in this research report.Registration of non-US analysts: Seth Rosenfeld, CFA is employed by Jefferies International Limited, a non-US affiliate of Jefferies LLC and is notregistered/qualified as a research analyst with FINRA. This analyst(s) may not be an associated person of Jefferies LLC, a FINRA member firm, andtherefore may not be subject to the NASD Rule 2711 and Incorporated NYSE Rule 472 restrictions on communications with a subject company, publicappearances and trading securities held by a research analyst.
Registration of non-US analysts: Alan Spence, CFA is employed by Jefferies International Limited, a non-US affiliate of Jefferies LLC and is notregistered/qualified as a research analyst with FINRA. This analyst(s) may not be an associated person of Jefferies LLC, a FINRA member firm, andtherefore may not be subject to the NASD Rule 2711 and Incorporated NYSE Rule 472 restrictions on communications with a subject company, publicappearances and trading securities held by a research analyst.
As is the case with all Jefferies employees, the analyst(s) responsible for the coverage of the financial instruments discussed in this report receivescompensation based in part on the overall performance of the firm, including investment banking income. We seek to update our research asappropriate, but various regulations may prevent us from doing so. Aside from certain industry reports published on a periodic basis, the large majorityof reports are published at irregular intervals as appropriate in the analyst's judgement.
For Important Disclosure information on companies recommended in this report, please visit our website at https://javatar.bluematrix.com/sellside/Disclosures.action or call 212.284.2300.
Sections of this report have been submitted to the companies prior to publication solely for the purposes of verifying the factual accuracy of informationand non-material amendments have been made.
Meanings of Jefferies RatingsBuy - Describes stocks that we expect to provide a total return (price appreciation plus yield) of 15% or more within a 12-month period.Hold - Describes stocks that we expect to provide a total return (price appreciation plus yield) of plus 15% or minus 10% within a 12-month period.Underperform - Describes stocks that we expect to provide a total negative return (price appreciation plus yield) of 10% or more within a 12-monthperiod.The expected total return (price appreciation plus yield) for Buy rated stocks with an average stock price consistently below $10 is 20% or more withina 12-month period as these companies are typically more volatile than the overall stock market. For Hold rated stocks with an average stock priceconsistently below $10, the expected total return (price appreciation plus yield) is plus or minus 20% within a 12-month period. For Underperformrated stocks with an average stock price consistently below $10, the expected total return (price appreciation plus yield) is minus 20% within a 12-month period.NR - The investment rating and price target have been temporarily suspended. Such suspensions are in compliance with applicable regulations and/or Jefferies policies.CS - Coverage Suspended. Jefferies has suspended coverage of this company.NC - Not covered. Jefferies does not cover this company.Restricted - Describes issuers where, in conjunction with Jefferies engagement in certain transactions, company policy or applicable securitiesregulations prohibit certain types of communications, including investment recommendations.Monitor - Describes stocks whose company fundamentals and financials are being monitored, and for which no financial projections or opinions onthe investment merits of the company are provided.
Valuation MethodologyJefferies' methodology for assigning ratings may include the following: market capitalization, maturity, growth/value, volatility and expected totalreturn over the next 12 months. The price targets are based on several methodologies, which may include, but are not restricted to, analyses of marketrisk, growth rate, revenue stream, discounted cash flow (DCF), EBITDA, EPS, cash flow (CF), free cash flow (FCF), EV/EBITDA, P/E, PE/growth, P/CF,P/FCF, premium (discount)/average group EV/EBITDA, premium (discount)/average group P/E, sum of the parts, net asset value, dividend returns,and return on equity (ROE) over the next 12 months.
Natural Resources
Initiating Coverage
8 January 2015
page 88 of 91 , Equity Analyst, +44 (0) 20 7029 8772, [email protected] Rosenfeld, CFA
Please see important disclosure information on pages 88 - 91 of this report.

Jefferies Franchise PicksJefferies Franchise Picks include stock selections from among the best stock ideas from our equity analysts over a 12 month period. Stock selectionis based on fundamental analysis and may take into account other factors such as analyst conviction, differentiated analysis, a favorable risk/rewardratio and investment themes that Jefferies analysts are recommending. Jefferies Franchise Picks will include only Buy rated stocks and the numbercan vary depending on analyst recommendations for inclusion. Stocks will be added as new opportunities arise and removed when the reason forinclusion changes, the stock has met its desired return, if it is no longer rated Buy and/or if it triggers a stop loss. Stocks having 120 day volatility inthe bottom quartile of S&P stocks will continue to have a 15% stop loss, and the remainder will have a 20% stop. Franchise Picks are not intendedto represent a recommended portfolio of stocks and is not sector based, but we may note where we believe a Pick falls within an investment stylesuch as growth or value.
Risk which may impede the achievement of our Price TargetThis report was prepared for general circulation and does not provide investment recommendations specific to individual investors. As such, thefinancial instruments discussed in this report may not be suitable for all investors and investors must make their own investment decisions basedupon their specific investment objectives and financial situation utilizing their own financial advisors as they deem necessary. Past performance ofthe financial instruments recommended in this report should not be taken as an indication or guarantee of future results. The price, value of, andincome from, any of the financial instruments mentioned in this report can rise as well as fall and may be affected by changes in economic, financialand political factors. If a financial instrument is denominated in a currency other than the investor's home currency, a change in exchange rates mayadversely affect the price of, value of, or income derived from the financial instrument described in this report. In addition, investors in securities suchas ADRs, whose values are affected by the currency of the underlying security, effectively assume currency risk.
Other Companies Mentioned in This Report• ArcelorMittal (MT: $10.28, BUY)• ArcelorMittal (MT NA: €8.66, BUY)• Evraz PLC (EVR LN: p149.80, UNDERPERFORM)• Kloeckner & Co SE (KCO GY: €8.93, HOLD)• Salzgitter (SZG GY: €22.92, HOLD)• SSAB AB (SSABA SS: SEK42.14, HOLD)• ThyssenKrupp AG (TKA GY: €20.61, BUY)• Voestalpine AG (VOE AV: €31.31, BUY)
Distribution of RatingsIB Serv./Past 12 Mos.
Rating Count Percent Count Percent
BUY 1044 51.91% 281 26.92%HOLD 820 40.78% 145 17.68%UNDERPERFORM 147 7.31% 5 3.40%
Natural Resources
Initiating Coverage
8 January 2015
page 89 of 91 , Equity Analyst, +44 (0) 20 7029 8772, [email protected] Rosenfeld, CFA
Please see important disclosure information on pages 88 - 91 of this report.

Other Important Disclosures
Jefferies Equity Research refers to research reports produced by analysts employed by one of the following Jefferies Group LLC (“Jefferies”) groupcompanies:
United States: Jefferies LLC which is an SEC registered firm and a member of FINRA.
United Kingdom: Jefferies International Limited, which is authorized and regulated by the Financial Conduct Authority; registered in England andWales No. 1978621; registered office: Vintners Place, 68 Upper Thames Street, London EC4V 3BJ; telephone +44 (0)20 7029 8000; facsimile +44 (0)207029 8010.
Hong Kong: Jefferies Hong Kong Limited, which is licensed by the Securities and Futures Commission of Hong Kong with CE number ATS546; locatedat Suite 2201, 22nd Floor, Cheung Kong Center, 2 Queen’s Road Central, Hong Kong.
Singapore: Jefferies Singapore Limited, which is licensed by the Monetary Authority of Singapore; located at 80 Raffles Place #15-20, UOB Plaza 2,Singapore 048624, telephone: +65 6551 3950.
Japan: Jefferies (Japan) Limited, Tokyo Branch, which is a securities company registered by the Financial Services Agency of Japan and is a memberof the Japan Securities Dealers Association; located at Hibiya Marine Bldg, 3F, 1-5-1 Yuraku-cho, Chiyoda-ku, Tokyo 100-0006; telephone +813 52516100; facsimile +813 5251 6101.
India: Jefferies India Private Limited (CIN - U74140MH2007PTC200509), which is licensed by the Securities and Exchange Board of India as a MerchantBanker (INM000011443) and a Stock Broker with Bombay Stock Exchange Limited (INB011491033) and National Stock Exchange of India Limited(INB231491037) in the Capital Market Segment; located at 42/43, 2 North Avenue, Maker Maxity, Bandra-Kurla Complex, Bandra (East) Mumbai 400051, India; Tel +91 22 4356 6000.
This material has been prepared by Jefferies employing appropriate expertise, and in the belief that it is fair and not misleading. The information setforth herein was obtained from sources believed to be reliable, but has not been independently verified by Jefferies. Therefore, except for any obligationunder applicable rules we do not guarantee its accuracy. Additional and supporting information is available upon request. Unless prohibited by theprovisions of Regulation S of the U.S. Securities Act of 1933, this material is distributed in the United States ("US"), by Jefferies LLC, a US-registeredbroker-dealer, which accepts responsibility for its contents in accordance with the provisions of Rule 15a-6, under the US Securities Exchange Act of1934. Transactions by or on behalf of any US person may only be effected through Jefferies LLC. In the United Kingdom and European EconomicArea this report is issued and/or approved for distribution by Jefferies International Limited and is intended for use only by persons who have, or havebeen assessed as having, suitable professional experience and expertise, or by persons to whom it can be otherwise lawfully distributed. JefferiesInternational Limited has adopted a conflicts management policy in connection with the preparation and publication of research, the details of whichare available upon request in writing to the Compliance Officer. Jefferies International Limited may allow its analysts to undertake private consultancywork. Jefferies International Limited’s conflicts management policy sets out the arrangements Jefferies International Limited employs to manage anypotential conflicts of interest that may arise as a result of such consultancy work. For Canadian investors, this material is intended for use only byprofessional or institutional investors. None of the investments or investment services mentioned or described herein is available to other personsor to anyone in Canada who is not a "Designated Institution" as defined by the Securities Act (Ontario). In Singapore, Jefferies Singapore Limited isregulated by the Monetary Authority of Singapore. For investors in the Republic of Singapore, this material is provided by Jefferies Singapore Limitedpursuant to Regulation 32C of the Financial Advisers Regulations. The material contained in this document is intended solely for accredited, expert orinstitutional investors, as defined under the Securities and Futures Act (Cap. 289 of Singapore). If there are any matters arising from, or in connectionwith this material, please contact Jefferies Singapore Limited, located at 80 Raffles Place #15-20, UOB Plaza 2, Singapore 048624, telephone: +656551 3950. In Japan this material is issued and distributed by Jefferies (Japan) Limited to institutional investors only. In Hong Kong, this report isissued and approved by Jefferies Hong Kong Limited and is intended for use only by professional investors as defined in the Hong Kong Securities andFutures Ordinance and its subsidiary legislation. In the Republic of China (Taiwan), this report should not be distributed. The research in relation tothis report is conducted outside the PRC. This report does not constitute an offer to sell or the solicitation of an offer to buy any securities in the PRC.PRC investors shall have the relevant qualifications to invest in such securities and shall be responsible for obtaining all relevant approvals, licenses,verifications and/or registrations from the relevant governmental authorities themselves. In India this report is made available by Jefferies India PrivateLimited. In Australia this information is issued solely by Jefferies International Limited and is directed solely at wholesale clients within the meaning ofthe Corporations Act 2001 of Australia (the "Act") in connection with their consideration of any investment or investment service that is the subject ofthis document. Any offer or issue that is the subject of this document does not require, and this document is not, a disclosure document or productdisclosure statement within the meaning of the Act. Jefferies International Limited is authorised and regulated by the Financial Conduct Authorityunder the laws of the United Kingdom, which differ from Australian laws. Jefferies International Limited has obtained relief under Australian Securitiesand Investments Commission Class Order 03/1099, which conditionally exempts it from holding an Australian financial services licence under theAct in respect of the provision of certain financial services to wholesale clients. Recipients of this document in any other jurisdictions should informthemselves about and observe any applicable legal requirements in relation to the receipt of this document.
This report is not an offer or solicitation of an offer to buy or sell any security or derivative instrument, or to make any investment. Any opinion orestimate constitutes the preparer's best judgment as of the date of preparation, and is subject to change without notice. Jefferies assumes no obligationto maintain or update this report based on subsequent information and events. Jefferies, its associates or affiliates, and its respective officers, directors,and employees may have long or short positions in, or may buy or sell any of the securities, derivative instruments or other investments mentioned ordescribed herein, either as agent or as principal for their own account. Upon request Jefferies may provide specialized research products or servicesto certain customers focusing on the prospects for individual covered stocks as compared to other covered stocks over varying time horizons orunder differing market conditions. While the views expressed in these situations may not always be directionally consistent with the long-term viewsexpressed in the analyst's published research, the analyst has a reasonable basis and any inconsistencies can be reasonably explained. This materialdoes not constitute a personal recommendation or take into account the particular investment objectives, financial situations, or needs of individualclients. Clients should consider whether any advice or recommendation in this report is suitable for their particular circumstances and, if appropriate,seek professional advice, including tax advice. The price and value of the investments referred to herein and the income from them may fluctuate. Pastperformance is not a guide to future performance, future returns are not guaranteed, and a loss of original capital may occur. Fluctuations in exchangerates could have adverse effects on the value or price of, or income derived from, certain investments. This report has been prepared independently ofany issuer of securities mentioned herein and not in connection with any proposed offering of securities or as agent of any issuer of securities. Noneof Jefferies, any of its affiliates or its research analysts has any authority whatsoever to make any representations or warranty on behalf of the issuer(s).Jefferies policy prohibits research personnel from disclosing a recommendation, investment rating, or investment thesis for review by an issuer prior
Natural Resources
Initiating Coverage
8 January 2015
page 90 of 91 , Equity Analyst, +44 (0) 20 7029 8772, [email protected] Rosenfeld, CFA
Please see important disclosure information on pages 88 - 91 of this report.
to the publication of a research report containing such rating, recommendation or investment thesis. Any comments or statements made herein arethose of the author(s) and may differ from the views of Jefferies.
This report may contain information obtained from third parties, including ratings from credit ratings agencies such as Standard & Poor’s. Reproductionand distribution of third party content in any form is prohibited except with the prior written permission of the related third party. Third party contentproviders do not guarantee the accuracy, completeness, timeliness or availability of any information, including ratings, and are not responsible forany errors or omissions (negligent or otherwise), regardless of the cause, or for the results obtained from the use of such content. Third party contentproviders give no express or implied warranties, including, but not limited to, any warranties of merchantability or fitness for a particular purpose oruse. Third party content providers shall not be liable for any direct, indirect, incidental, exemplary, compensatory, punitive, special or consequentialdamages, costs, expenses, legal fees, or losses (including lost income or profits and opportunity costs) in connection with any use of their content,including ratings. Credit ratings are statements of opinions and are not statements of fact or recommendations to purchase, hold or sell securities. Theydo not address the suitability of securities or the suitability of securities for investment purposes, and should not be relied on as investment advice.
Jefferies research reports are disseminated and available primarily electronically, and, in some cases, in printed form. Electronic research issimultaneously available to all clients. This report or any portion hereof may not be reprinted, sold or redistributed without the written consent ofJefferies. Neither Jefferies nor any officer nor employee of Jefferies accepts any liability whatsoever for any direct, indirect or consequential damagesor losses arising from any use of this report or its contents.
For Important Disclosure information, please visit our website at https://javatar.bluematrix.com/sellside/Disclosures.action or call 1.888.JEFFERIES
© 2015 Jefferies Group LLC
Natural Resources
Initiating Coverage
8 January 2015
page 91 of 91 , Equity Analyst, +44 (0) 20 7029 8772, [email protected] Rosenfeld, CFA
Please see important disclosure information on pages 88 - 91 of this report.