Embed Size (px)
Citation preview

Florida’s Statewide Comprehensive Outdoor Recreation Plan
Outdoor Recreation inFlorida 2013

Front cover photos (L to R): Fishing at Dr. Julian G. Bruce St. George Island State Park, credit: Juliane Eckert; Stretching before practice in Marion County, credit: Florida Recreation and Park Association; Lighthouse in the distance at
Anclote Key Preserve State Park; Kayaking at Fort George Island Cultural State Park

Outdoor Recreation in Florida 2013A Comprehensive Program for Meeting Florida’s Outdoor Recreation Needs
State of Florida, Department of Environmental ProtectionDivision of Recreation and Parks
Tallahassee, Florida
Photo credits: Amelia Island State Park; Highlands Hammock State Park; Dr. Julian G. Bruce St. George Island State Park, credit: Tabatha Spurlock


i
Table of Contents
CHAPTER 1 Introduction and Background
Purpose ....................................................................................................................................1Outdoor Recreation: A Legitimate Role for Government ......................................................... 2Roles in Outdoor Recreation Planning .................................................................................... 3Planning Process ..................................................................................................................... 3 Public Participation ........................................................................................................... 4 Planning Coordination ...................................................................................................... 4 Planning Regions ............................................................................................................. 6Conclusion ............................................................................................................................... 6
CHAPTER 2 Florida’s Outdoor Recreation Setting
Florida’s People and Economy ................................................................................................ 9Physical Situation ...................................................................................................................11Climate ....................................................................................................................................11Geology ..................................................................................................................................12Physiography ..........................................................................................................................12Hydrology ................................................................................................................................13Vegetation and Wildlife ...........................................................................................................14History and Culture .................................................................................................................15
CHAPTER 3 Outdoor Recreation Programs and Supply
Roles in Providing Outdoor Recreation ..................................................................................17Outdoor Recreation Programs ................................................................................................19Federal Programs ...................................................................................................................19State Programs .......................................................................................................................28Local Government Providers ................................................................................................. 43
Non-Government Roles .......................................................................................................... 44
CHAPTER 4 Outdoor Recreation Demand and NeedOutdoor Recreation Demand ..................................................................................................47Comparing Demand and Supply ............................................................................................ 50Conclusion ............................................................................................................................. 54
CHAPTER 5 Outdoor Recreation Issues and RecommendationsA System of Lands ................................................................................................................. 55Issues, Goals and Strategies: A Method for Implementation ................................................. 56 Issue One: Raising Awareness ...................................................................................... 56 Issue Two: Improving Public Access .............................................................................. 60 Issue Three: Reconnecting People to the Outdoors ...................................................... 65

List of Figures
CHAPTER 1 Introduction and Background
Figure 1.1: The Role of Public Participation ............................................................................ 5Figure 1.2: SCORP Planning Regions .................................................................................... 7
CHAPTER 2 Florida’s Outdoor Recreation Setting
Figure 2.1: Florida’s Population 1960-2030 ............................................................................. 9Figure 2.2: Physiographic Regions .........................................................................................12
CHAPTER 3 Outdoor Recreation Programs and Supply
Figure 3.1: Federal Recreation Lands by Managing Agency ................................................. 22Figure 3.2: State Recreation Lands by Managing Agency ..................................................... 30Figure 3.3: Regional Planning Councils ................................................................................. 42
CHAPTER 4 Outdoor Recreation Demand and NeedFigure 4.1: Top Five Outdoor Recreation Opportunities .........................................................48Figure 4.2: Satisfaction with Outdoor Recreation Opportunities ............................................ 49Figure 4.3: Level of Service Equation .................................................................................... 51Figure 4.4: Regional Distribution of Tourists and Residents .................................................. 52Figure 4.5: Regional Distribution to Recreation Supply ......................................................... 52
List of Tables
CHAPTER 2 Florida’s Outdoor Recreation Setting
Table 2.1: Visitor Estimates for Florida 2005-2011 ..................................................................11
CHAPTER 3 Outdoor Recreation Programs and Supply
Table 3.1: Outdoor Recreation Facilities and Resources by Category ................................. 21Table 3.2: Federal Agency Outdoor Recreation Resources .................................................. 23Table 3.3: State Agency Outdoor Recreation Resources ...................................................... 31Table 3.4: Local Agency Outdoor Recreation Resources ...................................................... 43
CHAPTER 4 Outdoor Recreation Demand and NeedTable 4.1: Regional Level of Services Comparison ............................................................... 53
ii

iii
Appendices
A. Terms and Definitions ................................................................................................... A-1B. Acronyms ...................................................................................................................... B-1C. Florida Recreational Trail Opportunities Maps .............................................................. C-1D. Open Project Selection Process ................................................................................... D-1E. Responsive Management Methodology & Survey ........................................................ E-1F. Online Questionnaires ................................................................................................... F-1G. Outdoor Recreation Participation by Activity .................................................................. G-1H. Level of Service Charts and Activity Profiles ................................................................ H-1I. Supply Charts by Agency ................................................................................................ I-1J. Assessment and Protection of Wetlands ........................................................................ J-1


PURPOSE
The purpose of Florida’s statewide comprehensive outdoor recreation plan (SCORP) is to outline a five year policy plan and establish a framework for statewide outdoor recreation planning. Section 375.021, Florida Statutes, provides that the plan will document recreational supply and demand, describe current recreational opportunities, estimate needs for additional recreational opportunities and propose means for meeting identified needs. The plan is intended to be a broad statewide and regional appraisal of the outdoor recreation needs of Florida and a guide for the development of a diverse, balanced statewide outdoor recreation system.
In conjunction with that purpose, the plan is intended to fulfill the requirements of the Land and Water Conservation Fund Act of 1965 (P.L. 88-578), which was established to create parks and open spaces, protect wilderness, wetlands and refuges, preserve wildlife habitat and enhance recreational opportunities. Under this program, Florida receives matching grants to acquire and develop outdoor recreation lands and facilities. Within the plan, the following issues are required to be addressed in accordance with federal planning requirements:
• Evaluate demand for and supply of outdoor recreation resources and facilities; • Conduct studies periodically to estimate and analyze outdoor recreation demand; • Provide ample opportunity for public participation involving all segments of the population; • Address current wetland protection strategies as required by the Emergency Wetlands Resources Act of 1986 (P.L. 99-645); • Identify state and national outdoor recreation trends and initiatives; • Develop and implement an “Open Project Selection Process” for Land and Water Conservation Fund grants.
This plan is part of an outdoor recreation planning process that Florida has pursued since 1963. The Florida Department of Environmental Protection (DEP), Division of Recreation and Parks (DRP) coordinates and develops the plan according to state and federal legislative requirements.
Specific planning authority is provided by Section 375.021(1), Florida Statutes, which gives DEP specific responsibility, authority and power to develop and execute a comprehensive, multipurpose statewide outdoor recreation plan. Additionally, Section
Chapter One - Introduction and Background
1
SpotlightSection 375.021, Florida StatutesComprehensive multi-purpose outdoor recreation plan
1) The Department is given the responsibility, authority, and power to develop and execute a comprehensive multi-purpose outdoor recreation plan for this State with the cooperation of the Department of Agriculture and Consumer Services, the Department of Transportation, the Fish and Wildlife Conservation Commission, the Department of Economic Opportunity, and the water management districts.
2) The purpose of the plan is to document recreational supply and demand, describe current recreational opportunities, estimate the need for additional recreational opportunities, and propose means for meeting identified needs. The plan shall describe statewide recreational needs, opportunities, and potential opportunities.
2
258.004(3), Florida Statutes, directs DEP to study and appraise the recreation needs of the state and assemble and disseminate information relative to recreation.
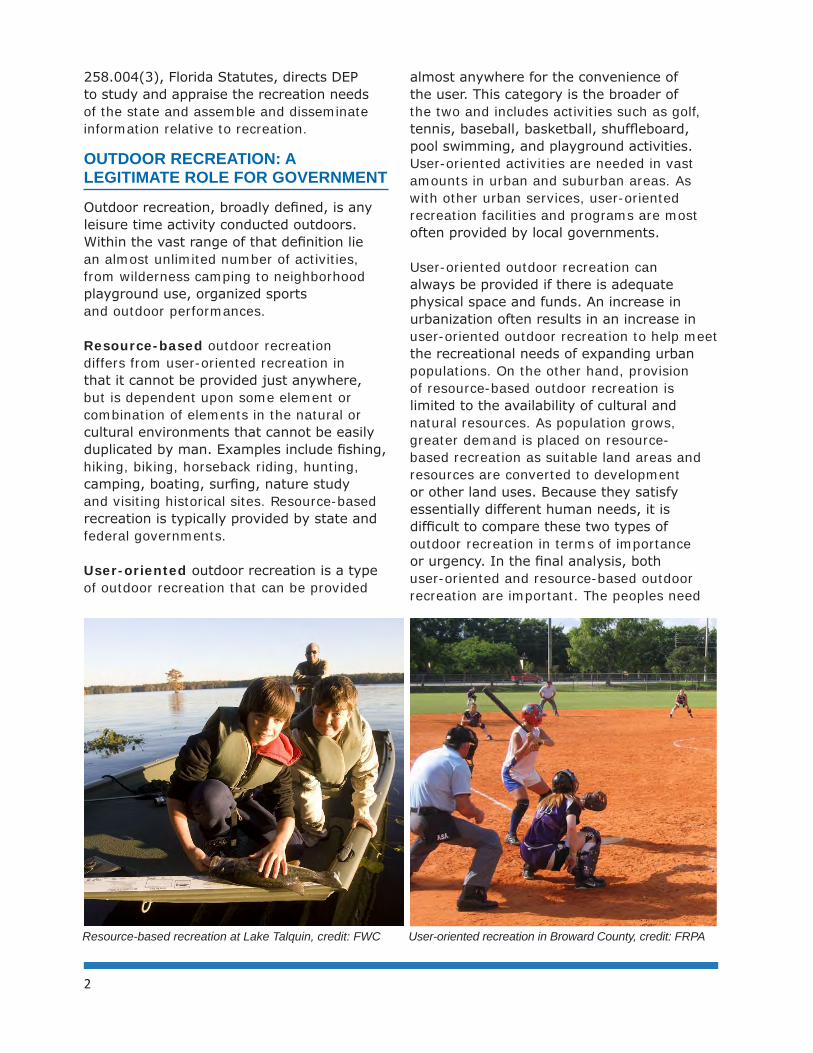
OUTDOOR RECREATION: A LEGITIMATE ROLE FOR GOVERNMENT
Outdoor recreation, broadly defined, is any leisure time activity conducted outdoors. Within the vast range of that definition lie an almost unlimited number of activities, from wilderness camping to neighborhood playground use, organized sports and outdoor performances.
Resource-based outdoor recreation differs from user-oriented recreation in that it cannot be provided just anywhere, but is dependent upon some element or combination of elements in the natural or cultural environments that cannot be easily duplicated by man. Examples include fishing, hiking, biking, horseback riding, hunting, camping, boating, surfing, nature study and visiting historical sites. Resource-based recreation is typically provided by state and federal governments.
User-oriented outdoor recreation is a type of outdoor recreation that can be provided
almost anywhere for the convenience of the user. This category is the broader of the two and includes activities such as golf, tennis, baseball, basketball, shuffleboard, pool swimming, and playground activities. User-oriented activities are needed in vast amounts in urban and suburban areas. As with other urban services, user-oriented recreation facilities and programs are most often provided by local governments.
User-oriented outdoor recreation can always be provided if there is adequate physical space and funds. An increase in urbanization often results in an increase in user-oriented outdoor recreation to help meet the recreational needs of expanding urban populations. On the other hand, provision of resource-based outdoor recreation is limited to the availability of cultural and natural resources. As population grows, greater demand is placed on resource-based recreation as suitable land areas and resources are converted to development or other land uses. Because they satisfy essentially different human needs, it is difficult to compare these two types of outdoor recreation in terms of importance or urgency. In the final analysis, both user-oriented and resource-based outdoor recreation are important. The peoples need
Resource-based recreation at Lake Talquin, credit: FWC User-oriented recreation in Broward County, credit: FRPA

3
for both must be met expeditiously if Florida hopes to keep pace with the demands of a growing population.
Since the late-19th Century, Americans have accepted the idea that the provision of most types of outdoor recreation is a proper function of government. Public responsibility for outdoor recreation stems from two essential purposes: the promotion of social welfare, and the protection of our common natural and cultural heritage. As a matter of social welfare, outdoor recreation is provided by governments as a means of healthfully occupying the leisure time and enhancing the quality of life of citizens. The management of natural resources is also a matter of public interest in Florida for the ecological and health benefits our citizens and visitors receive from healthy and diverse natural areas throughout the state in the forms of fresh air, fresh water, exercise and the relief of modern stress. Finally, preserved and interpreted historic and prehistoric resources are vital in that they explain our history and culture and provide a means for individual citizens to relate to the whole of Florida’s society.
ROLES IN OUTDOOR RECREATION PLANNING
Florida is a traditional destination for outdoor recreation seekers in the United States and from around the world. More than 87.3 million tourists visit annually to enjoy the
sunshine, sandy beaches and abundant outdoor recreation opportunities. Residents delight in Florida’s pleasant climate which provides endless opportunity for year-round outdoor recreation.
More recreation facilities and services are needed today than ever before, due largely to the continued growth, urbanization and diversification of the population, longer life expectancies, greater mobility and a greater appreciation of the values of recreation. People who recreate spend huge sums of money, consume large quantities of energy and demand tremendous amounts of open space in which to recreate. As a result, social and environmental conflicts may be generated that must be addressed through comprehensive and coordinated efforts by recreation managers at many levels of government. Effective coordination is also critical if we hope to maximize the health, economic and environmental benefits derived from recreation. Therefore, professional, systematic planning and program implementation are necessary to guide communities, government agencies and other organizations in addressing both the problems and the benefits of recreation statewide.
The political subdivisions of the state have the major responsibility for providing local recreation opportunities within their respective jurisdictions, with supplemental assistance from both the state and federal governments. At the state level, the leadership role requires that state agencies, particularly the Department of Environmental Protection, must work toward the most efficient utilization of human, financial and natural resources for the maximum benefit to the public. In addition, the state must provide a part of the financial, technical and physical resources needed to meet Florida’s statewide recreational demand.
PLANNING PROCESS
The process for creating the Statewide Comprehensive Outdoor Recreation Plan must reflect a balanced, statewide approach
A family enjoys RV camping at Gamble Rogers Memorial State Recreation Area at Flagler Beach
4
to be truly comprehensive. This SCORP achieves this in a variety of ways, from soliciting extensive input from recreation providers and consumers through public workshops and Web-based surveys to regular consultations with recreation professionals from around the state to ensure a unified agency-level approach in addressing the future of recreation in Florida.
As an ongoing effort, DEP also maintains an inventory of the recreation facilities provided throughout the state. From mid- 2011 to spring 2012, the data base was systematically updated by hundreds of municipal, county, state, federal, and private recreation providers in preparation for this planning effort.
In addition, DEP and Responsive Management, a natural resource survey research consulting firm, conducted the 2011 Outdoor Recreation Participation Study. The study gives an in-depth look at participation in outdoor recreation activities, explores changes in trends, and offers quantitative insight on the recreation demands of both residents and tourists in Florida. The results of the study are used throughout this document to provide both statewide and regional analyses that will be helpful planning tools to a wide variety of public and private recreation providers.
The SCORP stands alone as the state’s only comprehensive outdoor recreation plan. The result of its comprehensive methodology and inclusive planning process is a plan that provides a basis for cooperative action to resolve priority issues and a reasoned approach to meeting identified recreation needs throughout Florida. The plan provides statewide outdoor recreation programming guidance and is intended to influence the decisions of all potential recreation suppliers.
Public Participation
Public input to the plan was obtained through a combination of effecting methods, including an online questionnaire, public
workshops, and input from the participation survey. In April 2012, two online surveys were distributed, one targeting the general public and the other for public recreation providers. Input was received on recreation issues identified by the SCORP workgroup, meetings with stakeholders, and through research of national and statewide trends in outdoor recreation while additional issues and concerns were generated through open response items. The survey link was distributed to the public by multiple state and local agencies, yielding nearly 3,900 responses. Public workshops to gather input on the recommendations of the plan were conducted between September 12 and October 5, 2012 at these locations: Tallahassee, Sanford, Sarasota and Boca Raton. The SCORP workshops were combined with workshops for the update of the Florida Greenways and Trails System Plan to better coordinate both planning efforts and to consolidate staff and participant travel.
Planning Coordination
One of the most important links in the chain of outdoor recreation planning coordination is between state and local governments. Many county and municipal governments assisted in the development of this plan by cooperating in the preparation of the statewide inventory of outdoor recreation resources and facilities. This massive undertaking could not be accomplished without such assistance.
Additionally, all Florida counties and many municipalities have participated in state-sponsored financial and technical assistance programs, and other efforts involving recreation coordination. Local governments participate in the acquisition and management of land for outdoor recreation through multiple land acquisition and grant programs, including the Florida Forever Program, the Florida Communities Trust Program, the Land and Water Conservation Fund Program and the Florida Recreation Development Assistance Program.

5
State and local planning is further linked through the Local Government Comprehensive Planning and Land Development Regulation Act (Section 163.3167, Florida Statutes), through which the state provides technical assistance in plan preparation and state-level review of local plans. In developing their comprehensive plans, many local governments have made use of information and data contained in the Statewide Comprehensive Outdoor Recreation Plan.
State Level Coordination The success of the SCORP is largely contingent on the acceptance and implementation of its recommendations by both public and private recreation providers. To begin the update process of the 2013-2018 plan, a workgroup of state level land managing agencies was created to guide the planning efforts of the Division of Recreation and Parks staff. Staff members from the following agencies participated: Department
ONLINE SURVEY
OPE
N H
OUSES
The Role ofPUBLIC PARTICIPATION
PARTICIPATIO
N
STUDY
SCORP2013
ONLINE SURVEY Intended to understand recreation-based issues impacting Florida
Targeted Florida residents and public outdoor recreation providers
Received approximately 4,000 responses
Provided information on barriers, access and support for outdoor recreation
PARTICIPATION STUDY Intended to understand recreation participation rates throughout the State
Sampled nearly 7,000 residents and tourists
Provided insight into satisfaction and motivation for participating in outdoor recreation
SCORP WORKGROUPProvided multi-agency perspective on the current state of outdoor recreation in Florida
Meetings held throughout the development of SCORP 2013
SCORP OPEN HOUSES Opportunity for public review and comment on drafted components of SCORP 2013
Held in Tallahassee, Orlando area, Sarasota and Boca Raton
220+ attendees
Held in conjunction with the Florida Greenways and Trails System Plan and Florida National Scenic Trail Strategic Plan public comment sessions
WO
RKGROUP
Figure 1.1

6
of Agriculture and Consumer Services – Florida Forest Service, Department of Environmental Protection – Division of Recreation and Parks, Office of Coastal and Aquatic Managed Areas, Department of State – Division of Historical Resources, Florida Fish and Wildlife Conservation Commission, the state’s five water management districts, and the non-profit Florida Outdoor Recreation Coalition.
The advisory group focused its attention on three specific aspects of Florida’s Outdoor Recreation Plan: the planning process, the plan’s data methodology and the identification of recreation issues and trends. The group discussed each topic in detail and made recommendations in each area. The recommendations provided by the advisory group were critical to the development of an inclusive and relevant planning process. In addition, the advisory group helped to improve working relationships between the policy and recreation program staff of many agencies who will, hopefully, continue the collaboration going forward.
State-Federal CoordinationLiaison for outdoor recreation planning purposes is maintained with the U.S. Department of the Interior, National Park Service, especially through its Southeast Regional Office. Other federal agencies, such as the U.S. Fish and Wildlife Service, U.S. Forest Service and the U.S. Army Corps of Engineers, are consulted frequently at regional and field offices on recreation-related planning matters.
State-Private CoordinationPrivate outdoor recreational enterprises constitute a significant element of the Florida economy and will continue to be relied upon to provide a major share of the outdoor recreation supply in the state. Coordination with the private sector is necessary to achieve more efficient development and operation of mutual programs, to improve and expand the ongoing inventory of private recreation sites and facilities, and
to implement major recreation action program objectives. State-private liaison is established primarily through the trade organizations, conferences and networking opportunities such as the Governor’s Conference on Tourism and VISIT FLORIDA, which is primarily involved with tourism promotion and an array of commercial recreation enterprises. In addition, the DRP consults formally and informally with representatives of various clubs and groups concerned with conservation and recreation to discuss and resolve matters of mutual concern. State representatives also attend various gatherings of private organizations to present and discuss state recreation policies and programs.
Planning Regions
The 2013-2018 plan divides the state into eight planning regions (see Figure 1.2) to establish consistency with VISIT FLORIDA planning regions, considering the strong ties between recreation and tourism. This format for recreation data analyses will facilitate a statewide and regional comparative analysis of recreation participation, demand and need with the state’s current trends in tourism.
CONCLUSION
Florida is a leader in outdoor recreation across the nation and has made excellent progress in developing an outdoor recreation program to meet the needs of its residents and visitors. The need is still great, however, and demand for outdoor recreation opportunities will evolve and continue to grow in tandem with the state’s population. Whether for the health and welfare of Florida’s people, the stability of its tourist oriented economy or the prudent management of its natural resources, a carefully planned and effectively implemented outdoor recreation program is a major public need today. This plan provides a foundation for such a program in Florida.

7
Northwest
North CentralNortheast
Central East
Southeast
Southwest
Central
CentralWest
Figure 1.2SCORP Planning Regions


This chapter provides an overview of the social and physical setting for outdoor recreation in Florida. As Florida moves through the 21st Century, its astonishing rate of population growth continues.
FLORIDA’S PEOPLE AND ECONOMY
Florida’s population was 18.8 million in 2010 according to the 2010 U.S. Census, a 17.6 percent increase from 2000. Today, Florida is the fourth most-populated state in the nation and its population is projected to reach nearly 24.5 million by 2025.
The 2010 Census in Florida reported a rise in the Hispanic/Latino population from roughly 17 percent (2000 Census) to 22.5 percent – making Hispanics the fastest growing segment of the population in the state. In addition to becoming more culturally diverse, Florida’s population is also getting older. In 2010, 17.3 percent of Floridians were aged 65 or older, compared to the national average of 13 percent. Florida’s median age of 40.7 was fifth highest in the nation (the
national average is 37.2 years), an upward shift compared to 38.7 in 2000. The state’s rapid population growth, increasing ethnic diversity and the shift in age of its population will create complex challenges affecting many aspects of the state’s social and economic framework. The planning and coordination of Florida’s system of outdoor recreation programs will be affected by these changes.
If current trends continue, most of the new population will concentrate in relatively unpopulated counties adjacent to the highly developed metropolitan areas, particularly along the coast. As these areas become more crowded, problems such as loss of open space and natural areas, crowding and a higher cost of living will provide an impetus for further expansion into more rural areas. This sprawling pattern of growth reduces the availability of outdoor recreation land and facilities unless more land is acquired and more facilities developed in pace with the expansion. Ensuring that an adequate base of land for both user-oriented and resource-based recreation is acquired and sufficient
Chapter Two - Florida’s Outdoor Recreation Setting
9
0
5,000,000
10,000,000
15,000,000
20,000,000
25,000,000
30,000,000
1960 1970 1980 1990 2000 2010 2020 2030
Source: University of Florida, Bureau of Economic and Business Research, 2008
Florida’s Population, 1960 to 2030
Figure 2.1

10
funding resources are available for facilities development and operations continues to be a major challenge for recreation planning and programming in Florida.
To ensure a continued high quality of life in Florida, the amenities provided by the statewide outdoor recreation program must be coupled with a healthy social and economic climate. Among socioeconomic variables, income is a major factor in determining the ability of people to participate in many kinds of recreational activity. Unfortunately, during the past five years the nation has faced substantial economic challenges, and Florida is no exception. Between 2008 and 2009, per capita annual income in Florida dropped by roughly $2,600 to $37,382. This appears to have been the worst of the economic downturn as, in response to a slowly-improving national and state economic performance, incomes rose to an estimated $39,636 per capita in 2011, returning to near the 2008 level (Bureau of Economic Analysis). Significantly, Florida’s unemployment rate has surpassed the national average every year since 2008, and currently stands at 8.1
percent (November 2012), compared to a 7.7 percent national average. There is no certainty that pre-2008 economic growth rates and unemployment figures will return in the near future. The health of the state and local economies will always directly affect the public resources available to support outdoor recreation. Therefore, current economic conditions and subsequent financial support for recreation will continue as priority issues for recreation system planning in Florida.
Tourism-based activities support a major share of Florida’s economy. An estimated 87.3 million tourists visited Florida in 2011, a 6 percent increase from 2010. Taxable spending in the tourism and recreation category during 2011 totaled $67.2 billion, according to data from VISIT FLORIDA, the official tourism marketing organization of the state. Many tourism leaders are cautiously optimistic that Florida will remain a preferred destination for both domestic and international travelers, although increased competition from other vacation destinations, potential high gasoline costs and increases in other travel costs are major concerns.
Crowds enjoy Bill Baggs Cape Florida State Park in Dade County
11
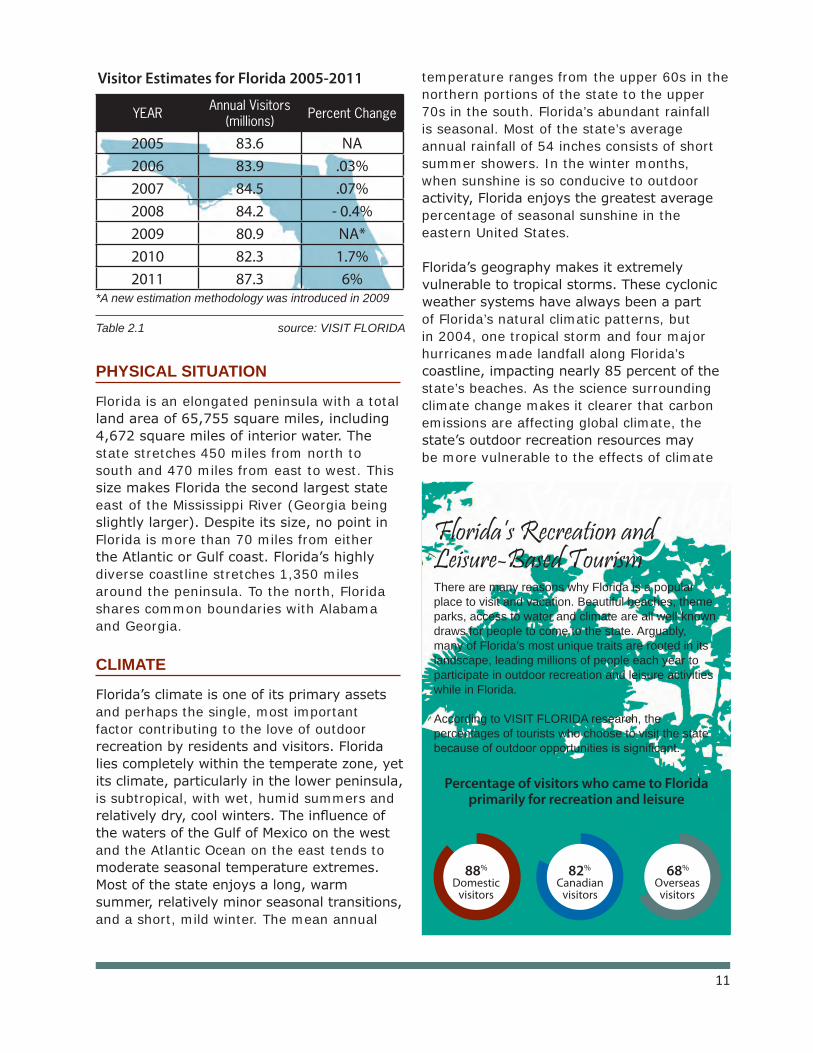
Visitor Estimates for Florida 2005-2011
Table 2.1 source: VISIT FLORIDA
YEAR Annual Visitors(millions) Percent Change
2005 83.6 NA2006 83.9 .03%2007 84.5 .07%2008 84.2 - 0.4%2009 80.9 NA*2010 82.3 1.7%2011 87.3 6%
*A new estimation methodology was introduced in 2009
PHYSICAL SITUATION
Florida is an elongated peninsula with a total land area of 65,755 square miles, including 4,672 square miles of interior water. The state stretches 450 miles from north to south and 470 miles from east to west. This size makes Florida the second largest state east of the Mississippi River (Georgia being slightly larger). Despite its size, no point in Florida is more than 70 miles from either the Atlantic or Gulf coast. Florida’s highly diverse coastline stretches 1,350 miles around the peninsula. To the north, Florida shares common boundaries with Alabama and Georgia.
CLIMATE
Florida’s climate is one of its primary assets and perhaps the single, most important factor contributing to the love of outdoor recreation by residents and visitors. Florida lies completely within the temperate zone, yet its climate, particularly in the lower peninsula, is subtropical, with wet, humid summers and relatively dry, cool winters. The influence of the waters of the Gulf of Mexico on the west and the Atlantic Ocean on the east tends to moderate seasonal temperature extremes. Most of the state enjoys a long, warm summer, relatively minor seasonal transitions, and a short, mild winter. The mean annual
temperature ranges from the upper 60s in the northern portions of the state to the upper 70s in the south. Florida’s abundant rainfall is seasonal. Most of the state’s average annual rainfall of 54 inches consists of short summer showers. In the winter months, when sunshine is so conducive to outdoor activity, Florida enjoys the greatest average percentage of seasonal sunshine in the eastern United States.
Florida’s geography makes it extremely vulnerable to tropical storms. These cyclonic weather systems have always been a part of Florida’s natural climatic patterns, but in 2004, one tropical storm and four major hurricanes made landfall along Florida’s coastline, impacting nearly 85 percent of the state’s beaches. As the science surrounding climate change makes it clearer that carbon emissions are affecting global climate, the state’s outdoor recreation resources may be more vulnerable to the effects of climate
SpotlightFlorida’s Recreation and Leisure-Based Tourism There are many reasons why Florida is a popular place to visit and vacation. Beautiful beaches, theme parks, access to water and climate are all well-known draws for people to come to the state. Arguably, many of Florida’s most unique traits are rooted in its landscape, leading millions of people each year to participate in outdoor recreation and leisure activities while in Florida.
According to VISIT FLORIDA research, the percentages of tourists who choose to visit the state because of outdoor opportunities is significant.
Percentage of visitors who came to Florida primarily for recreation and leisure
88%
Domesticvisitors
82%
Canadianvisitors
68%
Overseasvisitors

12
change than many other states. Changes in climate can affect water temperatures and salinity, disrupting natural conditions in sensitive areas such as coastal wetlands and coral reefs. Coastal erosion has also compromised many of the state’s important saltwater beaches, necessitating costly restoration and stabilization efforts to protect this vital component of Florida’s economy and culture.
GEOLOGY
Florida occupies only about half of a larger geological unit, the Floridian Plateau. This plateau is a partly submerged platform nearly 500 miles long and 250 to 400 miles wide. It separates the deep waters of the Atlantic Ocean and the Gulf of Mexico. The submerged portions of the plateau are called the continental shelf, extending out to an
ocean depth of about 300 feet. The plateau has been in existence for millions of years, during which time it has been alternately dry land or shallow sea. It consists of a core of metamorphic rocks buried under layers of sedimentary rocks (chiefly limestone) which vary in thickness from a little less than a mile to upwards of four miles.
PHYSIOGRAPHY
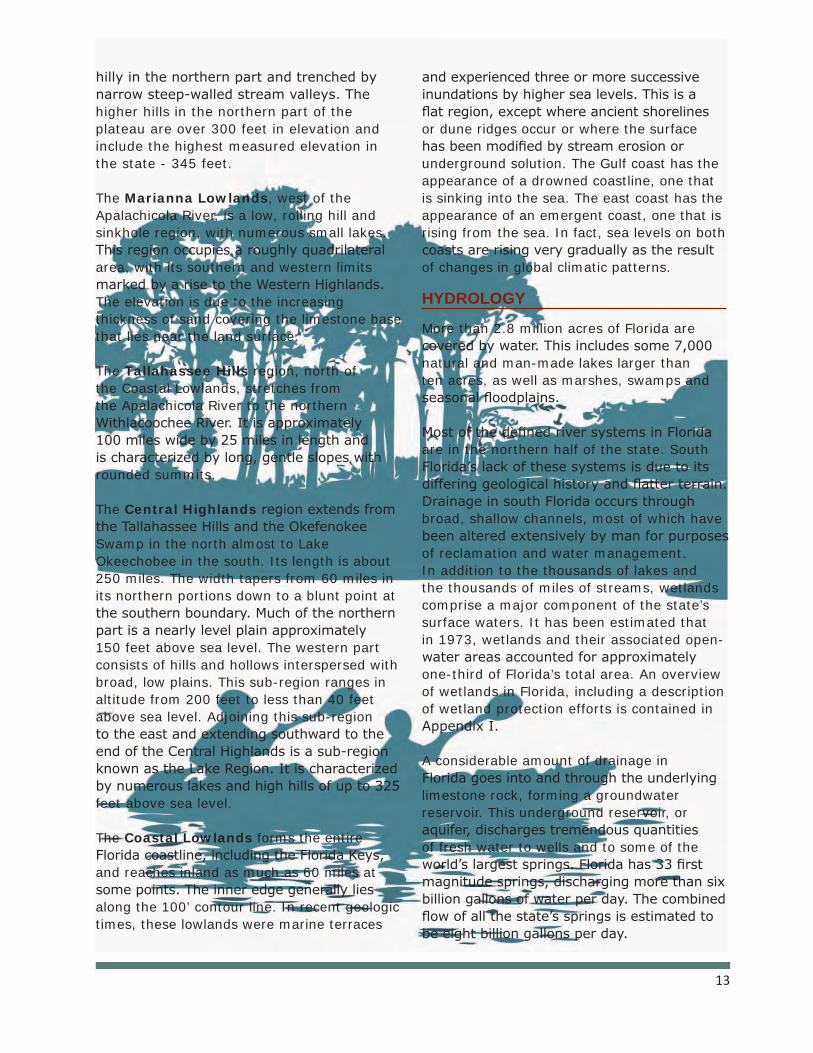
Five physical or natural regions are commonly identified in the state. They are the Western Highlands, the Marianna Lowlands, the Tallahassee Hills, the Central Highlands, and the Coastal Lowlands (see Figure 2.3).
The Western Highlands includes most of the Florida Panhandle between the Perdido and Apalachicola Rivers, north of the Coastal Lowlands. It is a southward-sloping plateau,
Figure 2.2Physiographic Regions
13
hilly in the northern part and trenched by narrow steep-walled stream valleys. The higher hills in the northern part of the plateau are over 300 feet in elevation and include the highest measured elevation in the state - 345 feet.
The Marianna Lowlands, west of the Apalachicola River, is a low, rolling hill and sinkhole region, with numerous small lakes. This region occupies a roughly quadrilateral area, with its southern and western limits marked by a rise to the Western Highlands. The elevation is due to the increasing thickness of sand covering the limestone base that lies near the land surface.
The Tallahassee Hills region, north of the Coastal Lowlands, stretches from the Apalachicola River to the northern Withlacoochee River. It is approximately 100 miles wide by 25 miles in length and is characterized by long, gentle slopes with rounded summits.
The Central Highlands region extends from the Tallahassee Hills and the Okefenokee Swamp in the north almost to Lake Okeechobee in the south. Its length is about 250 miles. The width tapers from 60 miles in its northern portions down to a blunt point at the southern boundary. Much of the northern part is a nearly level plain approximately 150 feet above sea level. The western part consists of hills and hollows interspersed with broad, low plains. This sub-region ranges in altitude from 200 feet to less than 40 feet above sea level. Adjoining this sub-region to the east and extending southward to the end of the Central Highlands is a sub-region known as the Lake Region. It is characterized by numerous lakes and high hills of up to 325 feet above sea level.
The Coastal Lowlands forms the entire Florida coastline, including the Florida Keys, and reaches inland as much as 60 miles at some points. The inner edge generally lies along the 100’ contour line. In recent geologic times, these lowlands were marine terraces
and experienced three or more successive inundations by higher sea levels. This is a flat region, except where ancient shorelines or dune ridges occur or where the surface has been modified by stream erosion or underground solution. The Gulf coast has the appearance of a drowned coastline, one that is sinking into the sea. The east coast has the appearance of an emergent coast, one that is rising from the sea. In fact, sea levels on both coasts are rising very gradually as the result of changes in global climatic patterns.
HYDROLOGY
More than 2.8 million acres of Florida are covered by water. This includes some 7,000 natural and man-made lakes larger than ten acres, as well as marshes, swamps and seasonal floodplains.
Most of the defined river systems in Florida are in the northern half of the state. South Florida’s lack of these systems is due to its differing geological history and flatter terrain. Drainage in south Florida occurs through broad, shallow channels, most of which have been altered extensively by man for purposes of reclamation and water management.In addition to the thousands of lakes and the thousands of miles of streams, wetlands comprise a major component of the state’s surface waters. It has been estimated that in 1973, wetlands and their associated open-water areas accounted for approximately one-third of Florida’s total area. An overview of wetlands in Florida, including a description of wetland protection efforts is contained in Appendix I.
A considerable amount of drainage in Florida goes into and through the underlying limestone rock, forming a groundwater reservoir. This underground reservoir, or aquifer, discharges tremendous quantities of fresh water to wells and to some of the world’s largest springs. Florida has 33 first magnitude springs, discharging more than six billion gallons of water per day. The combined flow of all the state’s springs is estimated to be eight billion gallons per day.

14
Between Florida’s offshore waters and its inland fresh waters are sheltered coastal waters generally referred to as estuaries. Estuaries form where the flow of fresh water from inland rivers and streams meets coastal waters. Estuaries are among Florida’s most biologically productive waters, and are vital to the state’s commercial and sports fisheries.
VEGETATION AND WILDLIFE
Vegetation dominates the Florida landscape. More than 65 percent of the state is covered by a seemingly endless variety of plant associations and natural communities. All of Florida’s natural vegetation is significant from the standpoint of outdoor recreation. In addition to its obvious aesthetic qualities, it utilizes carbon dioxide and produces oxygen, absorbs wastes and maintains water quality, provides food and habitat for game and other forms of wildlife, and performs a host of other environmental functions that themselves contribute to outdoor recreation. Providing effective management of Florida’s
diverse native plant communities through prescribed burning, exotic plant control, hydrological restoration and other methods is critical for maintaining their biological and recreational values.
Florida’s wildlife is as varied as the habitats that support it. Species range from those common throughout the southeastern United States to some that are virtually unknown elsewhere in the country such as the Florida panther, the Florida manatee and the
Manatee calf and mother, Blue Spring State Park
Indian Blanket Flower at Honeymoon Island State Park, credit: Sherry S. Werner
15
Florida scrub jay. Florida is inhabited by more than 490 bird species, 135 native, non-marine reptiles and amphibians, 250 native freshwater fish and nearly 80 mammals that spend all or part of their lives on land. These diverse wildlife resources provide a major attraction for outdoor recreation enthusiasts. Fish, both freshwater and saltwater, are exceptionally important to the economy and to outdoor recreation in Florida. Numerous game species play an important role as well. Non-game species, particularly bird life, support nature observation and appreciation and a range of environmental education activities.
HISTORY AND CULTURE
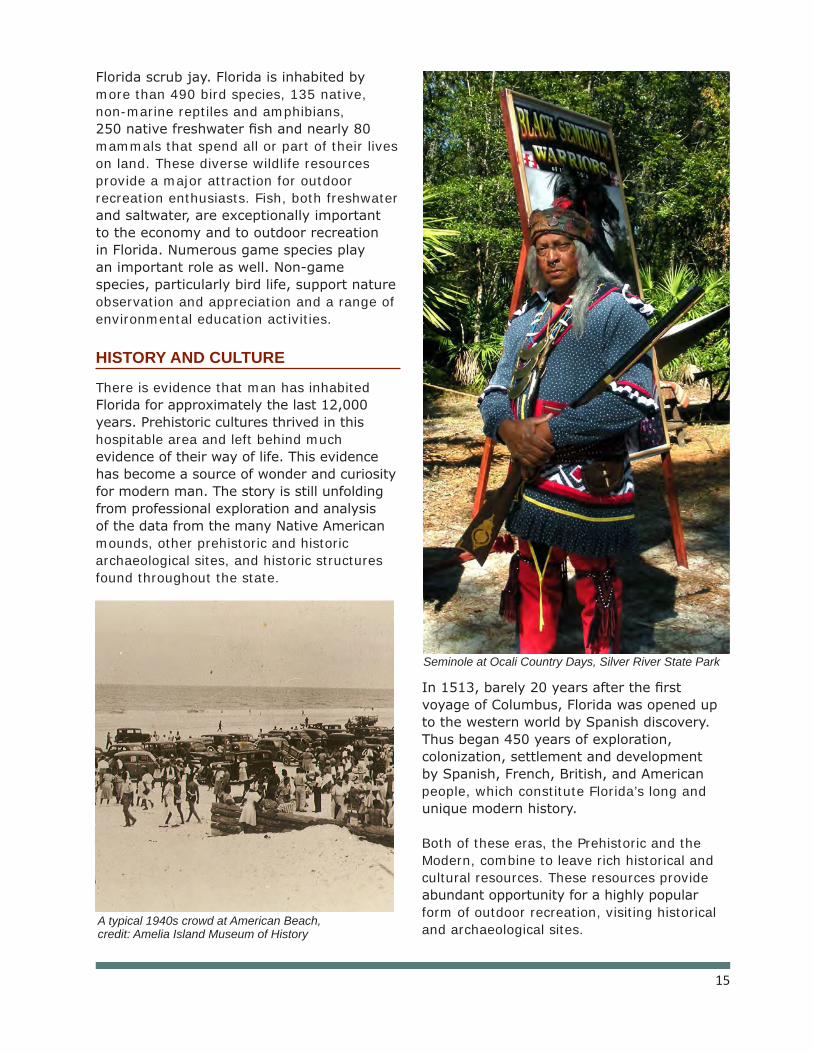
There is evidence that man has inhabited Florida for approximately the last 12,000 years. Prehistoric cultures thrived in this hospitable area and left behind much evidence of their way of life. This evidence has become a source of wonder and curiosity for modern man. The story is still unfolding from professional exploration and analysis of the data from the many Native American mounds, other prehistoric and historic archaeological sites, and historic structures found throughout the state.
In 1513, barely 20 years after the first voyage of Columbus, Florida was opened up to the western world by Spanish discovery. Thus began 450 years of exploration, colonization, settlement and development by Spanish, French, British, and American people, which constitute Florida’s long and unique modern history.
Both of these eras, the Prehistoric and the Modern, combine to leave rich historical and cultural resources. These resources provide abundant opportunity for a highly popular form of outdoor recreation, visiting historical and archaeological sites.
Seminole at Ocali Country Days, Silver River State Park
A typical 1940s crowd at American Beach, credit: Amelia Island Museum of History


17
Chapter Three - Outdoor Recreation Programs and Supply
Florida’s outdoor recreation program is the collaborative effort of many federal, state and local governments and private organizations, businesses and non-governmental organizations to fund, manage, and support opportunities for outdoor recreation. The following sections discuss the various roles in providing outdoor recreation, and describe how the multitude of outdoor recreation programs contribute to the overall supply of outdoor recreation in Florida.
ROLES IN PROVIDING OUTDOOR RECREATIONSome division of responsibility is needed if the state’s diverse public outdoor recreation needs are to be efficiently met. It is not reasonable, for example, to expect that agencies charged with managing state parks, forests and wildlife or water management areas would also be responsible for local ball fields, tennis courts and neighborhood parks.
State government has the responsibility for promoting and coordinating all outdoor recreation efforts beneficial to the general public. It is the only level of government where this task can be accomplished effectively, especially when the resources on which the recreation is based crosses jurisdictional boundaries as in a regional or statewide trail. Thus, the state must try to ensure, either directly or indirectly, that the public’s demand for outdoor recreation is brought into a reasonable balance, at least in a broad regional context, with the supply of opportunities. Rather than meet these needs entirely through state-level programs, the state should assume responsibility for ensuring that needs are met through the planned and coordinated efforts of state, federal and local governments and private interests.
As far as its direct programming efforts are concerned, the state’s primary responsibility
is to provide resource-based outdoor recreation. It accomplishes this through the acquisition of lands and development of facilities necessary to make natural and cultural outdoor recreation resources of regional or statewide significance available to the public. The extensive land requirements, the typical location outside urban centers, and the higher costs of operation have led the state to assume this role as a bridge between the large, nationally significant parks managed by the federal government and the community playgrounds and recreational facilities traditionally provided by local governments. No other level of government can meet this vital responsibility.
User-oriented outdoor recreation, like other local services, is largely the responsibility of local government. The need exists primarily in the urban areas and it increases in proportion to the degree of urbanization. Although local governments have focused primarily on user-oriented recreation, many counties have established excellent conservation and environmental land acquisition programs and have contributed to the provision of many types of resource-based recreation. In general, however,
Oak Grove Park Fitness Zone in Miami-Dade County,credit: Allana Wesley White/The Trust for Public Land

18
Horseback riding at privately run R.O. Ranch Equestrian Park in Mayo, Florida
local governments are the primary entities responsible for user-oriented recreation.
All local governments, large or small, are faced with the task of providing the full range of recreational opportunities that are so important to the well-being of their citizens. These include everything from cultural arts programs to nature trails. Local governments are finding it increasingly difficult to accomplish this, particularly in light of escalating costs and the national economic downturn.
While the state’s primary thrust in its outdoor recreation efforts is directed toward resource-based outdoor recreation, a substantial effort is made to assist local governments with financial support and technical assistance for meeting their needs for user-oriented recreation facilities. Three programs — the Florida Recreation Development Assistance Program, the Florida Communities Trust Program and the
Florida Recreational Trails Program — provide local governments with funds in the form of matching grants for acquiring and developing recreational lands and facilities. The demonstrated priorities and needs of local governments are given full consideration in the allocation of funds from these programs.
Private recreation providers are a vital component of the state’s outdoor recreation supply. Commercial providers meet a significant portion of the overall demand for both resource-based and user-oriented outdoor recreation in Florida, particularly tourist-generated demand. For example, commercial providers supply nearly 90 percent of the campsites in the state and meet a considerable portion of the overall demand for camping facilities by residents and visitors.
Non-profit organizations include private and quasi-public organizations such as the scouts, church groups and conservation organizations.
19
These groups provide land and facilities primarily for the use of their members, but in some cases for the public at large.
Clubs and other organizations not certified as non-profit by the Florida Department of State (DOS), such as hunt clubs, country clubs, yacht clubs and others, manage lands and facilities that are primarily available only to organization members and their guests. In doing so, they can relieve some of the pressure that is often placed on overcrowded public facilities. In addition, private industry lands (timber companies and other industries with extensive land holdings whose lands or portions thereof are open to the public) are used for resource-based recreation, although some forms of user-oriented facilities are also available. In recent years, however, many such areas have been withdrawn from use by the general public, particularly for hunting, and are now available only to leaseholders or others who have access to the lands.
OUTDOOR RECREATION PROGRAMSIn response to an ever-growing and ever-changing public demand, a variety of outdoor recreation programs have developed in Florida through the years. Although both private and public efforts have served this demand, most of the formal outdoor recreation programs have been instituted by various levels of government. Both state and federal agencies have been extensively involved, and practically every county and municipality in Florida conducts some outdoor recreation programs of its own. Many of these diverse programs have evolved more out of expediency than by careful design. As a result, there has been much duplication and overlap. Fortunately, however, most of the legitimate outdoor recreation needs in the state have been met in some fashion by concerted efforts to coordinate these governmental programs.
Florida’s outdoor recreation providers can be classified into five categories: federal government, state government, county government, municipal government and
private sector providers. Both federal and state agencies are concerned with areas and facilities designed to accommodate the demand for resource-based outdoor recreation. County and municipal governments are the primary suppliers of the public facilities needed for user-oriented recreation, although some also provide areas and facilities to meet part of the need for resource-based outdoor recreation. Private recreation providers, non-profit organizations, clubs and other organizations not certified as non-profit by the Florida Department of State, such as hunt clubs, country clubs, yacht clubs and others, are a vital component of the state’s outdoor recreation supply and meet a significant portion of the overall demand for both resource-based and user-oriented outdoor recreation in Florida.
The following describes the specific programs of the various categories of public and private recreation providers. Although the public agencies discussed in this section may have other responsibilities, only those related to outdoor recreation opportunities are addressed.
FEDERAL PROGRAMSThe federal government has responsibility for developing recreational facilities and programs that provide public opportunities that are not, or cannot, be made available by state or local government.
Federal roles in outdoor recreation are broad in scope and run the gamut from dredging waterways, lock and levee construction and maintenance, endangered species protection and habitat preservation, and providing crucial funds for many programs through federal grants. Federal agencies coordinate and cooperate on resource protection efforts such as protecting wilderness areas, designating wild and scenic rivers, and implementing trail connectivity projects that require inter-jurisdictional management. The core mission of most of the federal agencies, with the exception of the National Park Service, is not recreation per se. However,

20
by the nature of their settings - the national forests, wildlife refuges, military installations, dams and locks, waterways and estuaries of the state - these vast tracts of federal land are key locations for outdoor recreation and play a vital role in the state’s outdoor recreation supply.
U.S. Department of the InteriorNational Park ServiceThe National Park Service (NPS) has the specific mission to conserve the scenery and natural resources of national parks and provide a wide variety of outdoor recreation opportunities. Besides active land management for outdoor recreation, the federal agencies administer financial and
technical assistance programs to aid state and local agencies and private citizens.
In Florida, NPS’s mission includes:
• Managing 11 areas comprising approximately 2.6 million acres of submerged and upland areas set aside for their natural or historic interest.• Administering the federal Land and Water Conservation Fund Program, which provided more than $16 million to local governments between 2004 and 2011 to fund 87 park acquisition and development projects. These funds are awarded to meet recreation needs identified through an open selection process described in Appendix D.• Maintaining the National Register of Historic Places pursuant to the National Historic Preservation Act of 1966 (16 United States Code 470).• Designating significant properties or landmarks of national historical or archaeological interest, as defined in the Historic Sites Act of 1936 (16 United States Code 461), including districts, sites, buildings, structures and objects of state and regional significance.
SpotlightLand and Water Conservation Fund (LWCF)The National Park Service administers the Land and Water Conservation Fund, a federal program that provides funding for park acquisition and development projects. The LWCF provided over $16 million to local governments between 2004 and 2011, resulting in the establishment and improvement of over 80 different parks throughout Florida.
Bartlett Park, an urban park located in an economically disadvantaged neighborhood of St. Petersburg, received $200,000 through the LWCF program. The grant helped add lighted soccer and football fields, water features, an observation deck, fishing docks, hiking trail extensions, and funded the renovation of basketball courts, tennis courts, and playground equipment.
Fort Jefferson Dry Tortugas National Park, credit: National Park Service

21
Outdoor Recreation Resources and Facilities by Category of Provider, Statewide 2012
Facilities Federal State County Municipal Non-Government Total
Outdoor Recreation Areas 70 715 4,000 5,424 3,105 13,314
Land (in Acres) 4,600,730 4,697,593 422,331 113,022 410,594 10,244,270
Water (in Acres) 855,076 2,805,714 50,580 7,278 24,385 3,743,033
Acres TOTAL 5,455,806 7,503,307 472,911 120,300 434,979 13,987,303
Cabins 37 240 103 14 3,136 3,530
Tent Campsites 1,026 1,087 1,223 195 4,768 8,299
RV Campsites 2,138 4,778 3,531 1,451 118,750 130,648
Historic Sites 390 1,182 239 188 190 2,189
Commemorative Structures 9 26 33 148 38 254
Museums 25 103 136 116 163 543
Picnic Tables 1,966 9,345 26,375 24,060 56,373 118,119
Hunting Areas (Acres) 2,065,648 3,324,594 15,002 0 22,952 5,428,196
Bike Trails (Miles Paved) 73.5 358.5 600.8 439.6 63.5 1,536
Bike Trails (Miles Unpaved) 144 2,512.4 816.1 232.3 49.7 3,755
Canoe Trails (Miles) 517 997.6 247.6 136.6 309 2,208
Hiking Trails (Miles) 974 4,460.9 2,834.9 353.9 282.8 8,907
Equestrian Trails (Miles) 120.7 2,291.9 642.9 156.9 169.4 3,382
Jogging Trails (Miles) 71.4 312.1 638.3 263.7 71.3 1,357
OHV Trails (Miles) 401 286 0.2 0.7 0 688
Nature Trails (Miles) 310 278.5 707.5 375.9 208.2 1,880
Freshwater Beach (Miles) 0.7 4.1 17.4 6.7 9.3 38
Freshwater Boat Ramps 89 266 614 297 366 1,632
Freshwater Boat Ramps (Lanes) 98 288 756 362 417 1,921
Freshwater Catwalks 12 2,839 205 244 231 3,531
Freshwater Catwalks (Feet) 907 28,229 193,958 60,385 25,507 308,986
Freshwater Jetties 120 120 3,849 75,125 1,306 80,520
Freshwater Marinas 6 17 7 18 297 345
Freshwater Marinas (Slips) 51 86 234 682 10,218 11,271
Freshwater Piers 27 72 256 276 86 717
Freshwater Piers (Feet) 4,515 4,388 18,998 27,938 41,452 97,291
Saltwater Beach (Miles) 139 125 93.8 80.5 36.7 475
Saltwater Boat Ramps 35 45 278 258 314 930
Saltwater Boat Ramps (Lanes) 52 59 455 359 351 1,276
Saltwater Catwalks 53 52 363 192 145 805
Saltwater Catwalks (Feet) 23,044 20,541 72,542 54,857 42,161 213,145
Saltwater Jetties 10,120 11,603 14,389 26,769 9,964 72,845
Saltwater Marinas 11 32 22 65 618 748
Saltwater Marinas (Slips) 698 401 1,311 5,409 36,601 44,420
Saltwater Piers 17 41 148 155 102 463
Saltwater Piers (Feet) 7,506 20,032 37,509 50,905 19,703 135,655
Baseball Fields 51 66 2,609 2,804 181 5,711
Basketball Goals 55 103 3,791 3,507 647 8,103
Equipped Play Areas 52 92 1,889 2,746 449 5,228
Football Fields 18 48 1,043 936 91 2,136
Golf Courses, 18-Hole 8 3 14 63 800 888
Golf Courses, 9-Hole 5 2 13 20 138 178
Golf Courses, Executive 1 1 3 11 190 206
Golf Holes Total 207 75 399 1,459 16,884 19,024
Multi-Use Courts 6 12 406 375 159 958
Multi-Use Fields 9 56 980 810 235 2,090
Outdoor Swimming Pools 15 27 157 324 1,505 2,028
Racquetball Courts 19 187 644 733 265 1,848
Shuffleboard Courts 6 13 365 1,710 2,353 4,447
Tennis Courts 78 331 1,777 2,767 4,216 9,169
Volleyball Courts 1 50 355 331 46 783
Table 3.1

22
LEGEND
U.S. Department of the InteriorNational Park Service
National Parks and Preserves
National Memorials and Monuments
National Seashores
U.S. Fish and Wildlife Service
National Wildlife Refuges
U.S. Department of AgricultureU.S. Forest Service
National Forests
1 Big Cypress National Preserve2 Biscayne National Park3 Dry Tortugas National Park4 Everglades National Park5 Timucuan Ecological and Historic Preserve
12 Archie Carr13 Arthur R. Marshall Loxahatchee14 Caloosahatchee15 Cedar Keys16 Chassahowitzka17 Crocodile Lake18 Crystal River19 Egmont Key20 Florida Panther21 Great White Heron22 Hobe Sound23 Island Bay24 J.N. Ding Darling25 Key West26 Lake Wales Ridge
27 Lake Woodruff28 Lower Suwannee29 Matlacha Pass30 Merritt Island31 Key Deer32 Okefenokee33 Passage Key34 Pelican Island35 Pine Island36 Pinellas37 St. Johns38 St. Marks39 St. Vincent40 Ten Thousand Islands
6 Castillo de San Marcos National Monument7 De Soto National Memorial8 Fort Caroline National Memorial9 Fort Matanzas National Monument
10 Canaveral11 Gulf Islands
41 Apalachicola National Forest42 Ocala National Forest43 Osceola National Forest
Federal Recreation Lands by Managing Agency
Figure 3.1
23
• Partnering with other federal agencies as well as state and local government programs designed to achieve national goals such as clean air, protection of wilderness areas, clean water and access to waterways and coastal areas under the National Wild and Scenic Rivers Act and the Water Resources Development Act.• Providing matching grants through the Historic Preservation Grants- in-Aid Program, an expansion of the National Historic Preservation Act of 1966, to government, private groups and individuals for historic preservation surveys, planning activities and community education. These programs are administered in Florida by the Division of Historic Resources (DHR) within DOS.• Administering the Federal Lands-to- Parks Program, which enables states and local governments to establish park and recreation areas on federal properties which are no longer needed for military or civilian uses by conveying lands for that purpose.• Coordinating the Rivers and Trails Conservation Assistance Program
by providing planning assistance to communities for projects that are designed to protect rivers, trails and greenways on lands outside of the federal domain.
National Trail SystemThe National Trail System Act of 1968 (Public Law 90-543), authorized creation of a national trail system comprised of National Recreation Trails, National Scenic Trails and National Historic Trails. While National Scenic Trails and National Historic Trails may only be designated by congressional act, National Recreation Trails may be designated by the Secretary of the Interior or the Secretary of Agriculture to recognize exemplary trails of local and regional significance, upon application from the trail managing agency or organization. When designated, these trails are recognized as part of the National Trail System. In order to be certified as a National Scenic Trail, a trail must contain outstanding recreation opportunities and encompass more than 100 miles of a continuous, primarily non-motorized trail. Eleven National Scenic Trails have been designated across the nation. A total of 1,400 miles of hiking trails across
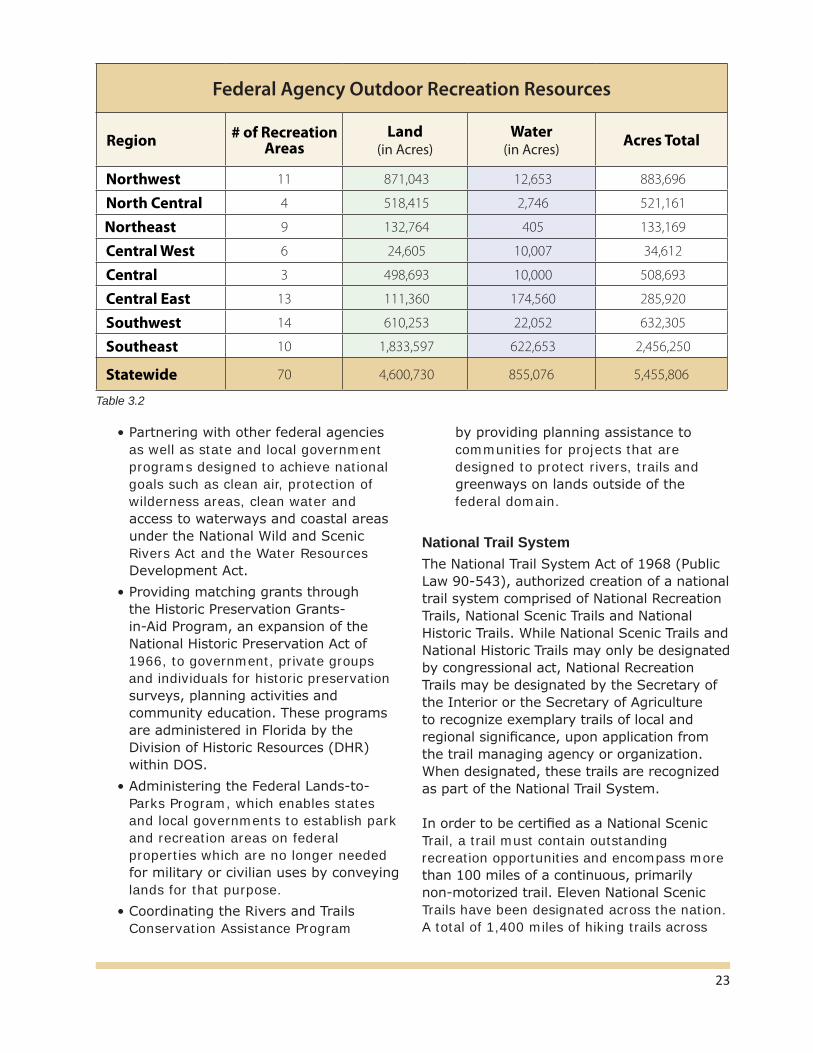
Federal Agency Outdoor Recreation Resources
Region # of RecreationAreas
Land (in Acres)
Water (in Acres) Acres Total
Northwest 11 871,043 12,653 883,696
North Central 4 518,415 2,746 521,161
Northeast 9 132,764 405 133,169
Central West 6 24,605 10,007 34,612
Central 3 498,693 10,000 508,693
Central East 13 111,360 174,560 285,920
Southwest 14 610,253 22,052 632,305
Southeast 10 1,833,597 622,653 2,456,250
Statewide 70 4,600,730 855,076 5,455,806
Table 3.2

24
Florida were designated as the Florida National Scenic Trail in 1983. The Florida National Scenic Trail is further discussed under the U.S. Forest Service (USFS) on page 25.
National Historic Trails commemorate historic and prehistoric routes of travel that are significant to the nation. Throughout the United States, there are 19 National Historic Trails made up of 33,002 miles of designated trails. These trails provide user experiences through a series of interpretive facilities along trails and signed automobile routes. There are currently no National Historic Trails in Florida.
National Recreation Trails provide outdoor recreation opportunities in a variety of urban, rural and remote settings. A total of 30 trails including more than 550 miles of land-based trails and 1,700 miles of paddling trails have been designated in Florida. These trails are managed by federal, state, county and municipal agencies and run the spectrum from urban jogging and bicycling in St. Petersburg to wilderness canoeing in the Everglades.
U.S. Fish and Wildlife Service
The mission of the U.S. Fish and Wildlife Service (USFWS), an agency within the U.S. Department of the Interior, is to conserve, protect and enhance fish, wildlife and plants and their habitats for the continuing benefit of the American people. This mission is accomplished by enforcing federal wildlife laws, protecting endangered species, managing migratory birds, restoring nationally significant fisheries and conserving and restoring wildlife habitat including wetlands. USFWS also distributes hundreds of millions of dollars in excise taxes on fishing and hunting equipment to state fish and wildlife agencies across the nation. The activities of USFWS in Florida include:
• Management of 28 national wildlife refuges, comprising nearly one million acres of land and water. Most of the refuges are limited-purpose outdoor recreation areas that provide bird watching, wildlife observation, fishing,
environmental education and interpretation and at some refuges, public hunting. In addition, the Service manages a national fish hatchery in Welaka and maintains law enforcement facilities at six locations.• Administration of federal aid programs, including Federal Aid in Sport Fish Restoration (commonly referred to as the Dingell-Johnson Act and Wallop-Breaux Act), Federal Aid in Wildlife Restoration (commonly referred to as the Pittman- Robertson Act) and Wildlife Partnership Act (conservation of non-game species). These grant programs are managed in Florida by the Florida Fish and Wildlife Conservation Commission. Grants to Florida under the Clean Vessel Act (clean boating programs) are managed by the Clean Marina Program in the Florida Department of Environmental Protection’s Office of External Affairs.
U.S. Department of AgricultureU.S. Forest ServiceThe U.S. Forest Service (USFS) provides leadership in the management, protection and use of the nation’s forests and rangelands. The agency is dedicated to multiple-use management of these lands for sustained yields of renewable resources such as wood, water, forage, wildlife and recreation to meet the diverse needs of people. The responsibility of USFS in the field of outdoor recreation is to fully develop the recreational potential of national forests and protect landscape aesthetics. USFS also cooperates with other federal, state and local agencies in planning and developing recreational resources on other federal, state, local and private lands.
In Florida, USFS administers three national forests: the Apalachicola, the Ocala and the Osceola. Together these areas contain approximately 1.2 million acres of land and water, thus making a major contribution to the state’s recreational resources. They contain some of Florida’s most pristine lands including extensive woodlands, springs

25
and streams. Within the national forests, USFS manages numerous designated public recreation sites. Some of the sites are managed exclusively for dispersed recreational purposes, such as hiking, hunting, fishing and primitive camping.
Florida National Scenic TrailUSFS is the federal administering agency for the Florida National Scenic Trail. The Florida National Scenic Trail, designated by Congress in 1983, extends from the Big Cypress National Preserve north to the Gulf Islands National Seashore in the Florida Panhandle. Along the way, the Florida Trail passes through lands managed by more than two dozen public land managing agencies in more than 40 separate management units. USFS acts as a partner with state land management agencies and private landowners to obtain through-trail access for the project. The non-profit Florida Trail Association, Inc., through its volunteer membership of hiker-volunteers, provides nearly 70,000 hours of manpower each year to build and maintain the Florida National Scenic Trail and other hiking trails throughout Florida.
U.S. Department of Defense
The U.S. Department of Defense (USDOD) includes the Departments of the Army, Navy and Air Force. Each provides outdoor
recreation opportunities in Florida. USDOD has 17 military installations in Florida that make lands available for recreational purposes. Although public outdoor recreation is not a primary function of USDOD, its contributions in this regard are nevertheless important to Florida’s overall outdoor recreation program. Generally, all military installations offer some degree of outdoor recreation programs for military personnel, dependents and their guests. However, access to their resources for recreational use by the general public is usually limited.
U.S. Army Corps of Engineers
Along with its primary responsibilities for navigation, flood risk management, environmental restoration and beach renourishment, the U.S. Army Corps of Engineers (USACE) has made considerable efforts to provide recreational facilities. It is the policy of USACE to plan for and provide outdoor recreation resources and facilities at all of its water resources projects. For information of the Corps Recreational Opportunities visit www.corpslakes.us
USACE’s general authority for recreational development stems from the Flood Control Act of 1944, which was later expanded by the Federal Water Project Recreation Act of 1965 (16 United States Code 460). The latter act directs that each project give full
A scene from the Florida National Scenic Trail, credit: USFS

26
consideration to opportunities for outdoor recreation and fish and wildlife enhancement, and it establishes outdoor recreation and preservation of wildlife and fish as a full project purpose.
Florida is divided into two USACE districts. The Mobile District manages recreation sites at the Jim Woodruff Lock and Dam on Lake Seminole, a 37,500 acre impoundment in southern Georgia and Jackson County, Florida. Excellent opportunities for camping, hiking, fishing, hunting and boating are available.
The Jacksonville District manages Lake Okeechobee and the Okeechobee Waterway in southern Florida. Not only does this managed area provide extensive outdoor recreation opportunities, but its series of locks and canals provides a cross-Florida waterway that is popular among pleasure boaters and connects the Atlantic Ocean and the Gulf of Mexico via the lake and the Caloosahatchee River. A few of the outdoor recreation opportunities include three full-facility campgrounds along the Okeechobee waterway and the 110 mile Lake Okeechobee Scenic Trail that runs along the top of the Herbert Hoover Dike.
In partnership with the South Florida Water Management District, the Florida Department of Environmental Protection and other federal, state, local and tribal agencies, the USACE is implementing the Comprehensive Everglades Restoration Plan (CERP), one of the world’s largest wetland restoration projects. The project covers 16 counties and over 18,000 square miles. The Plan was approved by Congress in the Water Resources Development Act of 2000, which was reauthorized by Congress in November 2007. It includes more than 60 elements and will require more than 30 years to construct at an estimated cost of $10.9 billion. The CERP Master Recreation Plan will provide guidance to assist recreation planning within CERP project fee title lands, and will help provide recreation opportunities that are compatible with the restoration purposes of the project.
U.S. Department of Transportation The Federal Highway Administration (FHWA) within the U.S. Department of Transportation provides grants to state and local governments for various recreational trail projects, including bicycle and
Dock fishing at Lake Okeechobee, credit: US Army Corps of Engineers

27
pedestrian facilities, and scenic highways. The Recreational Trails Program provides funds to the states to develop and maintain recreational trails and trail-related facilities for both non-motorized and motorized trail uses. The Office of Greenways and Trails in the Florida Department of Environmental Protection, Division of Recreation and Parks administers the financial assistance program in coordination with the FHWA.
The Transportation Enhancement Program provides funding for improvements that are not provided as part of the features routinely provided in transportation projects. Enhancements such as bicycle and pedestrian facilities, preservation and conversion of abandoned railroad corridors to trails, landscaping and other scenic beautification projects have been provided in Florida through this program. Since 2008, a total of approximately $207.1 million in enhancement funds have been apportioned to Florida through the program.
The National Scenic Byways Program recognizes roads having outstanding scenic, historic, cultural, natural, recreational and archaeological qualities by designating them as National Scenic Byways, All-American Roads, America’s Byways or State Scenic Byways. Grants and technical assistance are provided to the states to implement projects on designated byways, and to plan, design and develop a state scenic byway program. The Florida Department of Transportation (DOT), in cooperation with FHWA, is the administering agency for the Florida Scenic Highway Program.
U.S. Department of CommerceNational Oceanic and Atmospheric AdministrationThe National Oceanic and Atmospheric Administration (NOAA) is a scientific and technical organization that works to preserve and enhance the nation’s coastal resources and ecosystems. Its mission is to provide products, services and information that promote safe navigation, support coastal
Spotlight
FederalState
Municipal/CountyNon-Government
Supply DistributionThe distribution of recreational facilities and resources by level of provider in the state is illustrated in these charts.
1% 3%
69%
28%
User-Oriented
12%
31%
32%
25%
Resource-Based: Land
8%
12%
49%
30%
Resource-Based: Water

28
communities, sustain marine ecosystems and mitigate coastal hazards. The National Ocean Service provides assistance to Florida in observing, understanding and managing coastal and marine resources. Florida is an active partner in several programs that directly affect resource protection in Florida’s coastal areas.
National Estuarine Research ReservesThe National Estuarine Research Reserve System is a network of estuarine areas across the nation established for long-term stewardship, research and education. Each reserve has developed an organized ecological research program containing extensive teacher training, education, research and monitoring. Findings are communicated to coastal managers and other decision makers, as well as local citizens. Florida contains three of these reserves: Apalachicola, Guana Tolomato Matanzas and Rookery Bay.
National Marine SanctuariesThe National Marine Sanctuary Program designates and manages areas of the marine environment with special national significance due to their conservation, recreational, ecological, historical, scientific, cultural, archaeological, educational or aesthetic qualities. The Florida Keys National Marine Sanctuary, one of 13 in the National Marine Sanctuaries System, covers 3,926 square miles and encompasses part of the most extensive living coral reef system in the nation.
National Coastal Zone Management ProgramThe National Coastal Zone Management Program fosters an effective partnership
among federal, state and local governments. By leveraging federal and state matching funds, the program strengthens the capabilities of each partner to address coastal issues while giving states the flexibility to design a program that accommodates their unique coastal challenges.
The Florida Coastal Management program is administered by the Florida Department of Environmental Protection’s Office of Intergovernmental Programs. The state program serves as the lead coordinator with eight other state agencies and five water management districts in enforcing 23 statutes and implementing several coastal zone management programs in cooperation with NOAA. The program works to protect coastal resources, build and maintain vital communities, enhance coastal access, protect remarkable places and revitalize working waterfronts.
In 2002, the National Coastal Zone program initiated the Coastal and Estuarine Land Conservation Program. The program is aimed at protecting important coastal and estuarine areas that have significant conservation, recreation, ecological, historical or aesthetic values and that are threatened by conversion from their natural or recreational state to other uses. The Florida Coastal Management Program manages this grant program, which provides up to $3 million for each eligible project.
STATE PROGRAMSThe State of Florida’s responsibilities for providing public recreation are fulfilled through a variety of facilities and programs, each unique to the mission of nine separate entities.
Florida Department of Environmental Protection The Florida Department of Environmental Protection (DEP) is charged with the protection, administration, management, supervision, development and conservation of Florida’s natural and cultural resources.
Rookery Bay National Estuarine Research Reserve
29
This broad mandate is accomplished by direct acquisition and management of public outdoor recreation and conservation areas, as well as through major initiatives and agency priorities which contribute to a healthy ecosystem. DEP’s functions include protecting and conserving Florida’s water supply and its quality, protecting springs and oceans, restoring America’s Everglades, acquiring, conserving and managing conservation and recreation lands, enforcing environmental laws and regulations, investing in cleaner sources of energy and protecting the health of Florida’s communities.
Division of Recreation and ParksDEP’s Division of Recreation and Parks (DRP) develops and operates Florida’s state park system and state greenways and trails for the benefit and enjoyment of Florida’s citizens and visitors. The state park system contains many of the best remaining examples of Florida’s original domain and cultural heritage. Units in the state park system are classified for management according to the natural and cultural resources they contain and the desired balance between resource preservation and public use.
Besides providing hundreds of thousands of acres for public recreational use, the state park system is the largest steward of public historic properties in the state. More than 83 parks contain significant historic resources, including almost 300 historic structures and more than 1,500 archaeological sites. These resources provide a broad array of unique interpretive and educational opportunities
for residents and visitors. In addition to administering Florida’s state park system, DRP also administers the Florida Recreation Development Assistance Program and the federal Land and Water Conservation Fund.The Florida Recreation Development Assistance Program provides financial assistance to eligible local governments, including the 67 county general governments and 412 incorporated municipalities of Florida. Funding from the program is awarded on a competitive basis that considers the total project costs and the economic status of the applicants among other evaluation criteria. Pursuant to Section 375.075, Florida Statutes, and Chapter 62D-5, Part V, Florida Administrative Code, DEP recommends to the Legislature each year that an appropriation of not less than five percent of the total amount credited annually to the Land Acquisition Trust Fund be authorized for the program.
Since 2001, the program has also received two percent of the bond proceeds made available through the Florida Forever program. Funding for the program has been awarded to approximately 1,031 projects for the last 10 fiscal year funding cycles.
Office of Greenways and Trails The Office of Greenways and Trails (OGT) within the Division of Recreation and Parks provides statewide leadership and coordination to establish, expand and promote the Florida Greenways and Trails System. To fulfill its mission under the Florida Greenways and Trails Act (Chapter 260, F. S), OGT coordinates and implements
SpotlightFlorida Recreation Development Assistance Program (FRDAP)The Florida Recreation Development Assistance Program (FRDAP) is a state competitive grant program that provides financial assistance to local governments to develop and/or acquire land for public outdoor recreational purposes. Funding for the program has been awarded to approximately 1,031 projects for the last 10 fiscal year funding cycles.
Pasco County matched a $100,000 FRDAP grant to enhance access to Pithlachascotee River Preserve, using the funds to develop an interpretive boardwalk, playground, restrooms, parking and landscaping.

30
LEGEND
Department of Agriculture and Consumer Services Florida Forest Service
Department Environmental Protection Division of Recreation and Parks
Office of Coastal and Aquatic Managed Areas
Northwest FL Water Management District
South FL Water Management District
Southwest FL Water Management District
St. John River Water Management District
Suwanee River Water Management District
FL Fish and Wildlife Conservation Commission
Source: Florida Natural Areas Inventory
State Recreation Lands by Managing Agency
Figure 3.2

31
the Plan for the Florida Greenways and Trails System (FGTS) in partnership with communities, businesses, agencies, the Florida Greenways and Trails Council and many other stakeholders. OGT also maintains and updates the vision maps that are a companion to the FGTS Plan, encompassing land-based trails, paddling trails and ecological greenways. The vision maps for land and paddling trails are included in Appendix C. OGT establishes the vision for the FGTS by identifying and coordinating greenways and trails planning efforts throughout Florida. OGT expands the statewide system through the acquisition of eligible projects under the Greenways and Trails component of the Florida Forever Program, and has partnerships with nearly 30 communities that develop and manage state acquired greenways and trails on behalf of OGT.
OGT coordinates with and provides technical assistance regarding the acquisition, development, designation and management of greenways and trails projects that fulfill the FGTS plan and vision. OGT administers the Recreational Trails Program (RTP), a federally funded competitive grant program that provides financial assistance to local
State Agency Outdoor Recreation Resources
Region # of RecreationAreas
Land (in Acres)
Water (in Acres) Acres Total
Northwest 83 835,357 359,030 1,194,387
North Central 168 565,149 1,028,469 1,593,618
Northeast 80 342,118 171,364 513,482
Central West 63 349,959 492,253 842,212
Central 108 656,916 103,374 760,290
Central East 88 479,219 113,589 592,808
Southwest 65 525,907 382,257 908,164
Southeast 68 942,968 155,378 1,098,346
Statewide 715 4,697,593 2,805,714 7,503,307
SpotlightRTP and OGT Acquisition ProgramThe Recreational Trails Program (RTP) and the Greenways and Trails Acquisition Program have worked with over 70 communities across the state to develop and expand recreational trails.
RTPThe City of Chattahoochee developed the Chattahoochee Nature Trails, improving recreation opportunities by adding and improving more than three miles of trails and boardwalks, as well as parking, kiosk and a water fountain as support facilities. This recently completed project enhanced recreational opportunities in a “Rural Area of Critical Economic Concern” and was awarded the 2012 Recreation Trails Program Achievement Award.
Greenways and Trails Acquisition ProgramThe East Central Regional Rail Trail is the longest rail-to-trail acquisition in State of Florida history, stretching almost 51 miles between Volusia and Brevard Counties. The trail will connect three major tourism destinations in the state: the greater Orlando area, Kennedy Space Center, and Daytona’s beaches. The trail corridor was purchased by the state through the Greenways and Trails Acquisition Program, with Brevard and Volusia Counties responsible for construction and management of the trail. A ribbon cutting ceremony was held for the first completed section of the trail in February 2012.
Table 3.3
32
communities for the development of trails. Since inception, RTP has assisted communities in 42 Florida counties to establish and expand their trails.
OGT disseminates information about the many benefits that greenways and trails provide to Florida residents and visitors. OGT provides information to residents and visitors about greenways and trails recreational opportunities through publications, e-newsletters, FloridaGreenwaysAndTrails.com and VisitFlorida.com/trails.
Office of Coastal and Aquatic Managed AreasThe Office of Coastal and Aquatic Managed Areas (CAMA) is the principal manager of submerged lands and their associated marine and aquatic resources in Florida. The Florida Aquatic Preserve Act of 1975 (Chapter 258, Part II, Florida Statutes), authorizes the Board of Trustees of the Internal Improvement Trust Fund to maintain state owned submerged lands with exceptional biological, aesthetic and scientific value as aquatic preserves. These areas offer prime opportunities for fishing, boating, swimming, paddling, snorkeling, diving and other water-related types of recreation. CAMA manages Florida’s 41 aquatic preserves, including 37 saltwater and four freshwater sites, encompassing more than two million acres of sovereign submerged lands of the state. In cooperation with NOAA, CAMA manages approximately 240,000 acres of submerged land and coastal uplands in three national estuarine research reserves: Apalachicola, Guana Tolomato Matanzas and Rookery Bay. In addition, CAMA partners with NOAA to manage the Florida Keys National Marine Sanctuary. The sanctuary contains 3,926 square miles of submerged lands around the 126 mile long Florida Keys, and encompasses the most extensive living coral reef system in the nation. Through the Southeast Florida Coral Reef Initiative and the Coral Reef Conservation
Program, CAMA supports Florida’s membership in the U.S. Coral Reef Task Force and the U.S. All Islands Committee. These programs coordinate research and monitoring, develop management strategies, and promote partnerships to protect the coral reefs, hard bottom communities and associated reef resources of southeast Florida.
Division of State LandsSince 1968, Florida has invested approximately $7.8 billion through successive land acquisition programs to conserve approximately 3.8 million acres of land for environmental preservation, conservation and outdoor recreation purposes. The Division of State Lands (DSL) administers these land acquisition programs on behalf of the Board of Trustees of the Internal Improvement Trust Fund and DEP. DSL also provides administrative oversight for approximately 11 million acres of state owned lands, including 700 freshwater springs, 4,510 islands of ten acres or more and 7,000 lakes.
Florida ForeverDSL administers the Florida Forever program, which was created by the 1999 Florida Legislature as the successor program to the Florida Preservation 2000 program established in 1990. Florida Forever supports a variety of land acquisition purposes, including the preservation of environmental, conservation, and water management lands and to provide grants to local governments. Since Florida Forever’s inception, 683,003 acres of land and water have been acquired, reflecting an investment of more than $2.9 billion.
In 2008, Florida Forever was extended for another decade by the Florida Legislature. As part of the program’s re-authorization, several important changes were made to the original program that was established in 1999. Two new land acquisition programs were created. The Rural and Family Lands Protection Act was established in the Department of Agriculture and Consumer

33
Services for the acquisition of agricultural lands through perpetual easements and other less-than-fee techniques. The Stan Mayfield Working Waterfronts Program was created in the Department of Community Affairs, Florida Communities Trust, to preserve and restore working waterfronts and provide public access to Florida’s waters. In 2011, the Florida Communities Trust and Stan Mayfield Working Waterfronts programs were transferred to the Division of State Lands.
In addition to these new programs, greater emphasis was placed on providing public access to conservation lands, increasing accountability of public land management, protecting listed plant and animal species, and addressing climate change.
Florida Communities TrustThe Florida Communities Trust (FCT), established in 1989 to help local governments preserve parks, open space, beaches and
natural areas, has created more livable communities throughout Florida. The FCT program was transferred to DSL in 2011. Matching and full grants for conservation and recreation land acquisition projects are provided to communities, as well as to non-profit environmental organizations, through an annual competitive application process. FCT receives 21 percent of annual proceeds from Florida Forever.
As of April 2012, more than 90,450 acres were acquired through the program. FCT has provided nearly $826 million of the $1.5 billion spent to acquire these lands, while local government partners have provided matching funds in excess of $695 million.
Division of Water Resource ManagementThe Division of Water Resource Management (DWRM) is responsible for protecting the quality of Florida’s drinking water as well as its rivers, lakes and wetlands, and for reclaiming lands after they have been
SpotlightFlorida Communities Trust (FCT)Florida Communities Trust provides matching and full grants for conservation and recreation land acquisition projects.
• More than 90,450 acres acquired as of April 2012• Nearly $826 million in project funding provided• More than $695 million in matching funds from local government partners
Acreage Pines Natural Area, a 123 acre parcel, was acquired by Palm Beach County with matching funds from FCT. Since the 2001 acquisition, restoration efforts have focused on removing exotic nonnative vegetation, introducing prescribed burns, and restoring hydrology to historic wetland levels. Additionally, public-use facilities were developed including an educational kiosk, a bicycle rack, an accessible nature trail and boardwalk spanning through a restored wetland to a wildlife observation platform, and 1,400 feet of natural-surface hiking trails.
The Acreage Pines Natural Area is within the footprint of the Northeast Everglades Natural Area, a multi-agency system of 165,000 acres of conservation lands and activity and education centers in northern Palm Beach County and southern Martin County that provide a wide-range of nature-based outdoor recreational opportunities. Acreage Pines Trail
Acreage Pines Natural Area

34
mined for phosphate and other minerals. Its programs establish the technical basis for setting the state’s surface water and ground water quality standards, which are critical to maintaining the viability of water resources for public outdoor recreational use. By 2030, Floridians are expected to use about two billion gallons more fresh water each day. The Water Protection and Sustainability Program, created in 2005, has the task of increasing alternative water supplies to meet existing and future water supply needs. DEP’s 2011 Annual Report on Regional Water Supply Planning describes the highlights and accomplishments of this program. The report also describes the progress of the state’s five water management districts in meeting Florida’s future demands for water.
Coastal protection and restoration are vital in preserving one of Florida’s most valuable natural resources - its 825 miles of sandy shoreline fronting the Atlantic Ocean, the Gulf of Mexico and the Straits of Florida. As of 2011, more than 222 miles of beach have been restored as a result of the Beach Erosion Control Program, working in concert with other agencies and local governments to protect, preserve and restore coastal sandy beaches. Financial assistance in an amount up to 50 percent of project costs is available to county and municipal governments, community development districts and special taxing districts for shore protection and preservation. In addition to beach restoration and nourishment, funds are also available for construction of dune walkovers and parking facilities for public access. Through 2011, more than $739.5 million has been appropriated by the Florida Legislature for beach erosion control activities and hurricane damage recovery.
Bureau of Mine ReclamationDWRM’s Mine Reclamation Program regulates surface mine reclamation through a review and monitoring process. Originally established in the late 1980s to regulate, restore and reclaim phosphate-mined land, the program has evolved into a habitat and
wildlife management program. The Bureau periodically funds reclamation of phosphate lands mined before mid-1975 and develops, as well as manages, extensive habitat corridors in Florida’s mining areas. To date, 46,524 acres have been reclaimed through the funding program, with 6,835 acres under active reclamation; $127 million has been disbursed to landowners reclaiming mined lands with nearly $27 million more committed to ongoing reclamation. Today, the program is responsible for managing 23 state-owned parcels along the Peace and Alafia Rivers and in the Green Swamp to implement long-term management activities needed for protection of the these greenways, wildlife corridors and riparian buffers.
Office of Sustainable InitiativesClean Marina ProgramIn 1992, Congress enacted the Clean Vessel Act, which established a federal grant program administered by USFWS to reduce pollution from vessel sewage discharges. Funding comes from the Sport Fishing Restoration Program account made up of revenues from excise taxes on fishing equipment, boats and motorboat fuels. The Clean Marina Program is a cooperative effort by the Office of Sustainable Initiatives, the Marine Industries Association of Florida, Florida Sea Grant Program, International Marina Institute, U.S. Coast Guard and public and private marinas throughout the state. Clean boater programs educate recreational boaters, marinas, boat yards and marine retailers about pollution control and enhance recreational boating through brochures and workshops that emphasize protecting aquatic resources.
Water Management Districts
The Office of Water Policy in DEP addresses statewide water management issues in coordination with Florida’s water management districts and other agencies. Chapter 373, Florida Statutes, created five water management districts for the purpose of managing and conserving the state’s water resources. The five districts were organized around major drainage basins in the state:

35
Northwest Florida, Suwannee River, St. Johns River, Southwest Florida and South Florida. Land acquisition is one of the districts’ primary tools for carrying out their mission of flood control, water storage and management, water resource development, and preservation of wetlands, streams and lakes.
The districts play a key role in providing public outdoor recreation opportunities on lands under their ownership. The water management districts acquire land and construct water resource-related capital improvements, including water resource or water supply development and restorations projects. The districts are required to make their lands available for compatible public outdoor recreation uses whenever practicable. Numerous public access sites and recreational facilities have been developed on district owned lands throughout the state in cooperation with other state agencies, the federal government, counties, municipalities and the private sector. Examples of the recreational opportunities provided on district lands include hiking, fishing, hunting, horseback riding, bicycling, canoeing, primitive camping and wildlife viewing.
Florida Fish and Wildlife Conservation Commission
The Florida Fish and Wildlife Conservation Commission (FWC) was established by a 1998 amendment to the Florida Constitution that consolidated the responsibility for conserving the state’s freshwater and saltwater aquatic life and wildlife into a single agency. FWC operates under a mission of “managing fish and wildlife for their long-term well-being and benefit of the people.”The Commission is composed of seven members appointed by the governor, subject to confirmation by the Senate, for staggered terms of five years. FWC exercises regulatory and executive powers of the state over marine life and is charged with exercising all the non-judicial powers of the state with respect to wild animals, freshwater aquatic life and marine life. Central to FWC’s role in outdoor recreation is the management
of hunting, fishing and wildlife viewing opportunities. FWC receives federal funds for preservation, restoration and enhancement of Florida’s sport fishing resources, including boating access facilities, from the Federal Aid in Sport Fish Restoration (sometimes referred to as Dingell-Johnson or Wallop-Breaux) program. The FWC also receives funds for protection of endangered species from the Federal Aid in Wildlife Restoration (commonly referred to as Pittman-Robertson) Trust Fund. These programs are administered at the federal level by United States Fish and
SpotlightFlorida Boating Improvement ProgramThe Florida Boating Improvement Program provides funding through competitive grants for boating access projects and other boating-related activities on coastal and/or inland waters of Florida. Eligible program participants include county governments, municipalities and other governmental entities of the State of Florida.
• Over $3 million awarded in FY 2011/12 • 32 projects funded in FY 2011/12
Gulf County received funding from the Florida Boating Improvement Program to help renovate the White City Boat Ramp. Improvements made to the facility included 20 new mooring spots, renovation of the docks and bulkhead, improved parking, lighting, signage, and a picnic area.

36
Wildlife Service, which provide grants and technical assistance to the states.
Division of Habitat and Species ConservationThis division is responsible for the state’s Wildlife Management Area system, which includes 158 tracts totaling approximately 5.7 million acres in public and private ownership, one of the nation’s largest. FWC is the lead manager of 54 areas that cover 1.4 million acres and is a co-manager of 104 areas that cover an additional 4.3 million acres. This system is vital to sustaining the fish and wildlife resources of the state and also provides an expansive and rugged setting for a range of outdoor recreation opportunities. Some of FWC’s cooperating agreements are short-term arrangements, particularly on private lands. As a result, the amount of hunting land available to the public on these areas fluctuates from year to year. In 2001, Congress created the State Wildlife Grants Program and required each state to develop a comprehensive Wildlife Conservation Strategy in order to continue receiving federal wildlife grants. FWC
created Florida’s Wildlife Legacy Initiative in 2004 to serve the agency’s long-term commitment to conserve native wildlife. The initiative crafts a statewide vision for the future of wildlife in Florida, in coordination with other state, federal and local agencies, universities, conservation organizations, recreation groups, businesses and the public. Species range from those which are common throughout the southeastern United States to some which are virtually unknown elsewhere in the country, such as the Florida panther, the Florida manatee and the Florida scrub jay. The initiative supports various forms of outdoor recreation including hunting, fishing, bird watching and nature study.
Division of Freshwater Fisheries ManagementThe Division of Freshwater Fisheries Management (DFFM) provides expertise on freshwater fish populations, angler use and other aspects of freshwater fisheries to ensure high quality fishing in Florida lakes, rivers and streams. Florida has over 3 million acres of fresh water comprising 7,700
Florida has more than 200 freshwater boat ramps constructed by FWC using Federal Aid in Sportfish Restoration funds, credit: FWC

37
named lakes, and 12,000 miles of fishable rivers, streams and canals. More than 200 species of freshwater fishes inhabit these waters and include many highly sought after sportfish species. DFFM provides the public with information on freshwater fisheries management issues, fishing opportunities, aquatic education and outreach, and other matters aimed at promoting responsible life-long participation in sport fishing. Additionally, freshwater fish production facilities provide a dependable supply of the specific size, quantity and quality of freshwater fish to meet specific freshwater fisheries management objectives.
Division of Marine Fisheries ManagementThe Division of Marine Fisheries Management (DMFM) develops sustainable management recommendations for consideration by the FWC Commissioners for more than 500 saltwater species in Florida. These management plans ensure the long-term conservation of Florida’s valuable marine fisheries resources while balancing the needs of the fishermen with the needs of the marine species. More than 2.7 million saltwater anglers fish Florida’s 2,276 miles of tidal shoreline, creating an economic impact of more than $5.7 billion and more than 54,000 jobs. MFM staff also work with federal agencies on marine issues and represent the state on the Gulf of Mexico Fishery Management Council and the South Atlantic Fishery Management Council. The DMFM outreach and education team provides the public with opportunities to learn more about saltwater fishing, from learning basic fishing skills and fish identification to sustainable habits such as the best ways to catch and release a fish. DMFM’s other programs include the planning and deploying artificial reefs; reaching out to commercial, recreational and charter fishermen; ensuring seafood dealers are selling safe and quality products; removing derelict traps from the water through the trap retrieval program; and making public comment on issues that may affect Florida anglers.
Division of Law EnforcementFWC’s Division of Law Enforcement officers provide protection to residents and visitors who enjoy Florida’s natural resources, and enforce resource protection and boating safety regulations in the state’s woods and waters. The Boating and Waterways Section is responsible for educating boaters about boating safety, ensuring boat access, installing and maintaining waterway signage, and identifying derelict vessels.
The Boating and Waterways Section administers several grant programs, including the Florida Boating Improvement Program and the Boating Infrastructure Grant Program. The Federal Sport Fish Restoration Program (commonly referred to as the Dingell-Johnson Act and Wallop-Breaux Act) is a “user pays, user benefits” program that is aimed at improving sport fishing and boating opportunities. Federal funds are collected from taxes on fishing tackle, motor fuels and import duties on tackle and yachts. The money is returned to appropriate state agencies for research, management, education and facility development related to sport fishing. These three programs funded over 200 grants around the state, totaling more than $31 million, to provide for construction of boat ramps and related access facilities.
Division of Hunting and Game ManagementThe Division of Hunting and Game Management (DHGM) facilitates sustainable responsible use of Florida’s game wildlife resources by providing scientific expertise on game wildlife species, including alligators, deer, small game, waterfowl and wild turkeys and developing sound management recommendations based upon scientific information. With a cadre of volunteer instructors DHGM delivers hunter safety training and certification and manages public shooting ranges; DHGM coordinates and develops rules, regulations, and information for the public pertaining public hunting throughout the state. Through these activities, DHGM strives to accomplish a high level of
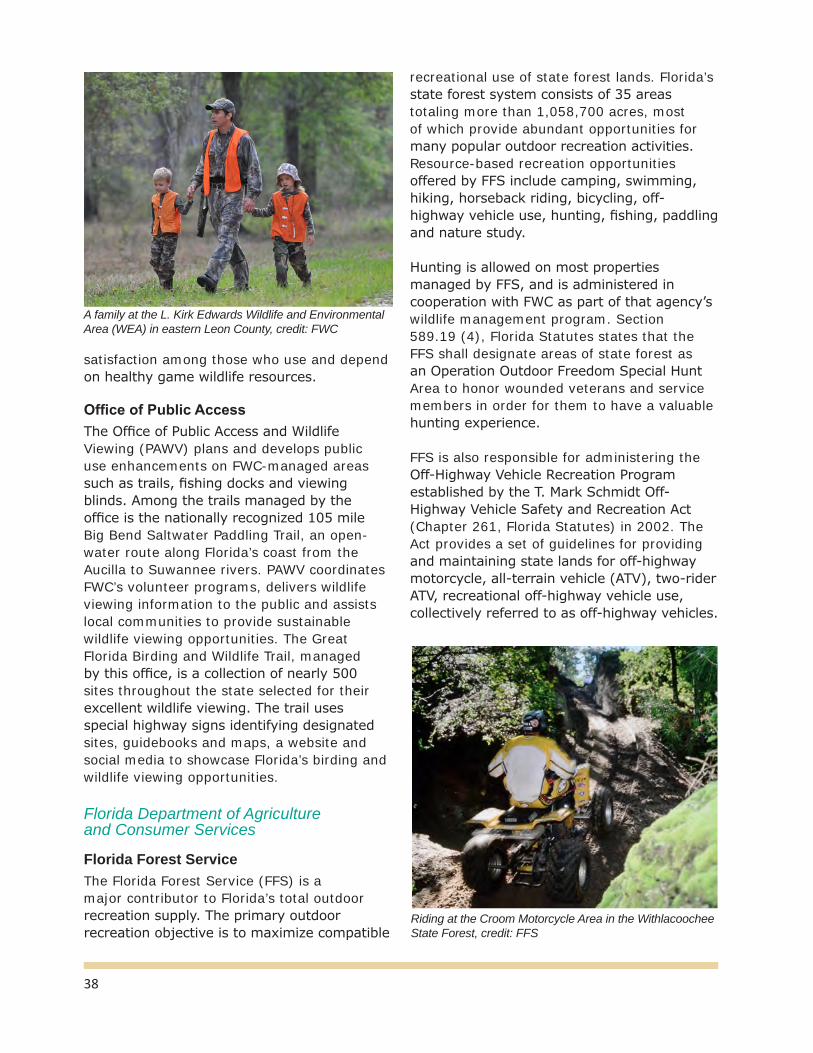
38
satisfaction among those who use and depend on healthy game wildlife resources.
Office of Public AccessThe Office of Public Access and Wildlife Viewing (PAWV) plans and develops public use enhancements on FWC-managed areas such as trails, fishing docks and viewing blinds. Among the trails managed by the office is the nationally recognized 105 mile Big Bend Saltwater Paddling Trail, an open-water route along Florida’s coast from the Aucilla to Suwannee rivers. PAWV coordinates FWC’s volunteer programs, delivers wildlife viewing information to the public and assists local communities to provide sustainable wildlife viewing opportunities. The Great Florida Birding and Wildlife Trail, managed by this office, is a collection of nearly 500 sites throughout the state selected for their excellent wildlife viewing. The trail uses special highway signs identifying designated sites, guidebooks and maps, a website and social media to showcase Florida’s birding and wildlife viewing opportunities.
Florida Department of Agriculture and Consumer Services
Florida Forest ServiceThe Florida Forest Service (FFS) is a major contributor to Florida’s total outdoor recreation supply. The primary outdoor recreation objective is to maximize compatible
recreational use of state forest lands. Florida’s state forest system consists of 35 areas totaling more than 1,058,700 acres, most of which provide abundant opportunities for many popular outdoor recreation activities. Resource-based recreation opportunities offered by FFS include camping, swimming, hiking, horseback riding, bicycling, off-highway vehicle use, hunting, fishing, paddling and nature study.
Hunting is allowed on most properties managed by FFS, and is administered in cooperation with FWC as part of that agency’s wildlife management program. Section 589.19 (4), Florida Statutes states that the FFS shall designate areas of state forest as an Operation Outdoor Freedom Special Hunt Area to honor wounded veterans and service members in order for them to have a valuable hunting experience.
FFS is also responsible for administering the Off-Highway Vehicle Recreation Program established by the T. Mark Schmidt Off-Highway Vehicle Safety and Recreation Act (Chapter 261, Florida Statutes) in 2002. The Act provides a set of guidelines for providing and maintaining state lands for off-highway motorcycle, all-terrain vehicle (ATV), two-rider ATV, recreational off-highway vehicle use, collectively referred to as off-highway vehicles.
A family at the L. Kirk Edwards Wildlife and Environmental Area (WEA) in eastern Leon County, credit: FWC
Riding at the Croom Motorcycle Area in the Withlacoochee State Forest, credit: FFS

39
Besides directly providing resources and facilities for outdoor recreation, FFS assists private landowners in developing forest management plans that often include a recreation component. At the landowner’s request, FFS will assess the land’s potential for hunting, fishing, wildlife management, water access facilities, camping and related activities. FFS may also assist landowners in designing facilities such as campgrounds, boat ramps and hiking trails to make the land available for recreational purposes.
Florida Department of State
Division of Historical ResourcesThe Division of Historical Resources (DHR), is responsible for preserving and promoting Florida’s historical, archaeological, and folk culture resources. DHR directs historic preservation efforts throughout the state in cooperation with state and federal agencies, local governments, private organizations, and individuals. The director of DHR serves as the State Historic Preservation Officer, acting as a liaison with the national historic preservation program’s conducted by the National Park Service. Chapter 267, Florida Statutes,
directs DHR to develop a statewide historic preservation plan. Its primary purpose is to guide the implementation of sound planning procedures for the location, identification, and protection of the state’s archaeological and historical resources.
The Bureau of Historic Preservation (BHP) conducts programs aimed at identifying, evaluating, preserving and interpreting historic and cultural resources of the state. Programs include the Florida Main Street Program, Historic Preservation Grants-in-Aid Program, National Register of Historic Places/National Historic Landmark Program, Historical Markers Program, Certified Local Government Program and Florida Folklife Program. BHP also reviews federal or state undertakings that may affect historical or cultural resources, and maintains the Florida Master Site File, the state’s inventory of known historical and archaeological resources.
The Bureau of Archaeological Research (BAR) is responsible for the protection of archaeological and historical resources on state-owned and state-controlled lands, including sovereignty submerged lands.
Mission San Luis, Tallahassee, credit: Florida Department of State, Division of Historical Resources
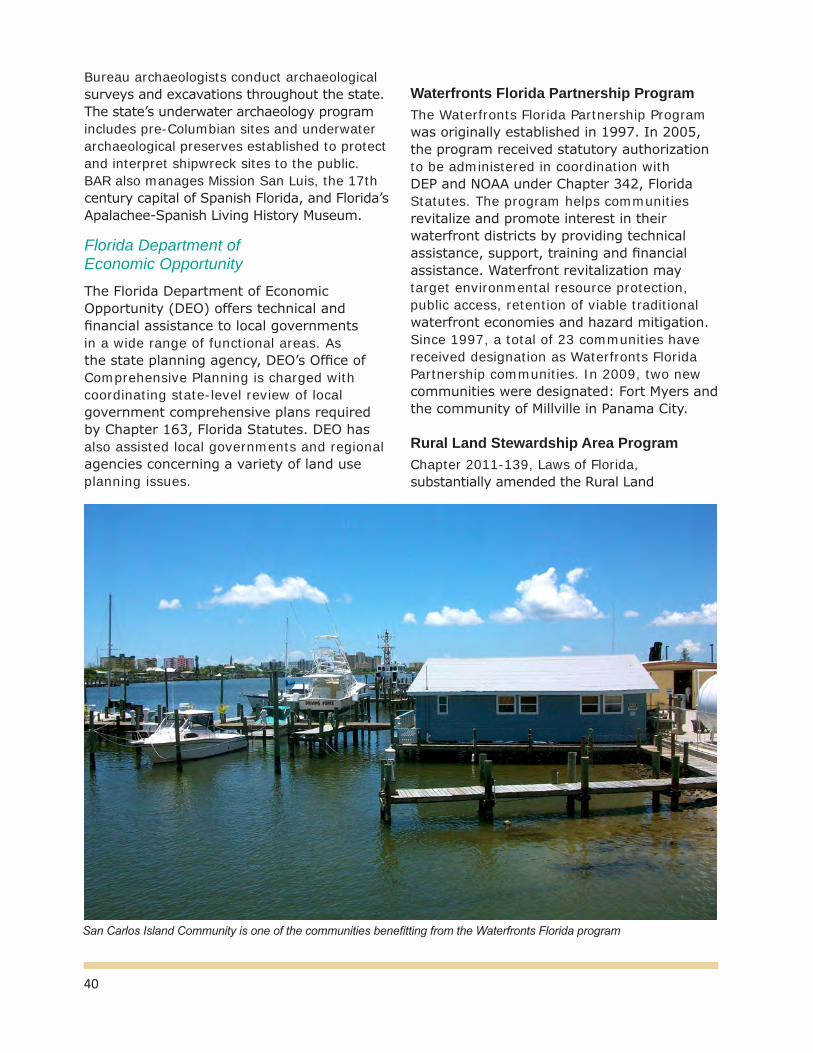
40
Bureau archaeologists conduct archaeological surveys and excavations throughout the state. The state’s underwater archaeology program includes pre-Columbian sites and underwater archaeological preserves established to protect and interpret shipwreck sites to the public. BAR also manages Mission San Luis, the 17th century capital of Spanish Florida, and Florida’s Apalachee-Spanish Living History Museum.
Florida Department of Economic Opportunity
The Florida Department of Economic Opportunity (DEO) offers technical and financial assistance to local governments in a wide range of functional areas. As the state planning agency, DEO’s Office of Comprehensive Planning is charged with coordinating state-level review of local government comprehensive plans required by Chapter 163, Florida Statutes. DEO has also assisted local governments and regional agencies concerning a variety of land use planning issues.
Waterfronts Florida Partnership ProgramThe Waterfronts Florida Partnership Program was originally established in 1997. In 2005, the program received statutory authorization to be administered in coordination with DEP and NOAA under Chapter 342, Florida Statutes. The program helps communities revitalize and promote interest in their waterfront districts by providing technical assistance, support, training and financial assistance. Waterfront revitalization may target environmental resource protection, public access, retention of viable traditional waterfront economies and hazard mitigation. Since 1997, a total of 23 communities have received designation as Waterfronts Florida Partnership communities. In 2009, two new communities were designated: Fort Myers and the community of Millville in Panama City.
Rural Land Stewardship Area ProgramChapter 2011-139, Laws of Florida, substantially amended the Rural Land
San Carlos Island Community is one of the communities benefitting from the Waterfronts Florida program

41
Stewardship Area program. Now at Section 163.3248, Florida Statutes, the law provides that one or more landowners may request that the local government designate their lands as a rural land stewardship area. The program allows local governments to adopt a future land use overlay to designate all or portions of the lands as a rural land stewardship area if the properties currently are classified as predominantly agricultural, rural, open, open-rural, or a substantively equivalent land use. Rural Land Stewardship Areas are areas within which planning and economic incentives are applied to encourage the implementation of innovative and flexible planning and development strategies and the use of creative land use planning techniques to support a diverse economic and employment base.
Rural land stewardship areas must be at least 10,000 acres or greater and located outside of municipalities and established urban service areas. This program, among other things, helps preserve inherent qualities provided by rural areas, including the protection of natural resources, ecosystems, and habitats while controlling urban sprawl.
Florida Department of TransportationIn providing for the state’s transportation needs, Florida Department of Transportation (DOT), under Chapter 334, Florida Statutes, gives consideration to the preservation and enhancement of the environment and the conservation of natural resources, including scenic, historic and recreational assets. Florida’s highway system affords a vast number of scenic recreational opportunities, but perhaps its most significant contribution to outdoor recreation is providing access to Florida’s recreation resources. DOT constructs and maintains rest areas for public use and provides opportunities for water-based recreation on causeways and bridges. Additionally, DOT administers the State Pedestrian and Bicycle Program, the Florida Scenic Highway Program and the Transportation Enhancement Program.
Pedestrian and Bicycle Program
DOT developed the State Pedestrian and Bicycle Program in Florida as a means of promoting alternative transportation modes and recreational bicycling in Florida. DOT develops initiatives and programs to improve the environment for safe, comfortable and convenient walking and bicycling trips and to improve the performance and interaction among motorists, bicyclists and pedestrians. As part of this program, the state pedestrian and bicycle coordinator and district pedestrian and bicycle coordinators in each of DOT’s seven field operations regions work with municipal pedestrian and bicycle coordinators to develop and update design, maintenance and operation guidelines for all state, municipal and local bicycle facilities.
Florida Scenic Highway ProgramThe Florida Scenic Highway Program is a grass-roots effort to showcase and heighten awareness of Florida’s intrinsic resources - cultural, historical, archaeological, recreational, natural and scenic - which collectively enhance the overall traveling experience. Designated highways tell a story that is representative of Florida’s past and present lifestyles. Participation in the program is voluntary and benefits the communities along the routes in matters such as resource enhancement and protection. Proposed projects are reviewed based on criteria established by FHWA. Each designated corridor is managed by a corridor management entity made up of interested
Bicyclists ride the St. John’s River to Sea loop, credit John Moran, courtesy of the Florida Wildflower Foundation

42
citizens. As of June 2012, there were 23 designated scenic highways in Florida.
State University System of Florida
The State University System of Florida consists of 11 institutions that serve 321,503 students and contain almost 14,000 acres of land. Each university has an approved master plan that addresses the issue of outdoor recreation space. Recreational facilities maintained by each university provide opportunities for participation in a variety of athletic activities such as tennis, basketball, baseball, softball, soccer and football. Many state universities also operate resource-based recreation areas detached from the main campus for use by students, alumni and in some instances, the general public. These areas provide opportunities for both active and passive outdoor recreation activities, such as golfing, swimming, canoeing, hiking, camping, nature study and picnicking.
Regional Planning CouncilsSection 186.501, Florida Statutes, also known as the Regional Planning Council Act, divides the state into eleven regional planning councils. Each council provides a link between local and state governments, and is comprised of two-thirds county and municipal officials and one-third gubernatorial appointees. Additionally, the council includes ex-officio members from FDOT, FDEP, the corresponding Water Management District and a nominee from FDEO.
One of the primary functions of each council is the preparation and
adoption of a strategic regional policy plan, providing goals and policies which guide the economic, physical and social development of the region. Using this plan as a guideline, the councils review local strategic and development plans, link planning efforts of various entities to ensure regional consistency, and facilitate planning or growth management disputes.
Special DistrictsChapter 189, Florida Statutes, also known as the Uniform Special District Accountability Act of 1989, addresses the operation of special districts in Florida. Over 1,600 special districts exist statewide, providing infrastructure and services in a wide range of areas including fire control, libraries, ports and inlets, mosquito control, water control, community development, roads and hospitals. In some cases, special districts play an expanded role in providing outdoor recreation opportunities, conservation and resource management services.
Regional Planning Councils Figure 3.3
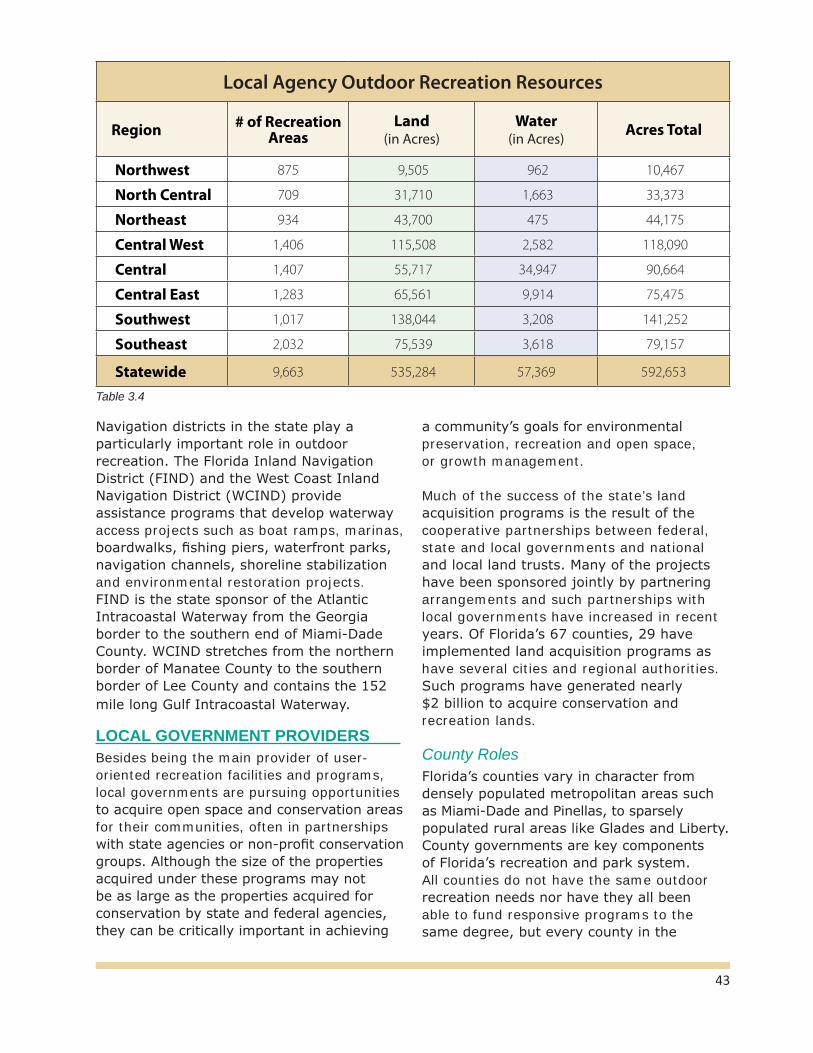
43
Navigation districts in the state play a particularly important role in outdoor recreation. The Florida Inland Navigation District (FIND) and the West Coast Inland Navigation District (WCIND) provide assistance programs that develop waterway access projects such as boat ramps, marinas, boardwalks, fishing piers, waterfront parks, navigation channels, shoreline stabilization and environmental restoration projects. FIND is the state sponsor of the Atlantic Intracoastal Waterway from the Georgia border to the southern end of Miami-Dade County. WCIND stretches from the northern border of Manatee County to the southern border of Lee County and contains the 152 mile long Gulf Intracoastal Waterway.
LOCAL GOVERNMENT PROVIDERSBesides being the main provider of user-oriented recreation facilities and programs, local governments are pursuing opportunities to acquire open space and conservation areas for their communities, often in partnerships with state agencies or non-profit conservation groups. Although the size of the properties acquired under these programs may not be as large as the properties acquired for conservation by state and federal agencies, they can be critically important in achieving
a community’s goals for environmental preservation, recreation and open space, or growth management.
Much of the success of the state’s land acquisition programs is the result of the cooperative partnerships between federal, state and local governments and national and local land trusts. Many of the projects have been sponsored jointly by partnering arrangements and such partnerships with local governments have increased in recent years. Of Florida’s 67 counties, 29 have implemented land acquisition programs as have several cities and regional authorities. Such programs have generated nearly $2 billion to acquire conservation and recreation lands.
County RolesFlorida’s counties vary in character from densely populated metropolitan areas such as Miami-Dade and Pinellas, to sparsely populated rural areas like Glades and Liberty. County governments are key components of Florida’s recreation and park system. All counties do not have the same outdoor recreation needs nor have they all been able to fund responsive programs to the same degree, but every county in the
Local Agency Outdoor Recreation Resources
Region # of RecreationAreas
Land (in Acres)
Water (in Acres) Acres Total
Northwest 875 9,505 962 10,467
North Central 709 31,710 1,663 33,373
Northeast 934 43,700 475 44,175
Central West 1,406 115,508 2,582 118,090
Central 1,407 55,717 34,947 90,664
Central East 1,283 65,561 9,914 75,475
Southwest 1,017 138,044 3,208 141,252
Southeast 2,032 75,539 3,618 79,157
Statewide 9,663 535,284 57,369 592,653
Table 3.4
44
state has an officially established outdoor recreation program. In some counties, user-oriented recreation programming is limited, but resource-based facilities such as roadside picnic areas or boat ramps are common amenities. In some counties, user-oriented facilities may be available only at public schools and municipal parks. More than half of Florida’s counties, however, have undertaken sophisticated recreation programs involving the administration of numerous and diverse parks, facilities and program activities.
Counties are primarily concerned with the local outdoor recreation needs generated by extra-municipal populations and as a rule are the ideal level of government to provide regional or large community parks. Unlike cities, the larger acreage of counties provides a wider range of resources and a greater variety of outdoor recreation venues. As a result, the typical county outdoor recreation program in Florida may offer a combination of resource-based and user-oriented activities. Beaches, swimming areas, boating access sites, picnic sites, scenic areas and, occasionally, campgrounds are among the more popular types of resource-based areas and facilities provided.
Municipal RolesVirtually all of Florida’s 412 municipalities have recreation programs and facilities of one type or another. Many cities have developed park and recreation programs with trained staff involved in the administration of parks, facilities and programs. Smaller cities may have only limited facilities and rely on the county government, local school system, private organizations or non-profit groups to carry out athletic programs.Because of population densities and the lack of large open space areas that support resource-based recreation opportunities, municipal recreation systems tend to concentrate on providing more intensive user-oriented facilities that require relatively little space. Typical municipal outdoor recreation facilities include playgrounds, swimming pools, ball fields,
tennis courts and golf courses. Because of the near total reliance on user-oriented facilities, municipal programs have only a limited bearing on the statewide resource-based outdoor recreation program. There are some exceptions, however, especially in the cases of cities located on bodies of water. For example, Atlantic and Gulf coastal communities provide many excellent public beach facilities, while those located on navigable waters (coastal or inland) operate marinas, boat ramps, mooring fields and other boating facilities.
Although little in the way of resource-based outdoor recreation facilities is provided by the typical municipal outdoor recreation program, municipal programs play a primary role in the provision of user-oriented recreation opportunities in Florida. The importance of the role of municipal programs will grow as increased public emphasis is placed on close-to-home recreation. Since municipal recreation agencies are the recreation system closest to the people, they are usually the first to feel the pressures to establish programs for meeting the added demands of new residents.
NON-GOVERNMENT ROLESIn addition to the more conventional forms of outdoor recreation provided by all levels of government, a wide array of recreational opportunities is afforded by the private sector. Private programs range from for-profit recreational enterprises such as campgrounds, golf courses, marinas and attractions of all kinds to non-profit conservation organizations. Industries with extensive land holdings, notably the forest products industry in Florida, provide vast recreation resources and excellent facilities on their lands for the use of the public often at only a nominal fee. However, this resource is quickly disappearing in many parts of the state as timber lands are being converted to private access leases or developed for residential and commercial purposes.
Private outdoor recreation, because of its size, complexity and the fact that it undergoes rapid and frequent change, is extremely difficult to inventory in a comprehensive manner.

45
Golfing at one of Florida’s private recreation providers
In addition to its direct delivery of outdoor recreation opportunities, the private sector can respond quickly to opportunities for acquiring property for subsequent donation or resale. This capability makes the private sector a valuable partner with public agencies in the provision of resource-based outdoor recreation. During the past decade, private companies and non-profit organizations have transferred thousands of acres to state government for recreation and conservation purposes. Those transfers represent a substantial contribution to the overall supply of outdoor recreational opportunities in Florida.
Commercial ProvidersFlorida’s commercial outdoor recreation providers are a vital component of the state’s economy. Commercial providers meet a significant portion of the overall demand for both resource-based and user-oriented outdoor recreation in Florida, particularly tourist-generated demand. Because of their capabilities and further potential for fulfilling demand, the private commercial sector must bear a large share of the responsibility for meeting demand for both resource-based and user-oriented recreation.
Private OrganizationsThis category includes private and quasi-public organizations such as the YMCA, 4-H, scouting organizations, faith-based groups and a
myriad of conservation organizations such as The Nature Conservancy, Audubon Society, Archbold Biological Station and Tall Timbers Research Station and Land Conservancy. In many cases these organizations not only acquire and manage conservation land, but they also conduct preservation, restoration and research programs and public educational activities. These groups provide land and facilities primarily for the use of members, but in some cases for the public at large.
ClubsThis category includes hunt clubs, country clubs, tennis clubs, yacht clubs and others. These groups manage land or facilities that are primarily available only to organization members or their guests. In addition, private industry lands are included (timber companies and other industries with extensive land holdings whose lands or portions thereof are open to the public). The majority of these lands are used for resource-based recreation, although some forms of user-oriented facilities are also available.

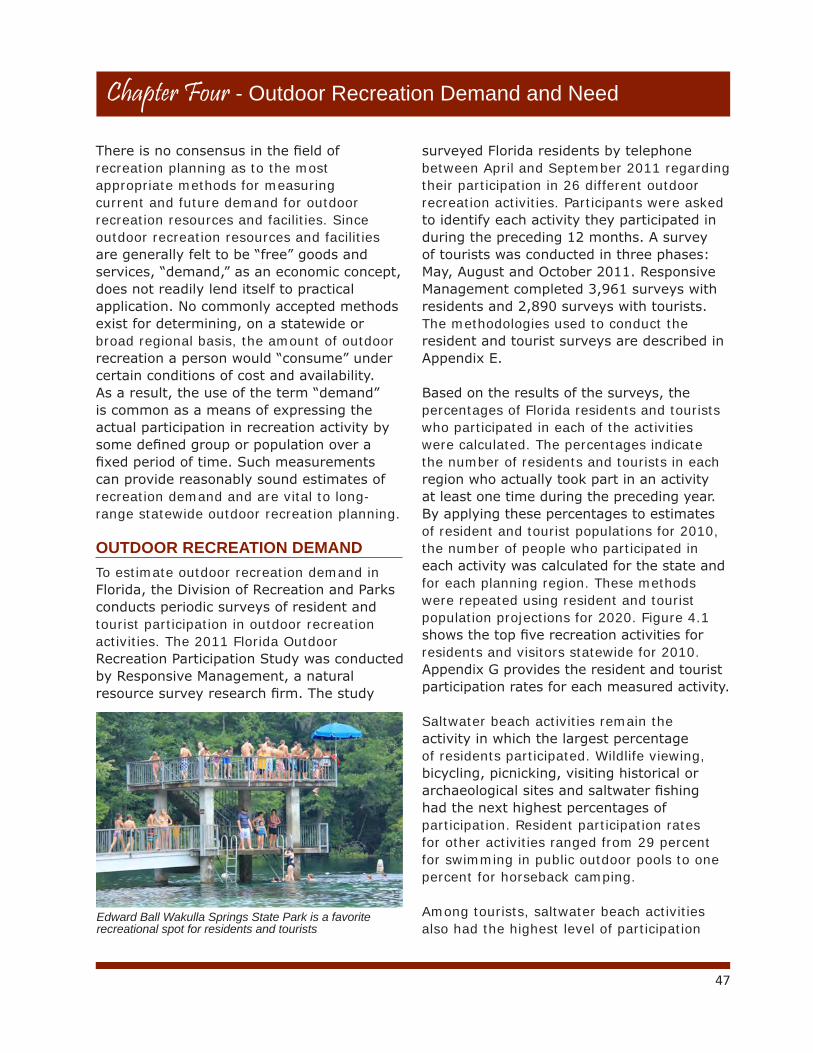
47
Chapter Four - Outdoor Recreation Demand and Need
There is no consensus in the field of recreation planning as to the most appropriate methods for measuring current and future demand for outdoor recreation resources and facilities. Since outdoor recreation resources and facilities are generally felt to be “free” goods and services, “demand,” as an economic concept, does not readily lend itself to practical application. No commonly accepted methods exist for determining, on a statewide or broad regional basis, the amount of outdoor recreation a person would “consume” under certain conditions of cost and availability. As a result, the use of the term “demand” is common as a means of expressing the actual participation in recreation activity by some defined group or population over a fixed period of time. Such measurements can provide reasonably sound estimates of recreation demand and are vital to long-range statewide outdoor recreation planning.
OUTDOOR RECREATION DEMAND
To estimate outdoor recreation demand in Florida, the Division of Recreation and Parks conducts periodic surveys of resident and tourist participation in outdoor recreation activities. The 2011 Florida Outdoor Recreation Participation Study was conducted by Responsive Management, a natural resource survey research firm. The study
surveyed Florida residents by telephone between April and September 2011 regarding their participation in 26 different outdoor recreation activities. Participants were asked to identify each activity they participated in during the preceding 12 months. A survey of tourists was conducted in three phases: May, August and October 2011. Responsive Management completed 3,961 surveys with residents and 2,890 surveys with tourists. The methodologies used to conduct the resident and tourist surveys are described in Appendix E.
Based on the results of the surveys, the percentages of Florida residents and tourists who participated in each of the activities were calculated. The percentages indicate the number of residents and tourists in each region who actually took part in an activity at least one time during the preceding year. By applying these percentages to estimates of resident and tourist populations for 2010, the number of people who participated in each activity was calculated for the state and for each planning region. These methods were repeated using resident and tourist population projections for 2020. Figure 4.1 shows the top five recreation activities for residents and visitors statewide for 2010. Appendix G provides the resident and tourist participation rates for each measured activity.
Saltwater beach activities remain the activity in which the largest percentage of residents participated. Wildlife viewing, bicycling, picnicking, visiting historical or archaeological sites and saltwater fishing had the next highest percentages of participation. Resident participation rates for other activities ranged from 29 percent for swimming in public outdoor pools to one percent for horseback camping.
Among tourists, saltwater beach activities also had the highest level of participation
Edward Ball Wakulla Springs State Park is a favorite recreational spot for residents and tourists

48
at 49 percent. This was followed closely by wildlife viewing at 48 percent. Picnicking, swimming in public outdoor pools, visiting archaeological and historic sites, hiking and saltwater fishing had the next highest levels of participation. Participation rates for the other activities ranged from 14 percent for both bicycling and freshwater beach use to 2 percent for soccer and football.
Importance of RecreationThe participation survey determined that nearly all Florida residents (96 percent) say
that outdoor recreation is important to them; this includes 72 percent who think it is very important and 24 percent who think it is somewhat important. The results are similar among tourists: 98 percent say outdoor recreation is important to them personally (65 percent saying very important and 33 percent saying somewhat important).
Motivations for ParticipationAn important aspect of planning for outdoor recreation is understanding why people recreate; what motivates them to get
Top Five Outdoor Recreation Opportunities: Residents & Tourists
0
10
20
30
40
50
60
70
80
Sal
twat
er B
each
A
ctiv
ities
(exc
lude
s fis
hing
)
Wild
life
View
ing
Fish
ing
Bic
yclin
g
Pic
nick
ing
0
10
20
30
40
50
60
70
80
Picn
ickin
g
Wild
life V
iewi
ng
Saltw
ater
Bea
ch
Activ
ities (e
xclu
des
fishi
ng)
Swim
min
g
in o
utdo
or
Visit
ing
hist
orica
l or
arch
eolo
gica
l site
s
RESIDENTS
TOURISTS
1) Saltwater Beach Activities 63% (excludes fishing)
2) Wildlife Viewing 49%
3) Fishing 46%
4) Bicycling 44%
5) Picnicking 40%
1) Saltwater Beach Activities 49% (excludes fishing)
2) Wildlife Viewing 47%
3) Picnicking 37%
4) Swimming 29% (in outdoor swimming pools)
5) Visiting historical or 26% archeological sites
PERC
ENT
WH
O P
ART
ICIP
ATED
PERC
ENT
WH
O P
ART
ICIP
ATED
Figure 4.1
swim
ming
pools
See Appendix G for full list of outdoor recreation participation by activity
49
outside and participate. According to the participation survey, for Florida residents, health and physical fitness is considered the most important reason for participation, followed by being with family and friends, for fun/relaxation, and being outdoors and closer to nature.
The most important reason for tourist participation in outdoor recreation in Florida is for fun and relaxation, followed by being with family and friends and the attractiveness of Florida’s recreation opportunities and climate.
Satisfaction with OpportunitiesThe participation survey found that the overwhelming majority of Florida residents are satisfied with the outdoor recreation opportunities in their home county and support Florida maintaining its current levels of outdoor recreation services and opportunities. Among tourists, satisfaction with opportunities is even higher, and a large majority of tourists support maintaining the current levels of outdoor recreation services and opportunities in Florida. This is not to say there are no needs for improvement,
but rather emphasizes the need for at least maintaining current levels of service as the population grows.
Respondents’ opinions of the quality of facilities in their home counties are also positive, with nearly 80 percent rating the facilities excellent or good. On the other end, 20 percent rate them fair or poor, and without continued maintenance, this number is expected to rise.
1) For health/physical fitness
2) To be with family and friends
3) For relaxation/fun/enjoyment
4) To be outdoors/close to nature
5) To enjoy the scenery
1) For relaxation/fun/enjoyment
2) To be with family and friends
3) Florida has good/attractive recreation opportunities/climate
4) To be outdoors/close to nature
5) Beach (specifically mentioned)
Top Reasons for Resident Participation
Satisfaction with Outdoor Recreation Opportunities - Residents and Tourists
Top Reasons for Tourist Participation
0
10
20
30
40
50
60
70
80 Residents
Tourists
77%
38%
20%
41%
5% 7% 6%2% 0%0%0%2%
VerySatisfied
SomewhatSatisfied
SomewhatDissatisfied
VeryDissatisfied
Don’t knowNeither Satisfied
nor dissatisfied
RESIDENTS1) Community parks
2) Biking paths
3) Playgrounds
4) Outdoor public swimming pools
5) Hiking/walking trails
TOURISTS1) Improved amenities at existing recreation areas (bathrooms, etc.)
2) Community Parks
3) Beach Access/Parking
4) Waterpark
5) Saltwater Boat Access/Ramps
Top Desired Facilities - Residents and Tourists
Figure 4.2
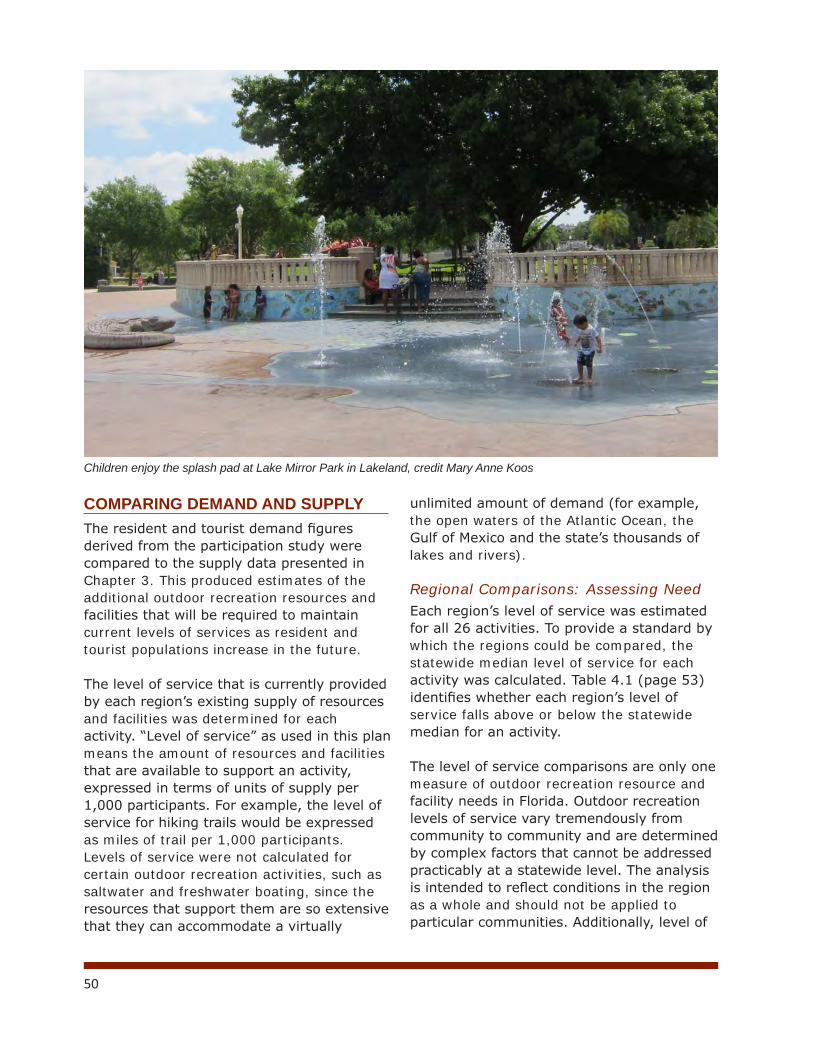
50
COMPARING DEMAND AND SUPPLYThe resident and tourist demand figures derived from the participation study were compared to the supply data presented in Chapter 3. This produced estimates of the additional outdoor recreation resources and facilities that will be required to maintain current levels of services as resident and tourist populations increase in the future. The level of service that is currently provided by each region’s existing supply of resources and facilities was determined for each activity. “Level of service” as used in this plan means the amount of resources and facilities that are available to support an activity, expressed in terms of units of supply per 1,000 participants. For example, the level of service for hiking trails would be expressed as miles of trail per 1,000 participants. Levels of service were not calculated for certain outdoor recreation activities, such as saltwater and freshwater boating, since the resources that support them are so extensive that they can accommodate a virtually
unlimited amount of demand (for example, the open waters of the Atlantic Ocean, the Gulf of Mexico and the state’s thousands of lakes and rivers).
Regional Comparisons: Assessing NeedEach region’s level of service was estimated for all 26 activities. To provide a standard by which the regions could be compared, the statewide median level of service for each activity was calculated. Table 4.1 (page 53)identifies whether each region’s level of service falls above or below the statewide median for an activity.
The level of service comparisons are only one measure of outdoor recreation resource and facility needs in Florida. Outdoor recreation levels of service vary tremendously from community to community and are determined by complex factors that cannot be addressed practicably at a statewide level. The analysis is intended to reflect conditions in the region as a whole and should not be applied to particular communities. Additionally, level of
Children enjoy the splash pad at Lake Mirror Park in Lakeland, credit Mary Anne Koos

51
service is heavily influenced by the resident and tourist populations. A region with a lower level of service does not necessarily have fewer facilities, but often has a greater number of participants using the facilities.
Despite these limitations, the analysis presented in the plan is useful for identifying regional and statewide patterns of outdoor recreation supply and demand and offering a reasonably sound understanding of regions with the greatest needs to support the
demands of their population. Increasing opportunities should be a statewide priority, and not solely focused on regions below the statewide median. While these regions have greater relative needs to adequately supply their participants, all regions must continue to enhance their outdoor recreation opportunities to meet the needs of a growing population.
The results of the assessment are presented fully in Appendix H.
SpotlightNW
NCNE
CE
SESW
CW C
Predicted Percent Population Change by 2030
0
5
10
15
20
25
9% 10%
17%
13%
21%
13%
18%
8%
NENCNW CW C CE SW SE
=Level of Service
Resources and Facilities for an Activity
Participants in the Activity
1,000( )
This chart shows projected population growth for each region. Regions with rapid growth will continue to see a rise in demand and strain on existing outdoor recreation resources.
Figure 4.3
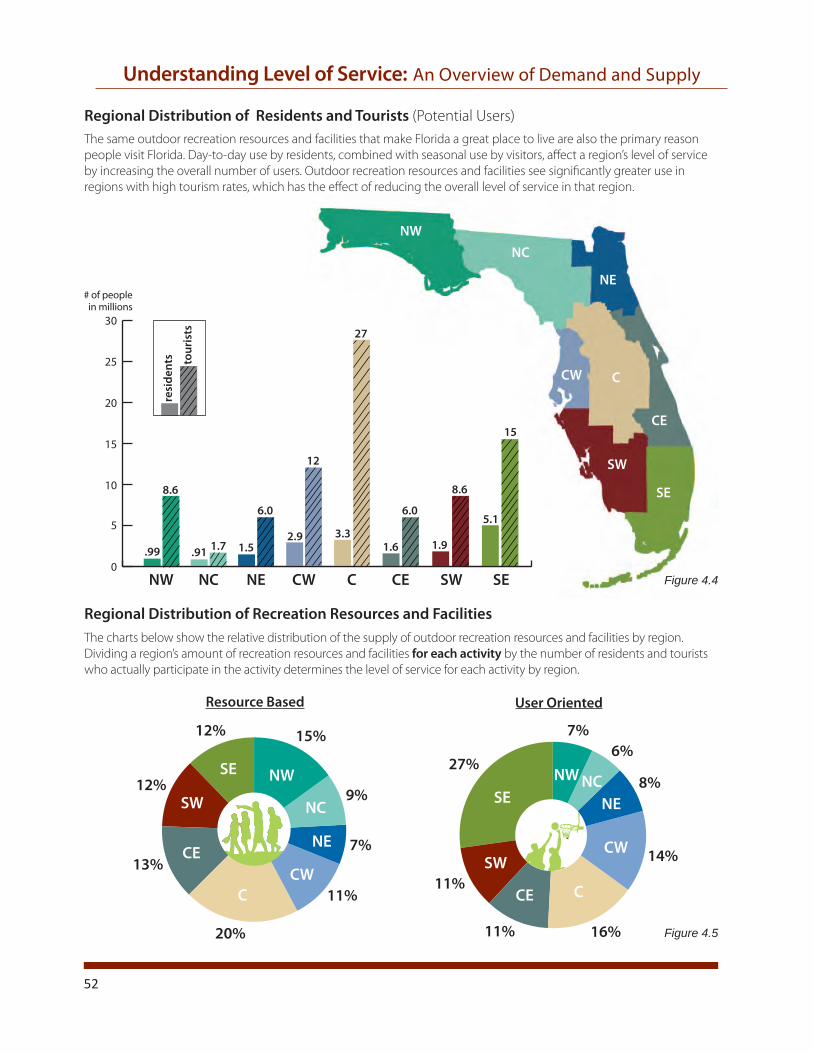
52
The charts below show the relative distribution of the supply of outdoor recreation resources and facilities by region. Dividing a region’s amount of recreation resources and facilities for each activity by the number of residents and tourists who actually participate in the activity determines the level of service for each activity by region.
Regional Distribution of Recreation Resources and Facilities
Resource Based
20%
15%12%
12%
13%
9%
7%
11%
SE NW
NC
NE
CWC
CE
SW
User Oriented
27%
11%
11% 16%
14%
8%
6%7%
SENW
NWNC
NE
CW C
CE
SW
SE
NCNE
CW
CCE
SW
Regional Distribution of Residents and Tourists (Potential Users)The same outdoor recreation resources and facilities that make Florida a great place to live are also the primary reason people visit Florida. Day-to-day use by residents, combined with seasonal use by visitors, affect a region’s level of service by increasing the overall number of users. Outdoor recreation resources and facilities see significantly greater use in regions with high tourism rates, which has the effect of reducing the overall level of service in that region.
Figure 4.4
Figure 4.5
8.6
.91 1.7 1.5
6.0
2.9
12
3.3
27
1.6
6.0
1.9
8.6
5.1
15
.99
NENCNW CW C CE SW SE0
5
10
15
20
25
30
# of peoplein millions
resi
dent
s tour
ists
Understanding Level of Service: An Overview of Demand and Supply

53
Comparing Regional Levels of Service to Statewide Median*
Resource-Based Activities RegionNW NC NE CW C CE SW SE
Saltwater Beach Activities NA
Freshwater Beach Activities
Saltwater Fishing Non-boat NA
Freshwater Fishing Non-boat
Saltwater Boat Ramp NA
Freshwater Boat Ramp
Bicycling Paved
Bicycling Unpaved
Hiking
Horseback Riding
Off-Highway Vehicle Driving
Nature Study
Picnicking
Visiting Historical or Archaeological Sites
Tent Camping
RV or Trailer Camping
Hunting
User-Oriented Activities RegionNW NC NE CW C CE SW SE
Swimming in Public Outdoor Pool
Baseball or Softball
Outdoor Basketball
Outdoor Tennis
Soccer
Football
Golf
* Table shows SCORP planning regions as either above or below the statewide median level of service, per activity.See Appendix G for regional level of service calculations per activity.
Table 4.1
Level of Service Below Statewide MedianLevel of Service Above Statewide Median

54
CONCLUSIONThe purpose of this chapter is to identify regional and statewide patterns of outdoor recreation supply and demand, offering a reasonably sound understanding of regions with the greatest needs to support the demands of their population. Regions with dense populations, such as the Northeast, Central West, Central and Southeast regions tend to have the greatest needs, a trend which will likely continue if these needs are not adequately addressed.
The steady rise of Florida’s population will lead to an increasing demand in all regions, calling for a continuing need for the provision of outdoor recreation facilities and the conservation of natural and cultural resources. It is critical to ensure that these resources and facilities enjoyed by the over 100 million residents and tourists today are there for those in the future.

55
Chapter Five - Outdoor Recreation Issues and Recommendations
Understanding outdoor recreation issues and anticipating emerging trends is an important element of the state’s outdoor recreation plan. Florida is among the largest and most dynamic states in the nation. Changes in the state’s social, economic, and environmental systems will affect many aspects of people’s lives, including how they recreate. Although these considerations do not lend themselves readily to quantitative analysis, it is nonetheless important that they be well understood in future decision making. This chapter discusses issues affecting outdoor recreation in Florida, and outlines recommendations for implementing the state’s outdoor recreation plan. The issues and recommendations outlined in this chapter are the product of a variety of methods for input, including: the SCORP workgroup, meetings with outdoor recreation stakeholders, research of nationwide trends and issues, the 2011 Outdoor Recreation Participation Survey, public workshops and online questionnaires.
A SYSTEM OF LANDS
Florida’s diverse public and private outdoor recreation lands, facilities, programs and managing agencies are bound together by a universally common trait – their ability to provide public recreational opportunities of one type or another. These various areas and the users they serve can be viewed together as an interconnected system. While tremendous progress has been made in acquiring the needed lands and providing the facilities and programs to support public use of the lands, relatively little has been done to integrate the efforts of the providers. The following statement is intended to describe an ideal, but as yet unrealized, recreation system for the state.
Florida’s ideal outdoor recreation system will be a diverse, connected and balanced system of outdoor recreation resources, facilities and programs that provides the state’s residents and visitors with a full
An online questionnaire regarding outdoor recreation issues in Florida yielded nearly 4,000 responses. The word map above is an abstract representation of input received in an open response item of the questionnaire, with the size of the word reflecting frequency of mention.
PARKS
MO
RE
PUBL
IC
ACCESSNEE
D
LACK
ALL RECREATION
USE
PEO
PLE
FACILITIES
RECREATIONAL FISH
ING
LAN
D
COUNTY
ENOUGH
BOAT
RESIDENTS
TRAIL
RV
BIKE
SITESSEE
AREA
BEACH
LOCA
L
COST KEE
P
CA
MP
ENJOY
WANT
AVA
ILA
BLE
ACTIVITIES
WILDLIFE
PROGRAMS
BEACHES
FUN
DIN
G WATERWAYSHIKING
GO
OUTDOOR
LIMITED
RIDING
RAMPS
DURING
CONSERVATION
NAT
URA
L
FEES
SAFE
HO
RSE
FISH
PAY
LOVE
PARK
ING
CAMPGROUNDS
TIME
HUNTING
LAN
DS
CAMPING
TRAILSAREAS
WATER

56
range of outdoor recreation opportunities, regardless of their age, gender, ethnic background, economic status, physical or mental ability, or location within the state. The system will be coordinated at the state level with all agencies and suppliers working in tandem, and with ample opportunity for the public to participate in decision making. It will further the public’s understanding and appreciation of Florida’s environment and outdoor recreation resources.
ISSUES, GOALS AND STRATEGIES: A METHOD FOR IMPLEMENTATION
Three overarching issue areas have been identified as impacting recreation in Florida. In this chapter, each issue is broken down by related topics. A discussion of each topic is followed by specific goals and strategies to address the issues and implement the plan.
Issue One: Raising awareness of the value and benefits of outdoor recreation Summary: Educating the public on the benefits of outdoor recreation to individuals and communities is integral in maintaining support for recreation programs.
The Economic Impact of Outdoor Recreation For residents and tourists alike, outdoor recreation is an important part of everyday life. Florida’s temperate climate, combined with outstanding cultural and natural resources, allows for recreation participation year round. Outdoor recreation stimulates the economy through the purchase of equipment necessary for participation, with money spent on trips and travel and through a host of direct and indirect ways.
Tourism: An Economic DriverFlorida has long been a destination for domestic and international travelers, and outdoor recreation is a major contributor to the state’s tourism market. According to VISIT FLORIDA, Florida’s tourism rates have seen a steady rise since 2009, leading to an estimated 87.3 million visitors in 2011. In 2011, recreation and/or leisure was the primary reason for more than 88 percent of domestic visits, 81 percent of Canadian visits, and 68.5 percent of international visits, showing the strong link between recreation and tourism. While relaxing and enjoying the outstanding natural and cultural resources that Florida has to offer, visitors are also making a significant contribution to Florida’s economy. Total tourism spending was calculated at $67.2 billion in 2011, creating more than one million jobs to support the industry.
A recent study by the Outdoor Industry Association, The Outdoor Recreation Economy, determined that each year
ISSUE 1: Raising awareness of the values and benefits of outdoor recreation
• Goal 1-1: Highlight the economic impact of outdoor recreation
• Goal 1-2: Emphasize outdoor recreation’s impact on health and quality of life
• Goal 1-3: Ensure and identify future resources for programs essential to recreation
ISSUE 2: Improving public access through agency coordination
• Goal 2-1: Maintain and manage adequate availability of resources for a growing population
• Goal 2-2: Coordinate recreation providers to better connect lands and opportunities
• Goal 2-3: Increase and improve universal accessibility
• Goal 2-4: Protect Florida’s waters while providing adequate public access
ISSUE 3: Reconnecting people to the outdoors
• Goal 3-1: Improve urban recreation opportunities
• Goal 3-2: Connect all people to the outdoors
• Goal 3-3: Facilitate participation through accessible information
• Goal 3-4: Encourage volunteerism, stewardship, and advocacy

57
more than $38 billion is spent on outdoor recreation in Florida, supporting 329,000 jobs across the state. In comparison, the Division of Recreation and Parks reports state parks provide a direct economic impact of $1 billion to local economies each year, while generating 19,347 jobs.
Nature-based tourism is an important component of the tourism industry. Fishing, hunting, boating, paddling and wildlife viewing are among the more popular examples of activities associated with this type of tourism. These activities have a huge impact on the state’s economy. According to the Florida Fish and Wildlife Conservation Commission (FWC), wildlife viewing, hunting, boating and fishing provide a total economic effect of $3.2 billion, creating more than 34,000 jobs. Wildlife festivals, ideal for generating interest, educating the public and distributing information, also provide great boosts to local economies. One example, the 2009 Space Coast Birding and Wildlife Festival had an impact of almost $1 million in Brevard County alone.
Recreation, Real Estate and Business Relocation Parks and open space have been tied to an increase in property values since the 19th Century, and studies have consistently shown connections between property values and proximity to parks, trails and open spaces. Parks and trails are often a central piece in revitalization efforts of towns and neighborhoods, offering sustainable and appealing infrastructure which draws residents to areas previously considered undesirable. This increase in property value
Every 85 visitors creates one Florida job.- VISIT FLORIDA®Qu
ick
FactSpotlight
0 5 10 15 20 25
Busch GardensSea World Florida
Universal Studios at Universal Orlando
Islands of Adventure at Universal Orlando
Florida’s National ParksHollywood Studios at Walt Disney World
Animal Kingdom at Walt Disney World
EPCOT at Walt Disney World
Magic Kingdom at Walt Disney World
Florida’s State Parks
Tourism & Resource-Based Recreation in FloridaWhile many associate Florida tourism with theme parks, the state’s natural resources are immensely popular with visitors. The graph at left, based on information provided by the Florida Department of Economic Opportunity, compares 2010 attendance at the state’s major theme parks with Florida’s state and national parks. Combined attendance at Florida’s state parks outpaced any other attraction.
Source: Florida State Parks, National Parks Service, and The Global Attractions Attendance Report (2010) from the Themed Entertainment Association.
Total Attendance (millions)
2010 Attendance
Weeki Wachee Springs State Park

58
provides additional property tax revenues to further the positive growth of a community.
Parks are also a contributing factor when seeking business relocation. Industry today is increasingly based on high-technology and service-sector companies, where information and knowledge are the main sources of economic growth and wealth. Companies in this industry are extremely mobile and can be more selective in the location of their businesses, and are interested in areas that will retain and attract talent. Quality of life in a community is a considerable contributing factor when making these decisions, with the availability of outdoor recreation opportunities playing a large role.
Raising AwarenessMultiple studies and reports highlight the significant impact of outdoor recreation on the economy. However, these reports are often agency or activity specific and utilize a variety of methods when determining the impact. Recreation providers and advocates could benefit from a comprehensive analysis of the total impact recreation has on Florida’s economy, the report serving as a universal platform for educating the public on the importance of outdoor recreation. The Florida Department of Economic Opportunity (DEO) has contributed to this effort with a website titled The Economic Benefit of Eco-tourism, which compiles economic impact information from various state and federal programs onto one page. State agencies, in coordination with DEO, should look to further this effort. The following strategies will help recreation providers and stakeholders educate the public on the benefits of outdoor recreation to the economy.
Quality of LifeActive lifestyles and time spent outdoors are major contributors to a person’s health and overall quality of life, as the connection between good health and physical activity is widely recognized. Public lands and waters provide opportunities for healthy exercise and physical activity, relaxation and solitude, and challenge and risk. Providing and facilitating access to public lands through high quality systems of parks, greenways and other natural areas is a major step towards creating and maintaining active, healthy communities. Even so, more must be done to ensure that the public understands and is receiving the full benefits recreation has to offer. A 2011 report by the Trust for America’s Health and the Robert Wood Johnson Foundation determined Florida’s adult obesity rate to be 26.1 percent, an 80 percent increase over the past 15 years. These striking figures illustrate either the lack of awareness of recreation’s
SpotlightRising Obesity Rates
*All ages, all genders, adjusted for self-reporting bias. BMI: Body Mass Index Source: Trust for America’s Health
Strategies:1) DEP and relevant state agencies, in coordination with all recreation providers, should produce a report on the overall economic impact of outdoor recreation in Florida. 2) Local recreation providers should work with local economic development councils to promote Florida’s recreation opportunities as a means to attract businesses. 3) Recreation providers should communicate with private developers on the connection between property values and availability of natural landscapes and recreation opportunities.
Goal 1-1: Highlight the economic impact of recreation.
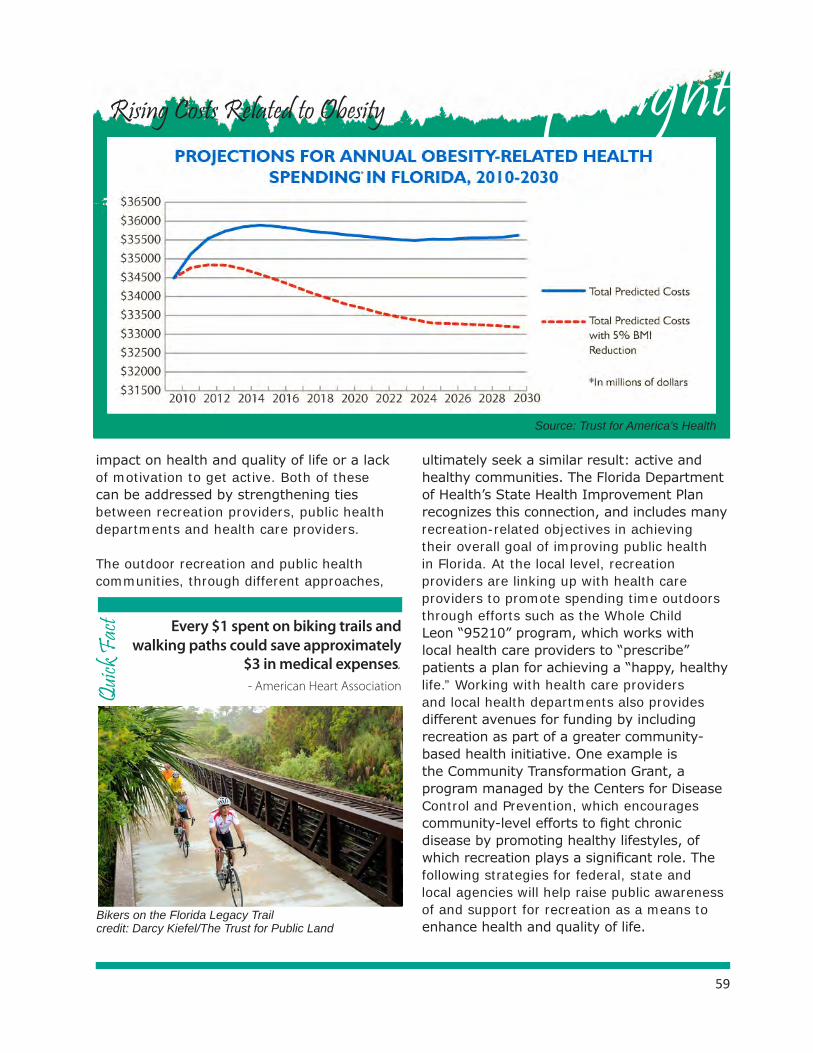
59
impact on health and quality of life or a lack of motivation to get active. Both of these can be addressed by strengthening ties between recreation providers, public health departments and health care providers.
The outdoor recreation and public health communities, through different approaches,
ultimately seek a similar result: active and healthy communities. The Florida Department of Health’s State Health Improvement Plan recognizes this connection, and includes many recreation-related objectives in achieving their overall goal of improving public health in Florida. At the local level, recreation providers are linking up with health care providers to promote spending time outdoors through efforts such as the Whole Child Leon “95210” program, which works with local health care providers to “prescribe” patients a plan for achieving a “happy, healthy life.” Working with health care providers and local health departments also provides different avenues for funding by including recreation as part of a greater community-based health initiative. One example is the Community Transformation Grant, a program managed by the Centers for Disease Control and Prevention, which encourages community-level efforts to fight chronic disease by promoting healthy lifestyles, of which recreation plays a significant role. The following strategies for federal, state and local agencies will help raise public awareness of and support for recreation as a means to enhance health and quality of life.
Rising Costs Related to Obesity Spotlight
Source: Trust for America’s Health
Every $1 spent on biking trails and walking paths could save approximately
$3 in medical expenses. - American Heart AssociationQu
ick F
act
Bikers on the Florida Legacy Trail credit: Darcy Kiefel/The Trust for Public Land
*

60
Program SupportContinued support for outdoor recreation is an extremely important issue for Florida residents and recreation providers, as increasing population raises the demand for new facilities. Today, recreation providers are exploring a variety of alternatives to supplement traditional state and federal funding sources to support their programs. During the economic downturn, providers at all levels encountered budget limitations which affected parks and recreation services. This led to the development of new strategies for maintaining and improving recreation services, such as increasing the role of the private sector in public recreation areas and creating innovative public-private partnerships. Now, as the economy continues its recovery, these support models are bolstering recreation providers’ abilities to meet the needs of the public. Recreation management agencies should focus on using existing funds with maximum efficiency to ensure the highest needs and priorities are being met. Alternative funding sources, such as private sponsorships should be expanded at all levels of public recreation.
Issue Two: Improving public access through agency coordinationRecreation in Florida can be greatly improved through continued agency coordination in acquisition, management, and programming of public lands.
AccessAccess to Florida’s existing public lands continues to be an issue with the public. There is a perception that the land is “locked up” after purchase, that access which existed before acquisition is reduced or eliminated once the land comes into public ownership. Most public land is available for some type of public access, but not enough priority has always been given to opening land for appropriate recreational use. Given current economic realities, however, land management agencies are often focusing development efforts towards improving and enhancing existing access points. By focusing on existing infrastructure, limited funds can
Strategies:1) Public recreation providers should partner with county health departments and local health care providers to promote active, healthy lifestyles through community-level health improvement initiatives. 2) DEP should assist DOH in implementing recreation-related objectives in the State Health Improvement Plan.
3) DOH and county health departments should determine ways to further incorporate outdoor recreation opportunities into community health assessments, utilizing tools such as the Florida Outdoor Recreation Inventory to determine existing opportunities and measure their impact on community health.
Goal 1-2: Emphasize the impact of recreation on health and quality of life.
Strategies:1) Recreation providers should seek partnerships with private sector companies that share the common vision of creating healthy, active and livable communities. 2) Recreation providers should work with stakeholders and the general public to advocate the provision of adequate funding for existing land and water conservation programs.
3) DEP should coordinate with DEO in working with local governments to identify sources of public and private grant funding to meet recreational programming and park development needs.
4) The Florida Recreation and Park Association, the Trust for Public Land, The Nature Conservancy and other organizations should continue to provide technical assistance to local governments and citizen groups for identifying alternative sources of funding and enacting local land acquisition programs.
Goal 1-3: Ensure and identify alternative funding for programs essential to Florida’s recreation program.

61
be best used to improve and expand existing facilities.
Involving Local CommunitiesPublic land mangers can improve access to their lands and water by better involving local communities. Outfitters, guide companies, and other businesses can directly provide supplemental services on public lands, expanding business opportunities while providing better public access. Through effective communication, land management agencies can provide information to help inform communities how they can benefit from public lands, and in return access to these lands can be improved. The following recommendations have been established to help continue to provide public recreational access in Florida.
Connecting Opportunities: Agency CoordinationA recurring theme from the public input process was the need to better connect existing recreational opportunities in order to improve the overall quality and availability of recreation opportunities. Improving communication and coordination with community planners, transportation departments, and adjacent land management agencies at all levels of government can result in better-connected opportunities. Proper coordination can also reduce unnecessary duplication of resources or facilities while avoiding any deficits. At a community scale, such coordination can result in better distributed and connected parks and green spaces, as well as linked trail systems providing alternative methods of transportation. A well planned and coordinated park system facilitates recreation participation, providing healthier and more vibrant communities.
Florida Greenways and Trails System PlanWith connection of opportunities, discussion often revolves around trails. A well planned trail system can connect public lands, lengthen and enhance experiences, and provide a viable source for alternative transportation within and between communities. The Division of Recreation and Parks, through the Office of Greenways and Trails, provides a statewide vision for Florida’s greenways and trails through the Florida Greenways
Strategies:1) Given Florida’s current economic situation, public land management agencies should focus efforts on enhancing existing access points and facilities, as present resources allow.
2) By working with local business communities, land management agencies should work closely with local recreation suppliers and outfitters on how they can benefit from nearby public lands to stimulate local economies, create jobs and facilitate public recreational access.
3) Agencies should ensure that all public lands are open for appropriate public access as soon as possible after acquisition, without compromising the agencies’ mission or the resources of the land.
4) Resource management and restoration activities on public lands should be greatly expanded. Activities such as prescribed burning, exotic species removal and hydrological restoration are vital to providing and maintaining the natural and cultural resources that support resource- based recreation.
Goal 2-1: Maintain and manage adequate availability of resources for a growing population.
St. George Island State Park
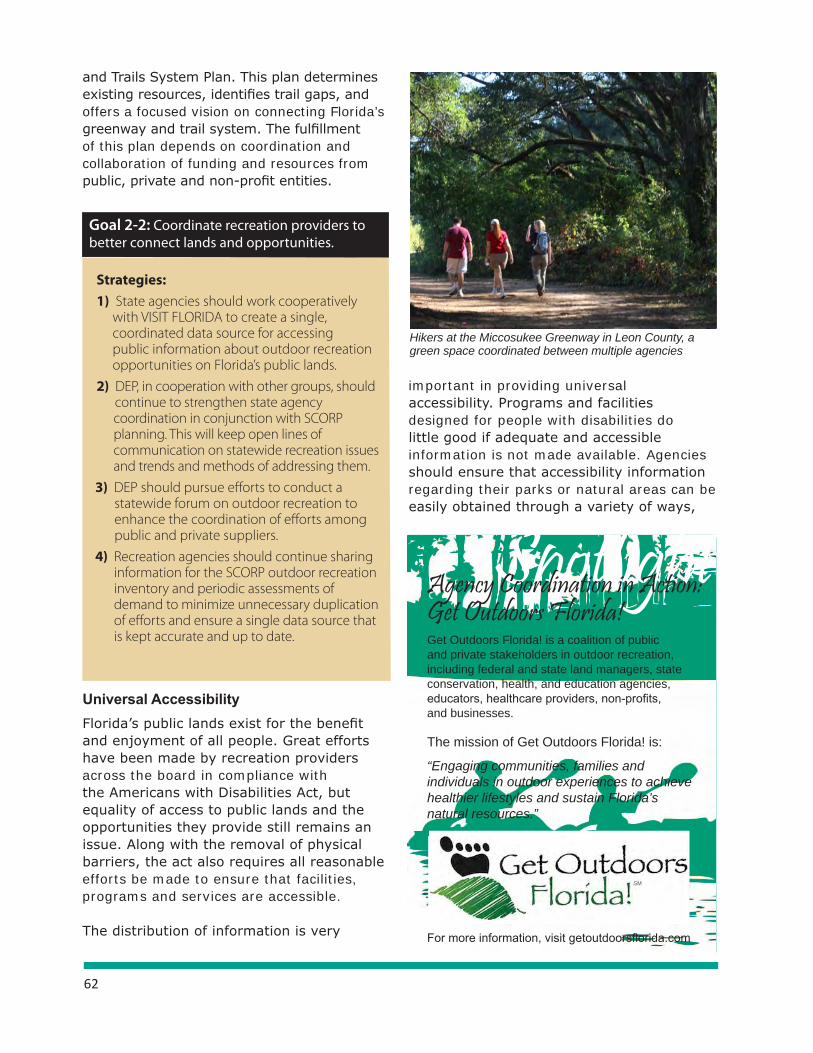
62
and Trails System Plan. This plan determines existing resources, identifies trail gaps, and offers a focused vision on connecting Florida’s greenway and trail system. The fulfillment of this plan depends on coordination and collaboration of funding and resources from public, private and non-profit entities.
Universal AccessibilityFlorida’s public lands exist for the benefit and enjoyment of all people. Great efforts have been made by recreation providers across the board in compliance with the Americans with Disabilities Act, but equality of access to public lands and the opportunities they provide still remains an issue. Along with the removal of physical barriers, the act also requires all reasonable efforts be made to ensure that facilities, programs and services are accessible.
The distribution of information is very
important in providing universal accessibility. Programs and facilities designed for people with disabilities do little good if adequate and accessible information is not made available. Agencies should ensure that accessibility information regarding their parks or natural areas can be easily obtained through a variety of ways,
SpotlightAgency Coordination in Action:Get Outdoors Florida!Get Outdoors Florida! is a coalition of public and private stakeholders in outdoor recreation, including federal and state land managers, state conservation, health, and education agencies, educators, healthcare providers, non-profits, and businesses.
The mission of Get Outdoors Florida! is:
“Engaging communities, families and individuals in outdoor experiences to achieve healthier lifestyles and sustain Florida’s natural resources.”
For more information, visit getoutdoorsflorida.com
Strategies:1) State agencies should work cooperatively with VISIT FLORIDA to create a single, coordinated data source for accessing public information about outdoor recreation opportunities on Florida’s public lands.
2) DEP, in cooperation with other groups, should continue to strengthen state agency coordination in conjunction with SCORP planning. This will keep open lines of communication on statewide recreation issues and trends and methods of addressing them.
3) DEP should pursue efforts to conduct a statewide forum on outdoor recreation to enhance the coordination of efforts among public and private suppliers.
4) Recreation agencies should continue sharing information for the SCORP outdoor recreation inventory and periodic assessments of demand to minimize unnecessary duplication of efforts and ensure a single data source that is kept accurate and up to date.
Goal 2-2: Coordinate recreation providers to better connect lands and opportunities.
Hikers at the Miccosukee Greenway in Leon County, a green space coordinated between multiple agencies

63
and should consider establishing outreach programs to encourage participation if they have not already done so.
Programs such as the Universal Trail Assessment Process (UTAP) provide guidelines for assessing and reporting trail conditions – like slope, distance, grade and width – which may limit one’s ability to participate. These objective reports provide information that allows potential users to decide if the trail is accessible to them and meets their needs and abilities.
Florida’s WatersMuch of Florida’s recreation participation is centered around water, and preserving these opportunities is essential to the state’s recreation program. Protection of
SpotlightFlorida Disabled Outdoors Association (FDOA)Miracle Sports ProgramThe Florida Disabled Outdoors Association is a non-profit organization that seeks to provide access for all through the coordination of six unique programs and by providing accessibility consultation with agencies around the state.
Miracle Sports, an FDOA program in Tallahassee since 2008, provides access to athletics for everyone. The program takes place on a barrier-free field developed through a partnership with the City of Tallahassee, and has logged over 4,200 team sport recreation hours since its inception.
Credit: FDOA
Strategies:1) State land management agencies should partner with organizations such as the Florida Disabled Outdoors Association to establish specific programs for visitors with disabilities to be uniformly available throughout the state.
2) Outdoor recreation providers should develop and implement schedules for identifying and eliminating architectural barriers in existing facilities under their management.
3) Upon construction or renovation of trails, agencies should complete UTAP trail assessments and provide trail accessibility information to the public.
4) All recreation providers should stay current on information technology, following best practices for distribution of information to the public.
5) Outdoor recreation providers should develop and strengthen partnerships with the Agency for Persons with Disabilities and organizations such as Florida Disabled Outdoors Association to educate themselves and the public, and to provide recreation activities and programs for people of all ages and abilities.
Goal 2-3: All recreation providers should seek to increase universal accessibility.
Kayaking Card Sound Biscayne Bay Aquatic Preserve Credit: Paul Marcellini

64
water resources is the most important step in maintaining freshwater and saltwater resources in a swimmable, fishable condition. This involves a complex and science-based system of federal, state, and local regulatory and enforcement programs, which must ensure that the greatest efforts are taken towards protecting and improving the quality of Florida’s water resources. Florida’s springs, a unique and very popular resource, continue to be threatened by nutrient pollution from sources such as excess fertilizer use, septic systems, and stormwater runoff. Community-based programs which combine regulation and enforcement with education and stewardship opportunities are necessary to ensure Florida’s springs remain healthy and available for public use and enjoyment.
Access to Florida’s waters faces increased pressure from shoreline development as populations continue to rise. A combined effort by federal, state, and local governments is needed to ensure funding for acquisition of land to provide public recreational access to waters. While the regional analysis of demand and need in this plan is not intended to identify local needs, it is certain that needs remain in the areas of developing additional boat ramps, canoe launches, docks, catwalks and piers, as well as support facilities such as parking areas and restrooms.
Protecting water resources is a central theme in the America’s Great Outdoors initiative. This nationwide initiative strives to connect Americans to the outdoors, with a focus on grassroots and community level conservation and restoration efforts. America’s Great Outdoors has identified water resources as
Florida has 1,350 miles of coastline, 12,650 miles of rivers and streams,
and 7,700 lakes within its boundaries.- Florida Department of Environmental ProtectionQu
ick F
act
Honeymoon Island State Park, credit Kristin Crawford
Suwannee River State Park
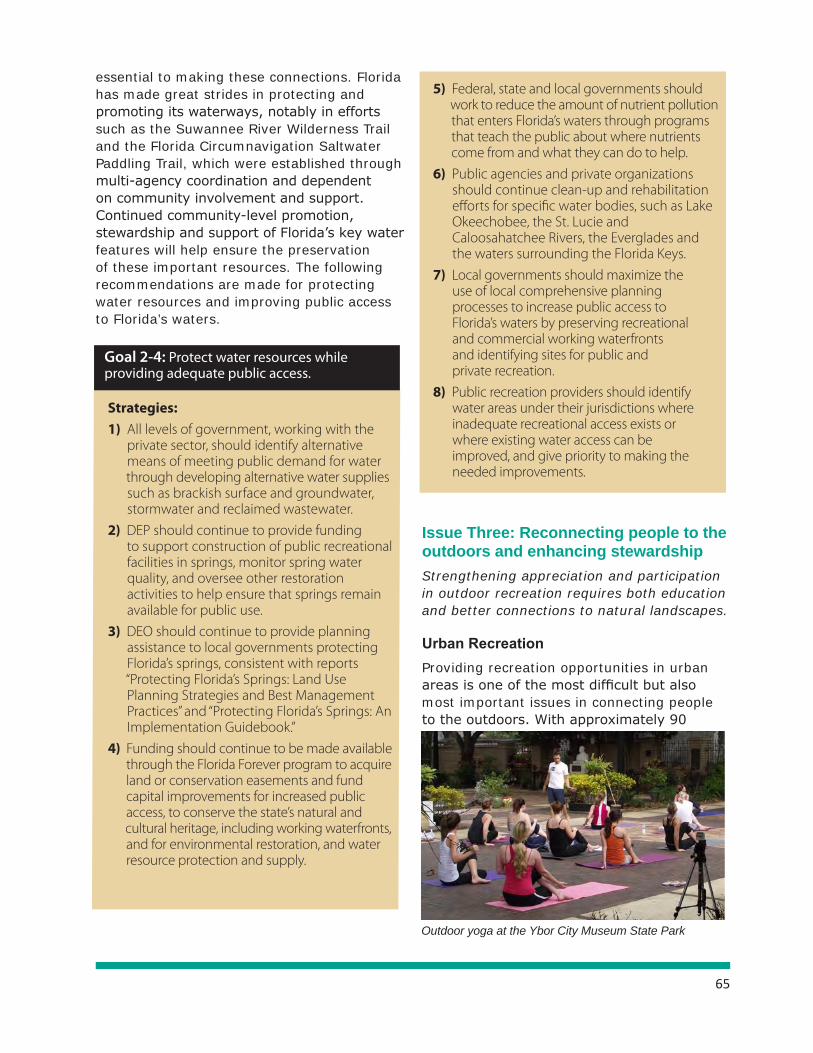
65
essential to making these connections. Florida has made great strides in protecting and promoting its waterways, notably in efforts such as the Suwannee River Wilderness Trail and the Florida Circumnavigation Saltwater Paddling Trail, which were established through multi-agency coordination and dependent on community involvement and support. Continued community-level promotion, stewardship and support of Florida’s key water features will help ensure the preservation of these important resources. The following recommendations are made for protecting water resources and improving public access to Florida’s waters.
Issue Three: Reconnecting people to the outdoors and enhancing stewardshipStrengthening appreciation and participation in outdoor recreation requires both education and better connections to natural landscapes.
Urban RecreationProviding recreation opportunities in urban areas is one of the most difficult but also most important issues in connecting people to the outdoors. With approximately 90
5) Federal, state and local governments should work to reduce the amount of nutrient pollution that enters Florida’s waters through programs that teach the public about where nutrients come from and what they can do to help.
6) Public agencies and private organizations should continue clean-up and rehabilitation efforts for specific water bodies, such as Lake Okeechobee, the St. Lucie and Caloosahatchee Rivers, the Everglades and the waters surrounding the Florida Keys.
7) Local governments should maximize the use of local comprehensive planning processes to increase public access to Florida’s waters by preserving recreational and commercial working waterfronts and identifying sites for public and private recreation.
8) Public recreation providers should identify water areas under their jurisdictions where inadequate recreational access exists or where existing water access can be improved, and give priority to making the needed improvements.
Strategies:1) All levels of government, working with the private sector, should identify alternative means of meeting public demand for water through developing alternative water supplies such as brackish surface and groundwater, stormwater and reclaimed wastewater.
2) DEP should continue to provide funding to support construction of public recreational facilities in springs, monitor spring water quality, and oversee other restoration activities to help ensure that springs remain available for public use.
3) DEO should continue to provide planning assistance to local governments protecting Florida’s springs, consistent with reports “Protecting Florida’s Springs: Land Use Planning Strategies and Best Management Practices” and “Protecting Florida’s Springs: An Implementation Guidebook.”
4) Funding should continue to be made available through the Florida Forever program to acquire land or conservation easements and fund capital improvements for increased public access, to conserve the state’s natural and cultural heritage, including working waterfronts, and for environmental restoration, and water resource protection and supply.
Goal 2-4: Protect water resources while providing adequate public access.
Outdoor yoga at the Ybor City Museum State Park
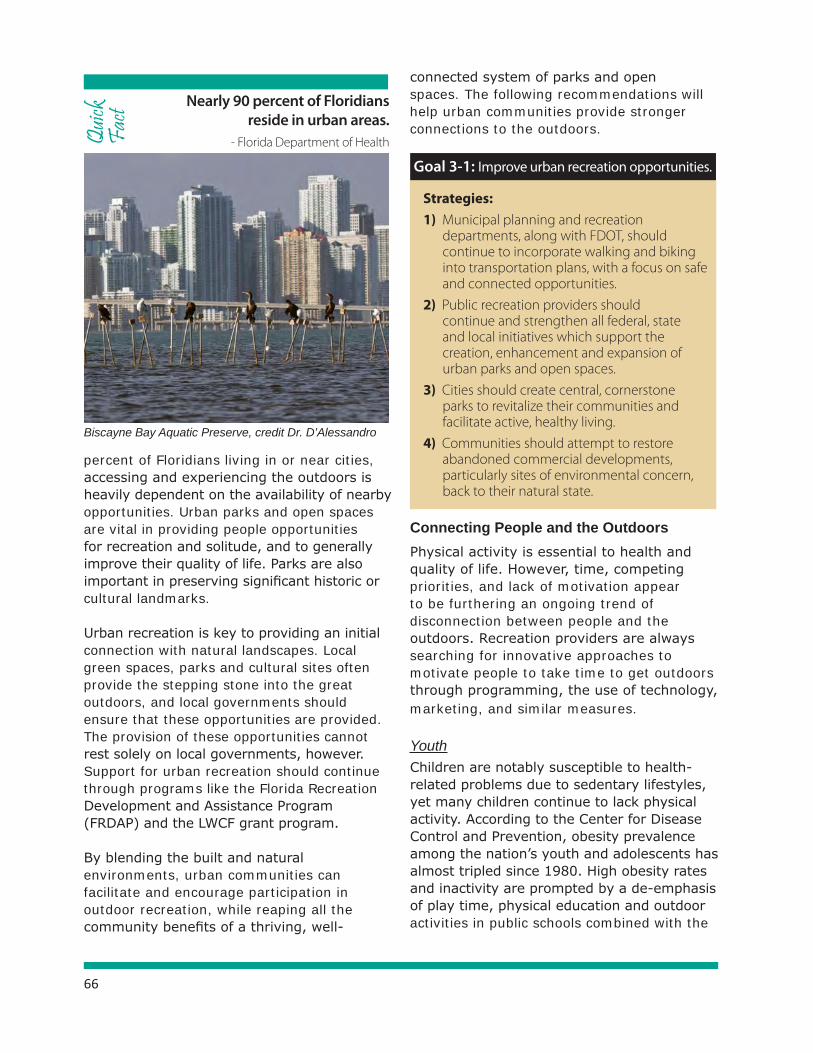
66
percent of Floridians living in or near cities, accessing and experiencing the outdoors is heavily dependent on the availability of nearby opportunities. Urban parks and open spaces are vital in providing people opportunities for recreation and solitude, and to generally improve their quality of life. Parks are also important in preserving significant historic or cultural landmarks.
Urban recreation is key to providing an initial connection with natural landscapes. Local green spaces, parks and cultural sites often provide the stepping stone into the great outdoors, and local governments should ensure that these opportunities are provided. The provision of these opportunities cannot rest solely on local governments, however. Support for urban recreation should continue through programs like the Florida Recreation Development and Assistance Program (FRDAP) and the LWCF grant program.
By blending the built and natural environments, urban communities can facilitate and encourage participation in outdoor recreation, while reaping all the community benefits of a thriving, well-
connected system of parks and open spaces. The following recommendations will help urban communities provide stronger connections to the outdoors.
Connecting People and the OutdoorsPhysical activity is essential to health and quality of life. However, time, competing priorities, and lack of motivation appear to be furthering an ongoing trend of disconnection between people and the outdoors. Recreation providers are always searching for innovative approaches to motivate people to take time to get outdoors through programming, the use of technology, marketing, and similar measures.
YouthChildren are notably susceptible to health-related problems due to sedentary lifestyles, yet many children continue to lack physical activity. According to the Center for Disease Control and Prevention, obesity prevalence among the nation’s youth and adolescents has almost tripled since 1980. High obesity rates and inactivity are prompted by a de-emphasis of play time, physical education and outdoor activities in public schools combined with the
Nearly 90 percent of Floridians reside in urban areas.
- Florida Department of HealthQuick
Fa
ct
Biscayne Bay Aquatic Preserve, credit Dr. D’Alessandro
Strategies:1) Municipal planning and recreation departments, along with FDOT, should continue to incorporate walking and biking into transportation plans, with a focus on safe and connected opportunities.
2) Public recreation providers should continue and strengthen all federal, state and local initiatives which support the creation, enhancement and expansion of urban parks and open spaces.
3) Cities should create central, cornerstone parks to revitalize their communities and facilitate active, healthy living.
4) Communities should attempt to restore abandoned commercial developments, particularly sites of environmental concern, back to their natural state.
Goal 3-1: Improve urban recreation opportunities.

67
popularity of extra curricular activities such as playing video games, watching television and using home computers. Offering programs which reach youth both through schools and outside of school is essential to creating and strengthening ties to the outdoors.
Environmental EducationEnvironmental education increases public awareness and knowledge about environmental issues and provides the participants in its programs the skills necessary to make informed environmental decisions and to take responsible actions. It involves lifelong learning; its audiences are of all age groups, from very young children through senior citizens. National trends associated with environmental education including climate change, invasive species and sea level rise, are factors that will affect outdoor recreation and thus are trends for the public to be aware of. One of the best ways to connect children to the outdoors is through education-based environmental programs, particularly through the school system. However, budget constraints and a shift in focus have eliminated many programs which once provided children with outlets to structured and unstructured time outdoors. Budgets for field trips are almost non-existent in many cases, and both school boards and
public recreation agencies must determine new ways to connect children to the outdoors and promote active, outdoor lifestyles. Federal environmental education initiatives include the “More Kids in the Woods” program through the U.S. Forest Service, the “Let’s Go Outside” program through the U.S. Fish and Wildlife Service, the National Park Services Jr. Ranger and Teacher-Ranger-Teacher program, and the Hands-on-the-Land Network, which seeks to coordinate education on public lands. Statewide environmental education initiatives include the Department of Environmental Protection’s Learning in Florida’s Environment (LIFE) program, the Florida Fish and Wildlife Conservation Commission’s Florida Youth Conservation Centers Network, the Get Outdoors Florida! Coalition, and 4-H programs. Various private and non-profit programs also exist around the state.
The Department of Environmental Protection’s Learning in Florida’s Environment (LIFE) program is an excellent example of partnering nearby natural resources with local schools to integrate environmental education into everyday learning. The LIFE program strives to reach a more diverse audience by engaging youth through their schools and connecting outdoor recreation with learning to build stewardship for the resource. Once DEP grants expire, programs at these sites continue though alternative funding sources such as private sponsorships, other grants or funding from local school boards. Service Learning is a component of the program, where students can participate in activities
Sixty minutes of daily unstructured free play is essential to children’s
physical and mental health.
- American Academy of PediatricsQuick
Fac
t
At play on Dr. Julian G. Bruce St. George Island State Park
Enjoying the Wacissa River, credit FWC
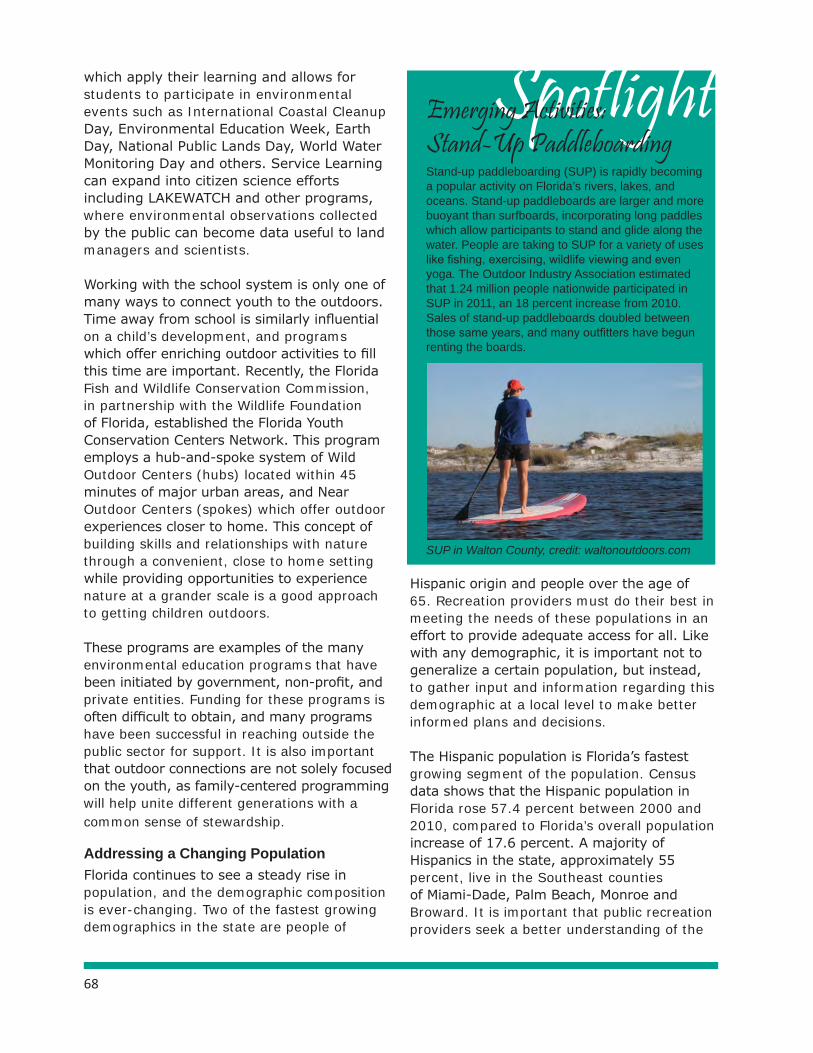
68
which apply their learning and allows for students to participate in environmental events such as International Coastal Cleanup Day, Environmental Education Week, Earth Day, National Public Lands Day, World Water Monitoring Day and others. Service Learning can expand into citizen science efforts including LAKEWATCH and other programs, where environmental observations collected by the public can become data useful to land managers and scientists.
Working with the school system is only one of many ways to connect youth to the outdoors. Time away from school is similarly influential on a child’s development, and programs which offer enriching outdoor activities to fill this time are important. Recently, the Florida Fish and Wildlife Conservation Commission, in partnership with the Wildlife Foundation of Florida, established the Florida Youth Conservation Centers Network. This program employs a hub-and-spoke system of Wild Outdoor Centers (hubs) located within 45 minutes of major urban areas, and Near Outdoor Centers (spokes) which offer outdoor experiences closer to home. This concept of building skills and relationships with nature through a convenient, close to home setting while providing opportunities to experience nature at a grander scale is a good approach to getting children outdoors.
These programs are examples of the many environmental education programs that have been initiated by government, non-profit, and private entities. Funding for these programs is often difficult to obtain, and many programs have been successful in reaching outside the public sector for support. It is also important that outdoor connections are not solely focused on the youth, as family-centered programming will help unite different generations with a common sense of stewardship.
Addressing a Changing PopulationFlorida continues to see a steady rise in population, and the demographic composition is ever-changing. Two of the fastest growing demographics in the state are people of
Hispanic origin and people over the age of 65. Recreation providers must do their best in meeting the needs of these populations in an effort to provide adequate access for all. Like with any demographic, it is important not to generalize a certain population, but instead, to gather input and information regarding this demographic at a local level to make better informed plans and decisions.
The Hispanic population is Florida’s fastest growing segment of the population. Census data shows that the Hispanic population in Florida rose 57.4 percent between 2000 and 2010, compared to Florida’s overall population increase of 17.6 percent. A majority of Hispanics in the state, approximately 55 percent, live in the Southeast counties of Miami-Dade, Palm Beach, Monroe and Broward. It is important that public recreation providers seek a better understanding of the
SpotlightEmerging Activities:Stand-Up PaddleboardingStand-up paddleboarding (SUP) is rapidly becoming a popular activity on Florida’s rivers, lakes, and oceans. Stand-up paddleboards are larger and more buoyant than surfboards, incorporating long paddles which allow participants to stand and glide along the water. People are taking to SUP for a variety of uses like fishing, exercising, wildlife viewing and even yoga. The Outdoor Industry Association estimated that 1.24 million people nationwide participated in SUP in 2011, an 18 percent increase from 2010. Sales of stand-up paddleboards doubled between those same years, and many outfitters have begun renting the boards.
SUP in Walton County, credit: waltonoutdoors.com
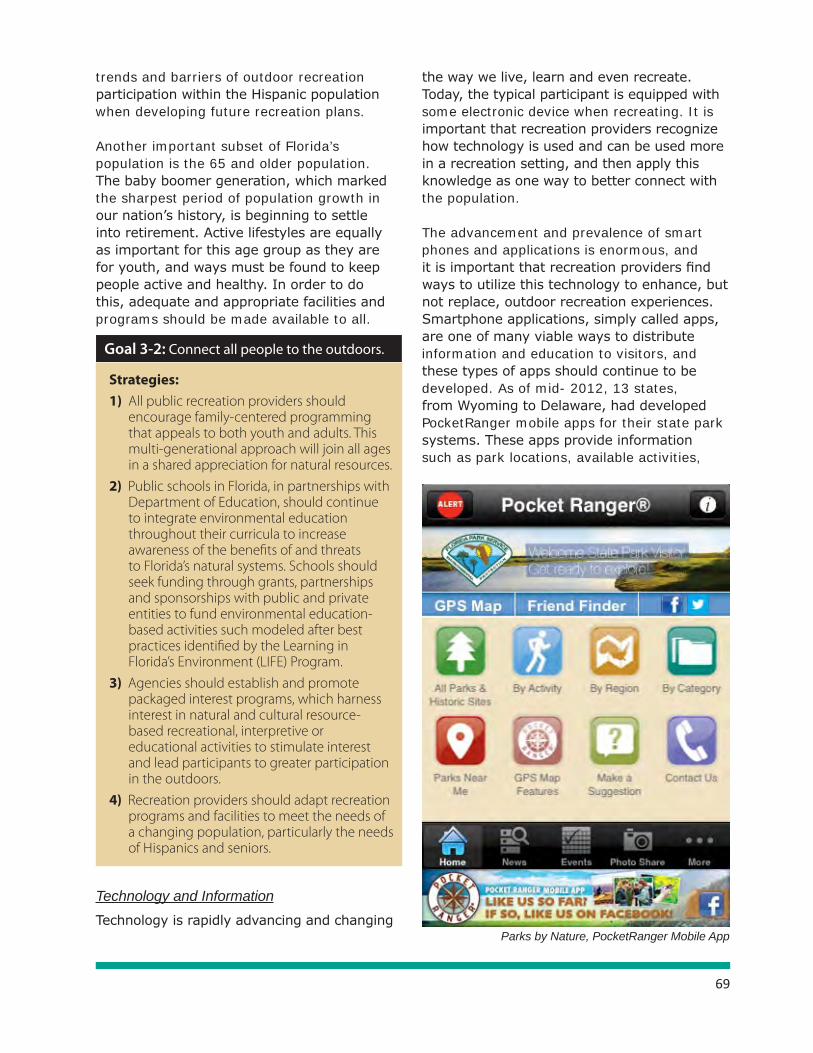
69
trends and barriers of outdoor recreation participation within the Hispanic population when developing future recreation plans.
Another important subset of Florida’s population is the 65 and older population. The baby boomer generation, which marked the sharpest period of population growth in our nation’s history, is beginning to settle into retirement. Active lifestyles are equally as important for this age group as they are for youth, and ways must be found to keep people active and healthy. In order to do this, adequate and appropriate facilities and programs should be made available to all.
Technology and InformationTechnology is rapidly advancing and changing
the way we live, learn and even recreate. Today, the typical participant is equipped with some electronic device when recreating. It is important that recreation providers recognize how technology is used and can be used more in a recreation setting, and then apply this knowledge as one way to better connect with the population.
The advancement and prevalence of smart phones and applications is enormous, and it is important that recreation providers find ways to utilize this technology to enhance, but not replace, outdoor recreation experiences. Smartphone applications, simply called apps, are one of many viable ways to distribute information and education to visitors, and these types of apps should continue to be developed. As of mid- 2012, 13 states, from Wyoming to Delaware, had developed PocketRanger mobile apps for their state park systems. These apps provide information such as park locations, available activities,
Parks by Nature, PocketRanger Mobile App
Strategies:1) All public recreation providers should encourage family-centered programming that appeals to both youth and adults. This multi-generational approach will join all ages in a shared appreciation for natural resources.
2) Public schools in Florida, in partnerships with Department of Education, should continue to integrate environmental education throughout their curricula to increase awareness of the benefits of and threats to Florida’s natural systems. Schools should seek funding through grants, partnerships and sponsorships with public and private entities to fund environmental education- based activities such modeled after best practices identified by the Learning in Florida’s Environment (LIFE) Program.
3) Agencies should establish and promote packaged interest programs, which harness interest in natural and cultural resource- based recreational, interpretive or educational activities to stimulate interest and lead participants to greater participation in the outdoors.
4) Recreation providers should adapt recreation programs and facilities to meet the needs of a changing population, particularly the needs of Hispanics and seniors.
Goal 3-2: Connect all people to the outdoors.

70
and wildlife education and are very beneficial in providing quick, accessible information. Technology like this is especially beneficial in connecting with the younger generation.
Following a recommendation from the 2008 SCORP, the Division of Recreation and Parks developed one-stop, comprehensive website for all recreation opportunities in Florida. The site provides an interactive map which features all recreation opportunities entered into the Florida Outdoor Recreation Inventory. The map can be searched by activity, location or agency. Continual development of the site to make it more user friendly, along with the contribution of timely and accurate updates from recreation providers, will make this tool even more beneficial to both the public and recreation planners. The following recommendations are proposed to help ensure recreation providers continue to incorporate technology into facilitating participation.
Stewardship and AdvocacyParticipation in outdoor recreation and enjoyment of natural resources is only one link in fully connecting people to the outdoors. A strong sense of stewardship, volunteerism and advocacy for recreation opportunities and
conservation brings the participant full circle as they not only enjoy the resources, but help preserve them for future generations. User groups, non-profit organizations and citizen support organizations are some of the strongest advocates for recreation and conservation, and given appropriate tools and education, can provide tremendous help in securing support and resources.Volunteerism is another outstanding resource for public programs, as volunteer programs help improve natural areas while connecting people with the resources, and providing a significant financial boost to recreation programs. For example, in Fiscal Year (FY) 2011-2012, 1.4 million volunteer hours, equivalent to 625 full time employees, contributed an effort valued at $27.8 million to the Division of Recreation and Parks. Volunteers for the Florida Forest Service contributed 58,400 hours in FY 2011-12. By providing meaningful and enjoyable experiences, recreation providers can gather and retain volunteers, an incredible resource during tough economic times.
Strategies:1) DEP should continue to develop and enhance the Florida Outdoor Recreation Inventory website centralizing comprehensive information about outdoor recreation opportunities in Florida.
2) Recreation providers should continue to incorporate technological advancements as means to facilitate and encourage outdoor recreation participation, such as smartphone applications and interactive maps online.
3) Recreation providers should offer technology-driven programs and events, blending technology with traditional outdoor recreation activities.
Goal 3-3: Facilitate participation in outdoor recreation through easily-accessible information and technological advancements.
Strategies:1) All park and recreation agencies should maximize the use of volunteers and citizen- based support organizations to supplement their existing resources and personnel. Agencies should develop new, innovative and enjoyable volunteer opportunities that engage all generations and retain volunteers for future projects.
2) Agencies should coordinate the distribution of information regarding volunteer opportunities to potential volunteer groups.
3) Recreation providers should work with organizations such as FRPA, the Trust for Public Land, and other recreation groups and businesses to educate the public about the benefits of volunteerism on public lands and encourage expanded opportunities for the public to participate in volunteer programs.
Goal 3-4: Encourage volunteers, stewardship, and advocacy.

Appendices
Outdoor Recreation in Florida 2013A Comprehensive Program for Meeting Florida’s Outdoor Recreation Needs

Table of Contents
A. Terms and Definitions ................................................................................................... A-1B. Acronyms ...................................................................................................................... B-1C. Florida Recreational Trail Opportunities Maps .............................................................. C-1D. Open Project Selection Process ................................................................................... D-1E. Response Management Methodology & Survey .......................................................... E-1F. Online Questionnaires ................................................................................................... F-1G. Outdoor Recreation Participation by Activity .................................................................. G-1H. Level of Service Charts and Activity Profiles ................................................................ H-1I. Supply Charts by Agency ................................................................................................ I-1J. Assessment and Protection of Wetlands ........................................................................ J-1

A-1
Appendix A - Terms and Definitions
ARCHAEOLOGICAL RESOURCES - The physical evidence or remains of known historic or prehistoric human life, activity or culture. Significant ruins, artifacts, inscriptions, structural and/or human remains may be considered archaeological resources.
BEACH - The zone of unconsolidated material that extends landward from the mean low water line to the place where there is marked change in material or physiographic form, or to the line of permanent vegetation, usually the effective limit of storm waves. “Beach,” as used in the coastal management element requirements is limited to oceanic and estuarine shorelines.
BICYCLE AND PEDESTRIAN WAYS - Any road, path or way which is open to bicycle travel and traffic afoot and from which motor vehicles are excluded.
BUFFER AREA - An area or space separating an outdoor recreation area from influences which would tend to depreciate essential recreational values of the outdoor recreation area. Especially needed in cases such as wilderness areas where the values involved are fragile or volatile or where the outside influences are of a particularly harsh and incompatible nature, as in urban or industrial areas, or along a busy highway.
CARRYING CAPACITY - The amount of outdoor recreation which a given outdoor recreation area, resource or facility can actually accommodate or provide at any given time under existing conditions.
COMMUNITY PARK - A park located near major roadways and designed to serve the needs of more than one neighborhood.
COMPATIBLE OUTDOOR RECREATION ACTIVITIES - Outdoor recreational activities conducted on the same resource base without interfering with each other and which are not harmful to the environment.
COMPREHENSIVE PLAN - Plan that meets the requirements of Section. 163.3177 and 163.3178, F.S., and thus contains the guidelines, principles and standards for the orderly, coordinated and balanced future economic, social, physical, environmental and fiscal development of the area.
CONCURRENCY - The necessary public facilities and services to maintain the adopted level of service standards are available when the impacts of development occur.
CONSERVATION AND RECREATION LANDS (CARL) - Land acquisition program administered by the Florida Department of Environmental Protection (DEP) to acquire property from willing property owners to protect environmentally endangered lands for state parks, forest, wildlife management areas, beaches and recreation areas which are sensitive due to the presence of unique or rare habitats, endangered or threatened species, or unique historical, archaeological or geological features.
CONSERVATION USES - Activities or conditions within land areas designated for the purpose of conserving or protecting natural resources or environmental quality, including areas designated for flood control and floodplain management, and the protection of quality or quantity of ground or surface water, commercial or recreational fish and shellfish habitat, or vegetative communities or wildlife habitats.

A-2
CULTURAL RESOURCES - Archaeological and historical sites and properties. The significance of these resources is derived not only from individual artifacts but also from the spatial arrangement of the artifacts in both horizontal and vertical planes.
DEMAND - See “OUTDOOR RECREATION DEMAND.”
DENSITY - An objective measurement of the number of people or residential units allowed per unit of land, such as residents or employees per acre.
DEVELOPMENT - The act of physically altering an area, site or resource to increase its ability or capacity to serve outdoor recreation purposes; also a representative result of such improvement. Development usually implies improvement by degrees and pertains primarily to the process of opening up, landscaping, erecting structures and facilities, etc. It is a more comprehensive term than “improvement.”
ECOSYSTEM MANAGEMENT - An integrated approach to the management of Florida’s green infrastructure of native landscapes and communities recognizing the biological, physical and chemical elements of discrete environments conducted through the use of tools such as planning, land acquisition, environmental education, regulation and pollution prevention designed to maintain, protect and improve the state’s natural managed and human communities.
ECOTOURISM - Tourism based principally upon natural and archaeological/historical resources that involves traveling to relatively undisturbed or uncontaminated natural areas with the specific object of admiring, studying and enjoying the scenery and its wild plants and animals, as well as any existing cultural features (both past and present) found in these areas.
EXTENSIVE USE - (As contrasted with “intensive use.”) Use of an outdoor recreation area for outdoor recreation activities which require a relatively high “land/man” ratio or large amount of resource per user served, e.g. hunting, wilderness camping, etc.
FLORIDA GREENWAYS AND TRAILS SYSTEM - Statewide system proposed to link natural areas, open spaces and trails in Florida, consisting of large or medium-sized hubs, smaller sites and extensive to small connective landscape features.
FLORIDA SCENIC HIGHWAY - Any public road on the State Highway System that is designated by the Department of Transportation pursuant to Section 335.093, F.S.
FUNDING ASSISTANCE - The awarding of funds for assistance in financing the acquisition and development of an outdoor recreation project.
COST SHARING - The awarding of funds for financial assistance in the acquisition and development of an outdoor recreation project which is matched in varying amounts by the project’s sponsor.
MATCHING BASIS - The awarding of funds for financial assistance in the acquisition and development of an outdoor recreation project which is matched equally by the project’s sponsor.
GREENWAY - A linear open space established along either a natural corridor, such as a riverfront, stream valley or ridgeline, or over land along a railroad right-of-way converted to recreational use, a canal, a scenic road or other route; any natural or landscaped course for pedestrian or bicycle passage; an open space connector linking parks, nature reserves, cultural features or historic sites with each other and populated areas; or a local strip or linear park designated as a parkway or greenbelt.

A-3
HABITAT FRAGMENTATION - Human activity such as agriculture, road building and suburb and city development, resulting in the creation of small isolated areas that are poorly suited to maintaining ecological function and support smaller populations of remaining species. Two components of habitat fragmentation which may result in extinction include the reduction in total habitat area, resulting in reduction in population sizes and redistribution of the remaining area into distinct fragments, affecting dispersal and immigration rates.
HISTORIC RESOURCES - All areas, districts or sites containing properties listed on the Florida Master Site File, the National Register of Historic Places or designated by a local government as historically, architecturally or archaeologically significant.
INFRASTRUCTURE - Man-made structures which serve the common needs of the population, such as sewage disposal systems, potable water systems, potable water wells serving a system, solid waste disposal sites or retention areas, stormwater systems, utilities, piers, docks, wharves, breakwaters, bulkheads, seawalls, bulwarks, revetments, causeways, marinas, navigation channels, bridges or roadways.
INTENSITY - An objective measurement of the extent to which land may be developed or used, including the consumption or use of the space above, on or below ground, the measurement of the use of or demand on natural resources, and the measurement of the use of or demand on facilities and services.
INTENSIVE USE - (As contrasted with “extensive use.”) Use of an outdoor recreation area for outdoor recreation activities which requires a relatively low “land/man” ratio or small amount of resource per user served, e.g. swimming, picnicking, sightseeing, etc.
LAND ACQUISITION - Obtaining land and related resources for public outdoor recreation by various means.
LAND PURCHASE - The acquisition of land and related resources in which title to the property is obtained by transaction involving payment to the grantor.
LANDSCAPE ECOLOGY - The study of native landscape structure, function and change at the scale of entire landscapes, as well as the application of the results to the design and management of both natural and human-dominated areas.
LEVEL OF SERVICE - An indicator of the extent or degree of service provided by, or proposed to be provided by, a facility based on and related to the operational characteristics of the facility. Level of service shall indicate the capacity per unit of demand for each public facility.
MANAGEMENT AREA - An area devoted to specialized management for either game (wildlife management area) or sport fish (fish management area) and declared to be such by the Florida Fish and Wildlife Conservation Commission.
MARINE WETLANDS - Areas with a water regime determined primarily by tides and the dominant vegetation is salt tolerant plant species.
MITIGATION BANKING - Preserving, restoring or enhancing wetland areas for the purpose of setting them aside to compensate for future conversions of wetlands for development activities. A wetland bank may be created when a government agency, corporation or nonprofit organization undertakes such activities under a formal agreement with a regulatory agency. The value of a bank is determined by quantifying the wetland values restored or created in terms of “credits.”

A-4
MULTI-PURPOSE OUTDOOR RECREATION FACILITY - (As contrasted to a “single purpose facility.”) An outdoor recreation facility which is designed for more than one activity use, e.g. athletic field or racquetball/handball court.
MULTIPLE USE - A land management objective seeking to coordinate several environmental, recreational, economic, historic, cultural and/or social values in the same geographic area in a compatible and sustainable manner.
NEIGHBORHOOD PARK - A park which serves the population of a neighborhood and is generally accessible by bicycle or pedestrian walkways.
OPEN SPACE - Undeveloped lands suitable for some types of recreation activities or conservation uses.
OUTDOOR RECREATION - The pursuit of leisure-time activities which occur in an outdoor setting. For clarification on types of outdoor recreation, see “resource-based outdoor recreation” and “user-oriented outdoor recreation.”
OUTDOOR RECREATION ACTIVITY - A specific, individual type of outdoor recreation. Activities are divided into two categories: active activities are those which involve some direct and specialized physical manipulation by the participant such as swimming, hiking, boating, etc. and passive activities are those which are more mental than physical, such as sightseeing, nature study, scenic appreciation, etc.
OUTDOOR RECREATION AREA - Generally, any expanse of real estate, of no particular size, used for outdoor recreation. Used in the plural it is all-inclusive, although in specific usage it would be contrasted with an “outdoor recreation site” by being larger and broader in purpose.
OUTDOOR RECREATION DEMAND - The quantity of outdoor recreation necessary to satisfy all prospective participants during any given time period. Demand is not strictly a matter of desire, but rather of desire tempered by such limiting factors as opportunity, awareness, financial ability, physical ability, and competing uses of available time.
OUTDOOR RECREATION FACILITIES - Those improvements or artificially installed accessories which facilitate the use of an area or a resource for outdoor recreation. Facilities are divided into two categories, primary facilities are those that are essential or extremely desirable for conducting a particular outdoor recreation activity, such as launching ramps for boating, trails for cycling, roads for access to areas, etc. and secondary facilities are those that are desirable as a further enhancement of the recreational experience but are still dispensable, such as outdoor grills for picnicking and camping, docks for boating, etc.
OUTDOOR RECREATION INVENTORY - The sum of all public and private outdoor recreation areas, resources and facilities making up a complete outdoor recreation system. Also, the process of assembling and cataloging information on such a system. OUTDOOR RECREATION NEED - The amount by which outdoor recreation demand exceeds available outdoor recreation supply in a given area. Used in the plural, “needs” usually refers to the actual resources and facilities which comprise “need.”
OUTDOOR RECREATION OPPORTUNITY - The availability of a preferred type of outdoor recreation to a potential user or participant. Used in a collective sense, it refers to the total amount of potential outdoor recreation available at any given time.
OUTDOOR RECREATION PLAN - An overall framework for the planning and provision of
A-5
balanced outdoor recreation opportunities for potential and actual users.
OUTDOOR RECREATION PROGRAM - An ongoing series of related and coordinated efforts designed to further a common outdoor recreation purpose.
OUTDOOR RECREATION RESOURCE AND FACILITY REQUIREMENTS - The total amount of actual outdoor recreation resources and facilities necessary to supply a specified amount of outdoor recreation demand at a given time.
OUTDOOR RECREATION RESOURCE AND FACILITY GUIDELINE - Hypothetical measures of outdoor recreation opportunities expressed as park, resource or facility units which are intended to represent conditions of use and optimum levels of supply for the individual user, a given population of residents or a specific service area within a city or county.
USE GUIDELINE (OR USE STANDARD) - A hypothetical measure of use conditions for outdoor recreation resources and facilities, e.g. the number of hikers per unit of trail, the number of bathers per unit of beach, etc. Use guidelines are used to translate outdoor recreation supply (expressed in physical units of measure) into outdoor recreation demand (expressed in user-occasions).
POPULATION GUIDELINE - An optimum ratio of a given quantity of resources and facilities to a hypothetical number of people, e.g. one tennis court per 2,000 population. Population guidelines are provided for both resource-based and user-oriented activities and are used primarily by local government and private development agencies.
SITE GUIDELINE - An estimate of local park and recreation area acreage proposed for serving various specific service areas or particular populations residing within a given radius, e.g. two acres of neighborhood park per 1,000 population, serving not more than 5,000 people and a population residing within 1/4 to 1/2 mile of the park.
OUTDOOR RECREATION RESOURCES - Those natural resources used for the support of outdoor recreation, such as land, water, wildlife, natural scenery, etc. A special case is made where historical and archaeological remains are concerned. Although not natural resources, they are included because of their limited, non-renewable character.
OUTDOOR RECREATION SITE - An outdoor recreation area of relatively small size.
OUTDOOR RECREATION SUPPLIER - An agency, organization, group or individual, either public or private, with a broad area of responsibility for providing public outdoor recreation, distinguished on the basis of both the nature of the supplier and the nature of the outdoor recreation supplied. Six categories of outdoor recreation suppliers have been defined: federal and state government, county and municipal government, private commercial enterprise, private non-profit, private club and private un-inventoried.
OUTDOOR RECREATION SUPPLY - The total amount of potential outdoor recreation afforded at any given time by an outdoor recreation system.
OUTDOOR RECREATION SUPPLY CAPACITY - The amount of outdoor recreation which a given outdoor recreation area, resource, facility or site can accommodate or provide at any given time under a specified measure of use conditions.
OUTDOOR RECREATION SUPPLY POTENTIAL - The amount of potential outdoor recreation afforded in the future by any outdoor recreation system.

A-6
OUTDOOR RECREATION SYSTEM - A purposeful assemblage of physical units or elements made up of recreation areas, resources and facilities designed to meet the demands of a given segment of the public.
OUTDOOR RECREATION USE - The involvement of outdoor recreation areas, resources or facilities in the purpose for which they were intended.
OUTDOOR RECREATION USER - One who uses outdoor recreation areas, resources or facilities.
PARTICIPANT ACTIVITIES - Those outdoor recreation activities which involve direct participation, either active (as in the case of swimming) or passive (as in the case of nature study), by the individual. See “spectator activities.”
PARTICIPANTS-PER-FACILITY RATIO - A need methodology that compares the number of one time activity users per unit of supply.
PER CAPITA PARTICIPATION RATE - The rate at which a person participates in a particular outdoor recreation activity, expressed in number of times per year.
PLAYGROUND - A recreation area with play apparatus.
PRIORITY - The ranking or order of precedence assigned to each project or need to establish its place with respect to all others under consideration at any given time.
PRIVATE RECREATION SITES - Sites owned by private, commercial or non-profit entities available to the public for purposes of recreational use.
PROJECTION - An extrapolation or extension of known data to derive comparable working data for selected target dates.
PUBLIC ACCESS - The ability of the public to physically reach, enter or use recreation sites including beaches and shores.
PUBLIC LANDS - Any lands in the state which are owned by, leased by or otherwise assigned to the state or any of its agencies and which are used by the general public for recreational purposes.
PUBLIC RECREATION SITES - Sites owned or leased on a long-term basis by a federal, state, regional or local government agency for purposes of recreational use.
RECREATION - The infinite variety of activities which people elect to occupy their leisure time and satisfy their need for diversion.
REGIONAL PARK - A park which is designed to serve two or more communities.
RESOURCE-BASED OUTDOOR RECREATION - Types of outdoor recreation activities dependent on natural and cultural resources, contrasted with “user-oriented” outdoor recreation. For this plan, activities include saltwater beach activities, bicycle riding, boating, camping, fishing, hiking, horseback riding, hunting, nature study, off-highway vehicle riding, picnicking, freshwater swimming and visiting archaeological and historical sites.
RESOURCE/FACILITY REQUIREMENTS - The total amount of outdoor recreation resources/facilities necessary to accommodate the total outdoor recreation demand at any given time.

A-7
RESOURCE TYPE - A class of outdoor recreation resource which can be specifically identified, such as a freshwater lake, an ocean beach, a hardwood forest, etc.
RURAL AREAS - Low density areas characterized by social, economic and institutional activities which may be largely based on agricultural uses or the extraction of natural resources in unprocessed form, or areas containing large proportions of undeveloped, unimproved or low density property.
SERVICE AREA - The surrounding land area from which an outdoor recreation resource, area, site or facility draws its participants.
SHORELINE OR SHORE - The interface of land and water, as used in the coastal management element requirements, and is limited to oceanic and estuarine interfaces.
SINGLE-PURPOSE FACILITY - (As contrasted to “multi-purpose.”) A specialized type of outdoor recreation facility which is designed for one recreational activity, e.g. tennis court.
SPECTATOR ACTIVITIES - Those outdoor recreation activities which are carried on primarily for the visual benefit of others rather than for the direct enjoyment of the active participants, such as stadium sports, horse races, etc.
STAKEHOLDER - Group or individual who can affect, or is affected by, the achievement of the organization or program’s mission. Examples include managers, employees, policy makers, suppliers, vendors, citizens and community groups.
STEWARDSHIP - Sense of responsibility for, desire to participate in, or taking charge of the protection and management of land and water resources.
SUITABILITY - The degree to which the existing characteristics and limitations of land and water are compatible with a proposed use or development.
SYSTEMS PLANNING - The process of assessing the park, recreation, open space and greenway facility needs of a community and translating that information into a framework for meeting the physical, spatial and facility requirements to satisfy those needs.
OUTDOOR RECREATION USE - The involvement of outdoor recreation areas, resources or facilities in the purpose for which they were intended.
PUBLIC RECREATION SITES - Sites owned or leased on a long-term basis by a federal, state, regional or local government agency for purposes of recreational use.
TRAIL - Linear corridor and any adjacent support parcels on land or water providing public access for recreation or authorized alternative modes of transportation.
Trail Types:
HIKING - Path used solely for backpacking or long distance hiking. BICYCLE - Designated trail or system of trails used primarily for bicycling. INTERPRETATIVE/NATURE - Trail designed or marked for nature interpretation and study. HORSEBACK - Improved or unimproved trail designated and used primarily for horseback riding. CANOE AND KAYAK- Distance along most commonly used route on a designated or undesignated waterway used for canoeing.

A-8
EXERCISE/PARCOURSE - Course designed generally for jogging, but which may or may not have exercise stations. MULTIPURPOSE, MULTI-USE OR SHARED - Trail used for more than one of the above activities.
URBAN AREA - An area of, or for development, characterized by social, economic and institutional activities which are predominantly based on the manufacture, production, distribution or provision of goods and services in a setting which typically includes residential and nonresidential development uses other than those which are characteristic of rural areas.
URBAN SPRAWL - Urban development or uses which are located in predominantly rural areas, or rural areas interspersed with generally low-intensity or low-density urban uses, and which are characterized by one or more of the following conditions: (a) The premature or poorly planned conversion of rural land to other uses; (b) The creation of areas of urban development or uses which are not functionally related to land uses which predominate the adjacent area; or (c) The creation of areas of urban development or uses which fail to maximize the use of existing public facilities or the use of areas within which public services are currently provided. Urban sprawl is typically manifested in one or more of the following land use or development patterns: Leapfrog or scattered development; ribbon or strip commercial or other development; or large expanses of predominantly low-intensity, low-density, or single-use development.
USER-ORIENTED OUTDOOR RECREATION - Types of outdoor recreation that can be placed at the convenience of the user to take advantage of proximity to population centers. For this plan, these activities include golf, tennis, baseball/softball, football/soccer, handball/racquetball, shuffleboard, basketball, volleyball and outdoor pool swimming. Land areas for space is usually the only consideration dealing with the natural resource base. Some types of outdoor recreation may be either “user-oriented” or “resource-based” depending on the setting they utilize and the conjunctive values involved, as with the case of swimming, bicycling, picnicking, camping, etc.
USER-PREFERENCE - The exercise of choice of outdoor recreation activities by a potential participant. The total impact of user-preference is the determination of activity distribution in outdoor recreation demand.
USER-SATISFACTION - The measure of the extent to which an outdoor recreation experience satisfies the desires of the participant. Also sometimes referred to as user-enjoyment.
WETLANDS - Areas that are inundated or saturated by surface water or ground water at a frequency and a duration sufficient to support, and [that] under normal circumstances do support, a prevalence of vegetation typically adapted for life in saturated soils. Soils present in wetlands generally are classified as hydric or alluvial, or possess characteristics that are associated with reducing soil conditions. The prevalent vegetation in wetlands generally consists of facultative or obligate hydrophytic macrophytes that are typically adapted to areas having soil conditions described above. Florida wetlands generally include swamps, marshes, bayheads, bogs, cypress domes and strands, sloughs, wet prairies, riverine swamps and marshes, hydric seepage slopes, tidal marshes, mangrove swamps and other similar areas.
WILDERNESS - An undeveloped area of land which has essentially retained its primeval character and influence without permanent alteration.
WILDLIFE - Animals such as birds, fish, insects, mammals, amphibians and reptiles that are living in natural or wild environments. Wildlife does not include animals living in aquariums, zoos and other artificial surroundings, or domestic animals such as pets and livestock.

B-1
CAMA Office of Coastal and Aquatic Managed AreasCARL Conservation and Recreation Lands CERP Comprehensive Everglades Restoration PlanDEO Florida Department of Economic OpportunityDEP Florida Department of Environmental ProtectionDFFM Division of Freshwater Fisheries ManagementDHGM Division of Hunting and Game ManagementDHR Division of Historical ResourcesDLE Division of Law EnforcementDMFM Division of Marine Fisheries ManagementDOS Florida Department of StateDOT Florida Department of TransportationDRP Division of Recreation and ParksDSL Division of State LandsDWRM Division of Water Resource ManagementFCT Florida Communities TrustFDOA Florida Disabled Outdoors AssociationFFS Florida Forest ServiceFGTS Florida Greenways and Trails SystemFHWA Federal Highway Administration FIND Florida Inland Navigation DistrictFRDAP Florida Recreation Development Assistance ProgramFWC Florida Fish and Wildlife Conservation CommissionLATF Land Acquisition Trust FundLIFE Learning in Florida’s EnvironmentLWCF Land and Water Conservation FundNOAA National Oceanic and Atmospheric AdministrationNPS National Park ServiceNWFWMD Northwest Florida Water Management DistrictOGT Office of Greenways and TrailsPAWV Office of Public Access and Wildlife ViewingRTP Recreational Trails ProgramSFWMD South Florida Water Management DistrictSJRWMD St. Johns River Water Management DistrictSRWMD Suwannee River Water Management DistrictSWFWMD Southwest Florida Water Management DistrictUSACE United States Army Corps of EngineersUSDOD United States Department of DefenseUSFS United States Forest ServiceUSFWS United States Fish and Wildlife ServiceUTAP Universal Trail Assessment ProcessWCIND West Coast Inland Navigation District
Appendix B - Acronyms

C-1
The Office of Greenways and Trails oversees the FGTS trail maps which include the following: The Land Trails Opportunity Map represents the existing, planned and conceptual non-motorized trails that form a land-based trail network of state and regional importance. This map is a synthesis of trail planning efforts being conducted by cities, counties, transportation planning organizations, and other agencies and non-profits throughout Florida. This map does not include all existing, proposed and conceptual trails in Florida, but focuses on linear trails of state and regional significance to form a comprehensive connected system of multiple and single-use trails to accommodate uses such as: walking, hiking, bicycling, mountain biking, horseback riding, skating, and wildlife viewing.
The Paddling Trails Opportunity Map represents the vision for a comprehensive water-based trails system, this map includes waterways that are designated as part of the FGTS or are appropriate for future designation. Because water trails are not consistently captured in local and regional planning efforts like land trails typically are, it is important to establish basic criteria for inclusion. Therefore, to be included in the Paddling Trails Opportunity Map, a waterway shall: represent an existing or potential destination trail that reaches beyond the local area due to its scenic qualities and diversity of experiences; be at least three miles in length, preferably longer; and be navigable during the majority of months in an average year.The Priority Trails Map encompasses the most important corridors and connections within the FGTS Land Trails Opportunity Map and Paddling Trails Opportunity Map. To the greatest extent possible, the corridors and connections within the Priority Trails Map:
1) Support and further national, state or regional trail projects, plans and initiatives that encompass multiple counties.
2) Include existing and planned long-distance trails and trail loops that serve as destinations to support nature-based tourism and economic development.
3) Include the State Trails, the Cross Florida Greenway and other major connecting trails of greatest length (five miles or longer).
4) Connect major population centers to provide access for the greatest number of Floridians.
5) Build on past and programmed state and federal investment in trails, particularly when matched by funding from local and private sources.
6) Coincide with transportation, utility and canal corridors that facilitate major connections.
7) Coincide with the Florida Ecological Greenways Network.
8) Connect natural, recreational, cultural and historical sites providing a range of experiences.
9) Provide a safe, accessible and high quality experience for users.
Appendix C - Florida Greenways and Trails System (FGTS) Maps

C-2
PRIORITY TRAILS

C-3
LAND TRAILS OPPORTUNITY MAP
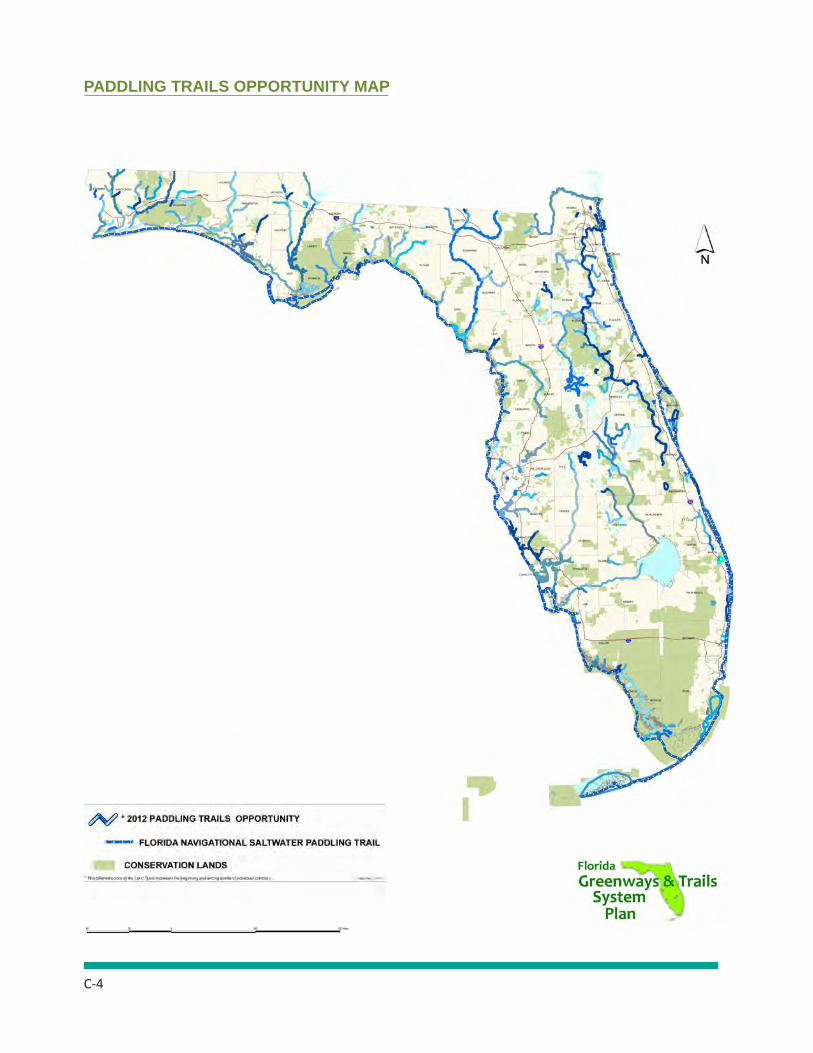
C-4
PADDLING TRAILS OPPORTUNITY MAP
D-1
Grants in aid to local governments in Florida from the federal Land and Water Conservation Fund (LWCF) program must be administered to assure equal opportunity for all eligible applicants and all sectors of the general public to participate in the processes and benefits of the programs. In addition, LWCF grants administration must enable the State to insure that the program is directed toward meeting the priority outdoor recreation needs identified in the state comprehensive outdoor recreation plan. The processes and procedures for the administration of the LWCF in Florida are contained with Chapter 62D-5 Part VII, of the Florida Administrative Code (FAC). This rule serves to implement Section 375.021(4), Florida Statutes.
The rule states that the Department of Environmental Protection shall publicize the dates of the application submission period and other pertinent application information specified in this rule in the Florida Administrative Weekly. The Department shall announce additional application submission periods if sufficient funds remain after the initial funding cycle. An applicant may submit only one application during each announced application submission period. The application may contain no more than one project site except for sandy beach access sites.
The LWCF grants program is administered on an annual cycle subject to federal fund availability. It begins with letters that are sent to all eligible applicants announcing the application deadline. The Secretary of the Interior issues the apportionment letter to the governor which notifies the State of the amount available to Florida from the LWCF.
The reoccurring funding schedule is:
November A public notice is sent to all local governmental entities with the legal responsibility for providing public outdoor recreational sites and facilities.
March Deadlines for applications for that fiscal year.
April/May Applications are reviewed, analyzed, inspected, evaluated, and ranked by staff.
July The State Liaison Officer and staff selects a list of successful projects for the available funds. All applicants are notified of the decisions.
August/September Selected projects are forwarded to the Southeast Regional Office of the National Park Service for approval and fund obligation.
LWCF grants shall only be awarded to grantees for projects that are for the sole purpose of providing outdoor recreational opportunities to the public.
Each eligible project application shall be evaluated on the basis of the information provided in the application and in accordance with the Evaluation Criteria contained in Section 62D-5.072 FAC. Each application shall be assigned a total point score pursuant to this criteria and an eligible application’s standing among competing eligible applications shall be determined by the extent to which it is determined to meet the criteria as follows:
Appendix D- Open Project Selection Process

D-2
(1) GENERAL CRITERIA
Points shall be awarded as follows:(a) The project implements the applicant’s adopted local comprehensive plan and is included in their capital improvement plan or schedule (CIP) during the current or next three fiscal year = 20 points.
ORis included as part of the plan through an adopted resolution committing the applicant to amend its CIP and complete the project should it receive program funds = 10 points.
(b) The extent to which the project would implement the outdoor recreation goals, objectives and priorities specified in the Plan = 4 points.
(c) The extent to which the project would provide for priority resource or facility needs in the region as specified in the Plan = 7 points.
(d) The project has been considered in the applicant’s public participation process = 21 maximum points.
Points shall be awarded as follows: 1. Presentation at an advertised public meeting solely for the discussion of the proposed project = 10 points. 2. Presentation at a regularly scheduled advisory board meeting = 7 points. 3. Presentation to community organizations, neighborhood associations, or taking of an opinion survey = 4 points.
(e) The project is for a linear park purpose = 13 points.
(f) The project is for preservation purposes such as historical, archaeological, or cultural preservation and the site has been verified in writing by the Florida Department of State, Division of Historical Resources = 7 points.
(g) The applicant has the capability to develop, operate and maintain the project = 8 maximum points.
Points shall be awarded as follows: 1. Has a full-time recreation or park department staffed to provide facility development, programming, and maintenance capabilities = 8 points. 2. Has demonstrated the existence of a full-time ability to provide facility development, programming, and maintenance capabilities = 4 points.
(2) DEVELOPMENT CRITERIA
Points shall be awarded as follows:(a) The project provides for new development of entirely undeveloped property = 5 points.
(b) The project provides new or additional recreation facilities and opportunities: 3 or more facilities or opportunities = 15 points. 2 facilities or opportunities = 10 points. 1 facility or opportunity = 5 points.
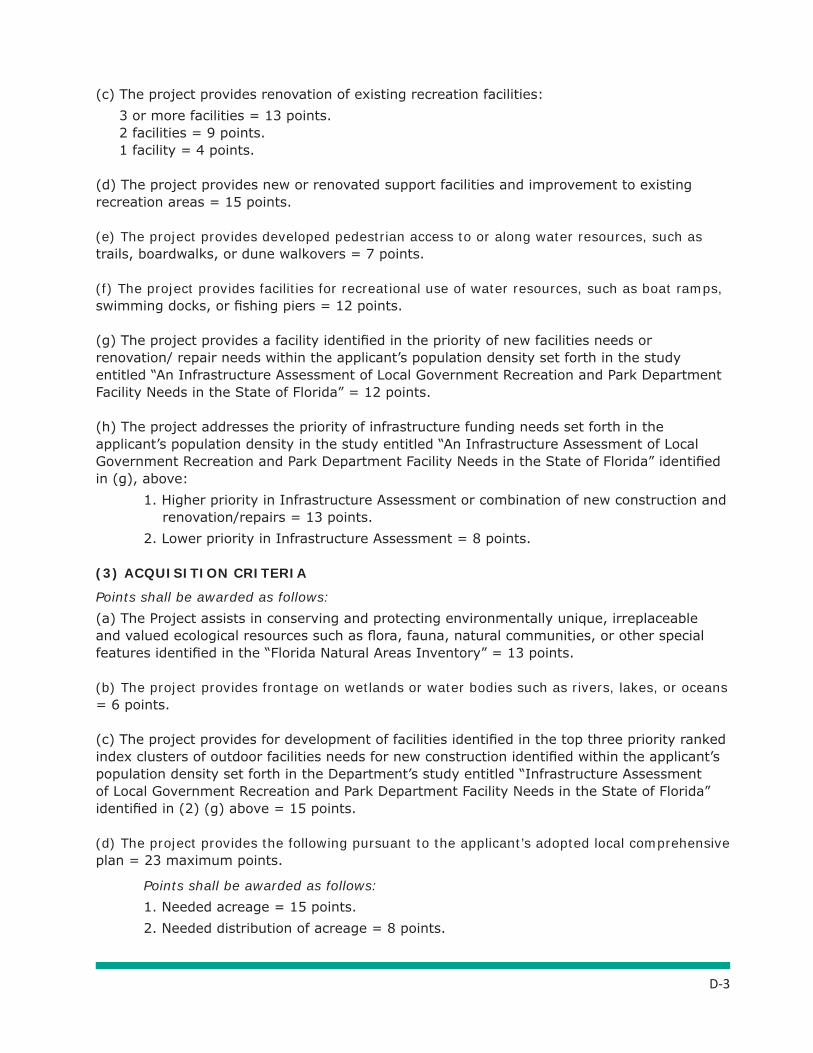
D-3
(c) The project provides renovation of existing recreation facilities: 3 or more facilities = 13 points. 2 facilities = 9 points. 1 facility = 4 points.
(d) The project provides new or renovated support facilities and improvement to existing recreation areas = 15 points.
(e) The project provides developed pedestrian access to or along water resources, such as trails, boardwalks, or dune walkovers = 7 points.
(f) The project provides facilities for recreational use of water resources, such as boat ramps, swimming docks, or fishing piers = 12 points.
(g) The project provides a facility identified in the priority of new facilities needs or renovation/ repair needs within the applicant’s population density set forth in the study entitled “An Infrastructure Assessment of Local Government Recreation and Park Department Facility Needs in the State of Florida” = 12 points.
(h) The project addresses the priority of infrastructure funding needs set forth in the applicant’s population density in the study entitled “An Infrastructure Assessment of Local Government Recreation and Park Department Facility Needs in the State of Florida” identified in (g), above: 1. Higher priority in Infrastructure Assessment or combination of new construction and renovation/repairs = 13 points. 2. Lower priority in Infrastructure Assessment = 8 points.
(3) ACQUISITION CRITERIA
Points shall be awarded as follows:(a) The Project assists in conserving and protecting environmentally unique, irreplaceable and valued ecological resources such as flora, fauna, natural communities, or other special features identified in the “Florida Natural Areas Inventory” = 13 points.
(b) The project provides frontage on wetlands or water bodies such as rivers, lakes, or oceans = 6 points.
(c) The project provides for development of facilities identified in the top three priority ranked index clusters of outdoor facilities needs for new construction identified within the applicant’s population density set forth in the Department’s study entitled “Infrastructure Assessment of Local Government Recreation and Park Department Facility Needs in the State of Florida” identified in (2) (g) above = 15 points.
(d) The project provides the following pursuant to the applicant’s adopted local comprehensive plan = 23 maximum points.
Points shall be awarded as follows: 1. Needed acreage = 15 points. 2. Needed distribution of acreage = 8 points.

D-4
(e) The applicant has:Identified development of the property in their capital improvement plan (CIP) or schedule during the current or next three fiscal years = 6 points.
ORThe applicant has included development of the property as part of the plan through an adopted resolution committing the applicant to amend its CIP and develop the property should it receive program funds = 3 points.
(4) TIE BREAKER SYSTEM
If two or more applications receive the same score as a result of the above evaluation, the following tie breaker system will be used to decide the priority ranking among them. Tied applicants will be evaluated according to each step of the tie-breaker system in order and will be assigned their priority accordingly. If Step 1 does not break the tie, Step 2 shall be used.
(a) Step 1 - Funding History. An order of priority among those applications with equal scores shall be established based on the per capita amount of funds previously received by the applicant from LWCF during the previous five fiscal years. The application from the applicant having the lowest per capita amount of funds receives the highest priority. Other applications will be arranged in descending order inversely to their applicants’ per capita amount of funds received. The resident population within the applicant’s jurisdictional boundaries shall be utilized to compute the applicant’s per capita amount of funds received.
(b) Step 2 - Per Capita Operating Budget. The applicant with the lowest per capita expenditure of general operating funds receives the highest priority. The resident population within the applicant’s jurisdictional boundaries will be divided into the applicant’s total general operating budget for the applicant’s current fiscal year to obtain the per capita operating fund amount.
Applications are assigned a total point score by the Department. A grading report addressing the extent to which each criterion has been met is filed with each application evaluated.
Each spring the State Liaison Officer submits to the Deputy Secretary of the Department of Environmental Protection, for formal consideration, a recommended priority ranked listing (in descending order of the total point scores) of all program applications evaluated. The list includes the Deputy Secretary’s recommendations for program grant awards.
In order to encourage effective participation by all potential program participants, annual program announcements are sent to all counties and municipalities and other agencies having primary recreational responsibilities. Workshops are held periodically to promote program benefits and to explain program requirements, particularly the need for local projects to be well supported by local recreation planning and public involvement and to support the state comprehensive outdoor recreation plan and action program.
Technical assistance in preparing and submitting grant applications, site design, planning, needs analysis, management, funding sources, public participation, permitting, and other common needs of potential applicants is provided by the Department of Environmental Protection upon request. Further technical guidance is given to local governments through Recreation Assistance Program mail outs, telephone contacts, lending library services, on-site visits, workshops, and conferences with Department staff.
E-1
Appendix E - Responsive Management Methodology & Survey
INTRODUCTION AND METHODOLOGYThis study was conducted for the Florida Department of Environmental Protection (hereinafterreferred to as the Department) to determine Florida residents’ and tourists’ participation inoutdoor recreation and their outdoor recreation needs. The study was undertaken in support of the State Comprehensive Outdoor Recreation Plan (SCORP). The study entailed two telephone surveys: the first of Florida residents and the second of tourists who visit Florida. Specific aspects of the research methodology are discussed below.
Multi-Modal Survey DesignFor the survey of residents, telephones were selected as the preferred sampling medium because of the almost universal ownership of telephones among Florida residents. The survey of tourists used a multi-modal approach: the primary contact method was through telephone, supplemented with online contacts.
Design of QuestionnairesThe telephone survey questionnaires were developed cooperatively by Responsive Management and the Department, based on the research team’s familiarity with outdoor recreation, as well as SCORP studies for various other states. Responsive Management conducted pre-tests of the questionnaires to ensure proper wording, flow, and logic in the surveys. The tourist survey questionnaire was modified as necessary to create the online survey, and a pretest was conducted of this, as well.
Survey SamplesThe sample of Florida residents was obtained from Survey Sampling International andDatabase 101, firms that specialize in providing scientific samples for human dimensions studies. Residents were sampled to ensure each of eight regions of Florida had enough respondents for valid results (see map of Florida Regions on the following page). For statewide analyses, the regions were then weighted so that the results were representative of all residents of Florida ages 18 and older.
The tourist sample was obtained from several sources to represent a cross-section of tourists to the state. The sampling was conducted in three distinct waves to ensure proper temporalrepresentation of tourists. The tourist sampling plan, in part, mirrored panel methods employed by Visit Florida, the official not-for-profit arm of the Florida Commission on Tourism.
Telephone Interviewing and Date Management FacilitiesA central polling site at the Responsive Management office allowed for rigorous quality control over the telephone interviews and data collection from both the telephone and online surveys. Responsive Management maintains its own in-house telephone interviewing and data management facilities. These facilities are staffed by interviewers with experience conducting computer-assisted telephone interviews on the subjects of outdoor recreation and natural resources.
To ensure the integrity of the telephone survey data, Responsive Management has interviewers who have been trained according to the standards established by the Council

E-2
of American Survey Research Organizations. Methods of instruction included lecture and role-playing. The Survey Center Managers and other professional staff conducted a project briefing with the interviewers prior to the administration of these surveys. Interviewers were instructed on type of study, study goals and objectives, handling of survey questions, interview length, qualifiers for participation, interviewer instructions within the survey questionnaires, reading of the survey questions, skip patterns, and probing and clarifying techniques necessary for specific questions on the survey questionnaires.
Interviewing Dates and TimesTelephone surveying times are Monday through Friday from 9:00 a.m. to 9:00 p.m., Saturday from noon to 5:00 p.m., and Sunday from 5:00 p.m. to 9:00 p.m., local time. A five-callback design was used to maintain the representativeness of the sample, to avoid bias toward people easy to reach by telephone, and to provide an equal opportunity for all to participate. When a respondent could not be reached on the first call, subsequent calls were placed on different days of the week and at different times of the day. The online survey could be accessed at any time at the convenience of the respondent. The survey of residents was conducted in April through September 2011. The survey of tourists was conducted in three waves to account for the seasonality of Florida’s tourism season: May, August and October 2011.

E-3
Survey Data Collection and Quality ControlThe software used for telephone survey data collection was Questionnaire ProgrammingLanguage (QPL). The survey data were entered into the computer as each interview was being conducted, eliminating manual data entry after the completion of the survey and the concomitant data entry errors that may occur with manual data entry. The survey questionnaires were programmed so that QPL branched, coded, and substituted phrases in the survey based on previous responses to ensure the integrity and consistency of the data collection.
The Survey Center Managers and statisticians monitored the data collection, includingmonitoring of the actual telephone interviews without the interviewers’ knowledge, to evaluate the performance of each interviewer and ensure the integrity of the data. The surveyquestionnaires themselves contained error checkers and computation statements to ensure quality and consistent data. Once the data were obtained, QPL software exported the data into the project database in a format compatible with Statistical Package for the Social Sciences (SPSS).
The online survey data were imported into the project database in SPSS using interfacingsoftware as part of the online survey program.
After the surveys were obtained by the interviewers, the Survey Center Managers and/orstatisticians checked each completed survey to ensure clarity and completeness. ResponsiveManagement obtained a total of 3,961 completed surveys with Florida residents and 2,890completed surveys with Florida tourists (of the latter, 2,306 had participated in outdoorrecreation and received the full survey).
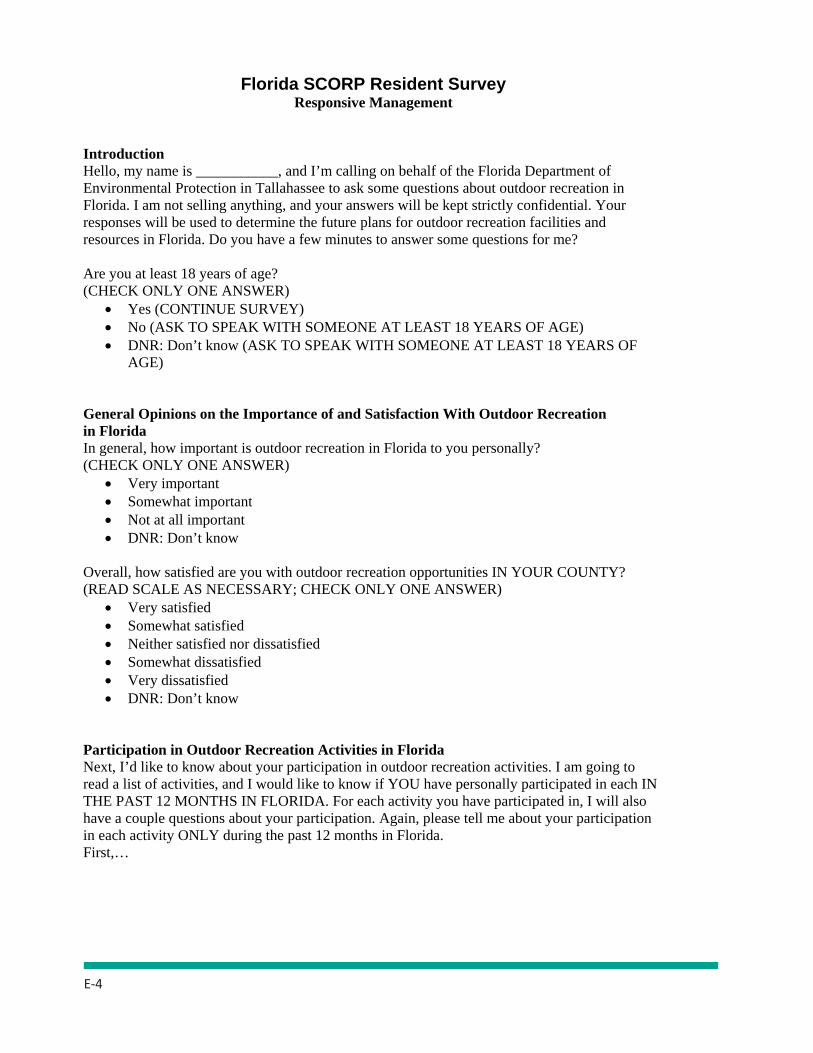
E-4
Florida SCORP Resident Survey Responsive Management
Introduction Hello, my name is ___________, and I’m calling on behalf of the Florida Department of Environmental Protection in Tallahassee to ask some questions about outdoor recreation in Florida. I am not selling anything, and your answers will be kept strictly confidential. Your responses will be used to determine the future plans for outdoor recreation facilities and resources in Florida. Do you have a few minutes to answer some questions for me?
Are you at least 18 years of age? (CHECK ONLY ONE ANSWER)
Yes (CONTINUE SURVEY) No (ASK TO SPEAK WITH SOMEONE AT LEAST 18 YEARS OF AGE) DNR: Don’t know (ASK TO SPEAK WITH SOMEONE AT LEAST 18 YEARS OF
AGE)
General Opinions on the Importance of and Satisfaction With Outdoor Recreation in Florida In general, how important is outdoor recreation in Florida to you personally? (CHECK ONLY ONE ANSWER)
Very important Somewhat important Not at all important DNR: Don’t know
Overall, how satisfied are you with outdoor recreation opportunities IN YOUR COUNTY? (READ SCALE AS NECESSARY; CHECK ONLY ONE ANSWER)
Very satisfied Somewhat satisfied Neither satisfied nor dissatisfied Somewhat dissatisfied Very dissatisfied DNR: Don’t know
Participation in Outdoor Recreation Activities in Florida Next, I’d like to know about your participation in outdoor recreation activities. I am going to read a list of activities, and I would like to know if YOU have personally participated in each IN THE PAST 12 MONTHS IN FLORIDA. For each activity you have participated in, I will also have a couple questions about your participation. Again, please tell me about your participation in each activity ONLY during the past 12 months in Florida. First,…

E-5
(ASKED FOR EACH ACTIVITY) What about [ACTIVITY]? (Have you personally participated in this activity in the past 12 months in Florida?)(LIST OF ACTIVITIES)
Taking a trip at least 1 mile from home for the primary purpose of viewing wildlife Hiking Picnicking Horseback riding Horseback camping
(IF ASKED: Horseback camping refers to camping specifically in a designated horse camping area or using a horse as a mode of transportation to access a primitive area for camping. Designated horse camping areas can include camping in tents, primitive structures, travel trailers, or recreation vehicles (RVs) in areas that are specifically designated for camping with horses. If your camping location was NOT designated as a horse camping area, only camping in primitive areas accessed by horseback is considered horseback camping.)
RV or Trailer camping, NOT including horseback camping Tent camping, NOT including horseback camping Nature study Visiting historical or archeological sites Geocaching Canoeing or kayaking Hunting Sport shooting Off-road vehicle driving, such as driving an ATV (All-Terrain Vehicle), a three-wheeler,
a dune buggy, a dirt bike, or other type of off-highway vehicle Saltwater fishing Saltwater beach activities, NOT including fishing Freshwater Freshwater beach activities, NOT including fishing Bicycling Swimming in public outdoor pools Golf (Again, please tell me if YOU have personally participated in this activity. This does
NOT include watching an event.) Outdoor tennis (Again, please tell me if YOU have personally participated in this
activity. This does NOT include watching an event.) Baseball or softball (Again, please tell me if YOU have personally participated in this
activity. This does NOT include watching an event.) Football (Again, please tell me if YOU have personally participated in this activity. This
does NOT include watching an event.) Soccer (Again, please tell me if YOU have personally participated in this activity. This
does NOT include watching an event.) Outdoor basketball (Again, please tell me if YOU have personally participated in this
activity. This does NOT include watching an event.)

E-6
(RESPONSE OPTIONS FOR EACH ACTIVITY) (CHECK ONLY ONE ANSWER)
Yes No DNR: Don’t know
(IF PARTICIPATED IN SALTWATER FISHING) You said you went saltwater fishing in the past 12 months in Florida. Did you go saltwater fishing from…? (READ LIST; CHECK IF YES)
a boat a pier, jetty, or catwalk a shore DNR: None of these DNR: Don’t know
(IF PARTICIPATED IN FRESHWATER FISHING) You said you went freshwater fishing in the past 12 months in Florida. Did you go freshwater fishing from…? (READ LIST; CHECK IF YES)
a boat a pier, jetty, or catwalk a shore or bank DNR: None of these DNR: Don’t know
(IF PARTICIPATED IN BICYCLING) You said you went bicycling in the past 12 months in Florida. Did you go bicycling on…? (READ LIST; CHECK IF YES)
paved roads and trails roads and trails that are not paved DNR: None of these DNR: Don’t know
Did you use SALTWATER boat ramps in the past 12 months in Florida? (CHECK ONLY ONE ANSWER) (CHECK ONLY ONE ANSWER)
Yes No DNR: Don’t know
Did you use FRESHWATER boat ramps in the past 12 months in Florida? (CHECK ONLY ONE ANSWER) (CHECK ONLY ONE ANSWER)
Yes

E-7
No DNR: Don’t know
(IF PARTICIPATED IN ANY ACTIVITY DURING THE PAST 12 MONTHS IN FLORIDA) Now I have some questions about each activity you did participate in during the past 12 months in Florida.
(ASKED FOR EACH ACTIVITY RESPONDENT HAS PARTICIPATED IN DURING THE PAST 12 MONTHS IN FLORIDA, INCLUDING USE OF BOAT RAMPS) You said you [PARTICIPATED IN ACTIVITY / USED SALTWATER BOAT RAMPS / USED FRESHWATER BOAT RAMPS] during the past 12 months in Florida. How many days total during the past 12 months did you [PARTICIPATE IN ACTIVITY / USE SALTWATER BOAT RAMPS / USE FRESHWATER BOAT RAMPS] in Florida? (IF ASKED: Portions of a day count as a whole day; multiple outings / uses within one day count as a single day.)(ENTER NUMBER OF DAYS)
(ASKED FOR EACH ACTIVITY RESPONDENT HAS PARTICIPATED IN DURING THE PAST 12 MONTHS IN FLORIDA, INCLUDING USE OF BOAT RAMPS) In what counties did you [PARTICIPATE IN ACTIVITY / USE SALTWATER BOAT RAMPS / USE FRESHWATER BOAT RAMPS] during the past 12 months in Florida? (ENTER COUNTY CODES FOR ALL COUNTIES)
And thinking about the area you visited the most, approximately how many miles from your home is this area located? (ENTER MILES)
In general, do you expect or plan to personally participate in outdoor recreation activities in Florida more, about the same, or less than you did during the past 12 months? (CHECK ONLY ONE ANSWER)
More About the same Less DNR: Don’t know

E-8
Reasons for Participating in Outdoor Recreation Activities in Florida What are the MOST IMPORTANT reasons you participate in outdoor recreation activitiesin Florida? (DO NOT READ LIST; CHECK ALL THAT APPLY)
I live close to a park or other outdoor area It is affordable To be with family and friends To spend time by myself To enjoy the scenery For my health (general / non-specific) For my mental well being For my physical fitness For relaxation For the challenge To be close to nature Because of the variety of opportunities available in Florida Other (ENTER OTHER) Don’t know
Next, please tell me how important or unimportant each of the following is to you when participating in outdoor recreation activities in Florida.How about [FACTOR]? (How important or unimportant is this to you when participating in outdoor recreation activities in Florida.) (LIST OF FACTORS; ADMINISTER IN RANDOM ORDER)
spending time with family and friends being active or healthy to be close to nature
(READ SCALE AS NECESSARY; PROMPT FOR DEGREE) (CHECK ONLY ONE ANSWER FOR EACH FACTOR)
Very important Somewhat important Neither important nor unimportant Somewhat unimportant Very unimportant DNR: Don’t know
Opinions on Outdoor Recreation Facilities and Opportunities in Florida Thinking about the outdoor recreation activities you have participated in during the past 12 months in Florida, please tell me how you would rate the quality of the FACILITIES IN YOUR COUNTY for participating in these activities. (Would you say they are excellent, good, fair, or poor?) What about the AMOUNT of OPPORTUNITIES IN YOUR COUNTY for participating in these activities?
E-9
(READ SCALE AS NECESSARY; CHECK ONLY ONE ANSWER) Excellent Good Fair Poor DNR: Don’t know
In your opinion, do you support or oppose maintaining the current levels of outdoor recreation services and opportunities in Florida? (READ SCALE AS NECESSARY; PROMPT FOR DEGREE) (CHECK ONLY ONE ANSWER)
Strongly support Moderately support Neither support nor oppose Moderately oppose Strongly oppose DNR: Don’t know
Desire / Need for Additional Outdoor Recreation FacilitiesAre there any outdoor recreation facilities you would like to see built or provided INYOUR COUNTY? (CHECK ONLY ONE ANSWER)
Yes No DNR: Don’t know
(IF YES) What outdoor recreation facilities would you like to see built or provided IN YOUR COUNTY? (DO NOT READ LIST; CHECK ALL THAT APPLY)
Community parks Playgrounds for children Campgrounds Fishing areas Outdoor public swimming pools Biking paths Paved walkways Hiking / walking trails Horseback riding trails Nature / interpretative trails Saltwater boat access or ramps Freshwater boat access or ramps Access for canoes or kayaks Fishing piers Beach access / parking

E-10
Hunting areas Off-road vehicle areas / trails Wildlife viewing areas / overlooks Off-leash dog areas Football fields Soccer fields Public tennis courts Outdoor basketball courts Public golf courses Baseball fields Softball fields Other(s) (ENTER OTHERS)
DemographicsGreat! We are just about through. The final questions are for background information and help us analyze the results.
What county do you live in? (ENTER COUNTY CODE)
What is your zip code? (ENTER ZIP CODE)
Do you consider your place of residence to be a large city or urban area, a suburban area, a small city or town, a rural area on a farm or ranch, or a rural area NOT on a farm or ranch? (CHECK ONLY ONE ANSWER)
Large city or urban area Suburban area Small city or town Rural area on a farm or ranch Rural area NOT on a farm or ranch DNR: Don’t know DNR: Refused
How many children, age 17 or younger, do you have living in your household? (ENTER NUMBER OF CHILDREN)
What is the highest level of education you have completed? (CHECK ONLY ONE ANSWER)
Not a high school graduate High school graduate or equivalent Some college or trade school degree Bachelor’s degree Master’s degree
E-11
Professional or doctorate degree (e.g., M.D. or Ph.D.) DNR: Don’t know DNR: Refused
Which of these categories best describes your total household income before taxes last year? (READ LIST; CHECK ONLY ONE ANSWER)
Under $20,000 $20,000-$39,999 $40,000-$59,999 $60,000-$79,999 $80,000-$99,999 $100,000-$119,999 $120,000 or more DNR: Don’t know DNR: Refused
What races or ethnic backgrounds do you consider yourself, and please mention all that apply? (CHECK ALL THAT APPLY)
White or Caucasian Black or African-American Hispanic or Latino (includes Mexican, Central American, etc.) Native American or Alaskan native or Aleutian Native Hawaiian Middle Eastern East Asian (from Japan, China, Korea, Philippines, etc.) South Asian (from India, Pakistan, Bangladesh, etc.) African (NOT African-American) DNR: Other (ENTER OTHER) DNR: Don’t know DNR: Refused
May I ask your age? (ENTER AGE)
That’s the end of the survey. Thank you for your time and cooperation.
(OBSERVE AND RECORD GENDER) Male Female Don’t know

E-12
Florida SCORP Tourist Survey Responsive Management
Introduction Hello, my name is ___________, and I’m calling on behalf of the Florida Department of Environmental Protection. We are assisting the Department in a study to better understand tourists’ opinions on their visits to Florida. I am not selling anything, and your answers will be kept strictly confidential. Your responses will be used to help determine the future plans for tourist activities in Florida. Do you have a few minutes to answer some questions for me?
Are you at least 18 years of age? (CHECK ONLY ONE ANSWER)
Yes (CONTINUE SURVEY) No (ASK TO SPEAK WITH SOMEONE AT LEAST 18 YEARS OF AGE) DNR: Don’t know (ASK TO SPEAK WITH SOMEONE AT LEAST 18 YEARS
OF AGE)
Characteristics of Visits to Florida Did you visit Florida in the past 12 months? (CHECK ONLY ONE ANSWER)
Yes No (END SURVEY: I’m sorry, but right now we are only interviewing those who
have visited Florida in the past 12 months. Thank you for your time and willingness to help.)
Don’t know (END SURVEY: I’m sorry, but right now we are only interviewing those who have visited Florida in the past 12 months. Thank you for your time and willingness to help.)
What are the main reasons you visited Florida in the past 12 months? (DO NOT READ LIST; CHECK ALL THAT APPLY)
Fun / pleasure / vacation To visit family / friends Outdoor recreation / outdoor activities Fishing Work Other (ENTER OTHER)
Did you participate in ANY outdoor recreation activities during your visit(s) to Florida in the past 12 months? For this survey, outdoor recreation includes ANY activity that takes place in a park, on a playground, at the beach, in nature, or other outdoor environment. (CHECK ONLY ONE ANSWER)
Yes

E-13
No (END SURVEY: That’s the end of the survey. Thank you for your time and cooperation.)
Don’t know (END SURVEY: That’s the end of the survey. Thank you for your time and cooperation.)
How many trips did you take to Florida in the past 12 months? (ENTER NUMBER OF TRIPS)
How many days total did you visit Florida in the past 12 months? (Please include ALL trips.)(ENTER NUMBER OF DAYS)
(IF MORE THAN ONE TRIP TO FLORIDA) On how many of your [XX] trips to Florida in the past 12 months did you participate in outdoor recreation activities?(ENTER NUMBER)
How likely are you to visit Florida in the next 12 months? (CHECK ONLY ONE ANSWER)
Very likely Somewhat likely Not at all likely DNR: Don’t know
General Opinions on the Importance of and Satisfaction With Outdoor Recreation in Florida Next, I have some questions about outdoor recreation.
In the next 12 months, do you expect or plan to personally participate in outdoor recreation activities in Florida more, about the same, or less than you did during the past 12 months? (IF ASKED: For this survey, outdoor recreation includes ANY activity that takes place in a park, on a playground, at the beach, in nature, or other outdoor environment.) (CHECK ONLY ONE ANSWER)
More About the same Less DNR: Don’t know
In general, how important is outdoor recreation to you personally? (CHECK ONLY ONE ANSWER)
Very important Somewhat important Not at all important DNR: Don’t know

E-14
Overall, how satisfied are you with outdoor recreation opportunities IN FLORIDA? (READ SCALE AS NECESSARY; CHECK ONLY ONE ANSWER)
Very satisfied Somewhat satisfied Neither satisfied nor dissatisfied Somewhat dissatisfied Very dissatisfied DNR: Don’t know
Participation in Outdoor Recreation Activities in Florida Next, I’d like to know about your participation in outdoor recreation activities in Florida. I am going to read a list of activities, and I would like to know if YOU have personally participated in each IN THE PAST 12 MONTHS IN FLORIDA. For each activity you have participated in, I will also have a couple questions about your participation. Again, please tell me about your participation in each activity ONLY during the past 12 months in Florida.First,…
(ASKED FOR EACH ACTIVITY) What about [ACTIVITY]? (Have you personally participated in this activity in the past 12 months in Florida?) (LIST OF ACTIVITIES)
Taking a trip at least 1 mile from home for the primary purpose of viewing wildlife
Hiking Picnicking Horseback riding Horseback camping
(IF ASKED: Horseback camping refers to camping specifically in a designated horse camping area or using a horse as a mode of transportation to access a primitive area for camping. Designated horse camping areas can include camping in tents, primitive structures, travel trailers, or recreation vehicles (RVs) in areas that are specifically designated for camping with horses. If your camping location was NOT designated as a horse camping area, only camping in primitive areas accessed by horseback is considered horseback camping.)
RV or Trailer camping, NOT including horseback camping Tent camping, NOT including horseback camping Nature study Visiting historical or archeological sites Geocaching Canoeing or kayaking Hunting Sport shooting

E-15
Off-road vehicle driving, such as driving an ATV (All-Terrain Vehicle), a three-wheeler, a dune buggy, a dirt bike, or other type of off-highway vehicle
Saltwater fishing Saltwater beach activities, NOT including fishing Freshwater Freshwater beach activities, NOT including fishing Bicycling Swimming in public outdoor pools Golf (Again, please tell me if YOU have personally participated in this activity.
This does NOT include watching an event.) Outdoor tennis (Again, please tell me if YOU have personally participated in this
activity. This does NOT include watching an event.) Baseball or softball (Again, please tell me if YOU have personally participated in
this activity. This does NOT include watching an event.) Football (Again, please tell me if YOU have personally participated in this
activity. This does NOT include watching an event.) Soccer (Again, please tell me if YOU have personally participated in this activity.
This does NOT include watching an event.) Outdoor basketball (Again, please tell me if YOU have personally participated in
this activity. This does NOT include watching an event.) (RESPONSE OPTIONS FOR EACH ACTIVITY) (CHECK ONLY ONE ANSWER)
Yes No DNR: Don’t know
(IF PARTICIPATED IN SALTWATER FISHING) You said you went saltwater fishing in the past 12 months in Florida. Did you go saltwater fishing from…? (READ LIST; CHECK IF YES)
a boat a pier, jetty, or catwalk a shore DNR: None of these DNR: Don’t know
(IF PARTICIPATED IN FRESHWATER FISHING) You said you went freshwater fishing in the past 12 months in Florida. Did you go freshwater fishing from…? (READ LIST; CHECK IF YES)
a boat a pier, jetty, or catwalk a shore or bank DNR: None of these DNR: Don’t know

E-16
(IF PARTICIPATED IN BICYCLING) You said you went bicycling in the past 12 months in Florida. Did you go bicycling on…? (READ LIST; CHECK IF YES)
paved roads and trails roads and trails that are not paved DNR: None of these DNR: Don’t know
Did you use SALTWATER boat ramps in the past 12 months in Florida? (CHECK ONLY ONE ANSWER) (CHECK ONLY ONE ANSWER)
Yes No DNR: Don’t know
Did you use FRESHWATER boat ramps in the past 12 months in Florida? (CHECK ONLY ONE ANSWER) (CHECK ONLY ONE ANSWER)
Yes No DNR: Don’t know
(IF PARTICIPATED IN ANY ACTIVITY DURING THE PAST 12 MONTHS IN FLORIDA) Now I have some questions about each activity you did participate in during the past 12 months in Florida.
(ASKED FOR EACH ACTIVITY RESPONDENT HAS PARTICIPATED IN DURING THE PAST 12 MONTHS IN FLORIDA, INCLUDING USE OF BOAT RAMPS) You said you [PARTICIPATED IN ACTIVITY / USED SALTWATER BOAT RAMPS / USED FRESHWATE BOAT RAMPS] during the past 12 months in Florida. How many days total during the past 12 months did you [PARTICIPATE IN ACTIVITY / USE SALTWATER BOAT RAMPS / USE FRESHWATER BOAT RAMPS] in Florida?(IF ASKED: Portions of a day count as a whole day; multiple outings / uses within one day count as a single day.)(ENTER NUMBER OF DAYS)
(ASKED FOR EACH ACTIVITY RESPONDENT HAS PARTICIPATED IN DURING THE PAST 12 MONTHS IN FLORIDA, INCLUDING USE OF BOAT RAMPS) In what city or town did you [PARTICIPATE IN ACTIVITY / USE SALTWATER BOAT RAMPS / USE FRESHWATER BOAT RAMPS] during the past 12 months in Florida? (ENTER CITY OR TOWN NAME VERBATIM FOR ALL)

E-17
Reasons for Participating in Outdoor Recreation Activities in Florida What are the MOST IMPORTANT reasons you participated in outdoor recreation activities during the past 12 months in Florida? (DO NOT READ LIST; CHECK ALL THAT APPLY)
I visited / stayed close to a park or other outdoor area It is affordable To be with family and friends To spend time by myself To enjoy the scenery For my health (general / non-specific) For my mental well being For my physical fitness For relaxation For the challenge To be close to nature Because of the variety of opportunities available in Florida Florida has good / excellent / attractive recreation opportunities Florida has outdoor recreation opportunities my home area does not Other (ENTER OTHER) Don’t know
Next, please tell me how important or unimportant each of the following is to you when participating in outdoor recreation activities in Florida.How about [FACTOR]? (How important or unimportant is this to you when participating in outdoor recreation activities in Florida.) (LIST OF FACTORS; ADMINISTER IN RANDOM ORDER)
spending time with family and friends being active or healthy to be close to nature
(READ SCALE AS NECESSARY; PROMPT FOR DEGREE) (CHECK ONLY ONE ANSWER FOR EACH FACTOR)
Very important Somewhat important Neither important nor unimportant Somewhat unimportant Very unimportant DNR: Don’t know
Opinions on Outdoor Recreation Facilities and Opportunities in Florida Thinking about the outdoor recreation activities you have participated in during the past 12 months in Florida, please tell me how you would rate the quality of the FACILITIES for participating in these activities. (Would you say they are excellent, good, fair, or poor?)

E-18
What about the AMOUNT of OPPORTUNITIES for participating in these activities? (READ SCALE AS NECESSARY; CHECK ONLY ONE ANSWER)
Excellent Good Fair Poor DNR: Don’t know
In your opinion, do you support or oppose maintaining the current levels of outdoor recreation services and opportunities in Florida? (READ SCALE AS NECESSARY; PROMPT FOR DEGREE) (CHECK ONLY ONE ANSWER)
Strongly support Moderately support Neither support nor oppose Moderately oppose Strongly oppose DNR: Don’t know
Desire / Need for Additional Outdoor Recreation FacilitiesAre there any outdoor recreation facilities you would like to see built or provided in the areas you visited?(CHECK ONLY ONE ANSWER)
Yes No DNR: Don’t know
(IF YES) What outdoor recreation facilities would you like to see built or provided in the areasyou visited? (DO NOT READ LIST; CHECK ALL THAT APPLY)
Community parks Playgrounds for children Campgrounds Fishing areas Outdoor public swimming pools Biking paths Paved walkways Hiking / walking trails Horseback riding trails Nature / interpretative trails Saltwater boat access or ramps Freshwater boat access or ramps Access for canoes or kayaks

E-19
Fishing piers Beach access / parking Hunting areas Off-road vehicle areas / trails Wildlife viewing areas / overlooks Off-leash dog areas Football fields Soccer fields Public tennis courts Outdoor basketball courts Public golf courses Baseball fields Softball fields Other(s) (ENTER OTHERS)
DemographicsGreat! We are just about through. The final questions are for background information and help us analyze the results.
What state do you live in? (ENTER STATE CODE)
What is your zip code? (ENTER ZIP CODE)
Do you consider your place of residence to be a large city or urban area, a suburban area, a small city or town, a rural area on a farm or ranch, or a rural area NOT on a farm or ranch?(CHECK ONLY ONE ANSWER)
Large city or urban area Suburban area Small city or town Rural area on a farm or ranch Rural area NOT on a farm or ranch DNR: Don’t know DNR: Refused
How many children, age 17 or younger, do you have living in your household? (ENTER NUMBER OF CHILDREN) What is the highest level of education you have completed? (CHECK ONLY ONE ANSWER)
Not a high school graduate High school graduate or equivalent Some college or trade school degree

E-20
Bachelor’s degree Master’s degree Professional or doctorate degree (e.g., M.D. or Ph.D.) DNR: Don’t know DNR: Refused
Which of these categories best describes your total household income before taxes last year? (READ LIST; CHECK ONLY ONE ANSWER)
Under $20,000 $20,000-$39,999 $40,000-$59,999 $60,000-$79,999 $80,000-$99,999 $100,000-$119,999 $120,000 or more DNR: Don’t know DNR: Refused
What races or ethnic backgrounds do you consider yourself, and please mention all that apply? (CHECK ALL THAT APPLY)
White or Caucasian Black or African-American Hispanic or Latino (includes Mexican, Central American, etc.) Native American or Alaskan native or Aleutian Native Hawaiian Middle Eastern East Asian (from Japan, China, Korea, Philippines, etc.) South Asian (from India, Pakistan, Bangladesh, etc.) African (NOT African-American) DNR: Other (ENTER OTHER) DNR: Don’t know DNR: Refused
May I ask your age? (ENTER AGE)
That’s the end of the survey. Thank you for your time and cooperation.
(OBSERVE AND RECORD GENDER) Male Female Don’t know

F-1
Appendix F - Online Questionnaires
In April 2012, two questionnaires were sent out - one to public outdoor recreation providers, and another to the general public. The purpose of these questionnaires was to provide a better understanding of recreation-related issues impacting our state, and to determine any additional issues. Items in the questionnaire were focused on issues formed primarily by the SCORP workgroup and meetings with outdoor recreation stakeholders. The results of these questionnaires helped to fine tune the issues, goals and strategies presented in Chapter 5 of this document.
SCORP Recreation Issues Survey Survey A (Public Provider)
Welcome! This survey is being conducted by the Florida Department of Environmental Protection’s Division of Recreation and Parks. The purpose of this survey is to get your ideas about recreation-related issues, the things that affect your program’s ability to provide adequate outdoor recreation opportunities. Participation in this survey is both voluntary and anonymous. Thank you!
1. Please select the level of government you work in: City County State Federal Other:
2. I think our program’s primary governing body (town council, county commissioners, state Legislature, etc) sees outdoor recreation as contributing to the overall health and quality of life of the citizens we serve.
Agree Somewhat Agree Somewhat Disagree Disagree Unsure
3. I think our program’s primary governing body sees outdoor recreation as essential to the economic stability of the region we serve.
Agree Somewhat Agree Somewhat Disagree Disagree Unsure
4. Within the constraints of the current economic situation, I think a sincere effort is made to support our program with funding and other resources.
Agree Somewhat Agree Somewhat Disagree Disagree Unsure
5. In thinking about the population you serve, how would you describe the following indicators of public support for recreation?
We have a thriving volunteer base and our user-groups are vocal in their advocacy for their interests as well as our program
PUBLIC PROVIDERS
F-2
SCORP Recreation Issues Survey Survey A (Public Provider)
Welcome! This survey is being conducted by the Florida Department of Environmental Protection’s Division of Recreation and Parks. The purpose of this survey is to get your ideas about recreation-related issues, the things that affect your program’s ability to provide adequate outdoor recreation opportunities. Participation in this survey is both voluntary and anonymous. Thank you!
1. Please select the level of government you work in: City County State Federal Other:
2. I think our program’s primary governing body (town council, county commissioners, state Legislature, etc) sees outdoor recreation as contributing to the overall health and quality of life of the citizens we serve.
Agree Somewhat Agree Somewhat Disagree Disagree Unsure
3. I think our program’s primary governing body sees outdoor recreation as essential to the economic stability of the region we serve.
Agree Somewhat Agree Somewhat Disagree Disagree Unsure
4. Within the constraints of the current economic situation, I think a sincere effort is made to support our program with funding and other resources.
Agree Somewhat Agree Somewhat Disagree Disagree Unsure
5. In thinking about the population you serve, how would you describe the following indicators of public support for recreation?
We have a thriving volunteer base and our user-groups are vocal in their advocacy for their interests as well as our program
Volunteerism is inconsistent, user-groups exist but are not vocal in their advocacy for our program
Finding and retaining volunteers is difficult, there is a lack of user-groups in our community
Other:
6. What are the current realities regarding the acquisition and development of lands by your program or agency? (Choose all that apply)
Funds are available for both acquisition and development of lands. Acquisition is possible, but funding for construction and development is
insufficient. Lands are available for purchase, but there is limited funding to do so. Urban development has increased the price of available lands out of our price
range. There is little public support for the acquisition of lands. Other:
7. If applicable, which aspects of your program have been impacted by the economic downturn?
Acquisition Maintenance Programming Construction of new facilities Staffing Other: 7b. From the list above, which aspect of your program has been most impacted?
8. Rank these recreation-related issues in terms of their importance to you, with “1” being the most important.
Impact of urban development on conservation of lands Economic impact of recreation-based tourism on local communities Rising energy costs Inadequate public access to waters Reconnecting youth to the outdoors Inadequate funding for programs and facilities Inadequate access to public lands Other:
9. Please list other recreation-related issues that impact your program. Open response, 100 word max.
10. What city or county do you live in? Open Response
F-3
Volunteerism is inconsistent, user-groups exist but are not vocal in their advocacy for our program
Finding and retaining volunteers is difficult, there is a lack of user-groups in our community
Other:
6. What are the current realities regarding the acquisition and development of lands by your program or agency? (Choose all that apply)
Funds are available for both acquisition and development of lands. Acquisition is possible, but funding for construction and development is
insufficient. Lands are available for purchase, but there is limited funding to do so. Urban development has increased the price of available lands out of our price
range. There is little public support for the acquisition of lands. Other:
7. If applicable, which aspects of your program have been impacted by the economic downturn?
Acquisition Maintenance Programming Construction of new facilities Staffing Other: 7b. From the list above, which aspect of your program has been most impacted?
8. Rank these recreation-related issues in terms of their importance to you, with “1” being the most important.
Impact of urban development on conservation of lands Economic impact of recreation-based tourism on local communities Rising energy costs Inadequate public access to waters Reconnecting youth to the outdoors Inadequate funding for programs and facilities Inadequate access to public lands Other:
9. Please list other recreation-related issues that impact your program. Open response, 100 word max.
10. What city or county do you live in? Open Response
SCORP Recreation Issues Survey Survey B (General Public)
Welcome! This survey is being conducted by the Florida Department of Environmental Protection’s Division of Recreation and Parks. The purpose of this survey is to get your ideas about recreation-related issues, the things that affect your city, county and state governments’ and private businesses’ abilities to provide the outdoor recreation opportunities you need. Participation in this survey is both voluntary and anonymous. Thank you!
1. Are you a member of a recreation based user group/association? Yes/No 1a. If yes, which of the following functions does your group provide: (choose all that
apply) o Organization of events o Sharing of information o Funding and/or constructing recreation facilities o Operation of recreation facilities o Advocating for recreation activity or recreation program o Other:
1b. If yes, list the recreational activity your group is affiliated with (if applicable): (open response)
2. How would you describe public access to Florida’s coastline and waterways? Very convenient Somewhat convenient Somewhat inconvenient Not at all convenient Unsure
3. How would you describe public access to recreational trails in your community? Very convenient Somewhat convenient Somewhat inconvenient Not at all convenient Unsure
4. If applicable, which of the following may hinder your ability or desire to participate in outdoor recreation?
Competing priorities (school, work, family, etc) Lack of accessible information on programs and facilities offered Cost of participation (registration, entrance fees, equipment, etc.) Travel distance to recreation opportunities and associated travel costs Lack of programs/facilities that appeal to your interests Other:
5. I think there is adequate funding for public recreation in Florida. Strongly Agree
GENERAL PUBLIC

F-4
SCORP Recreation Issues Survey Survey B (General Public)
Welcome! This survey is being conducted by the Florida Department of Environmental Protection’s Division of Recreation and Parks. The purpose of this survey is to get your ideas about recreation-related issues, the things that affect your city, county and state governments’ and private businesses’ abilities to provide the outdoor recreation opportunities you need. Participation in this survey is both voluntary and anonymous. Thank you!
1. Are you a member of a recreation based user group/association? Yes/No 1a. If yes, which of the following functions does your group provide: (choose all that
apply) o Organization of events o Sharing of information o Funding and/or constructing recreation facilities o Operation of recreation facilities o Advocating for recreation activity or recreation program o Other:
1b. If yes, list the recreational activity your group is affiliated with (if applicable): (open response)
2. How would you describe public access to Florida’s coastline and waterways? Very convenient Somewhat convenient Somewhat inconvenient Not at all convenient Unsure
3. How would you describe public access to recreational trails in your community? Very convenient Somewhat convenient Somewhat inconvenient Not at all convenient Unsure
4. If applicable, which of the following may hinder your ability or desire to participate in outdoor recreation?
Competing priorities (school, work, family, etc) Lack of accessible information on programs and facilities offered Cost of participation (registration, entrance fees, equipment, etc.) Travel distance to recreation opportunities and associated travel costs Lack of programs/facilities that appeal to your interests Other:
5. I think there is adequate funding for public recreation in Florida. Strongly Agree Agree Disagree Strongly Disagree Don’t Know
6. I think outdoor recreation is essential to the economic health of my community. Strongly Agree Agree Disagree Strongly Disagree Don’t know
7. I think outdoor recreation is essential to my health and quality of life. Strongly Agree Agree Disagree Strongly Disagree Don’t know
8. What effect do travel costs have in determining where you recreate? None Small effect Moderate effect Large effect
9. What are your primary sources of information when planning outdoor recreation activities? Printed Publications Internet Recommendations from friends Calling recreation providers Other:
10. Rank these recreation-related issues in terms of their importance to you, with “1” being the most important.
Impact of urban development on conservation of lands Economic impact of recreation-based tourism on local communities Rising energy costs Inadequate public access to waters Reconnecting youth to the outdoors Inadequate funding for programs and facilities Inadequate access to public lands Other:
11. Please list other recreation-related issues that impact you. Open response, 100 word max.
12. What city or county do you live in? Open response

F-5
Agree Disagree Strongly Disagree Don’t Know
6. I think outdoor recreation is essential to the economic health of my community. Strongly Agree Agree Disagree Strongly Disagree Don’t know
7. I think outdoor recreation is essential to my health and quality of life. Strongly Agree Agree Disagree Strongly Disagree Don’t know
8. What effect do travel costs have in determining where you recreate? None Small effect Moderate effect Large effect
9. What are your primary sources of information when planning outdoor recreation activities? Printed Publications Internet Recommendations from friends Calling recreation providers Other:
10. Rank these recreation-related issues in terms of their importance to you, with “1” being the most important.
Impact of urban development on conservation of lands Economic impact of recreation-based tourism on local communities Rising energy costs Inadequate public access to waters Reconnecting youth to the outdoors Inadequate funding for programs and facilities Inadequate access to public lands Other:
11. Please list other recreation-related issues that impact you. Open response, 100 word max.
12. What city or county do you live in? Open response
End of survey Thank You Screen…
Thank you for taking the time to complete this survey! Your input is important to us, as it allows for a better understanding of recreation-related issues in Florida. Responses from this survey will be used as part of the 2013 update of Outdoor Recreation in Florida, the statewide comprehensive outdoor recreation plan (SCORP). Thank you!

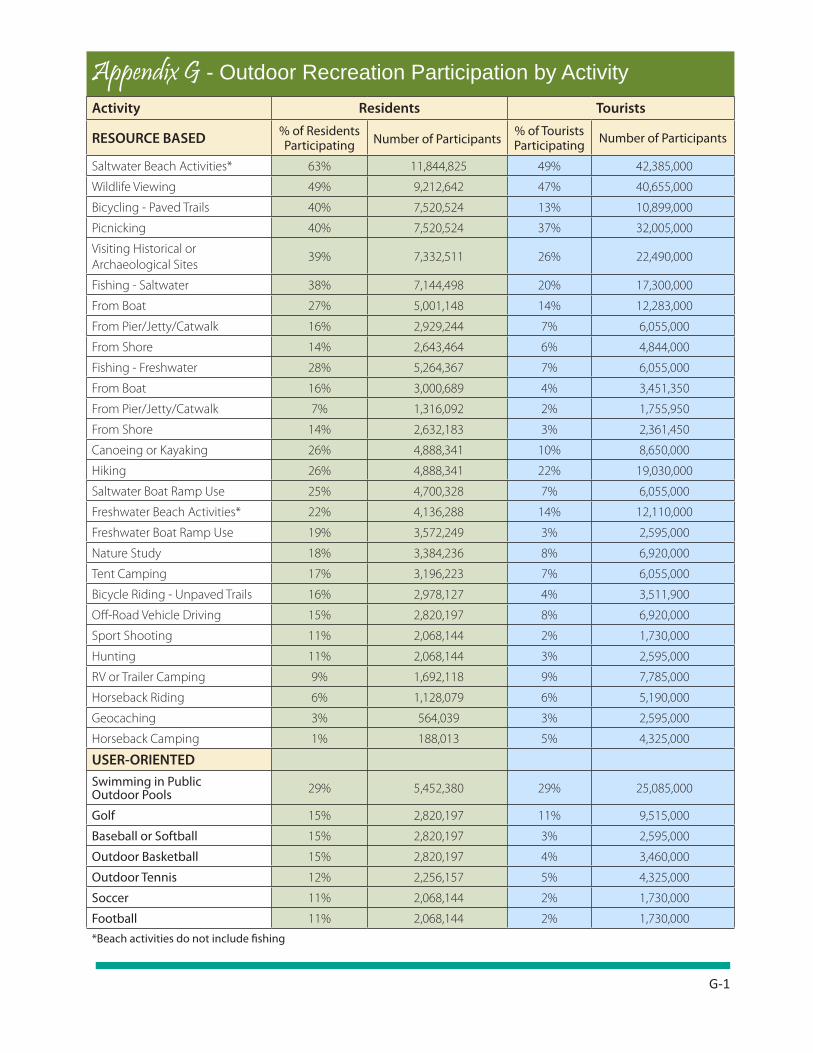
G-1
Appendix G - Outdoor Recreation Participation by ActivityActivity Residents Tourists
RESOURCE BASED % of Residents Participating Number of Participants % of Tourists
Participating Number of Participants
Saltwater Beach Activities* 63% 11,844,825 49% 42,385,000
Wildlife Viewing 49% 9,212,642 47% 40,655,000
Bicycling - Paved Trails 40% 7,520,524 13% 10,899,000
Picnicking 40% 7,520,524 37% 32,005,000
Visiting Historical or Archaeological Sites
39% 7,332,511 26% 22,490,000
Fishing - Saltwater 38% 7,144,498 20% 17,300,000
From Boat 27% 5,001,148 14% 12,283,000
From Pier/Jetty/Catwalk 16% 2,929,244 7% 6,055,000
From Shore 14% 2,643,464 6% 4,844,000
Fishing - Freshwater 28% 5,264,367 7% 6,055,000
From Boat 16% 3,000,689 4% 3,451,350
From Pier/Jetty/Catwalk 7% 1,316,092 2% 1,755,950
From Shore 14% 2,632,183 3% 2,361,450
Canoeing or Kayaking 26% 4,888,341 10% 8,650,000
Hiking 26% 4,888,341 22% 19,030,000
Saltwater Boat Ramp Use 25% 4,700,328 7% 6,055,000
Freshwater Beach Activities* 22% 4,136,288 14% 12,110,000
Freshwater Boat Ramp Use 19% 3,572,249 3% 2,595,000
Nature Study 18% 3,384,236 8% 6,920,000
Tent Camping 17% 3,196,223 7% 6,055,000
Bicycle Riding - Unpaved Trails 16% 2,978,127 4% 3,511,900
Off-Road Vehicle Driving 15% 2,820,197 8% 6,920,000
Sport Shooting 11% 2,068,144 2% 1,730,000
Hunting 11% 2,068,144 3% 2,595,000
RV or Trailer Camping 9% 1,692,118 9% 7,785,000
Horseback Riding 6% 1,128,079 6% 5,190,000
Geocaching 3% 564,039 3% 2,595,000
Horseback Camping 1% 188,013 5% 4,325,000
USER-ORIENTED Swimming in Public Outdoor Pools 29% 5,452,380 29% 25,085,000
Golf 15% 2,820,197 11% 9,515,000
Baseball or Softball 15% 2,820,197 3% 2,595,000
Outdoor Basketball 15% 2,820,197 4% 3,460,000
Outdoor Tennis 12% 2,256,157 5% 4,325,000
Soccer 11% 2,068,144 2% 1,730,000
Football 11% 2,068,144 2% 1,730,000
*Beach activities do not include fishing


H-1
Appendix H - Level of Service Charts and Activity Profiles
WATER-BASED ACTIVITIES
Saltwater Beach Activities
Saltwater Beach Activities: Level of Service Comparisons
Saltwater beach activities continue as the most popular form of resource-based recreation in Florida. Overall, 63 percent of residents and 49 percent of tourists participated statewide. Residents of the Southwest, Central West, Southeast and Northeast regions had the highest
Region% of Participation* Total Participation** Level of Service
(Linear Feet/1,000 Participants)
Residents Tourists 2011 2020 2011 2020
Northwest 56 49 4,797,766 5,529,272 171.65 148.94
North Central 61 49 1,401,282 1,594,591 6.9 6.06
Northeast 64 49 3,936,970 4,576,776 69.32 59.63
Central West 66 49 7,864,074 9,063,856 30.08 26.10
Central 58 49 15,470,090 18,041,492 NA NA
Central East 60 49 3,951,010 4,559,720 109.03 94.48
Southwest 69 49 5,542,199 6,460,991 76.15 65.32
Southeast 64 49 11,237,444 12,766,640 28.18 24.80
Statewide 63 49 54,229,825 62,631,758 46.32 40.11
* Percent of participation represents the percentage of residents and tourists who participated in activity at least one time during the year** Total participants represents the combined number of residents and tourists who particpated in activity at least one time during the yearBOLD numbers represent a number below the statewide median.
Salwater Beach Activities Level of Service Comparisons
0
20
40
60
80
100
120
140
160
180
200
Northwest North Central Northeast Central West Central Central East Southwest Southeast
Line
ar F
eet/1
,000
Par
ticip
ants
20112020Median
2011 2020 Median
NA

H-2
participation rates of all regions. Resident rates were lowest in the Northwest and Central region. Traveling long distances is necessary to reach any beach area in the Central region.
Tremendous regional variations in levels of service exist for saltwater beach activities. The Northwest region, where a relatively small population is combined with the highest availability of beaches, stands out as having by far the highest level of service of any region. In contrast, the North Central region, where the availability of sandy beaches is low due to the low-energy Gulf coastline has the lowest level of service. In the Southeast region, high populations of both residents and tourists combined with reduced access due to private coastal development results in a lower level of service. Unfortunately, the provision of additional beach resources will not be possible as the amount of remaining undeveloped beaches dwindles to zero. Increasing public access to the state’s existing saltwater beaches will be required to accommodate future demands.
Freshwater Beach Activities
Freshwater swimming areas are widely distributed in Florida and are often more convenient to residents than a long drive to a saltwater beach, though only 22 percent of residents participate in freshwater beach activities. Tourists are more likely to prefer a swim in an outdoor swimming pool over a visit to a freshwater lake or river, with only 14 percent participating. One exception is Florida’s freshwater springs which attract large numbers of residents and tourists alike. The Northwest, North Central and Central regions had the highest resident participation rates in this activity.
The Northwest, North Central and Central East regions had the highest levels of service in the state. Some of the state’s highest concentrations of freshwater lakes and springs are found in these regions. The Central region is known for having an abundance of lakes, but higher populations and residential lakefront developments contribute to the regions lower level of service. Levels of service were lowest in the Northeast and Central West regions, where freshwater swimming resources are in relatively short supply.
Region% of Participation* Total Participation**
Residents Tourists 2011 2020
Northwest 26 14 1,470,659 1,688,662
North Central 37 14 577,979 651,527
Northeast 21 14 1,165,988 1,355,704
Central West 22 14 2,338,791 2,693,312
Central 29 14 4,828,645 5,647,306
Central East 17 14 1,126,517 1,300,120
Southwest 20 14 1,588,884 1,852,380
Southeast 16 14 3,081,836 3,507,920
Statewide 22 14 16,246,288 18,747,852
* Percent of participation represents the percentage of residents and tourists who participated in activity at least one time during the year** Total participants represents the combined number of residents and tourists who particpated in activity at least one time during the year

H-3
Freshwater Beach ActivitiesLevel of Service Comparisons
0
5
10
15
20
25
Northwest North Central Northeast Central West Central Central East Southwest Southeast
Line
ar F
eet/1
,000
Par
ticip
ants
20112020Median
2011 2020 Median
Freshwater Beach Activities: Level of Service Comparisons
Saltwater Boat Fishing
Florida’s coastline has tremendous potential for saltwater boating and boat fishing. Approximately 17.3 million residents and tourists participated in saltwater boat fishing in 2011. It is predominantly a resident activity, both statewide and in the regions, with 27
Region% of Participation* Total Participation** Level of Service
(Linear Feet/1,000 Participants)
Residents Tourists 2011 2020 2011 2020
Northwest 24 14 1,467,386 1,686,315 0.15 0.13
North Central 29 14 507,023 573,453 0.10 0.09
Northeast 27 14 1,263,581 1,469,611 0.054 0.046
Central West 31 14 2,637,622 3,031,069 0.07 0.06
Central 25 14 4,746,577 5,545,892 NA NA
Central East 27 14 1,300,669 1,497,944 0.19 0.17
Southwest 29 14 1,772,642 2,069,267 0.11 0.10
Southeast 24 14 3,572,451 3,686,867 0.084 0.082
Statewide 27 14 17,284,148 19,929,676 0.07 0.06
* Percent of participation represents the percentage of residents and tourists who participated in activity at least one time during the year** Total participants represents the combined number of residents and tourists who particpated in activity at least one time during the yearBOLD numbers represent a number below the statewide median.

H-4
percent of statewide residents, but only 14 percent of visitors participating. In this region, high quality saltwater fishing areas are easily accessible to visitors who trailer their boats from nearby southeastern states.
The Central West region had the highest rate of resident participation at 31 percent. The proximity of prime fishing areas undoubtedly contribute to the popularity of saltwater boating and boat fishing there. The Southwest and North Central regions also had high resident participation rates at 29 percent. Because the resources involved in this activity are virtually unlimited, levels of service and future need comparisons were not calculated.
Saltwater Non-Boat Fishing
Nearly 93 miles of fishing piers, jetties and catwalks offer saltwater fishing opportunities to shoreline fishermen along Florida’s coastline. Unlike boat fishing, the cost of equipment required to participate in non-boat fishing is low and affordable to most people. The level of experience and physical effort required to participate are low as well. Statewide, 16 percent of residents participated, but only 7 percent of tourists. Resident participation rates were highest in Central East and Central West regions (21 percent and 20 percent, respectively).
Regional levels of service were highest in the Northwest and Central East regions. Many of the states most popular fishing piers are located in these regions, including the Pensacola Beach Fishing Pier, the Sunglow Fishing Pier in Daytona, and the Cocoa Beach Pier. Many coastal communities in these regions have at least one county or city-operated pier or other type of shoreline fishing facility, which tend to draw resident fishermen and tourists alike. Levels of service were lowest in the North Central, Northeast and Central West regions. In the North Central and in portions of the Central West regions, much of the coastline is of a shallow, low-energy nature.
Region% of Participation* Total Participation** Level of Service
(Feet of Pier, Jetty, Catwalk/1,000 Participants)
Residents Tourists 2011 2020 2011 2020
Northwest 18 7 783,866 897,242 94.47 82.53
North Central 11 7 222,378 252,283 27.19 23.97
Northeast 15 7 653,775 760,530 40.45 34.77
Central West 20 7 1,438,743 1,650,365 40.51 35.32
Central 13 7 2,351,198 2,747,556 NA NA
Central East 21 7 761,383 874,748 98.20 85.48
Southwest 18 7 938,605 1,096,637 88.38 75.64
Southeast 13 7 1,839,717 1,902,730 52.74 51.00
Statewide 16 7 8,984,244 10,350,684 43.75 40.54* Percent of participation represents the percentage of residents and tourists who participated in activity at least one time during the year** Total participants represents the combined number of residents and tourists who particpated in activity at least one time during the yearBOLD numbers represent a number below the statewide median.

H-5
Saltwater Non-Boat Fishing: Level of Service Comparisons
Saltwater Boat Ramp Use
Recreational boating access to Florida’s coastal waters is highly valued by boaters, fishermen, hunters and other sportsmen. This activity was considerably more popular among residents than tourists. Statewide, 25 percent of residents participated in saltwater boat ramp use but only 7 percent of tourists. Resident participation was highest in the North Central and Central East regions.
Region % of Participation* Total Participation** Level of Service(Ramp Lanes/1,000 Participants)
Residents Tourists 2011 2020 2011 2020
Northwest 20 7 805,238 920,540 0.27 0.23
North Central 30 7 393,353 440,890 0.13 0.12
Northeast 23 7 772,451 899,152 0.09 0.08
Central West 28 7 1,666,562 1,907,248 0.12 0.10
Central 23 7 2,693,780 3,160,542 NA NA
Central East 30 7 915,880 1,049,960 0.28 0.24
Southwest 25 7 1,077,855 1,261,275 0.18 0.16
Southeast 23 7 2,386,577 2,670,685 0.13 0.11
Statewide 25 7 10,755,328 12,359,650 0.12 0.10
* Percent of participation represents the percentage of residents and tourists who participated in activity at least one time during the year** Total participants represents the combined number of residents and tourists who particpated in activity at least one time during the yearBOLD numbers represent a number below the statewide median.
Saltwater Non-Boat FishingLevel of Service Comparisons
0.00
20.00
40.00
60.00
80.00
100.00
120.00
Northwest North Central Northeast Central West Central Central East Southwest Southeast
Feet
of P
ier,
Jetty
, Cat
wal
k/1,
000
Parti
cipa
nts
20112020Median
2011 2020 Median
NA

H-6
The Northwest and Central East regions had the highest levels of service in the state. Level of service was lowest in the Northeast and Central West regions. Continued population and tourism increases will continue to strain these valued resources. Maintenance of existing facilities and construction of new boat ramps will important in supporting this important aspect of Florida’s recreation program.
Saltwater Boat Ramp Use: Level of Service Comparisons
Freshwater Boat Fishing
Florida is dotted with thousands of lakes and rivers that provided freshwater boat fishing opportunities for an estimated 6.5 million participants in 2011. Even more than saltwater boat fishing, it is almost exclusively a resident pastime, with only four percent of tourists participating statewide. The St. Johns River, Lake Okeechobee, Lake Tohopekaliga and many
Saltwater Boat RampLevel of Service Comparisons
0.00
0.05
0.10
0.15
0.20
0.25
0.30
Northwest North Central Northeast Central West Central Central East Southwest Southeast
Ram
p La
nes/
1,00
0 Pa
rtici
pant
s
20112020Median
2011 2020 Median
Region % of Participation* Total Participation**
Residents Tourists 2011 2020 Northwest 22 4 565,346 640,654
North Central 26 4 308,610 344,410
Northeast 19 4 526,689 613,429
Central West 19 4 1,031,826 1,179,464
Central 24 4 1,882,969 2,220,440
Central East 18 4 530,252 607,777
Southwest 14 4 609,654 713,342
Southeast 6 4 956,688 984,877
Statewide 16 4 6,452,039 7,409,685
* Percent of participation represents the percentage of residents and tourists who participated in activity at least one time during the year** Total participants represents the combined number of residents and tourists who particpated in activity at least one time during the year
NA

H-7
other waters are nationally known for their excellent trophy (10 pounds or more) largemouth bass fishing and major fishing tournaments. Freshwater fishing is a major theme of nature-based tourism marketing efforts in these regions as well.
Among residents, three regions had participation rates exceeding 20 percent. The highest rates were in the North Central and Central regions. In the North Central region, large rivers and smaller creeks provide convenient fishing opportunities to residents. High resident participation rates also occurred in the Central region where dozens of large lakes and hundreds of smaller ones are widely distributed. Because of the vast supply of open water area that is available for freshwater boat fishing, levels of service and estimates of future needs comparisons were not calculated.
Freshwater Non-Boat Fishing
Freshwater shoreline fishing is a very popular activity and is enjoyed by a wide range of people. It is a traditional activity that is common along waterways in rural communities. Like its saltwater counterpart, neither elaborate equipment nor special skills are required to enjoy a day of this type of fishing. It is also essentially a resident activity, with two percent of tourists taking part statewide. Resident participation rates were highest in the Northeast and North Central regions, where the Apalachicola, Suwannee and St. Johns Rivers and their many tributaries provide ample shoreline and excellent fishing.
The North Central and Southwest regions had the highest levels of service compared with the other regions. In addition to the high concentrations of freshwater resources in these regions, many local governments have constructed piers and catwalks that facilitate this activity. Levels of service were lowest in the Southeast and Northwest regions.
Level of Service Comparison Chart on following page
Region% of Participation* Total Participation** Level of Service
(Feet of Pier, Jetty, Catwalk/1,000 Participants)
Residents Tourists 2011 2020 2011 2020
Northwest 6 2 235,017 268,590 86.87 76.01
North Central 10 2 122,240 136,868 249.66 222.97
Northeast 10 2 267,965 312,096 96.58 82.92
Central West 9 2 507,869 580,802 125.85 110.05
Central 8 2 829,526 974,819 142.07 120.90
Central East 7 2 238,380 273,612 116.89 101.84
Southwest 5 2 270,066 315,507 196.62 168.30
Southeast 5 2 574,843 596,589 49.56 47.75
Statewide 7 2 3,072,042 3,530,982 159.44 138.72* Percent of participation represents the percentage of residents and tourists who participated in activity at least one time during the year** Total participants represents the combined number of residents and tourists who particpated in activity at least one time during the yearBOLD numbers represent a number below the statewide median.

H-8
Freshwater Non-Boat FishingLevel of Service Comparisons
0
50
100
150
200
250
300
Northwest North Central Northeast Central West Central Central East Southwest Southeast
Feet
of P
ier,
Jetty
, Cat
wal
k/1,
000
Parti
cipa
nts
20112020Median
2011 2020 Median
Freshwater Non-Boat Fishing: Level of Service Comparisons
Freshwater Boat-Ramp Use
Just as for saltwater boat ramps, freshwater boat ramps provide vital access to Florida’s public waters for millions of boaters who lack other means of access. A large disparity exists between resident and tourist participation, as is the case for other boating-related activities.
Region% of Participation* Total Participation** Level of Service
(Ramp Lanes/1,000 Participants)
Residents Tourists 2011 2020 2011 2020
Northwest 25 3 509,172 573,375 0.60 0.53
North Central 37 3 387,679 430,647 0.71 0.64
Northeast 23 3 530,251 618,032 0.31 0.27
Central West 20 3 948,201 1,081,200 0.16 0.14
Central 33 3 1,915,355 2,271,762 0.30 0.25
Central East 21 3 526,071 601,440 0.33 0.29
Southwest 12 3 486,230 569,268 0.24 0.20
Southeast 7 3 861,741 969,965 0.18 0.16
Statewide 19 3 6,167,249 7,064,054 0.31 0.27* Percent of participation represents the percentage of residents and tourists who participated in activity at least one time during the year** Total participants represents the combined number of residents and tourists who particpated in activity at least one time during the yearBOLD numbers represent a number below the statewide median.
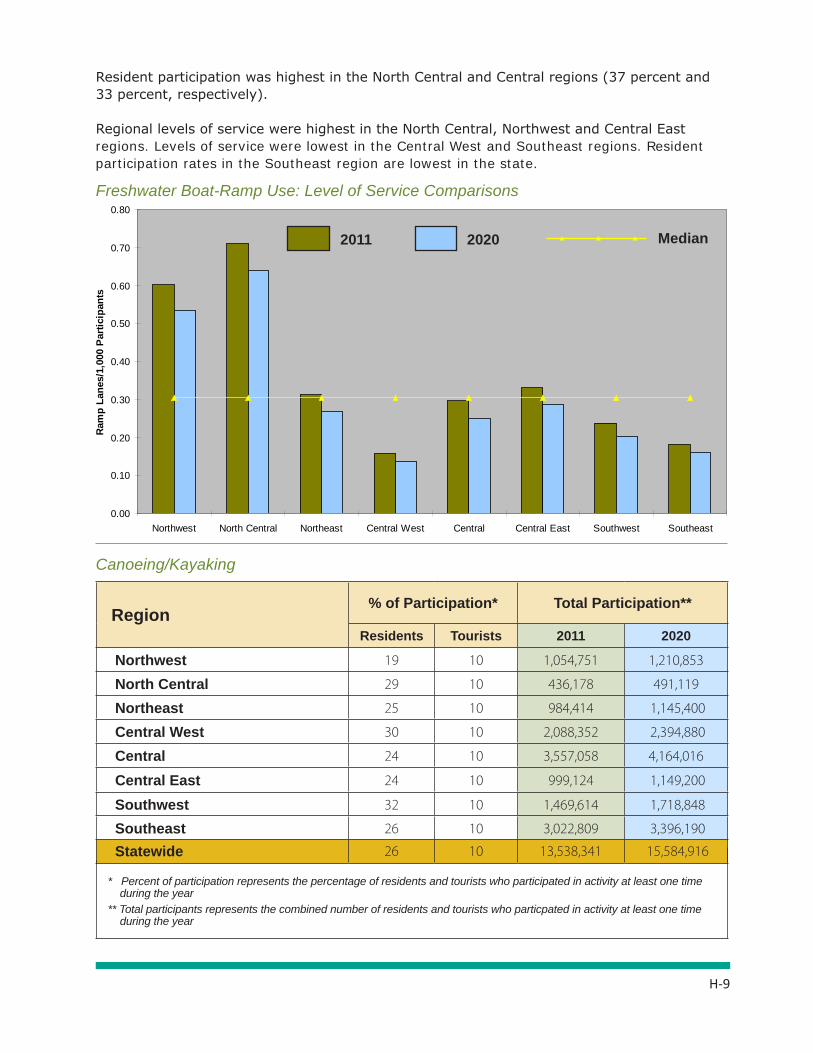
H-9
Freshwater Boat RampLevel of Service Comparisons
0.00
0.10
0.20
0.30
0.40
0.50
0.60
0.70
0.80
Northwest North Central Northeast Central West Central Central East Southwest Southeast
Ram
p La
nes/
1,00
0 Pa
rtici
pant
s
20112020Median
2011 2020 Median
Resident participation was highest in the North Central and Central regions (37 percent and 33 percent, respectively).
Regional levels of service were highest in the North Central, Northwest and Central East regions. Levels of service were lowest in the Central West and Southeast regions. Resident participation rates in the Southeast region are lowest in the state.
Freshwater Boat-Ramp Use: Level of Service Comparisons
Canoeing/Kayaking
Region% of Participation* Total Participation**
Residents Tourists 2011 2020
Northwest 19 10 1,054,751 1,210,853
North Central 29 10 436,178 491,119
Northeast 25 10 984,414 1,145,400
Central West 30 10 2,088,352 2,394,880
Central 24 10 3,557,058 4,164,016
Central East 24 10 999,124 1,149,200
Southwest 32 10 1,469,614 1,718,848
Southeast 26 10 3,022,809 3,396,190
Statewide 26 10 13,538,341 15,584,916
* Percent of participation represents the percentage of residents and tourists who participated in activity at least one time during the year** Total participants represents the combined number of residents and tourists who particpated in activity at least one time during the year

H-10
Canoeing and kayaking appear to have gained in popularity in recent years, with participation rates similar to motorized boating, as 26 percent of residents and 10 percent of tourists participated in 2011. The requirements of this activity in terms of equipment, time and physical ability are such that most people can participate, and the availability of canoe rentals and outfitting services is improving in much of the state. Popularity among residents is greatest in the Southwest, Central West and North Central regions where miles of excellent paddling trails exist. These regional participation rates correspond generally with the availability of designated canoe trails and commercial canoe rental and outfitting services.
Better trail mapping and increased public awareness efforts regarding canoeing and kayaking trails are occurring at all levels of supply and by many businesses and user groups. Resident and tourist participation in this activity can be expected to increase as these efforts continue. Due to the virtually unlimited canoeing and kayaking resources in Florida, levels of service and future needs were not calculated. Additional efforts are needed to identify suitable trails to support the nearly 15.5 million participants projected by 2020.
LAND-BASED ACTIVITIES
Visiting Archaeological and Historic Sites
Considering the richness of Florida’s history and the wealth of archaeological sites that are protected under public ownership, it is not surprising that visiting these areas was the most popular land-based recreation activity among both residents and tourists. Nearly 39 percent of statewide residents and 26 percent of tourists participated. Much attention has been given to educating Florida residents about their state’s cultural heritage and promoting these areas to out-of-state visitors has been a mainstay of heritage tourism efforts. Nearly every Florida community has one or more historic sites within a short drive’s distance and these areas can make excellent day trip destinations for families. The Northeast, Southwest, and North Central regions had the highest resident participation rates, with more than forty percent of their residents participating.
Region% of Participation* Total Participation** Level of Service
(Sites/1,000 Participants)
Residents Tourists 2011 2020 2011 2020
Northwest 34 26 2,588,554 2,980,558 0.11 0.10
North Central 43 26 840,030 952,553 0.56 0.49
Northeast 48 26 2,301,815 2,677,072 0.24 0.21
Central West 35 26 4,172,177 4,808,720 0.034 0.030
Central 36 26 8,380,387 9,780,104 0.031 0.027
Central East 39 26 2,213,939 2,552,680 0.27 0.23
Southwest 44 26 3,080,344 3,593,316 0.12 0.10
Southeast 40 26 6,303,290 7,143,320 0.05 0.04
Statewide 39 26 29,822,511 34,421,374 0.1 0.09* Percent of participation represents the percentage of residents and tourists who participated in activity at least one time during the year** Total participants represents the combined number of residents and tourists who particpated in activity at least one time during the yearBOLD numbers represent a number below the statewide median.
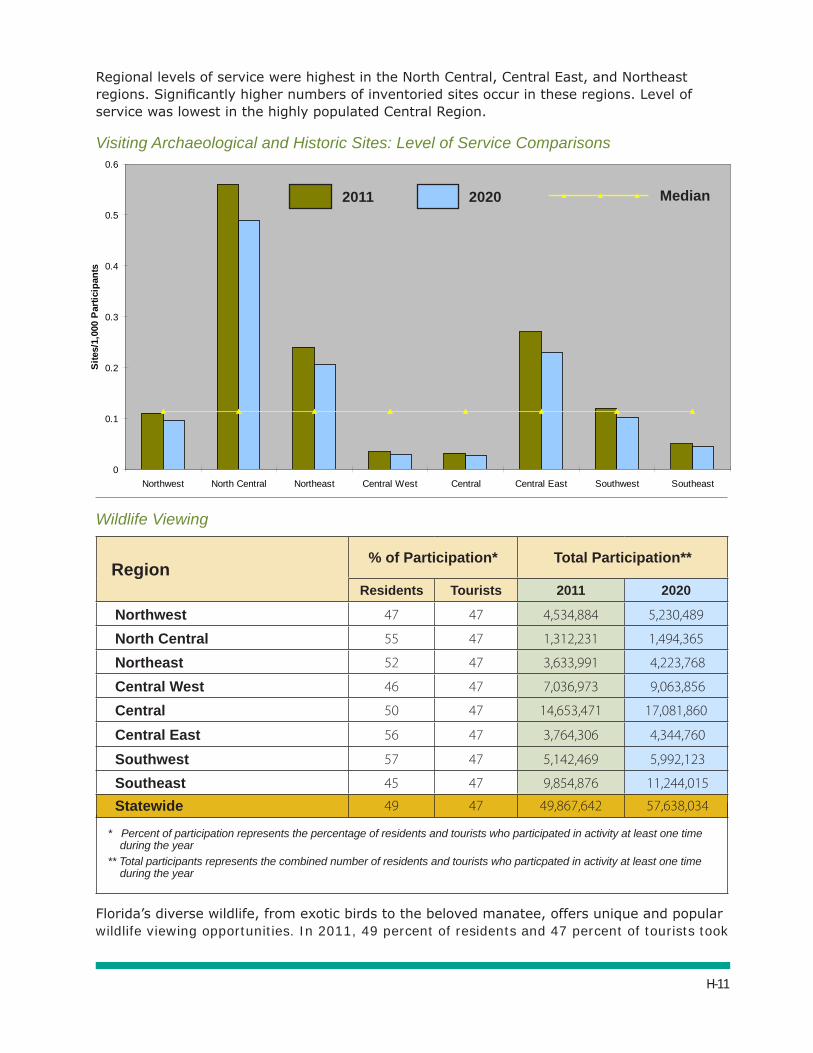
H-11
Visiting Archaeological and Historic SitesLevel of Service Comparisons
0
0.1
0.2
0.3
0.4
0.5
0.6
Northwest North Central Northeast Central West Central Central East Southwest Southeast
Site
s/1,
000
Parti
cipa
nts
20112020Median
2011 2020 Median
Regional levels of service were highest in the North Central, Central East, and Northeast regions. Significantly higher numbers of inventoried sites occur in these regions. Level of service was lowest in the highly populated Central Region.
Visiting Archaeological and Historic Sites: Level of Service Comparisons
Wildlife Viewing
Florida’s diverse wildlife, from exotic birds to the beloved manatee, offers unique and popular wildlife viewing opportunities. In 2011, 49 percent of residents and 47 percent of tourists took
Region% of Participation* Total Participation**
Residents Tourists 2011 2020
Northwest 47 47 4,534,884 5,230,489
North Central 55 47 1,312,231 1,494,365
Northeast 52 47 3,633,991 4,223,768
Central West 46 47 7,036,973 9,063,856
Central 50 47 14,653,471 17,081,860
Central East 56 47 3,764,306 4,344,760
Southwest 57 47 5,142,469 5,992,123
Southeast 45 47 9,854,876 11,244,015
Statewide 49 47 49,867,642 57,638,034
* Percent of participation represents the percentage of residents and tourists who participated in activity at least one time during the year** Total participants represents the combined number of residents and tourists who particpated in activity at least one time during the year

H-12
a trip for the primary purpose of viewing wildlife, making it the second most popular activity in the state. The highest levels of resident participation were in the Southwest, North Central and Central East regions. Big Cypress National Preserve, St. Marks National Wildlife Refuge, and Merritt Island National Wildlife Refuge are all examples of popular areas in these regions for wildlife viewing.
Maintaining Florida’s wildlife viewing opportunities is largely contingent on the continued effort to conserve large tracts of undeveloped lands and connecting existing lands. A combination of protection, education and acquisition will help ensure that Florida remains a primary destination for wildlife viewers. No level of service was conducted for this program.
Nature Study
The great diversity of Florida’s natural communities makes it a paradise for the study of nature. In 2011, an estimated 11.1 million residents and tourists participated in nature study. Anyone with sufficient interest can participate. Although no specialized facilities or equipment are required, trails that have been designed for educating visitors and interpreting the natural landscape can add tremendously to the enjoyment of the experience, particularly for those who are disabled or are less well-initiated in natural settings. The popularity of this activity is likely to increase even further as public education and nature-based tourism marketing efforts continue. Regional participation rates for residents were highest in the Southwest, Southeast and Central East regions, where extensive protected lands are convenient to highly populated urban areas.
Level of service for nature study is based on the availability of nature and interpretive trails, which offer the common participant a better understanding of their natural surroundings. The less populated North Central Region, where there are many miles of trails and smaller resident and tourist populations, had the highest level of service. The lowest levels of service were found in the densely populated Central and Southeast regions. Additional nature study trails will be needed in all regions to maintain current levels of service.
Region% of Participation* Total Participation** Level of Service
(Miles of Trail/1,000 Participants)
Residents Tourists 2011 2020 2011 2020
Northwest 15 8 841,803 966,505 0.3 0.26
North Central 18 8 301,752 340,838 0.75 0.66
Northeast 14 8 696,592 810,096 0.23 0.20
Central West 19 8 1,524,456 1,751,024 0.13 0.12
Central 17 8 2,773,316 3,244,018 0.12 0.11
Central East 17 8 763,217 878,440 0.26 0.23
Southwest 22 8 1,107,672 1,294,658 0.23 0.20
Southeast 19 8 2,316,768 2,606,945 0.09 0.08
Statewide 18 8 10,304,236 11,870,788 0.17 0.16* Percent of participation represents the percentage of residents and tourists who participated in activity at least one time during the year** Total participants represents the combined number of residents and tourists who particpated in activity at least one time during the yearBOLD numbers represent a number below the statewide median.

H-13
Nature StudyLevel of Service Comparisons
0
0.1
0.2
0.3
0.4
0.5
0.6
0.7
0.8
Northwest North Central Northeast Central West Central Central East Southwest Southeast
Mile
s of
Tra
il/1,
000
Parti
cipa
nts
20112020Median
2011 2020 Median
Nature Study: Level of Service Comparisons
Picnicking
Because of its simplicity and its relationship to so many other recreational pursuits, picnicking is one of the most popular outdoor activities in the state. It is largely a family-type of activity, although in Florida, many large social groups also enjoy picnicking, and it requires only that the participant enjoy a meal outdoors. Picnicking is the third most popular activity for residents and fourth most popular amongst tourists. Participation among residents was
Region% of Participation* Total Participation** Level of Service
(Tables/1,000 Participants)
Residents Tourists 2011 2020 2011 2020
Northwest 33 37 3,530,067 4,074,071 2.77 2.40
North Central 44 37 1,039,405 1,183,444 6.85 6.01
Northeast 40 37 2,846,612 3,308,520 2.10 1.81
Central West 40 37 5,650,502 6,519,760 3.22 2.79
Central 38 37 11,490,942 13,393,452 2.41 2.07
Central East 43 37 2,945,593 3,400,160 4.50 3.90
Southwest 39 37 3,937,373 4,586,021 4.60 3.95
Southeast 41 37 8,072,367 9,192,355 2.16 1.89
Statewide 40 37 39,525,524 45,678,640 3.61 2.57* Percent of participation represents the percentage of residents and tourists who participated in activity at least one time during the year** Total participants represents the combined number of residents and tourists who particpated in activity at least one time during the yearBOLD numbers represent a number below the statewide median.
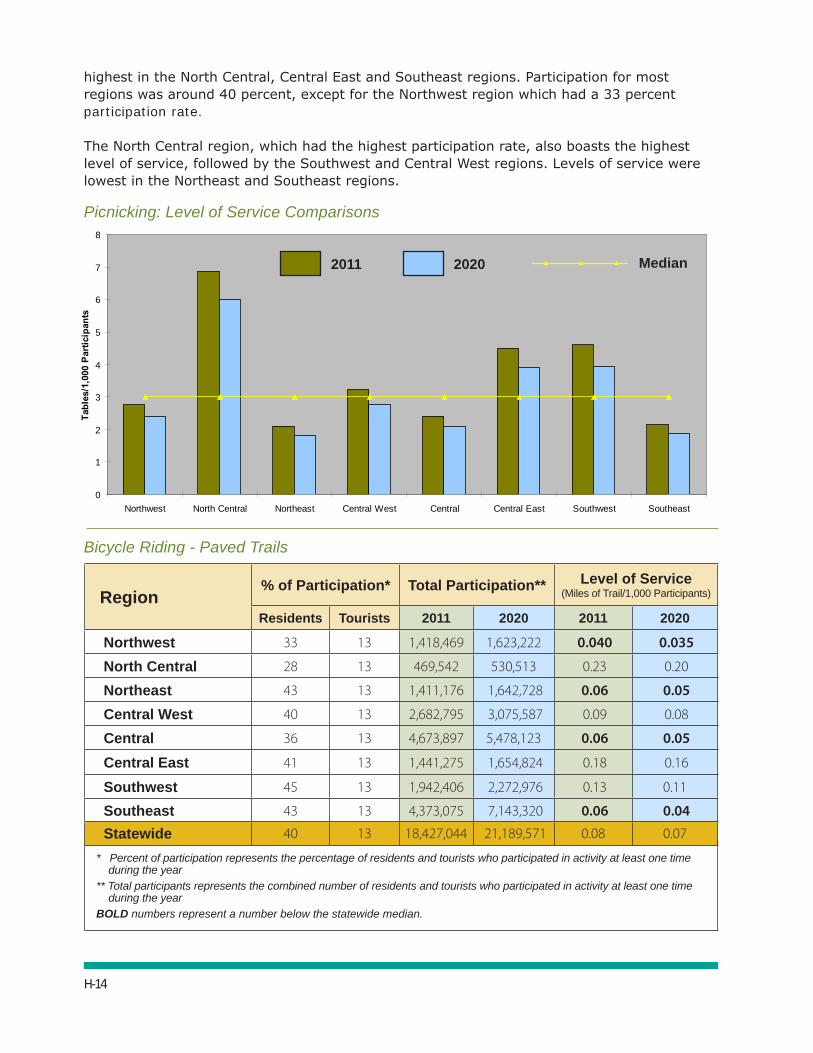
H-14
PicnickingLevel of Service Comparisons
0
1
2
3
4
5
6
7
8
Northwest North Central Northeast Central West Central Central East Southwest Southeast
Tabl
es/1
,000
Par
ticip
ants
20112020Median
2011 2020 Median
highest in the North Central, Central East and Southeast regions. Participation for most regions was around 40 percent, except for the Northwest region which had a 33 percent participation rate.
The North Central region, which had the highest participation rate, also boasts the highest level of service, followed by the Southwest and Central West regions. Levels of service were lowest in the Northeast and Southeast regions.
Picnicking: Level of Service Comparisons
Bicycle Riding - Paved Trails
Region% of Participation* Total Participation** Level of Service
(Miles of Trail/1,000 Participants)
Residents Tourists 2011 2020 2011 2020
Northwest 33 13 1,418,469 1,623,222 0.040 0.035
North Central 28 13 469,542 530,513 0.23 0.20
Northeast 43 13 1,411,176 1,642,728 0.06 0.05
Central West 40 13 2,682,795 3,075,587 0.09 0.08
Central 36 13 4,673,897 5,478,123 0.06 0.05
Central East 41 13 1,441,275 1,654,824 0.18 0.16
Southwest 45 13 1,942,406 2,272,976 0.13 0.11
Southeast 43 13 4,373,075 7,143,320 0.06 0.04
Statewide 40 13 18,427,044 21,189,571 0.08 0.07
* Percent of participation represents the percentage of residents and tourists who participated in activity at least one time during the year** Total participants represents the combined number of residents and tourists who participated in activity at least one time during the yearBOLD numbers represent a number below the statewide median.

H-15
Bicycle Riding - Paved TrailsLevel of Service
0.00
0.05
0.10
0.15
0.20
0.25
Northwest North Central Northeast Central West Central Central East Southwest Southeast
Mile
s of
Tra
il/1,
000
Parti
cipa
nts
20112020Median
2011 2020 Median
Bicycle Riding - Paved Trails: Level of Service Comparisons
In theory, one could ride a bicycle for recreation almost anywhere in Florida due to the easy availability of public roadways. In reality, however, paved trails that are specifically designed for bicycling are actually quite limited and are vital for full and safe public enjoyment of this activity. The participation rates identified in Responsive Management’s resident and tourist surveys reflected both types of bicycling. Bicycling on paved surfaces is a very popular activity in Florida, accounting for more than 14.8 million participants. Statewide, 40 percent of residents and 13 percent of visitors participated. Resident participation rates were highest in the Southwest, Southeast and Northeast regions with the Central East and Central West regions following closely.
The North Central, Central East and Southwest regions had the three highest levels of service in the state. Levels of service were lowest in the Southeast and Northwest regions. While the Southeast has a comparable amount of opportunities, high demand and greater population contribute to the regions lower level of service. Paved biking trails remain a statewide need, as they provide not only recreation opportunities, but allow for safer alternative transportation.
Bicycle Riding - Unpaved TrailsUnpaved trails are the preferred surfaces for “mountain biking,” a more rugged and athletic style of bicycle riding than its paved surface counterpart. Despite the physical requirements and somewhat specialized equipment that are needed to participate in the activity, biking on unpaved trails was enjoyed by nearly 6.5 million participants. It is mostly a resident activity, with only four percent of tourists participating. Resident participation was distributed fairly evenly across regions, Central East region leading the others.
Similar to bicycle riding on paved trails, levels of service were highest in the North Central, Central East and Southwest regions. These regions had some of the highest supply levels of all the regions. Level of service was lowest in the Southeast region, where high demand and larger populations strain a short supply.

H-16
Bicycle Riding - Unpaved TrailsLevel of Service Comparisons
0.00
0.50
1.00
1.50
2.00
2.50
3.00
3.50
Northwest North Central Northeast Central West Central Central East Southwest Southeast
Mile
s of
Tra
il/1,
000
Parti
cipa
nts
20112020Median
Bicycle Riding - Unpaved Trails: Level of Service Comparisons
HikingLike other recreational trail activities, hiking’s popularity has increased in recent years as a result of increased public education and promotion and the volunteer efforts of the Florida Trail Association. Florida has more than 11,000 miles of trails open to hiking, most of which are located on the state’s public lands. They provide a diverse range of hiking experiences,
Region% of Participation* Total Participation** Level of Service
(Miles of Trail/1,000 Participants)
Residents Tourists 2011 2020 2011 2020
Northwest 11 4 459,548 525,748 0.46 0.40
North Central 15 4 205,004 230,188 3.22 2.87
Northeast 17 4 509,405 593,209 0.73 0.63
Central West 15 4 919,229 1,052,783 0.51 0.45
Central 14 4 1,595,599 1,873,145 0.40 0.34
Central East 18 4 548,923 629,065 1.38 1.20
Southwest 17 4 668,612 782,919 0.76 0.65
Southeast 17 4 1,586,045 1,666,208 0.10 0.09
Statewide 16 4 6,490,027 7,454,373 0.58 0.51
* Percent of participation represents the percentage of residents and tourists who participated in activity at least one time during the year** Total participants represents the combined number of residents and tourists who participated in activity at least one time during the yearBOLD numbers represent a number below the statewide median.
2011 2020 Median

H-17
Hiking 2011-2020 Regional Level of Service Comparisons
0
0.2
0.4
0.6
0.8
1
1.2
1.4
1.6
1.8
Northwest North Central Northeast Central West Central Central East Southwest Southeast
Mile
s of
Tra
il/1,
000
Parti
cipa
nts
20112020Median
from a day’s hike to a long-distance trek, from one end of the state to the other. Nearly 24 million people participated in hiking during 2011, with relatively equivalent participation rates between residents and tourists, 21 percent and 22 percent, respectively. Among residents, the highest participation rates were in the North Central, Central East and Northwest regions.
Along with having the highest participation rates, the North Central, Central East and Northwest regions also had the highest levels of service. Levels of service were lowest in the Central and Southeast regions. Hiking trails are in short supply in the Southeast region, and both regions have high resident and tourist populations.
Hiking: Level of Service Comparisons
Region% of Participation* Total Participation** Level of Service
(Miles of Trail/1,000 Participants)
Residents Tourists 2011 2020 2011 2020
Northwest 30 22 2,202,607 2,535,410 1.32 1.15
North Central 32 22 671,004 762,112 1.55 1.36
Northeast 25 22 1,711,014 1,988,760 0.32 0.27
Central West 29 22 3,512,307 4,048,624 0.26 0.22
Central 29 22 7,043,045 8,217,546 0.22 0.19
Central East 32 22 1,856,932 2,141,360 0.67 0.58
Southwest 27 22 2,413,143 2,811,953 0.46 0.39
Southeast 13 22 4,609,322 5,259,255 0.12 0.11
Statewide 21 22 23,918,341 27,632,916 0.77 0.40
* Percent of participation represents the percentage of residents and tourists who participated in activity at least one time during the year** Total participants represents the combined number of residents and tourists who participated in activity at least one time during the yearBOLD numbers represent a number below the statewide median.
2011 2020 Median
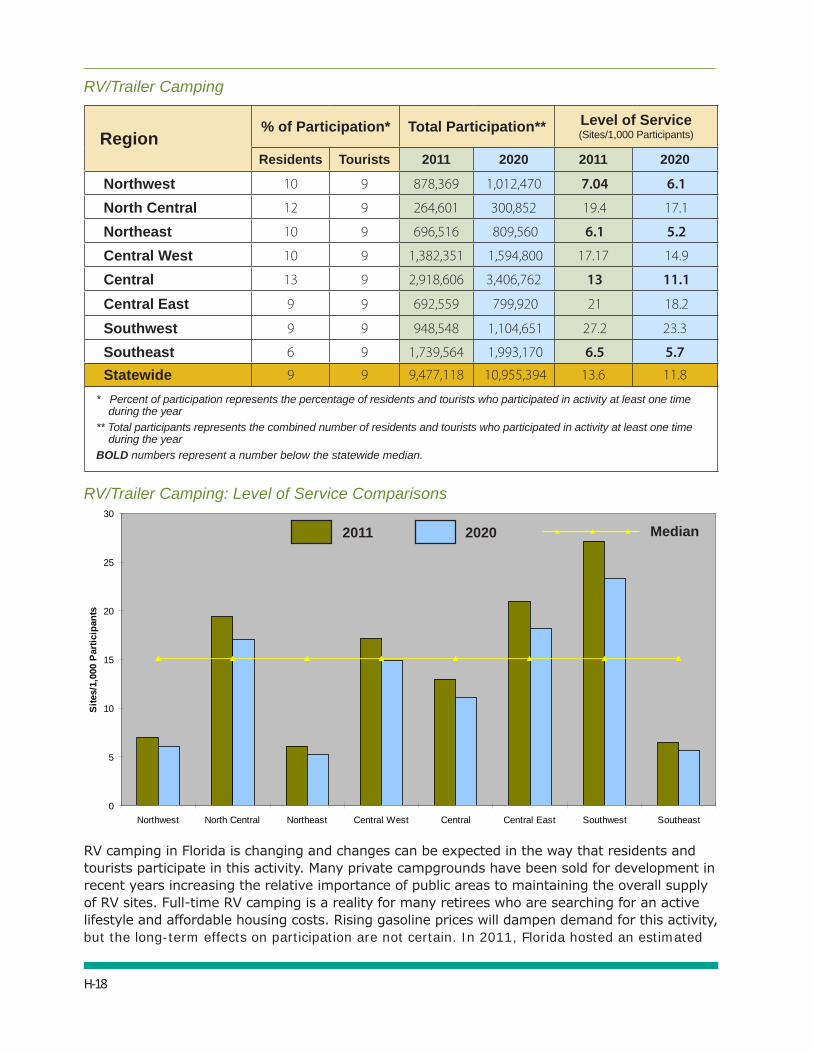
H-18
RV/Trailer CampingLevel of Service Comparisons
0
5
10
15
20
25
30
Northwest North Central Northeast Central West Central Central East Southwest Southeast
Site
s/1,
000
Parti
cipa
nts
20112020Median
RV/Trailer Camping
RV/Trailer Camping: Level of Service Comparisons
RV camping in Florida is changing and changes can be expected in the way that residents and tourists participate in this activity. Many private campgrounds have been sold for development in recent years increasing the relative importance of public areas to maintaining the overall supply of RV sites. Full-time RV camping is a reality for many retirees who are searching for an active lifestyle and affordable housing costs. Rising gasoline prices will dampen demand for this activity, but the long-term effects on participation are not certain. In 2011, Florida hosted an estimated
Region% of Participation* Total Participation** Level of Service
(Sites/1,000 Participants)
Residents Tourists 2011 2020 2011 2020
Northwest 10 9 878,369 1,012,470 7.04 6.1
North Central 12 9 264,601 300,852 19.4 17.1
Northeast 10 9 696,516 809,560 6.1 5.2
Central West 10 9 1,382,351 1,594,800 17.17 14.9
Central 13 9 2,918,606 3,406,762 13 11.1
Central East 9 9 692,559 799,920 21 18.2
Southwest 9 9 948,548 1,104,651 27.2 23.3
Southeast 6 9 1,739,564 1,993,170 6.5 5.7
Statewide 9 9 9,477,118 10,955,394 13.6 11.8
* Percent of participation represents the percentage of residents and tourists who participated in activity at least one time during the year** Total participants represents the combined number of residents and tourists who participated in activity at least one time during the yearBOLD numbers represent a number below the statewide median.
2011 2020 Median

H-19
Tent Camping 2011-2020 Regional Level of Service Comparisons
0
0.5
1
1.5
2
2.5
3
Northwest North Central Northeast Central West Central Central East Southwest Southeast
Site
s/1,
000
Parti
cipa
nts
20112020Median
2011 2020 Median
9.5 million resident and tourist RV/trailer campers. Resident and tourist participation rates were both 9 percent, with the highest rates clustered in the Central and North Central regions.
Significant regional differences in levels of service were found. The Southwest region stood out as having the highest level of service of any region, followed by the Central East. The Northeast region, where fewer sites exist and demand is high, had the lowest level of service.
Tent Camping
Tent Camping: Level of Service Comparisons
Region% of Participation* Total Participation** Level of Service
(Sites/1,000 Participants)
Residents Tourists 2011 2020 2011 2020
Northwest 15 7 755,303 866,105 1.87 1.63
North Central 22 7 320,752 360,802 2.67 2.37
Northeast 20 7 726,981 846,040 0.89 0.76
Central West 18 7 1,374,111 1,577,488 0.75 0.65
Central 21 7 2,628,026 3,081,274 0.63 0.54
Central East 18 7 719,068 826,760 0.83 0.72
Southwest 13 7 851,124 993,207 0.85 0.73
Southeast 13 7 1,822,804 2,059,535 0.58 0.51
Statewide 17 7 9,251,223 10,653,522 0.79 0.75
* Percent of participation represents the percentage of residents and tourists who participated in activity at least one time during the year** Total participants represents the combined number of residents and tourists who participated in activity at least one time during the yearBOLD numbers represent a number below the statewide median.

H-20
To most participants, tent camping is a distinctly different recreational experience than RV/trailer camping. While many tent campers enjoy having the same amenities as their counterparts in recreational vehicles, most prefer to camp in areas that have been designated specifically for tent camping. Tent campers have the added advantage of being able to take their equipment with them to more remote sites that offer the solitude not found in most RV campground settings. Tent camping more popular among residents than tourists (17 percent of residents participated compared to 7 percent of tourists). Statewide, more than 10 million people went tent camping in 2011. The North Central, Central and Northeast regions showed the highest participation rates among residents.
The highest levels of service were found in the Northwest and North Central regions. Levels of service were lowest in the Central and Southeast regions, where populations are much higher and fewer state and federal lands provide tent camping.
Off-Highway Vehicle Riding
Riding off-highway vehicles (OHVs) is growing in popularity in Florida, especially among families, and participation is expected to increase as new areas for OHV riding are provided. However, it is not an activity that reaches a large segment of the public. Nevertheless, more than 8.8 million people were estimated to have participated in OHV riding in 2011. The South, East Central and Tampa Bay regions displayed the highest number of participants; the North Central and Central regions had the highest rates of resident participation. Regional levels of service were highest in the Southwest and Central East regions. Levels of service and resource/facility requirements could not be calculated in five regions because no inventoried OHV trails existed in those regions. However, all of those regions displayed significant participation in OHV riding among residents and measurable levels of participation among tourists. OHV trails undoubtedly exist in these regions, but are located on lands that could not be practicably inventoried for this plan. Statewide, nearly 180 miles of additional
Region% of Participation* Total Participation** Level of Service
(Miles of Trail/1,000 Participants)
Residents Tourists 2011 2020 2011 2020
Northwest 12 8 811,843 933,844 0.46 0.40
North Central 23 8 347,128 390,893 0.2 0.18
Northeast 15 8 711,748 827,800 0.07 0.06
Central West 15 8 1,407,476 1,619,120 0.021 0.019
Central 21 8 2,904,826 3,402,554 0.044 0.038
Central East 13 8 697,613 804,040 0.05 0.04
Southwest 11 8 899,836 1,048,929 0.06 0.05
Southeast 13 8 1,978,504 2,240,255 NC NC
Statewide 15 8 9,740,197 11,230,990 0.07 0.06
* Percent of participation represents the percentage of residents and tourists who participated in activity at least one time during the year** Total participants represents the combined number of residents and tourists who participated in activity at least one time during the yearBOLD numbers represent a number below the statewide median.
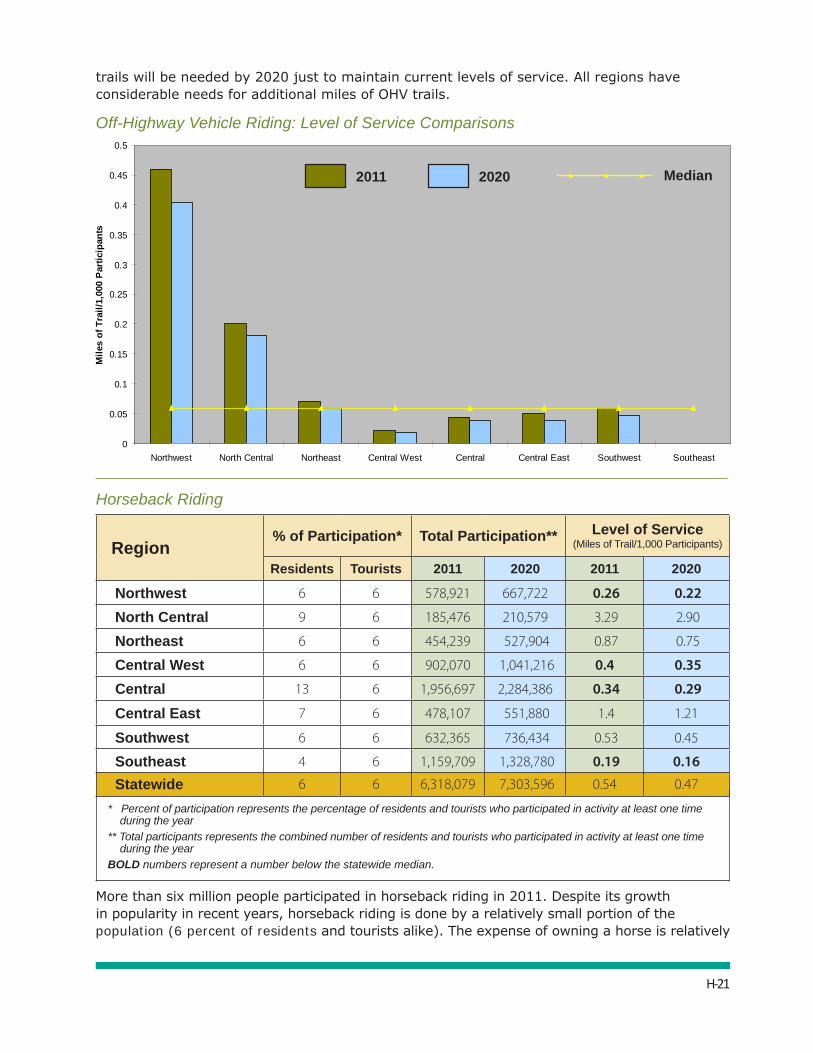
H-21
Off-Highway Vehicle RidingLevel of Service Comparisons
0
0.05
0.1
0.15
0.2
0.25
0.3
0.35
0.4
0.45
0.5
Northwest North Central Northeast Central West Central Central East Southwest Southeast
Mile
s of
Tra
il/1,
000
Parti
cipa
nts
20112020Median
trails will be needed by 2020 just to maintain current levels of service. All regions have considerable needs for additional miles of OHV trails.
Off-Highway Vehicle Riding: Level of Service Comparisons
Horseback Riding
More than six million people participated in horseback riding in 2011. Despite its growth in popularity in recent years, horseback riding is done by a relatively small portion of the population (6 percent of residents and tourists alike). The expense of owning a horse is relatively
2011 2020 Median
Region% of Participation* Total Participation** Level of Service
(Miles of Trail/1,000 Participants)
Residents Tourists 2011 2020 2011 2020
Northwest 6 6 578,921 667,722 0.26 0.22
North Central 9 6 185,476 210,579 3.29 2.90
Northeast 6 6 454,239 527,904 0.87 0.75
Central West 6 6 902,070 1,041,216 0.4 0.35
Central 13 6 1,956,697 2,284,386 0.34 0.29
Central East 7 6 478,107 551,880 1.4 1.21
Southwest 6 6 632,365 736,434 0.53 0.45
Southeast 4 6 1,159,709 1,328,780 0.19 0.16
Statewide 6 6 6,318,079 7,303,596 0.54 0.47
* Percent of participation represents the percentage of residents and tourists who participated in activity at least one time during the year** Total participants represents the combined number of residents and tourists who participated in activity at least one time during the yearBOLD numbers represent a number below the statewide median.

H-22
Horseback RidingLevel of Service Comparisons
0
0.5
1
1.5
2
2.5
3
3.5
Northwest North Central Northeast Central West Central Central East Southwest Southeast
Mile
s of
Tra
il/1,
000
Parti
cipa
nts
20112020Median
high and most people lack the necessary space to quarter horses. This can be alleviated to some extent in areas where horses are available for rent. Resident participation rates were highest in some of the Central and North Central regions. Future participation in horseback riding will be influenced by the continued availability of trails on private land and whether the loss of opportunities on those areas is compensated by new opportunities on public lands.
The highest levels of service were found in the North Central and Central East regions. These regions have some of the largest supplies of horseback riding trails in the state. Levels of service were lowest in the Northwest and Southeast regions where trails are in shorter supply.
Horseback Riding: Level of Service Comparisons
HuntingHunting ranked 22nd in resident participation among the 26 recreation activities surveyed. As with horseback riding, the development of agricultural lands and loss of public access to large private landholdings have combined to reduce the amount of land available for public hunting. These reductions, together with the loss of wildlife habitat that has occurred throughout the state as a result of urban development, have combined to increase the pressure for hunting on public land. An estimated 4.7 million people hunted in Florida during 2011, most of them residents (11 percent compared to 3 percent tourists). The largest numbers of hunters lived in the heavily populated Central and Southeast regions, and the highest participation rates were found among residents of the North Central and Central regions. The supply of available hunting lands is generally greatest in the northern part of the state. Large tracts in the southern portion of Florida are open to hunting, but are primarily wetlands and not nearly as accessible.
Regional levels of service for hunting vary widely. The Northwest and North Central regions, with their relatively small population and large supply of public hunting land, stood out as having the highest level of service. In contrast, the Central West and Central regions, with large populations and fewer public hunting lands, had the lowest levels of service.
2011 2020 Median

H-23
HuntingLevel of Service Comparisons
-
500
1,000
1,500
2,000
2,500
3,000
3,500
4,000
Northwest North Central Northeast Central West Central Central East Southwest Southeast
Acre
s/1,
000
Parti
cipa
nts
20112020Median
Hunting: Level of Service Comparisons
USER-ORIENTED ACTIVITIES
User-oriented recreation describes a selected range of activities that can be placed for the convenience of the user to take advantage of proximity to population centers. Many of these facilities are provided by local governments and private entities. For the purpose of this document, levels of service for the following activities have been assessed: Baseball, Basketball, Football, Geocaching, Golf, Outdoor Swimming (in pools), Soccer and Tennis. The following charts illustrate the levels of service for these aforementioned activities.
Region% of Participation* Total Participation** Level of Service
(Acres/1,000 Participants)
Residents Tourists 2011 2020 2011 2020
Northwest 13 3 389,330 442,731 3,782 3,326
North Central 18 3 215,252 240,438 3,028 2,710
Northeast 10 3 333,216 387,880 839 721
Central West 10 3 655,751 751,440 506 432
Central 17 3 1,389,316 1,637,618 332 282
Central East 12 3 378,462 434,040 925 807
Southwest 7 3 391,759 457,573 2,086 1,786
Southeast 7 3 861,741 969,965 1,216 1,080
Statewide 11 3 4,663,144 5,357,926 1,159 1,009
* Percent of participation represents the percentage of residents and tourists who participated in activity at least one time during the year** Total participants represents the combined number of residents and tourists who participated in activity at least one time during the yearBOLD numbers represent a number below the statewide median.
2011 2020 Median

H-24
BaseballLevel of Service Comparisons
0
0.2
0.4
0.6
0.8
1
1.2
1.4
1.6
1.8
Northwest North Central Northeast Central West Central Central East Southwest Southeast
Fiel
ds/1
,000
Par
ticip
ants
20112020Median
Baseball
Baseball: Level of Service Comparisons
Region% of Participation* Total Participation** Level of Service
(Fields/1,000 Participants)
Residents Tourists 2011 2020 2011 2020
Northwest 16 3 419,290 475,392 1.48 1.31
North Central 21 3 242,477 270,471 1.67 1.50
Northeast 13 3 378,685 440,992 1.53 1.32
Central West 15 3 801,976 916,320 1.04 0.91
Central 15 3 1,323,561 1,558,350 0.77 0.65
Central East 15 3 427,665 489,840 1.47 1.28
Southwest 11 3 467,336 546,929 1.00 0.85
Southeast 15 3 1,312,759 1,458,885 0.88 0.79
Statewide 15 3 5,415,197 6,210,990 1.05 0.92
* Percent of participation represents the percentage of residents and tourists who participated in activity at least one time during the year** Total participants represents the combined number of residents and tourists who participated in activity at least one time during the yearBOLD numbers represent a number below the statewide median.
2011 2020 Median

H-25
BasketballLevel of Service Comparisons
-
0.50
1.00
1.50
2.00
2.50
3.00
3.50
Northwest North Central Northeast Central West Central Central East Southwest Southeast
Cour
ts/1
,000
Par
ticip
ants
20112020Median
Basketball
Basketball: Level of Service Comparisons
Region% of Participation* Total Participation** Level of Service
(Courts/1,000 Participants)
Residents Tourists 2011 2020 2011 2020
Northwest 8 4 425,895 488,696 0.99 0.86
North Central 17 4 223,477 250,507 3.31 2.95
Northeast 16 4 484,705 564,384 1.40 1.20
Central West 13 4 864,586 990,928 1.43 1.25
Central 15 4 1,600,361 1,879,630 0.83 0.71
Central East 9 4 389,809 448,520 2.62 2.27
Southwest 9 4 516,048 602,651 1.00 0.86
Southeast 19 4 1,693,968 1,884,065 1.27 1.14
Statewide 15 4 6,280,197 7,214,990 1.29 1.12
* Percent of participation represents the percentage of residents and tourists who participated in activity at least one time during the year** Total participants represents the combined number of residents and tourists who participated in activity at least one time during the yearBOLD numbers represent a number below the statewide median.
2011 2020 Median

H-26
FootballLevel of Service Comparisons
0
0.2
0.4
0.6
0.8
1
1.2
Northwest North Central Northeast Central West Central Central East Southwest Southeast
Fiel
ds/1
,000
Par
ticip
ants
20112020Median
Football
Football: Level of Service Comparisons
Region% of Participation* Total Participation** Level of Service
(Fields/1,000 Participants)
Residents Tourists 2011 2020 2011 2020
Northwest 8 2 252,895 287,896 0.65 0.57
North Central 14 2 161,652 180,314 0.82 0.74
Northeast 13 2 318,135 370,712 0.59 0.51
Central West 10 2 534,651 610,880 0.57 0.50
Central 10 2 882,374 1,038,900 0.36 0.31
Central East 6 2 219,506 252,160 1.03 0.90
Southwest 9 2 343,048 401,851 0.56 0.48
Southeast 13 2 1,044,304 1,155,935 0.53 0.48
Statewide 11 2 3,798,144 4,353,926 0.56 0.49
* Percent of participation represents the percentage of residents and tourists who participated in activity at least one time during the year** Total participants represents the combined number of residents and tourists who participated in activity at least one time during the yearBOLD numbers represent a number below the statewide median.
2011 2020 Median
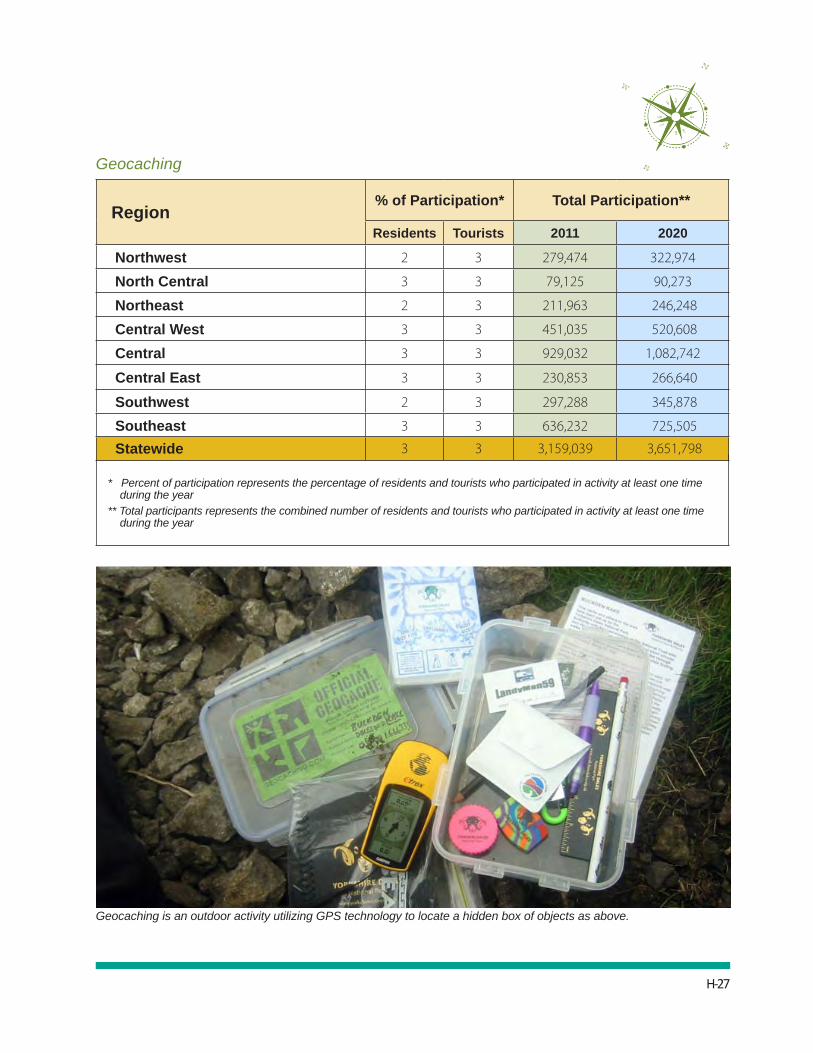
H-27
Geocaching
Region% of Participation* Total Participation**
Residents Tourists 2011 2020
Northwest 2 3 279,474 322,974
North Central 3 3 79,125 90,273
Northeast 2 3 211,963 246,248
Central West 3 3 451,035 520,608
Central 3 3 929,032 1,082,742
Central East 3 3 230,853 266,640
Southwest 2 3 297,288 345,878
Southeast 3 3 636,232 725,505
Statewide 3 3 3,159,039 3,651,798
* Percent of participation represents the percentage of residents and tourists who participated in activity at least one time during the year** Total participants represents the combined number of residents and tourists who participated in activity at least one time during the year
Geocaching is an outdoor activity utilizing GPS technology to locate a hidden box of objects as above.

H-28
GolfLevel of Services Comparisons
-
0.50
1.00
1.50
2.00
2.50
Northwest North Central Northeast Central West Central Central East Southwest Southeast
Hole
s/1,
000
Parti
cipa
nts
20112020Median
Golf
Golf: Level of Service Comparisons
Region% of Participation* Total Participation** Level of Service
(Holes/1,000 Participants)
Residents Tourists 2011 2020 2011 2020
Northwest 10 11 1,051,369 1,213,270 1.01 0.87
North Central 13 11 308,276 351,023 1.37 1.21
Northeast 17 11 923,712 1,074,048 1.42 1.22
Central West 17 11 1,829,266 2,106,752 1.36 1.19
Central 17 11 3,603,716 4,207,858 0.80 0.68
Central East 17 11 944,867 1,089,280 2.26 1.96
Southwest 20 11 1,329,384 1,551,180 2.27 1.94
Southeast 11 11 2,332,850 2,660,185 2.15 1.89
Statewide 15 11 12,335,197 14,242,990 1.49 1.29
* Percent of participation represents the percentage of residents and tourists who participated in activity at least one time during the year** Total participants represents the combined number of residents and tourists who participated in activity at least one time during the yearBOLD numbers represent a number below the statewide median.
2011 2020 Median

H-29
Outdoor Swimming Pool UseLevel of Service Comparisons
0
0.02
0.04
0.06
0.08
0.1
0.12
Northwest North Central Northeast Central West Central Central East Southwest Southeast
Pool
s/1,
000
Parti
cipa
nts
20112020Median
Outdoor Swimming Pool Use
Outdoor Swimming Pool Use: Level of Service Comparisons
Region% of Participation* Total Participation** Level of Service
(Pools/1,000 Participants)
Residents Tourists 2011 2020 2011 2020
Northwest 18 29 2,688,264 3,107,566 0.04 0.04
North Central 32 29 792,104 902,672 0.1 0.09
Northeast 26 29 2,150,021 2,498,424 0.06 0.05
Central West 29 29 4,360,007 5,032,544 0.06 0.06
Central 29 29 8,980,645 10,466,506 0.04 0.04
Central East 21 29 2,100,371 2,428,720 0.09 0.08
Southwest 28 29 3,037,537 3,537,092 0.1 0.09
Southeast 34 29 6,432,127 7,318,790 0.08 0.07
Statewide 29 29 30,537,380 35,300,714 0.07 0.06
* Percent of participation represents the percentage of residents and tourists who participated in activity at least one time during the year** Total participants represents the combined number of residents and tourists who participated in activity at least one time during the yearBOLD numbers represent a number below the statewide median.
2011 2020 Median

H-30
SoccerLevel of Service Comparisons
-
0.20
0.40
0.60
0.80
1.00
1.20
Northwest North Central Northeast Central West Central Central East Southwest Southeast
Fiel
ds/1
,000
Par
ticip
ants
20112020Median
Soccer
Soccer: Level of Service Comparisons
Region% of Participation* Total Participation** Level of Service
(Fields/1,000 Participants)
Residents Tourists 2011 2020 2011 2020
Northwest 5 2 222,934 255,235 0.74 0.65
North Central 10 2 125,351 140,270 1.06 0.95
Northeast 7 2 227,196 264,488 0.83 0.71
Central West 11 2 563,896 643,856 0.54 0.47
Central 11 2 915,252 1,078,534 0.35 0.30
Central East 9 2 268,709 307,960 0.84 0.74
Southwest 10 2 361,942 424,190 0.53 0.45
Southeast 15 2 1,157,059 1,278,165 0.48 0.43
Statewide 11 2 3,798,144 4,353,926 0.56 0.49
* Percent of participation represents the percentage of residents and tourists who participated in activity at least one time during the year** Total participants represents the combined number of residents and tourists who participated in activity at least one time during the yearBOLD numbers represent a number below the statewide median.
2011 2020 Median

H-31
TennisLevel of Service Comparisons
-
0.50
1.00
1.50
2.00
2.50
Northwest North Central Northeast Central West Central Central East Southwest Southeast
Cour
ts/1
,000
Par
ticip
ants
20112020Median
Tennis
Tennis: Level of Service Comparisons
Region% of Participation* Total Participation** Level of Service
(Courts/1,000 Participants)
Residents Tourists 2011 2020 2011 2020
Northwest 9 5 522,382 599,983 0.99 0.86
North Central 11 5 186,326 210,521 2.00 1.77
Northeast 15 5 530,098 616,960 1.15 0.99
Central West 11 5 927,196 1,065,536 1.31 1.14
Central 8 5 1,647,019 1,923,472 0.72 0.61
Central East 13 5 515,963 593,200 1.93 1.68
Southwest 13 5 678,124 792,407 1.70 1.46
Southeast 14 5 1,567,782 1,759,210 2.00 1.78
Statewide 12 5 6,581,157 7,579,192 1.40 1.21
* Percent of participation represents the percentage of residents and tourists who participated in activity at least one time during the year** Total participants represents the combined number of residents and tourists who participated in activity at least one time during the yearBOLD numbers represent a number below the statewide median.
2011 2020 Median


I-1
Cabi
ns
37
33
-
-
-
4
-
-
-
Tent
Cam
psite
s 1
,026
591
2
5
13
5
0
135
1
6
111
8
5 RV
Cam
psite
s 2
,138
529
2
0
12
2
94
545
1
38
201
3
99
His
tori
c Si
tes
390
24
12
2
39
1
5
95
1
3
1
Com
mem
orat
ive
Stru
ctur
es
9
-
2
7
-
-
-
-
-
M
useu
ms
25
4
3
3
1
5
4
5
Pi
cnic
Tab
les
1,9
66
99
1
69
2
72
68
1
96
173
1
06
91
Hun
ting
Are
as (A
cres
) 2,
065,
648
557,
328
4
43,3
37
84,
268
6
,736
3
37,9
27
40,1
94
412,
358
1
83,5
00
Bike
Tra
ils (M
iles
Pave
d)
73.
5
-
-
2
.5
-
-
-
71
-
Bi
ke T
rails
(Mile
s U
npav
ed)
144
36
68.
9
1.2
5
12
9
1
2 Ca
noe
Trai
ls (M
iles)
5
17
13
5.4
6
6
5.1
2
0
25
1
5.5
2
6
224
.0
Hik
ing
Trai
ls (M
iles)
9
74
39
0.8
4
4.5
2
.4
1
170
.7
37.
7
125
.7
53.
6 Eq
uest
rian
Tra
ils (M
iles)
12
0.7
36.5
5
6
-
-
16
1
2.2
-
-
Jo
ggin
g Tr
ails
(Mile
s)
71.
4
41
.7
-
5.5
7
.5
7.7
-
9
-
O
HV
Trai
ls (M
iles)
4
01
22
6
-
-
-
125
-
5
0
-
Nat
ure
Trai
ls (M
iles)
3
10
13
2
34.
5
4.2
4
.3
15.
9
25.
4
82.
3
11.
3 Fr
eshw
ater
Bea
ch (M
iles)
0
.7
0.
3
-
-
-
0.4
-
-
-
Fr
eshw
ater
Boa
t Ram
ps
89
45
6
4
-
24
3
2
5
Fr
eshw
ater
Boa
t Ram
ps (L
anes
) 9
8
46
7
5
-
2
8
3
2
7
Fres
hwat
er C
atw
alks
1
2
7
1
-
1
1
1
1
Fr
eshw
ater
Cat
wal
ks (F
eet)
9
07
28
7
300
-
-
1
00
1
20
100
Fr
eshw
ater
Jett
ies
120
120
-
-
-
Fres
hwat
er M
arin
as
6
2
-
-
-
1
2
1
1
Fr
eshw
ater
Mar
inas
(Slip
s)
51
13
-
-
-
12
1
6
8
2
Fres
hwat
er P
iers
2
7
15
1
3
-
5
-
3
40
-
Fres
hwat
er P
iers
(Fee
t)
4,51
5
3,
750
9
0
75
-
2
60
-
3
-
Salt
wat
er B
each
(Mile
s)
139
99
-
1
2.6
N
A
33.
8
2
0.9
Sa
ltw
ater
Boa
t Ram
ps
35
12
4
-
1
NA
1
3
1
4
Salt
wat
er B
oat R
amps
(Lan
es)
52
18
4
-
2
NA
1
9
1
8
Salt
wat
er C
atw
alks
5
3
15
3
-
1
N
A
33
-
1
Sa
ltw
ater
Cat
wal
ks (F
eet)
2
3,04
4
15
,025
3
5
-
175
N
A
7,4
27
-
382
Sa
ltw
ater
Jett
ies
10,
120
1,00
0
30
1
,250
4
0
NA
-
-
7
,800
Sa
ltw
ater
Mar
inas
1
1
7
-
-
1
N
A
2
-
1
Salt
wat
er M
arin
a Sl
ips
698
413
-
-
3
5
NA
1
50
-
100
Sa
ltw
ater
Pie
rs
17
6
4
-
1
NA
4
1
1
Sa
ltw
ater
Pie
rs (F
eet)
7
,506
5,95
0
862
-
6
0
NA
4
84
50
1
00
Base
ball
Fiel
ds
51
18
-
16
6
-
9
1
1
Ba
sket
ball
Goa
ls
55
14
-
9
2
-
24
6
Equi
pped
Pla
y A
reas
5
2
5
-
2
1
3
-
19
1
3
Fo
otba
ll Fi
elds
1
8
6
-
3
3
-
6
-
-
G
olf C
ours
es, 1
8-H
ole
8
4
-
1
2
-
1
-
-
G
olf C
ours
es, 9
-Hol
e 5
2
-
3
-
-
-
-
-
Gol
f Cou
rses
, Exe
cutiv
e 1
1
-
-
-
-
-
-
-
Gol
f Hol
es (T
otal
) 2
07
10
8
-
45
3
6
-
18
-
-
M
ulti-
Use
Car
ts
6
1
-
-
4
-
-
1
Mul
ti-U
se F
ield
s 9
4
-
2
-
-
2
-
1
Out
door
Sw
imm
ing
Pool
s 1
5
6
-
3
2
-
4
-
-
Ra
cque
tbal
l Cou
rts
19
4
-
6
-
-
8
1
-
Shuffl
eboa
rd C
ourt
s 6
2
-
-
-
-
4
-
-
Tenn
is C
ourt
s 7
8
33
-
2
8
6
-
8
-
3
Volle
ybal
l Cou
rts
1
-
-
-
-
-
-
1
-
Faci
litie
sN
orth
wes
tN
orth
Ce
ntra
lN
orth
east
Cent
ral
Wes
tCe
ntra
lCe
ntra
lEa
stSo
uthw
est
Sout
heas
tSt
atew
ide
RESOURCE BASED USER ORIENTED
37
1,02
62,
138
390 9 25
1,96
62,
065,
648
73.5
144
517
974
120.
771
.440
131
0 0.
789 98 12 90
712
0 6 51 274,
515
139
35 52 5323
,044
10,1
2011 69
817
7,50
6
51 55 52 18 8 5 1 207 6 9 15 19 6 78 1
Fede
ral A
genc
y O
utdo
or R
ecre
atio
n R
esou
rces
and
Fac
ilitie
s 20
12Appendix I - Supply Charts by Agency
FEDERAL AGENCIES

I-2
RESOURCE BASED (Land) RESOURCE BASED (Water)
Cabins - Freshwater Beach (Miles) -
Tent Campsites 201 Freshwater Boat Ramps 2
RV Campsites 717 Freshwater Boat Ramps (Lanes) 2
Historic Sites 324 Freshwater Catwalks -
Commemorative Structures 2 Freshwater Catwalks (Feet) -
Museums 11 Freshwater Jetties (Feet) -
Picnic Tables 642 Freshwater Marinas 1
Hunting Areas (Acres) - Freshwater Marinas (Slips) 2
Bike Trails Paved (Miles) 70 Freshwater Piers -
Bike Trails Unpaved (Miles) - Freshwater Piers (Feet) -
Canoe Trails (Miles) 242 Saltwater Beach (Miles) 75
Hiking Trails (Miles) 207 Saltwater Boat Ramps 10
Equestrian Trails (Miles) 12 Saltwater Boat Ramps (Lanes) 15
Jogging Trails (Miles) - Saltwater Catwalks 38
OHV Trails (Miles) 50 Saltwater Catwalks (Feet) 16,359
Nature Trails (Miles) 94 Saltwater Jetties (Feet) 8,450
Saltwater Marinas 1
Saltwater Marina Slips 100
Saltwater Piers 4
Saltwater Piers 384
National Park Service Inventory TotalsOutdoor Recreation Areas 11
TOTAL ACRES 2,595,034

I-3
RESOURCE BASED (Land) RESOURCE BASED (Water)
Cabins - Freshwater Beach (Miles) -
Tent Campsites - Freshwater Boat Ramps 5
RV Campsites - Freshwater Boat Ramps (Lanes) 8
Historic Sites 23 Freshwater Catwalks 3
Commemorative Structures - Freshwater Catwalks (Feet) 400
Museums 8 Freshwater Jetties (Feet) -
Picnic Tables 25 Freshwater Marinas -
Hunting Areas (Acres) 157,709 Freshwater Marinas (Slips) -
Bike Trails Paved (Miles) 1 Freshwater Piers 1
Bike Trails Unpaved (Miles) 102 Freshwater Piers (Feet) 90
Canoe Trails (Miles) 145 Saltwater Beach (Miles) 21.1
Hiking Trails (Miles) 297 Saltwater Boat Ramps 9
Equestrian Trails (Miles) 6 Saltwater Boat Ramps (Lanes) 11
Jogging Trails (Miles) 9 Saltwater Catwalks 3
OHV Trails (Miles) - Saltwater Catwalks (Feet) 35
Nature Trails (Miles) 145.6 Saltwater Jetties (Feet) 30
Saltwater Marinas -
Saltwater Marina Slips -
Saltwater Piers 4
Saltwater Piers 862
U.S. Fish and Wildlife Service Inventory TotalsOutdoor Recreation Areas 28
TOTAL ACRES 984176
RESOURCE BASED (Land) RESOURCE BASED (Water)
Cabins 4 Freshwater Beach (Miles) 0.6
Tent Campsites 196 Freshwater Boat Ramps 37
RV Campsites 638 Freshwater Boat Ramps (Lanes) 41
Historic Sites 12 Freshwater Catwalks -
Commemorative Structures 2 Freshwater Catwalks (Feet) -
Museums 2 Freshwater Jetties (Feet) -
Picnic Tables 361 Freshwater Marinas 1
Hunting Areas (Acres) 1,069,605 Freshwater Marinas (Slips) 12
Bike Trails Paved (Miles) - Freshwater Piers 4
Bike Trails Unpaved (Miles) 30 Freshwater Piers (Feet) 300
Canoe Trails (Miles) 58 Saltwater Beach (Miles) -
Hiking Trails (Miles) 237 Saltwater Boat Ramps -
Equestrian Trails (Miles) 72 Saltwater Boat Ramps (Lanes) -
Jogging Trails (Miles) 33 Saltwater Catwalks -
OHV Trails (Miles) 351 Saltwater Catwalks (Feet) -
Nature Trails (Miles) 48 Saltwater Jetties (Feet) -
Saltwater Marinas -
Saltwater Marina Slips -
Saltwater Piers -
Saltwater Piers -
U.S. Forest Service Inventory TotalsOutdoor Recreation Areas 3
TOTAL ACRES 1,181,576
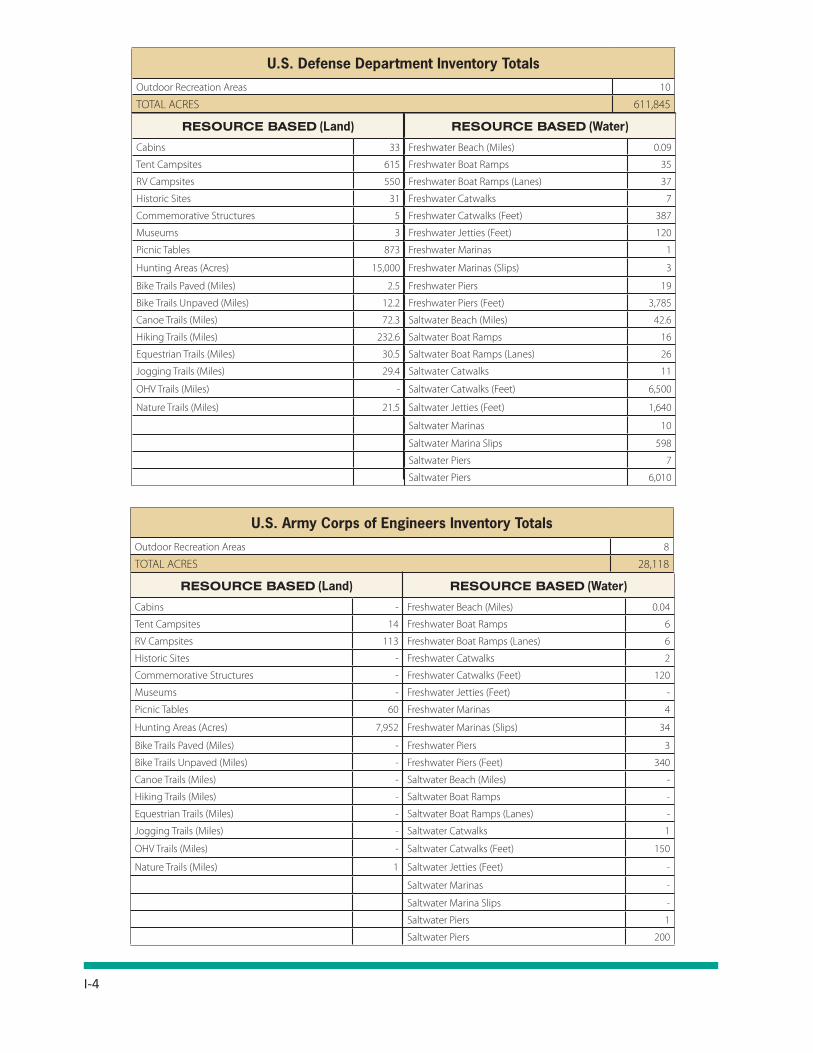
I-4
RESOURCE BASED (Land) RESOURCE BASED (Water)
Cabins - Freshwater Beach (Miles) 0.04
Tent Campsites 14 Freshwater Boat Ramps 6
RV Campsites 113 Freshwater Boat Ramps (Lanes) 6
Historic Sites - Freshwater Catwalks 2
Commemorative Structures - Freshwater Catwalks (Feet) 120
Museums - Freshwater Jetties (Feet) -
Picnic Tables 60 Freshwater Marinas 4
Hunting Areas (Acres) 7,952 Freshwater Marinas (Slips) 34
Bike Trails Paved (Miles) - Freshwater Piers 3
Bike Trails Unpaved (Miles) - Freshwater Piers (Feet) 340
Canoe Trails (Miles) - Saltwater Beach (Miles) -
Hiking Trails (Miles) - Saltwater Boat Ramps -
Equestrian Trails (Miles) - Saltwater Boat Ramps (Lanes) -
Jogging Trails (Miles) - Saltwater Catwalks 1
OHV Trails (Miles) - Saltwater Catwalks (Feet) 150
Nature Trails (Miles) 1 Saltwater Jetties (Feet) -
Saltwater Marinas -
Saltwater Marina Slips -
Saltwater Piers 1
Saltwater Piers 200
U.S. Army Corps of Engineers Inventory TotalsOutdoor Recreation Areas 8
TOTAL ACRES 28,118
RESOURCE BASED (Land) RESOURCE BASED (Water)
Cabins 33 Freshwater Beach (Miles) 0.09
Tent Campsites 615 Freshwater Boat Ramps 35
RV Campsites 550 Freshwater Boat Ramps (Lanes) 37
Historic Sites 31 Freshwater Catwalks 7
Commemorative Structures 5 Freshwater Catwalks (Feet) 387
Museums 3 Freshwater Jetties (Feet) 120
Picnic Tables 873 Freshwater Marinas 1
Hunting Areas (Acres) 15,000 Freshwater Marinas (Slips) 3
Bike Trails Paved (Miles) 2.5 Freshwater Piers 19
Bike Trails Unpaved (Miles) 12.2 Freshwater Piers (Feet) 3,785
Canoe Trails (Miles) 72.3 Saltwater Beach (Miles) 42.6
Hiking Trails (Miles) 232.6 Saltwater Boat Ramps 16
Equestrian Trails (Miles) 30.5 Saltwater Boat Ramps (Lanes) 26
Jogging Trails (Miles) 29.4 Saltwater Catwalks 11
OHV Trails (Miles) - Saltwater Catwalks (Feet) 6,500
Nature Trails (Miles) 21.5 Saltwater Jetties (Feet) 1,640
Saltwater Marinas 10
Saltwater Marina Slips 598
Saltwater Piers 7
Saltwater Piers 6,010
U.S. Defense Department Inventory TotalsOutdoor Recreation Areas 10
TOTAL ACRES 611,845

I-5
RESOURCE BASED (Land) RESOURCE BASED (Water)
Cabins 226 Freshwater Beach (Miles) 4
Tent Campsites 374 Freshwater Boat Ramps 32
RV Campsites 3,211 Freshwater Boat Ramps (Lanes) 36
Historic Sites 905 Freshwater Catwalks 28
Commemorative Structures 20 Freshwater Catwalks (Feet) 11,131
Museums 85 Freshwater Jetties (Feet) 3,770
Picnic Tables 5,920 Freshwater Marinas 8
Hunting Areas (Acres) 33,646 Freshwater Marinas (Slips) 85
Bike Trails Paved (Miles) 335 Freshwater Piers 20
Bike Trails Unpaved (Miles) 853 Freshwater Piers (Feet) 1,381
Canoe Trails (Miles) 318 Saltwater Beach (Miles) 91
Hiking Trails (Miles) 1,787 Saltwater Boat Ramps 27
Equestrian Trails (Miles) 773 Saltwater Boat Ramps (Lanes) 41
Jogging Trails (Miles) 13 Saltwater Catwalks 41
OHV Trails (Miles) - Saltwater Catwalks (Feet) 8,433
Nature Trails (Miles) 117 Saltwater Jetties (Feet) 7,953
Saltwater Marinas 17
Saltwater Marina Slips 400
Saltwater Piers 31
Saltwater Piers 19,902
Division of Recreation and Parks Inventory TotalsOutdoor Recreation Areas 172
Land Acres 681,290
Water Acres 112,870
TOTAL ACRES 794,160
STATE AGENCIES

I-6
RESOURCE BASED (Land) RESOURCE BASED (Water)
Cabins - Freshwater Beach (Miles) -
Tent Campsites - Freshwater Boat Ramps -
RV Campsites - Freshwater Boat Ramps (Lanes) -
Historic Sites 12 Freshwater Catwalks 3
Commemorative Structures 2 Freshwater Catwalks (Feet) 1,411
Museums 3 Freshwater Jetties (Feet) -
Picnic Tables 88 Freshwater Marinas -
Hunting Areas (Acres) 6,620 Freshwater Marinas (Slips) -
Bike Trails Paved (Miles) 5 Freshwater Piers -
Bike Trails Unpaved (Miles) 45.2 Freshwater Piers (Feet) -
Canoe Trails (Miles) 181.5 Saltwater Beach (Miles) 33.2
Hiking Trails (Miles) 55.6 Saltwater Boat Ramps 2
Equestrian Trails (Miles) 13 Saltwater Boat Ramps (Lanes) 2
Jogging Trails (Miles) - Saltwater Catwalks 3
OHV Trails (Miles) - Saltwater Catwalks (Feet) 1,481
Nature Trails (Miles) 46.9 Saltwater Jetties (Feet) -
Saltwater Marinas -
Saltwater Marina Slips -
Saltwater Piers -
Saltwater Piers -
Coastal and Aquatic Managed Areas Inventory TotalsOutdoor Recreation Areas 44
Land Acres 175,101
Water Acres 2,469,277
TOTAL ACRES 2,644,378
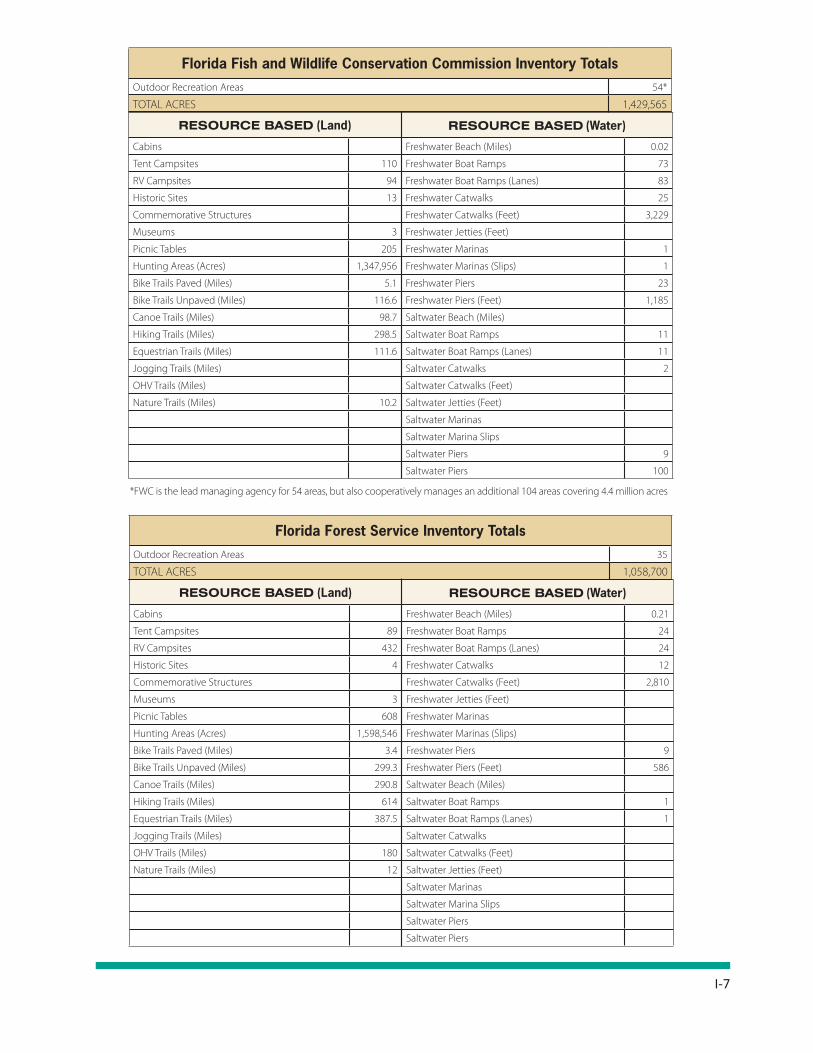
I-7
RESOURCE BASED (Land) RESOURCE BASED (Water)
Cabins Freshwater Beach (Miles) 0.21
Tent Campsites 89 Freshwater Boat Ramps 24
RV Campsites 432 Freshwater Boat Ramps (Lanes) 24
Historic Sites 4 Freshwater Catwalks 12
Commemorative Structures Freshwater Catwalks (Feet) 2,810
Museums 3 Freshwater Jetties (Feet)
Picnic Tables 608 Freshwater Marinas
Hunting Areas (Acres) 1,598,546 Freshwater Marinas (Slips)
Bike Trails Paved (Miles) 3.4 Freshwater Piers 9
Bike Trails Unpaved (Miles) 299.3 Freshwater Piers (Feet) 586
Canoe Trails (Miles) 290.8 Saltwater Beach (Miles)
Hiking Trails (Miles) 614 Saltwater Boat Ramps 1
Equestrian Trails (Miles) 387.5 Saltwater Boat Ramps (Lanes) 1
Jogging Trails (Miles) Saltwater Catwalks
OHV Trails (Miles) 180 Saltwater Catwalks (Feet)
Nature Trails (Miles) 12 Saltwater Jetties (Feet)
Saltwater Marinas
Saltwater Marina Slips
Saltwater Piers
Saltwater Piers
Florida Forest Service Inventory TotalsOutdoor Recreation Areas 35
TOTAL ACRES 1,058,700
RESOURCE BASED (Land) ESOURCE BASED (Water)
Cabins Freshwater Beach (Miles) 0.02
Tent Campsites 110 Freshwater Boat Ramps 73
RV Campsites 94 Freshwater Boat Ramps (Lanes) 83
Historic Sites 13 Freshwater Catwalks 25
Commemorative Structures Freshwater Catwalks (Feet) 3,229
Museums 3 Freshwater Jetties (Feet)
Picnic Tables 205 Freshwater Marinas 1
Hunting Areas (Acres) 1,347,956 Freshwater Marinas (Slips) 1
Bike Trails Paved (Miles) 5.1 Freshwater Piers 23
Bike Trails Unpaved (Miles) 116.6 Freshwater Piers (Feet) 1,185
Canoe Trails (Miles) 98.7 Saltwater Beach (Miles)
Hiking Trails (Miles) 298.5 Saltwater Boat Ramps 11
Equestrian Trails (Miles) 111.6 Saltwater Boat Ramps (Lanes) 11
Jogging Trails (Miles) Saltwater Catwalks 2
OHV Trails (Miles) Saltwater Catwalks (Feet)
Nature Trails (Miles) 10.2 Saltwater Jetties (Feet)
Saltwater Marinas
Saltwater Marina Slips
Saltwater Piers 9
Saltwater Piers 100
Florida Fish and Wildlife Conservation Commission Inventory TotalsOutdoor Recreation Areas 54*
TOTAL ACRES 1,429,565
*FWC is the lead managing agency for 54 areas, but also cooperatively manages an additional 104 areas covering 4.4 million acres
R

I-8
RESOURCE BASED (Land) RESOURCE BASED (Water)
Cabins - Freshwater Beach (Miles) -
Tent Campsites 325 Freshwater Boat Ramps 67
RV Campsites - Freshwater Boat Ramps (Lanes) 67
Historic Sites - Freshwater Catwalks -
Commemorative Structures - Freshwater Catwalks (Feet) -
Museums - Freshwater Jetties (Feet) -
Picnic Tables 98 Freshwater Marinas -
Hunting Areas (Acres) 204,577 Freshwater Marinas (Slips) -
Bike Trails Paved (Miles) - Freshwater Piers -
Bike Trails Unpaved (Miles) 5 Freshwater Piers (Feet) -
Canoe Trails (Miles) 81 Saltwater Beach (Miles) NA
Hiking Trails (Miles) 92.1 Saltwater Boat Ramps NA
Equestrian Trails (Miles) 5 Saltwater Boat Ramps (Lanes) NA
Jogging Trails (Miles) - Saltwater Catwalks NA
OHV Trails (Miles) - Saltwater Catwalks (Feet) NA
Nature Trails (Miles) 26 Saltwater Jetties (Feet) NA
Saltwater Marinas NA
Saltwater Marina Slips NA
Saltwater Piers NA
Saltwater Piers NA
Northwest Florida Water Management District Inventory TotalsOutdoor Recreation Areas 10
TOTAL ACRES 210,481
RESOURCE BASED (Land) RESOURCE BASED (Water)
Cabins - Freshwater Beach (Miles) -
Tent Campsites - Freshwater Boat Ramps 6
RV Campsites - Freshwater Boat Ramps (Lanes) 6
Historic Sites - Freshwater Catwalks -
Commemorative Structures - Freshwater Catwalks (Feet) -
Museums - Freshwater Jetties (Feet) -
Picnic Tables 1 Freshwater Marinas -
Hunting Areas (Acres) 87,855 Freshwater Marinas (Slips) -
Bike Trails Paved (Miles) - Freshwater Piers -
Bike Trails Unpaved (Miles) 35.3 Freshwater Piers (Feet) -
Canoe Trails (Miles) 10 Saltwater Beach (Miles) NA
Hiking Trails (Miles) 15.3 Saltwater Boat Ramps NA
Equestrian Trails (Miles) 26.3 Saltwater Boat Ramps (Lanes) NA
Jogging Trails (Miles) - Saltwater Catwalks NA
OHV Trails (Miles) 38 Saltwater Catwalks (Feet) NA
Nature Trails (Miles) 19.5 Saltwater Jetties (Feet) NA
Saltwater Marinas NA
Saltwater Marina Slips NA
Saltwater Piers NA
Saltwater Piers NA
Suwannee River Water Management District Inventory TotalsOutdoor Recreation Areas 55
TOTAL ACRES 156,509
Water Management Districts

I-9
RESOURCE BASED (Land) RESOURCE BASED (Water)
Cabins - Freshwater Beach (Miles) -
Tent Campsites 17 Freshwater Boat Ramps 16
RV Campsites - Freshwater Boat Ramps (Lanes) 16
Historic Sites 217 Freshwater Catwalks 45
Commemorative Structures - Freshwater Catwalks (Feet) 6,020
Museums 1 Freshwater Jetties (Feet) -
Picnic Tables 106 Freshwater Marinas -
Hunting Areas (Acres) 254,866 Freshwater Marinas (Slips) -
Bike Trails Paved (Miles) 3.3 Freshwater Piers 7
Bike Trails Unpaved (Miles) 636.9 Freshwater Piers (Feet) 347
Canoe Trails (Miles) 4 Saltwater Beach (Miles) NA
Hiking Trails (Miles) 670 Saltwater Boat Ramps NA
Equestrian Trails (Miles) 522.0 Saltwater Boat Ramps (Lanes) NA
Jogging Trails (Miles) - Saltwater Catwalks NA
OHV Trails (Miles) - Saltwater Catwalks (Feet) NA
Nature Trails (Miles) 23.0 Saltwater Jetties (Feet) NA
Saltwater Marinas NA
Saltwater Marina Slips NA
Saltwater Piers NA
Saltwater Piers NA
St. John’s River Water Management District Inventory TotalsOutdoor Recreation Areas 44
TOTAL ACRES 467,727
RESOURCE BASED (Land) RESOURCE BASED (Water)
Cabins - Freshwater Beach (Miles) -
Tent Campsites 162 Freshwater Boat Ramps 2
RV Campsites 71 Freshwater Boat Ramps (Lanes) 2
Historic Sites - Freshwater Catwalks -
Commemorative Structures - Freshwater Catwalks (Feet) -
Museums - Freshwater Jetties (Feet) -
Picnic Tables 217 Freshwater Marinas -
Hunting Areas (Acres) 117,875 Freshwater Marinas (Slips) -
Bike Trails Paved (Miles) 6.5 Freshwater Piers 1
Bike Trails Unpaved (Miles) 301.4 Freshwater Piers (Feet) 100
Canoe Trails (Miles) - Saltwater Beach (Miles) NA
Hiking Trails (Miles) 466 Saltwater Boat Ramps NA
Equestrian Trails (Miles) 264.1 Saltwater Boat Ramps (Lanes) NA
Jogging Trails (Miles) - Saltwater Catwalks NA
OHV Trails (Miles) - Saltwater Catwalks (Feet) NA
Nature Trails (Miles) 1.2 Saltwater Jetties (Feet) NA
Saltwater Marinas NA
Saltwater Marina Slips NA
Saltwater Piers NA
Saltwater Piers NA
Southwest Florida Water Management District Inventory TotalsOutdoor Recreation Areas 34
TOTAL ACRES 314,067
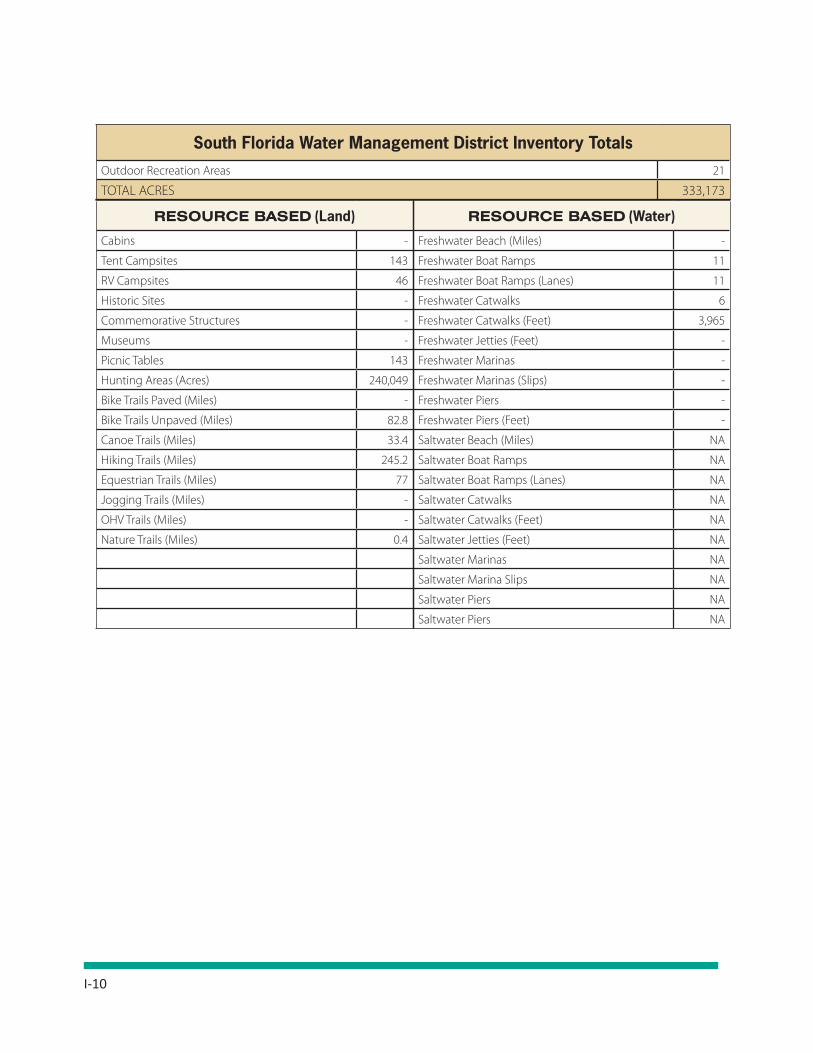
I-10
RESOURCE BASED (Land) RESOURCE BASED (Water)
Cabins - Freshwater Beach (Miles) -
Tent Campsites 143 Freshwater Boat Ramps 11
RV Campsites 46 Freshwater Boat Ramps (Lanes) 11
Historic Sites - Freshwater Catwalks 6
Commemorative Structures - Freshwater Catwalks (Feet) 3,965
Museums - Freshwater Jetties (Feet) -
Picnic Tables 143 Freshwater Marinas -
Hunting Areas (Acres) 240,049 Freshwater Marinas (Slips) -
Bike Trails Paved (Miles) - Freshwater Piers -
Bike Trails Unpaved (Miles) 82.8 Freshwater Piers (Feet) -
Canoe Trails (Miles) 33.4 Saltwater Beach (Miles) NA
Hiking Trails (Miles) 245.2 Saltwater Boat Ramps NA
Equestrian Trails (Miles) 77 Saltwater Boat Ramps (Lanes) NA
Jogging Trails (Miles) - Saltwater Catwalks NA
OHV Trails (Miles) - Saltwater Catwalks (Feet) NA
Nature Trails (Miles) 0.4 Saltwater Jetties (Feet) NA
Saltwater Marinas NA
Saltwater Marina Slips NA
Saltwater Piers NA
Saltwater Piers NA
South Florida Water Management District Inventory TotalsOutdoor Recreation Areas 21
TOTAL ACRES 333,173

I-11
Cabi
nsTe
nt C
amps
ites
RV C
amps
ites
His
tori
c Si
tes
Com
mem
orat
ive
Stru
ctur
esM
useu
ms
Picn
ic T
able
sH
untin
g A
reas
(Acr
es)
Bike
Tra
ils (M
iles
Pave
d)Bi
ke T
rails
(Mile
s U
npav
ed)
Cano
e Tr
ails
(Mile
s)H
ikin
g Tr
ails
(Mile
s)Eq
uest
rian
Tra
ils (M
iles)
Jogg
ing
Trai
ls (M
iles)
OH
V Tr
ails
(Mile
s)N
atur
e Tr
ails
(Mile
s)Fr
eshw
ater
Bea
ch (M
iles)
Fres
hwat
er B
oat R
amps
Fres
hwat
er B
oat R
amps
(Lan
es)
Fres
hwat
er C
atw
alks
Fres
hwat
er C
atw
alks
(Fee
t)Fr
eshw
ater
Jett
ies
Fres
hwat
er M
arin
asFr
eshw
ater
Mar
inas
(Slip
s)Fr
eshw
ater
Pie
rsFr
eshw
ater
Pie
rs (F
eet)
Salt
wat
er B
each
(Mile
s)Sa
ltw
ater
Boa
t Ram
psSa
ltw
ater
Boa
t Ram
ps (L
anes
)Sa
ltw
ater
Cat
wal
ksSa
ltw
ater
Cat
wal
ks (F
eet)
Salt
wat
er Je
ttie
sSa
ltw
ater
Mar
inas
Salt
wat
er M
arin
a Sl
ips
Salt
wat
er P
iers
Salt
wat
er P
iers
(Fee
t)
Base
ball
Fiel
dsBa
sket
ball
Goa
lsEq
uipp
ed P
lay
Are
asFo
otba
ll Fi
elds
Gol
f Cou
rses
, 18-
Hol
eG
olf C
ours
es, 9
-Hol
eG
olf C
ours
es, E
xecu
tive
Gol
f Hol
es (T
otal
)M
ulti-
Use
Car
tsM
ulti-
Use
Fie
lds
Out
door
Sw
imm
ing
Pool
sRa
cque
tbal
l Cou
rts
Shuffl
eboa
rd C
ourt
sTe
nni
Faci
litie
sN
orth
wes
tN
orth
Ce
ntra
lN
orth
east
Cent
ral
Wes
tCe
ntra
lCe
ntra
lEa
stSo
uthw
est
Sout
heas
tSt
atew
ide
117
1
,298
4
,966
4
08
180
2
51
49,
970
15,
002
35
8.5
2,5
12.4
9
97.6
4
,460
.9
2,2
91.9
3
12.1
2
86
278
.5
24
892
1
,100
4
49
132
,573
7
8,72
0 2
3 9
16
523
4
5,04
7 1
65
534
8
11
554
1
27,3
99
41,
158
87
6,7
20
302
8
7,71
4
5,35
3 7
,258
4
,591
1
,967
7
7 3
3 1
4 1
,858
7
80
1,7
78
477
1
,280
2
,075
4
,522
7
77
7
27
170
2
3 2
0 1
0 4
,033
-
4
0.4
27.
5 9
.0
62.
6 1
8.8
87.
2 -
3
5.9
2.1
1
25
133
3
2 5
,673
1
50
-
-
110
3
,900
1
.6
88
122
5
6 8
,358
3
06
7
574
4
9 2
8,59
7
580
3
57
436
1
51
6
-
1
117
1
9 1
25
6
20
60
239
2
3
4
178
4
12
30 3
17
2,7
37
-
40.
1 7
7.6
21.
9 1
49.0
5
6 7
8.2
-
75.
9 0
.5
119
1
62
37
7,0
00
4,8
00
1
2
24
4,1
79
1.2
1
4 1
9 1
664
2
66
2
37 6
875
324
6
03
327
1
00
2
1
-
45
57
150
1
9 7
4 3
8 2
06
74
38
145
4
46
39
14
46
3,5
71
2.2
7
4.0
108
.1
4.8
1
34
82.
8 9
9.8
17.
00
118
0
.5
103
1
12
34
5,6
84
-
7
280
4
5 5
,289
3
0 3
2 4
8 2
1 4
,260
5
,050
5
2
43
16
5,4
53
548
5
69
436
1
75
6
6
-
162
2
0 1
05
57
44
57
312
6
4
15
209
3
88
36
15
36
9,8
24
-
176
.4
178
.4
67.
3 2
86.5
5
9.9
240
.0
-
163
.3
0.7
6
5 9
1 7
4 2
4,45
6 3
0,55
1 4
1
8 6
7 4
,885
1
8.6
99
167
9
0 1
4,90
7 1
2,58
1 1
2 1
,617
4
5 1
4,17
4
796
1
,162
6
58
285
7
2
3
2
04
276
1
93
68
164
4
73
632
5
2
9
132
4
09
70
31
31
8,1
64
-
207
.4
149
.6
32.
0 1
,580
.9
141
.9
269
.6
-
225
.7
4.3
2
86
341
1
32
48,
110
32,
526
3
260
1
32
13,
321
NA
N
A
NA
N
A
NA
N
A
NA
N
A
NA
N
A
960
1
,192
8
00
300
7
4
-
1
63
129
3
34
59
218
4
68
652
1
36
14
221
1
,025
5
8 3
9 3
6 5
,773
-
1
83.2
1
26.3
6
0 3
02
118
.5
116
.8
-
138
.8
4.2
6
8 9
9 5
2 1
2,81
7 2
,403
2
1
42
53
6,6
61
33.
5 1
18
170
2
30
35,
863
100
7
1
,119
7
9 1
4,46
1
602
9
26
478
2
54
13 7
1
315
9
7 2
21
40
79
383
5
24
169
10
143
1
17
84
10
26
5,3
51
15,
000
141
.2
302
.2
132
.3
500
.9
151
.7
98.
0 -
1
36.2
0
.7
60
67
29
11,
907
3,3
05
1
25
33
1,8
66
44.
4 7
0 1
11
113
3
8,00
5 8
,145
1
2 6
27
63
12,
220
442
4
55
389
1
90
8
2
-
162
3
9 1
14
46
81
207
4
54
61
20
2
43
1,9
99
68
48
49
10,
517
-
144
.2
90.
7 5
6.7
269
.9
139
.1
267
.7
-
161
.1
10.
8 6
6 9
5 5
9 1
6,92
6 4
,985
5
1
89
59
4,9
46
35.
6 1
13
174
4
3 2
5,34
2 1
4,71
0 4
2 2
,503
4
4 1
1,93
4
1,1
01
1,9
94
1,0
67
512
2
8 1
1 9
690
1
43
536
1
82
600
3
89
1,5
03
198
Loca
l Age
ncy
Out
door
Rec
reat
ion
Res
ourc
es a
nd F
acili
ties
2012
LOCAL AGENCIES


J-1
Appendix J - Assessment and Protection of Wetlands
ENHANCEMENT AREA ASSESSMENT
Extent of Wetlands in Florida Wetlands type Estimated
historic extent (acres)
Current extent (acres)
Trends in acres lost since 2006 (Net acres gained & lost)
Acres gained through voluntary mechanisms since 2006
Acres gained through mitigation since 2006
Year and source(s) of Data
Tidal vegetated (Other-State Wetland pursuant to Rule 62-340 FAC)**
*(DEP-SLER)
*(DEP-SLER)
Lost-11,169.34 acres Gained-17,518 acres
4,518.58 acres 12,999.40 acres
2006-2009 DEP/SLER
Tidal non-vegetated**
Non-tidal/ freshwater**
10,318,308 2009 FNAI†
Other (please specify)
***Coastal Public Lands: 838,152 Private Lands: 189,403 TOTAL: 1,027,555 --------------Fresh-waterPublic Lands: 5,254,898 Private Lands: 5,063,410 TOTAL: 10,318,308
2009 FNAI
†Florida Natural Areas Inventory *(DEP-Submerged Lands & Environmental Resources) No accurate data statewide based on Florida wetland definition pursuant to Rule 62-340, FAC. **The Florida wetland definition includes tidal wetlands, tidal non-vegetated wetlands, and freshwater wetlands. ***Coastal wetlands data include Mangrove Swamps, Saltwater Marshes, Tidal Flats, Salt Flats (FLUCCS codes). Public Lands data are from FNAI Florida Managed Areas December, 2009.
6
Extent of Wetlands in Florida
Assessment and Protection of WetlandsThe Emergency Wetlands Resources Act of 1986 (PL 99-645), requires each state comprehensive outdoor recreation plan to include a component that identifies wetlands as a priority concern with-in that state. To fulfill the requirements sections of the 2011-2015 Coastal Zone Management Act 309 Assessment and Strategies and information from the Florida Department of Environmental Protection (DEP) Office of Submerged Lands and Environmental Resources are used. This adden-dum identifies the wetlands communities that exist in Florida, discusses major threats to the State’s wetlands and describes the wetlands protection programs and efforts that exist today.

J-2
Increasing populations will of course lead to increasing water withdrawals. According to the Florida 2060 Report, between now and 2060 the State’s population is projected to more than double and consequently, without shifts in our policies, the additional land devoted to urban use will also more than double. If roughly 7 million acres of additional land is converted to urban use, it means 2.7 million acres of existing agricultural land will be lost along with 2.7 million acres of native habitat. (Florida 2060, a research project prepared for 1000 Friends of Florida) Data provided in the above table for certain wetlands is only for permitted activities. The trends shown are an indication of impacts to wetlands and trends from the economy on the number of permitted activities. Mitigation is not required for exempt activities or activities that qualify for a noticed general permit. The negative trend for the coastal zone is expected to continue because permitted impacts are continuing. Development of uplands in the coastal zone has continued resulting in fragmentation of the remaining wetlands and other indirectly impacted habitats. Isolated wetlands, including some important for coastal resources, have been unregulated by the state in northwest Florida due to exclusion of the Panhandle region of Florida from the original Environmental Resource Permitting legislation. These new rules would bring protection of isolated wetlands in the Northwest portion of the state to the same level that has existed elsewhere in Florida since 1994. Implementation of the Environmental Resource Permitting program in northwest Florida, including regulation of isolated wetlands, is anticipated in 2010. Mitigation has often occurred in areas of lower land value inland from the permitted impacts. Monitoring Efforts
The Florida Geological Survey has been conducting field work to establish Sediment Elevation Tables, which has indicated overall sedimentation loss. Funds to continue that program are no longer available, and long-term monitoring will depend on the availability of non-State funding sources. Another effort that has been underway is to characterize the interaction of coastal wetlands with ground water and the near-shore environment with special emphasis on karstic settings. This activity is largely research-oriented and its continuation and expansion will depend on the availability of research funds primarily from federal sources. A third effort is the population of a sinkhole database that has been underway for many years and is expected to continue for the foreseeable future. The three Florida NERRs are undertaking habitat mapping and monitoring within their designated areas. Florida Aquatic Preserves (APs) are setting up mapping and monitoring programs at some sites, but these are not comprehensive programs statewide due to funding limitations. Mitigation of wetland impacts for permitted activities is conducted through required mitigation reports and compliance inspections. An effective monitoring program is in place for the Umbrella Regional Mitigation Plan in Northwest Florida, which provides mitigation of wetland impacts for state transportation projects. The adequacy of mitigation monitoring for state and federal permits should be closely evaluated.
7
Monitoring Efforts
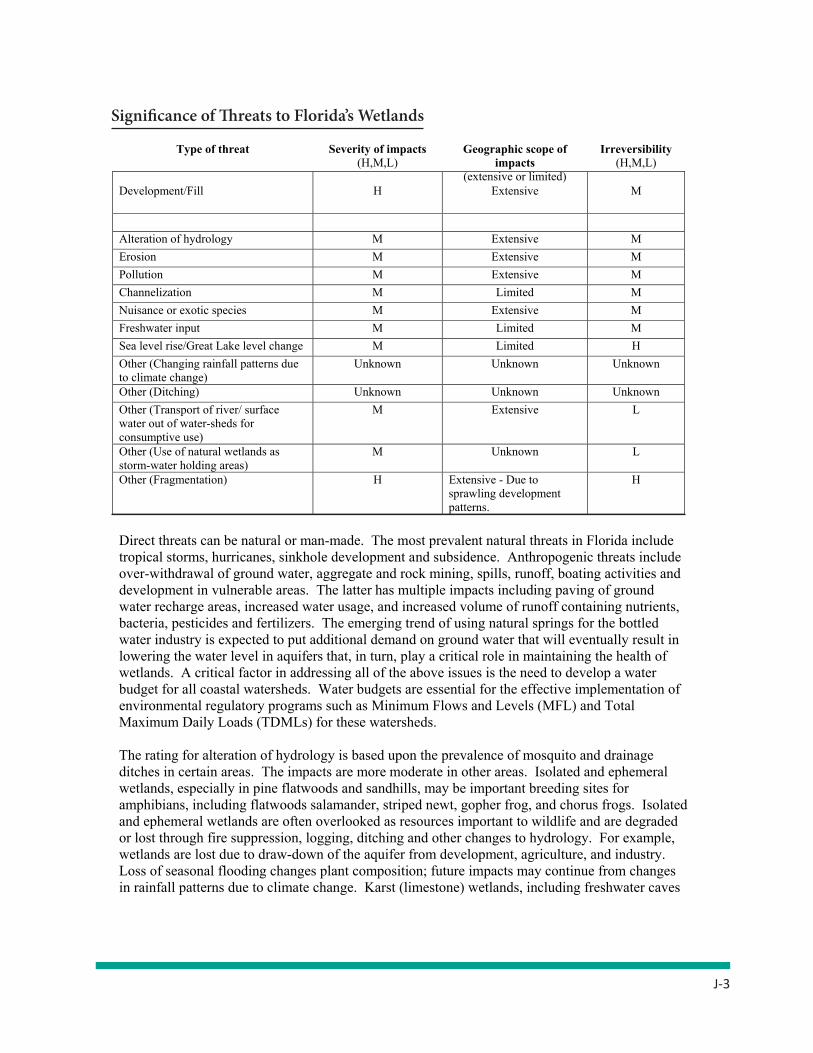
J-3
Significance of Threats to Florida's Wetlands
Type of threat Severity of impacts (H,M,L)
Geographic scope of impacts
(extensive or limited)
Irreversibility (H,M,L)
Development/Fill H Extensive M
Alteration of hydrology M Extensive M Erosion M Extensive M Pollution M Extensive M Channelization M Limited M Nuisance or exotic species M Extensive M Freshwater input M Limited M Sea level rise/Great Lake level change M Limited H Other (Changing rainfall patterns due to climate change)
Unknown Unknown Unknown
Other (Ditching) Unknown Unknown Unknown Other (Transport of river/ surface water out of water-sheds for consumptive use)
M Extensive L
Other (Use of natural wetlands as storm-water holding areas)
M Unknown L
Other (Fragmentation) H Extensive - Due to sprawling development patterns.
H
Direct threats can be natural or man-made. The most prevalent natural threats in Florida include tropical storms, hurricanes, sinkhole development and subsidence. Anthropogenic threats include over-withdrawal of ground water, aggregate and rock mining, spills, runoff, boating activities and development in vulnerable areas. The latter has multiple impacts including paving of ground water recharge areas, increased water usage, and increased volume of runoff containing nutrients, bacteria, pesticides and fertilizers. The emerging trend of using natural springs for the bottled water industry is expected to put additional demand on ground water that will eventually result in lowering the water level in aquifers that, in turn, play a critical role in maintaining the health of wetlands. A critical factor in addressing all of the above issues is the need to develop a water budget for all coastal watersheds. Water budgets are essential for the effective implementation of environmental regulatory programs such as Minimum Flows and Levels (MFL) and Total Maximum Daily Loads (TDMLs) for these watersheds. The rating for alteration of hydrology is based upon the prevalence of mosquito and drainage ditches in certain areas. The impacts are more moderate in other areas. Isolated and ephemeral wetlands, especially in pine flatwoods and sandhills, may be important breeding sites for amphibians, including flatwoods salamander, striped newt, gopher frog, and chorus frogs. Isolated and ephemeral wetlands are often overlooked as resources important to wildlife and are degraded or lost through fire suppression, logging, ditching and other changes to hydrology. For example, wetlands are lost due to draw-down of the aquifer from development, agriculture, and industry. Loss of seasonal flooding changes plant composition; future impacts may continue from changes in rainfall patterns due to climate change. Karst (limestone) wetlands, including freshwater caves
8
Significance of Threats to Florida’s Wetlands

J-4
and sinkholes that connect to the underground aquifer, may be habitat to rare invertebrates (crayfish, cave shrimp, isopods, amphipods) and vertebrates (cave salamander). The wildlife in these karst features are threatened by changes in water quality (surface-derived pollutants and siltation) and quantity (groundwater removal to support development and agriculture water uses). Coastal wetlands may be threatened by saltwater intrusion due to sea level rise and groundwater removal.
Wetlands Management Programs and Efforts
Management categories Employed by state/
territory (Y or N)
Significant changes since last assessment
(Y or N) Wetland regulatory program implementation, policies, and standards Y Y
Wetland protection policies and standards Y Y Wetland assessment methodologies (health, function, extent) Y Y Wetland restoration or enhancement programs Y Y Wetland policies related public infrastructure funding Y N Wetland mitigation programs and policies Y Y Wetland creation programs and policies Y N Wetland acquisition programs Y N Wetland mapping, GIS, and tracking systems Y N
9
and sinkholes that connect to the underground aquifer, may be habitat to rare invertebrates (crayfish, cave shrimp, isopods, amphipods) and vertebrates (cave salamander). The wildlife in these karst features are threatened by changes in water quality (surface-derived pollutants and siltation) and quantity (groundwater removal to support development and agriculture water uses). Coastal wetlands may be threatened by saltwater intrusion due to sea level rise and groundwater removal.
Wetlands Management Programs and Efforts
Management categories Employed by state/
territory (Y or N)
Significant changes since last assessment
(Y or N) Wetland regulatory program implementation, policies, and standards Y Y
Wetland protection policies and standards Y Y Wetland assessment methodologies (health, function, extent) Y Y Wetland restoration or enhancement programs Y Y Wetland policies related public infrastructure funding Y N Wetland mitigation programs and policies Y Y Wetland creation programs and policies Y N Wetland acquisition programs Y N Wetland mapping, GIS, and tracking systems Y N
9 Special Area Management Plans Y Y Wetland research and monitoring Y N Wetland education and outreach Y Y Other (please specify) Fish and Wildlife Conservation Commission notes that many of these programs deal with water quality and quantity, but do not specifically include potential impacts to wildlife. Wetland regulatory program implementation, policies, and standards Currently, the Northwest Florida Water Management District (NWFWMD) and the Department of Environmental Protection (DEP) are working to implement northwest Florida Environmental Resource Permitting (ERP) Phase II, which would improve functional wetland protection and provide significant new protections for isolated wetlands. Implementation is expected to occur during 2010. These new rules would bring protection of isolated wetlands in the Northwest portion of the state to the same level that currently exists elsewhere in Florida. Stormwater ERP (Phase I) is currently in place. The NWFWMD continues to implement the Umbrella Regional Wetland Mitigation Plan in cooperation with the Florida Department of Transportation and U.S. Army Corps of Engineers. This plan provides for watershed-based mitigation of wetland impacts caused by state transportation projects. The above are all non-CZM funded efforts. Wetland restoration or enhancement programs The FCMP has partnered with several state and local programs using 306 funds to undertake various wetland restoration projects. DEP's Northwest District has been restoring submerged aquatic vegetation (SAV) populations in the Panhandle region through the utilization of salvaged and laboratory- grown SAV materials. Salvaged SAV is acquired only from marine construction activities that are exempt from regulation or have met applicable permits for avoidance and minimization. Since its inception in 2006, the SAV salvage program has obtained over 600-12" seagrass cores from dock construction for its restoration efforts and has used the salvaged SAV at 12 suitable receiver sites. Ruppia maritima is propagated at the Northwest District’s laboratory, and will also be planted at restoration sites. FWC’s Florida Wildlife Research Institute (FWRI) has continued development of the Seagrass Integrated Mapping and Monitoring program to enable resource managers to track changes in the distribution, abundance, and species composition of seagrass meadows around the state. DEP/CAMA has been conducting hyperspectral mapping of the Big Bend Aquatic Preserve. CAMA staff will obtain baseline maps of bathymetry, seagrass beds and the extent of propeller scar damage in the Big Bend Seagrasses Aquatic Preserve, the largest of Florida’s 41 aquatic preserves. These changes were funded with Section 309 CZM funds. The FWC is mapping seagrass beds in eastern Choctawhatchee Bay, a large area unmapped since 1992. Significant changes to seagrasses have taken place over past 16 years due to extensive
10
Special Area Management Plans Y Y Wetland research and monitoring Y N Wetland education and outreach Y Y Other (please specify) Fish and Wildlife Conservation Commission notes that many of these programs deal with water quality and quantity, but do not specifically include potential impacts to wildlife. Wetland regulatory program implementation, policies, and standards Currently, the Northwest Florida Water Management District (NWFWMD) and the Department of Environmental Protection (DEP) are working to implement northwest Florida Environmental Resource Permitting (ERP) Phase II, which would improve functional wetland protection and provide significant new protections for isolated wetlands. Implementation is expected to occur during 2010. These new rules would bring protection of isolated wetlands in the Northwest portion of the state to the same level that currently exists elsewhere in Florida. Stormwater ERP (Phase I) is currently in place. The NWFWMD continues to implement the Umbrella Regional Wetland Mitigation Plan in cooperation with the Florida Department of Transportation and U.S. Army Corps of Engineers. This plan provides for watershed-based mitigation of wetland impacts caused by state transportation projects. The above are all non-CZM funded efforts. Wetland restoration or enhancement programs The FCMP has partnered with several state and local programs using 306 funds to undertake various wetland restoration projects. DEP's Northwest District has been restoring submerged aquatic vegetation (SAV) populations in the Panhandle region through the utilization of salvaged and laboratory- grown SAV materials. Salvaged SAV is acquired only from marine construction activities that are exempt from regulation or have met applicable permits for avoidance and minimization. Since its inception in 2006, the SAV salvage program has obtained over 600-12" seagrass cores from dock construction for its restoration efforts and has used the salvaged SAV at 12 suitable receiver sites. Ruppia maritima is propagated at the Northwest District’s laboratory, and will also be planted at restoration sites. FWC’s Florida Wildlife Research Institute (FWRI) has continued development of the Seagrass Integrated Mapping and Monitoring program to enable resource managers to track changes in the distribution, abundance, and species composition of seagrass meadows around the state. DEP/CAMA has been conducting hyperspectral mapping of the Big Bend Aquatic Preserve. CAMA staff will obtain baseline maps of bathymetry, seagrass beds and the extent of propeller scar damage in the Big Bend Seagrasses Aquatic Preserve, the largest of Florida’s 41 aquatic preserves. These changes were funded with Section 309 CZM funds. The FWC is mapping seagrass beds in eastern Choctawhatchee Bay, a large area unmapped since 1992. Significant changes to seagrasses have taken place over past 16 years due to extensive
10
Wetlands Management Programs and Efforts

J-5
Special Area Management Plans Y Y Wetland research and monitoring Y N Wetland education and outreach Y Y Other (please specify) Fish and Wildlife Conservation Commission notes that many of these programs deal with water quality and quantity, but do not specifically include potential impacts to wildlife. Wetland regulatory program implementation, policies, and standards Currently, the Northwest Florida Water Management District (NWFWMD) and the Department of Environmental Protection (DEP) are working to implement northwest Florida Environmental Resource Permitting (ERP) Phase II, which would improve functional wetland protection and provide significant new protections for isolated wetlands. Implementation is expected to occur during 2010. These new rules would bring protection of isolated wetlands in the Northwest portion of the state to the same level that currently exists elsewhere in Florida. Stormwater ERP (Phase I) is currently in place. The NWFWMD continues to implement the Umbrella Regional Wetland Mitigation Plan in cooperation with the Florida Department of Transportation and U.S. Army Corps of Engineers. This plan provides for watershed-based mitigation of wetland impacts caused by state transportation projects. The above are all non-CZM funded efforts. Wetland restoration or enhancement programs The FCMP has partnered with several state and local programs using 306 funds to undertake various wetland restoration projects. DEP's Northwest District has been restoring submerged aquatic vegetation (SAV) populations in the Panhandle region through the utilization of salvaged and laboratory- grown SAV materials. Salvaged SAV is acquired only from marine construction activities that are exempt from regulation or have met applicable permits for avoidance and minimization. Since its inception in 2006, the SAV salvage program has obtained over 600-12" seagrass cores from dock construction for its restoration efforts and has used the salvaged SAV at 12 suitable receiver sites. Ruppia maritima is propagated at the Northwest District’s laboratory, and will also be planted at restoration sites. FWC’s Florida Wildlife Research Institute (FWRI) has continued development of the Seagrass Integrated Mapping and Monitoring program to enable resource managers to track changes in the distribution, abundance, and species composition of seagrass meadows around the state. DEP/CAMA has been conducting hyperspectral mapping of the Big Bend Aquatic Preserve. CAMA staff will obtain baseline maps of bathymetry, seagrass beds and the extent of propeller scar damage in the Big Bend Seagrasses Aquatic Preserve, the largest of Florida’s 41 aquatic preserves. These changes were funded with Section 309 CZM funds. The FWC is mapping seagrass beds in eastern Choctawhatchee Bay, a large area unmapped since 1992. Significant changes to seagrasses have taken place over past 16 years due to extensive
10
population growth, increased recreational boating and effects from landfall of three hurricanes and one tropical storm. This effort was funded with Section 306 CZM funds. The DEP Division of Recreation & Parks has continued seagrass restoration activities at Lignumvitae Key Submerged Land Managed Area to restore habitat damaged by boat groundings. DEP’s Northwest District has continued work on Project Greenshores, a habitat creation and restoration project located along Bayfront Parkway in Pensacola Bay. The project is comprised of a series of salt marsh and oyster reefs totaling approximately 15 acres. This project was funded with Section 306A CZM funds. Special Area Management Plans DEP’s Office of Coastal and Aquatic Managed Areas (CAMA) is developing a new, program-wide comprehensive management strategy, the Integrated Management Framework (IMF), to implement special area management more effectively. The IMF directs all CAMA program activities, including not only aquatic preserve management, but also NERRs, Florida Keys NMS, the Southeast Florida Coral Reef Program, and other state and federal priority activities, in a coordinated manner using subject-specific management teams. CAMA is also undertaking a long-term project to update the management plans for the 41 aquatic preserves using data and information on current ecosystem health, land use, water resource management, human activities, and geophysical conditions affecting the preserve system. To date, five aquatic preserve management plans have been completed and approved and another seven are in progress. This effort is part of a 309-driven change. Wetland education and outreach The Coastal Training Programs offered by the three Florida NERRs focus on issues such as coastal habitat conservation and restoration, biodiversity, water quality and sustainable resources management. One recent workshop was entitled Innovative Floodplain Strategies for Coastal Areas: Application of No Adverse Impact Principles. The FCMP has provided 306 funds to assist in Coastal Training Program activities. Priority Needs and Information Gaps Using the table below, identify major gaps or needs (regulatory, policy, data, training, capacity, communication and outreach) in addressing each of the enhancement area objectives that could be addressed through the Coastal Management Program and partners (not limited to those items to be addressed through the Section 309 Strategy). If necessary, additional narrative can be provided below to describe major gaps or needs.
11
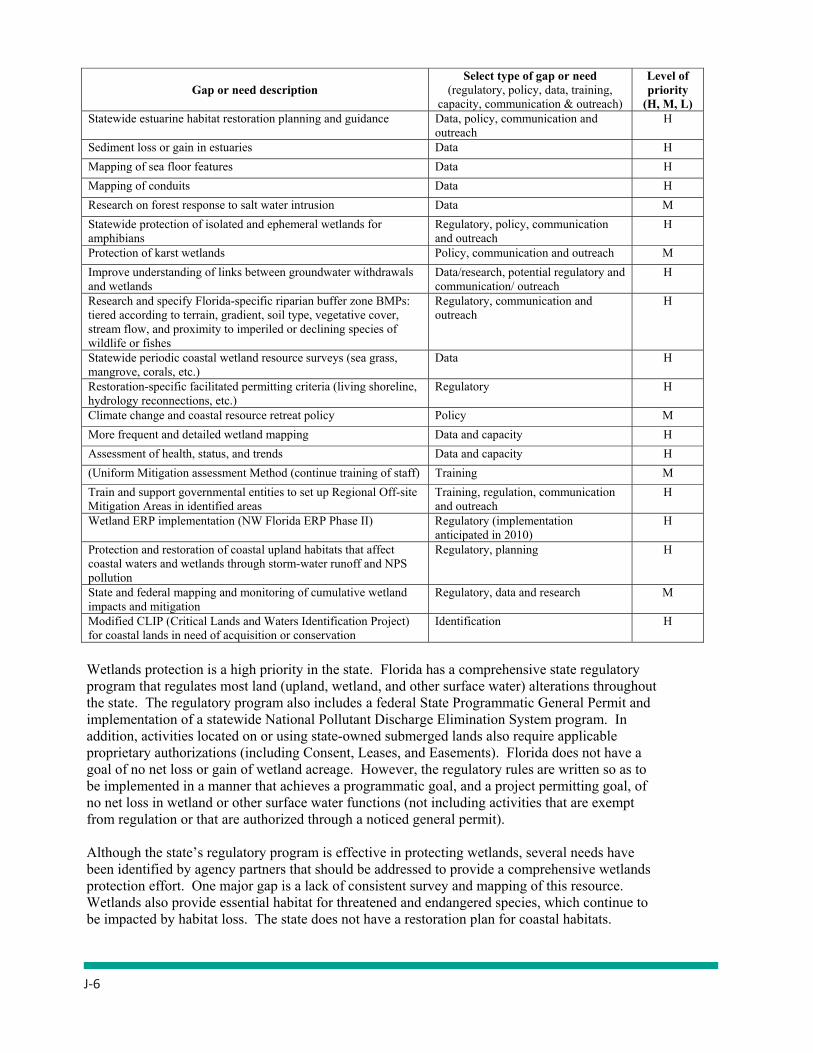
J-6
Gap or need description Select type of gap or need
(regulatory, policy, data, training, capacity, communication & outreach)
Level of priority
(H, M, L) Statewide estuarine habitat restoration planning and guidance Data, policy, communication and
outreach H
Sediment loss or gain in estuaries Data H Mapping of sea floor features Data H Mapping of conduits Data H Research on forest response to salt water intrusion Data M Statewide protection of isolated and ephemeral wetlands for amphibians
Regulatory, policy, communication and outreach
H
Protection of karst wetlands Policy, communication and outreach M Improve understanding of links between groundwater withdrawals and wetlands
Data/research, potential regulatory and communication/ outreach
H
Research and specify Florida-specific riparian buffer zone BMPs: tiered according to terrain, gradient, soil type, vegetative cover, stream flow, and proximity to imperiled or declining species of wildlife or fishes
Regulatory, communication and outreach
H
Statewide periodic coastal wetland resource surveys (sea grass, mangrove, corals, etc.)
Data H
Restoration-specific facilitated permitting criteria (living shoreline, hydrology reconnections, etc.)
Regulatory H
Climate change and coastal resource retreat policy Policy M More frequent and detailed wetland mapping Data and capacity H Assessment of health, status, and trends Data and capacity H (Uniform Mitigation assessment Method (continue training of staff) Training M Train and support governmental entities to set up Regional Off-site Mitigation Areas in identified areas
Training, regulation, communication and outreach
H
Wetland ERP implementation (NW Florida ERP Phase II) Regulatory (implementation anticipated in 2010)
H
Protection and restoration of coastal upland habitats that affect coastal waters and wetlands through storm-water runoff and NPS pollution
Regulatory, planning H
State and federal mapping and monitoring of cumulative wetland impacts and mitigation
Regulatory, data and research M
Modified CLIP (Critical Lands and Waters Identification Project) for coastal lands in need of acquisition or conservation
Identification H
12
Wetlands protection is a high priority in the state. Florida has a comprehensive state regulatoryprogram that regulates most land (upland, wetland, and other surface water) alterations throughout the state. The regulatory program also includes a federal State Programmatic General Permit and implementation of a statewide National Pollutant Discharge Elimination System program. In addition, activities located on or using state-owned submerged lands also require applicable proprietary authorizations (including Consent, Leases, and Easements). Florida does not have a goal of no net loss or gain of wetland acreage. However, the regulatory rules are written so as to be implemented in a manner that achieves a programmatic goal, and a project permitting goal, of no net loss in wetland or other surface water functions (not including activities that are exempt from regulation or that are authorized through a noticed general permit). Although the state’s regulatory program is effective in protecting wetlands, several needs have been identified by agency partners that should be addressed to provide a comprehensive wetlands protection effort. One major gap is a lack of consistent survey and mapping of this resource. Wetlands also provide essential habitat for threatened and endangered species, which continue to be impacted by habitat loss. The state does not have a restoration plan for coastal habitats.
13