Embed Size (px)
Citation preview
Copyright © 2002, 2003, Andrew Moore Biosurveillance Detection Algorithms: Slide 1
Outlier and Anomaly DetectionCase Study: Biosurveillance
Excerpts/Adaptations from:Detection Algorithms for Biosurveillance: A tutorial
Andrew Moore, CMU tutorial:http://www.autonlab.org/tutorials/biosurv.html
Also Excerpts/Adaptations from:Russell and Norvig, Intro. to AI slides

Biosurveillance Detection Algorithms: Slide 2Copyright © 2002, 2003, Andrew Moore
Biosurveillance• Attempt to quickly detect significant disease
outbreaks• Allows for quick action to try to contain disease
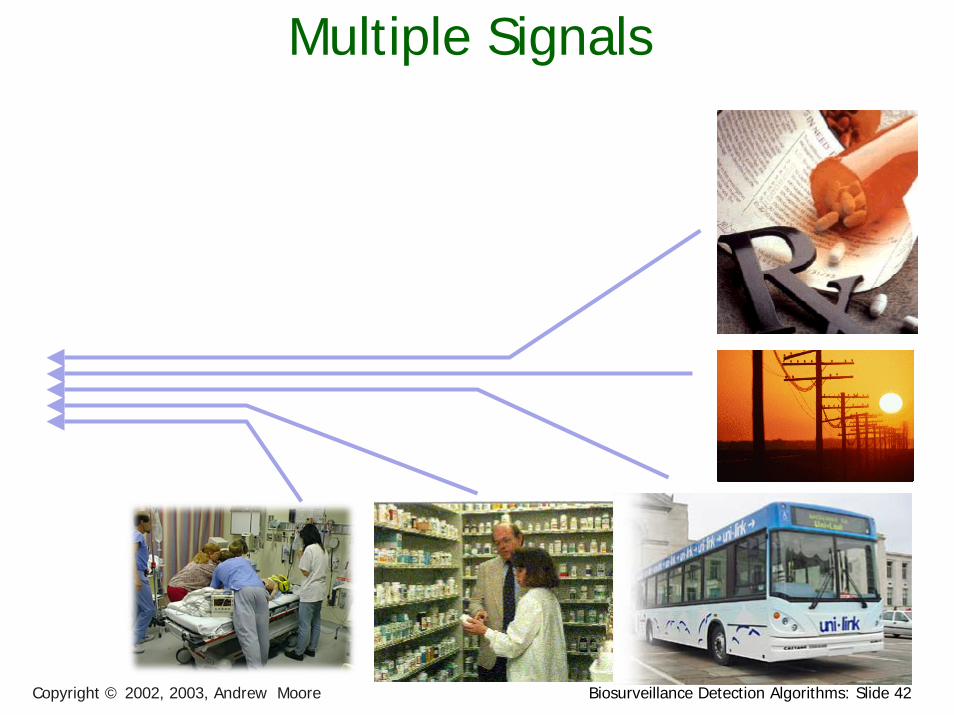
• Approach:Collect data from many sources …
(such as emergency room visits, purchases of particular types of over-the-counter medicine, school absences, pharmacy sales, etc.)
…and recognize statistical anomalies
Biosurveillance Detection Algorithms: Slide 3Copyright © 2002, 2003, Andrew Moore
Biosurveillance is a difficult topic
• April 6, 2006: “House Government Reform Committee scolds Centers for Disease Control Prevention” for “technologically backward” system of biosurveillance [Government Health IT]
http://govhealthit.com/article93982-04-06-06-Web
Biosurveillance Detection Algorithms: Slide 4Copyright © 2002, 2003, Andrew Moore
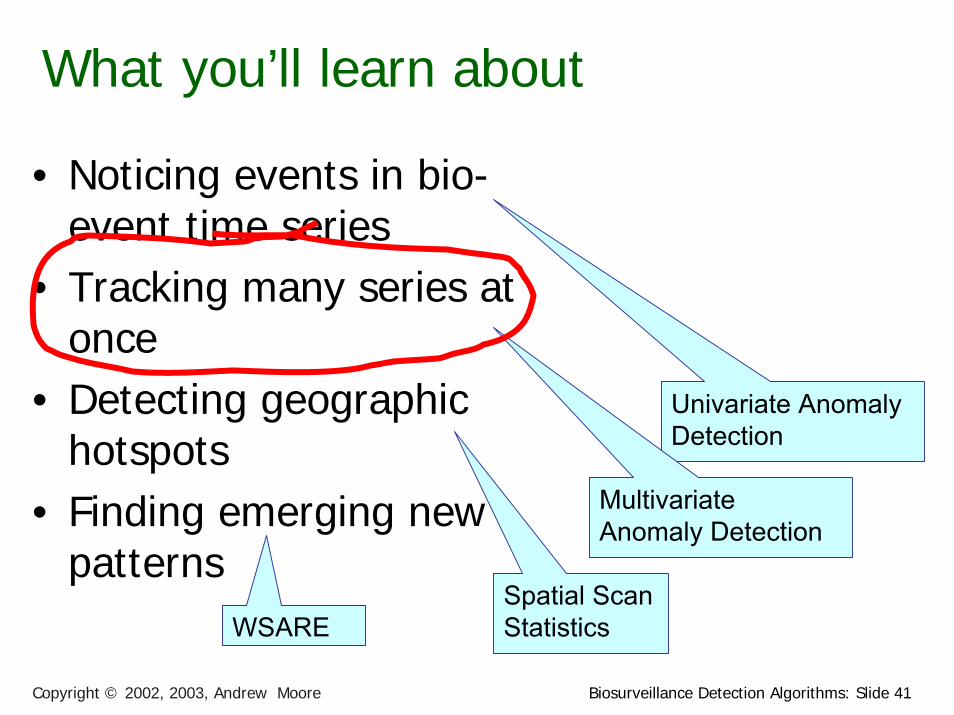
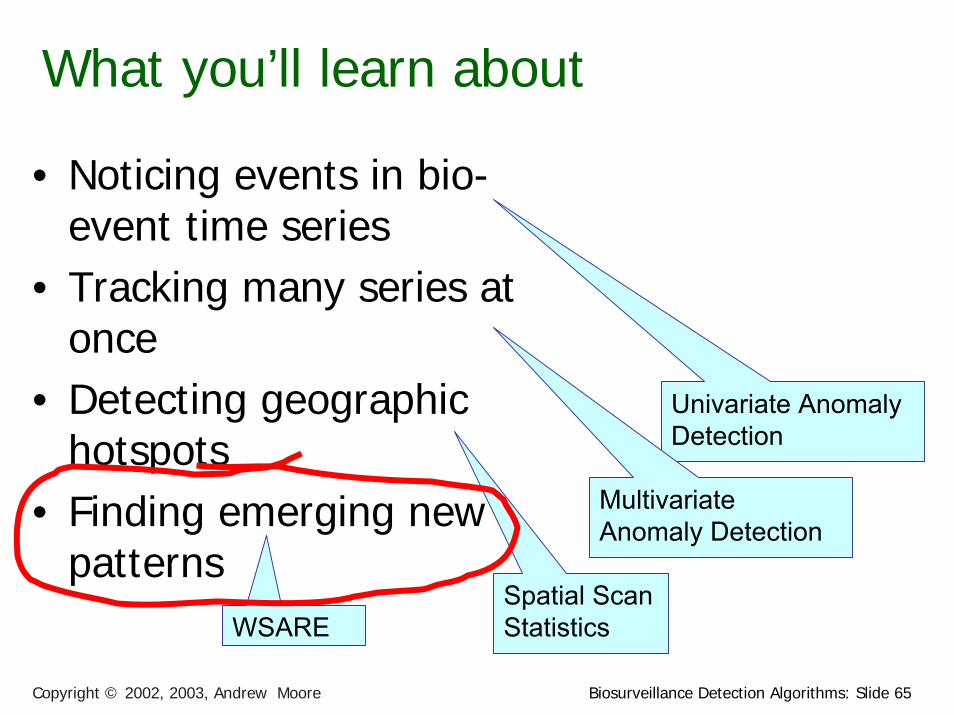
What you’ll learn about
• Noticing events in bio-event time series
• Tracking many series at once
• Detecting geographic hotspots
• Finding emerging new patterns
Biosurveillance Detection Algorithms: Slide 5Copyright © 2002, 2003, Andrew Moore
What you’ll learn about These are all powerful statistical methods, which means they all have to have one thing in common…
• Noticing events in bio-event time series
• Tracking many series at once
• Detecting geographic hotspots
• Finding emerging new patterns
Biosurveillance Detection Algorithms: Slide 6Copyright © 2002, 2003, Andrew Moore
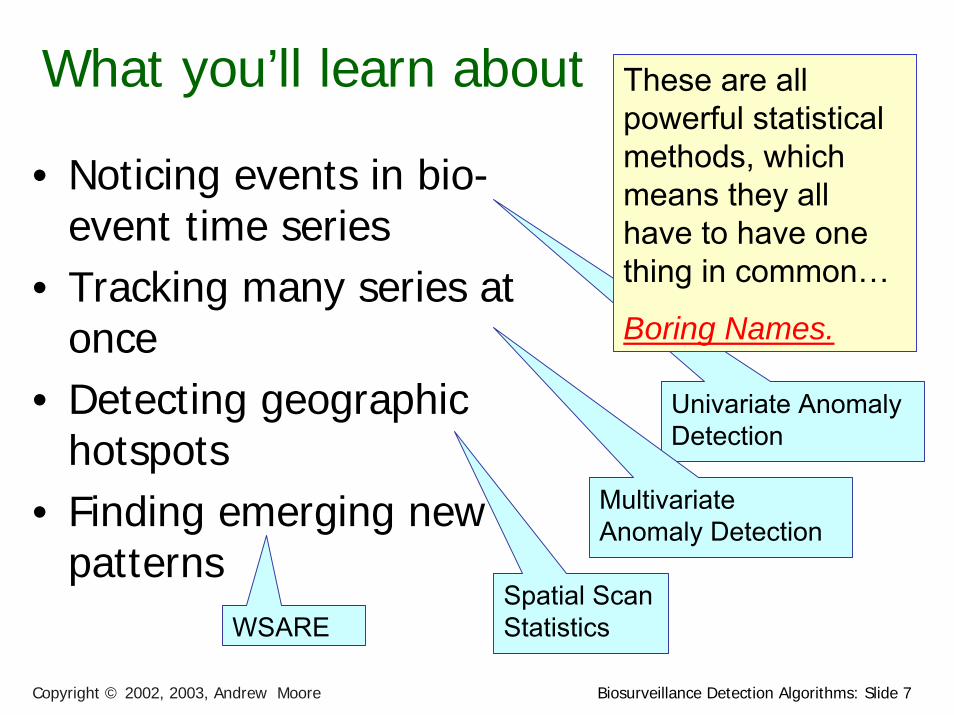
What you’ll learn about These are all powerful statistical methods, which means they all have to have one thing in common…
Boring Names.
• Noticing events in bio-event time series
• Tracking many series at once
• Detecting geographic hotspots
• Finding emerging new patterns
Biosurveillance Detection Algorithms: Slide 7Copyright © 2002, 2003, Andrew Moore
What you’ll learn about
• Noticing events in bio-event time series
• Tracking many series at once
• Detecting geographic hotspots
• Finding emerging new patterns
These are all powerful statistical methods, which means they all have to have one thing in common…
Boring Names.
Univariate Anomaly Detection
Multivariate Anomaly Detection
Spatial Scan StatisticsWSARE
Biosurveillance Detection Algorithms: Slide 8Copyright © 2002, 2003, Andrew Moore
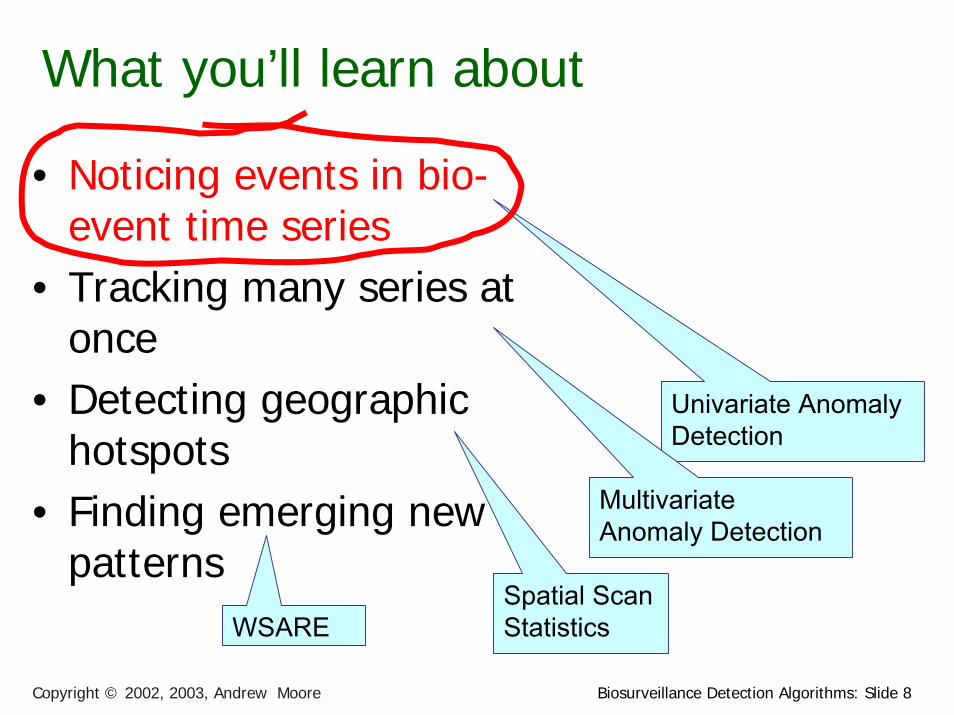
What you’ll learn about
• Noticing events in bio-event time series
• Tracking many series at once
• Detecting geographic hotspots
• Finding emerging new patterns
Univariate Anomaly Detection
Multivariate Anomaly Detection
Spatial Scan StatisticsWSARE
Biosurveillance Detection Algorithms: Slide 9Copyright © 2002, 2003, Andrew Moore
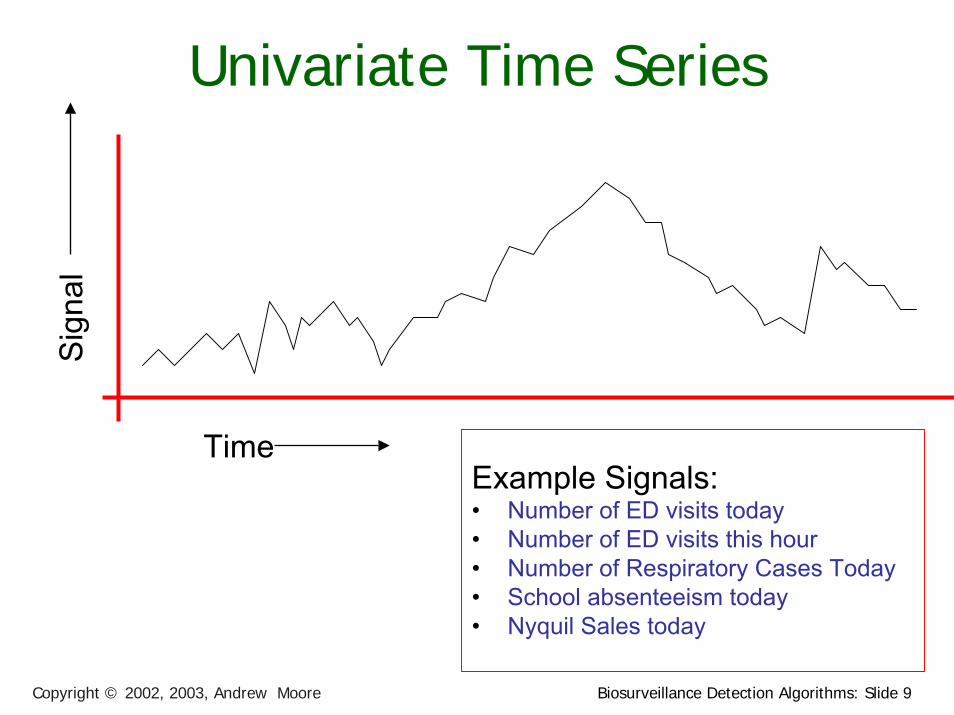
Univariate Time SeriesS
igna
l
TimeExample Signals:• Number of ED visits today• Number of ED visits this hour• Number of Respiratory Cases Today• School absenteeism today• Nyquil Sales today

Biosurveillance Detection Algorithms: Slide 10Copyright © 2002, 2003, Andrew Moore
(When) is there an anomaly?
Biosurveillance Detection Algorithms: Slide 11Copyright © 2002, 2003, Andrew Moore
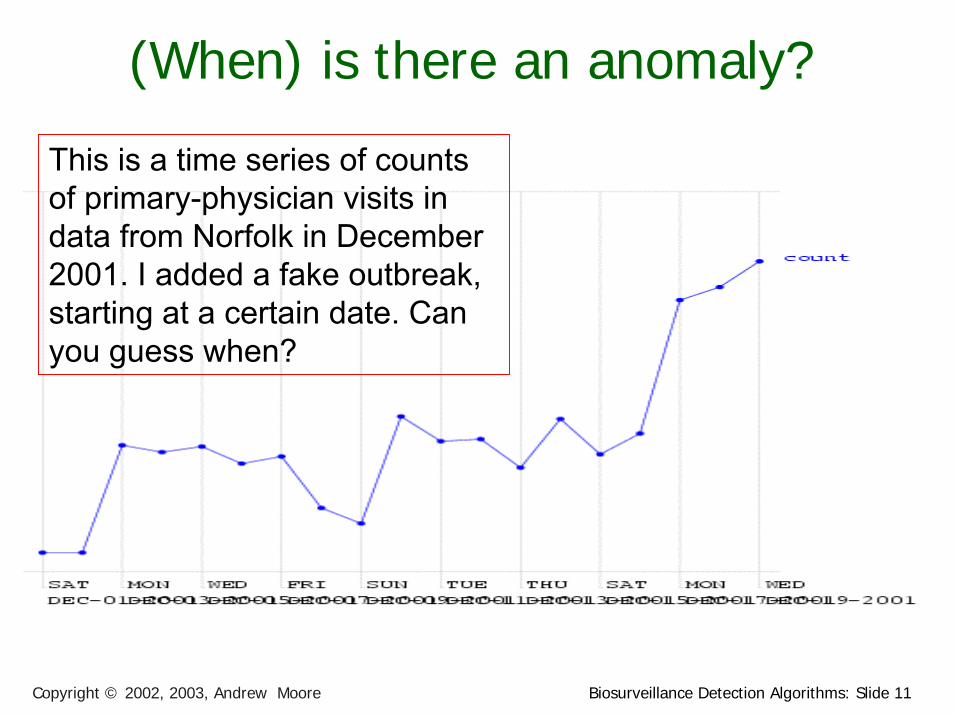
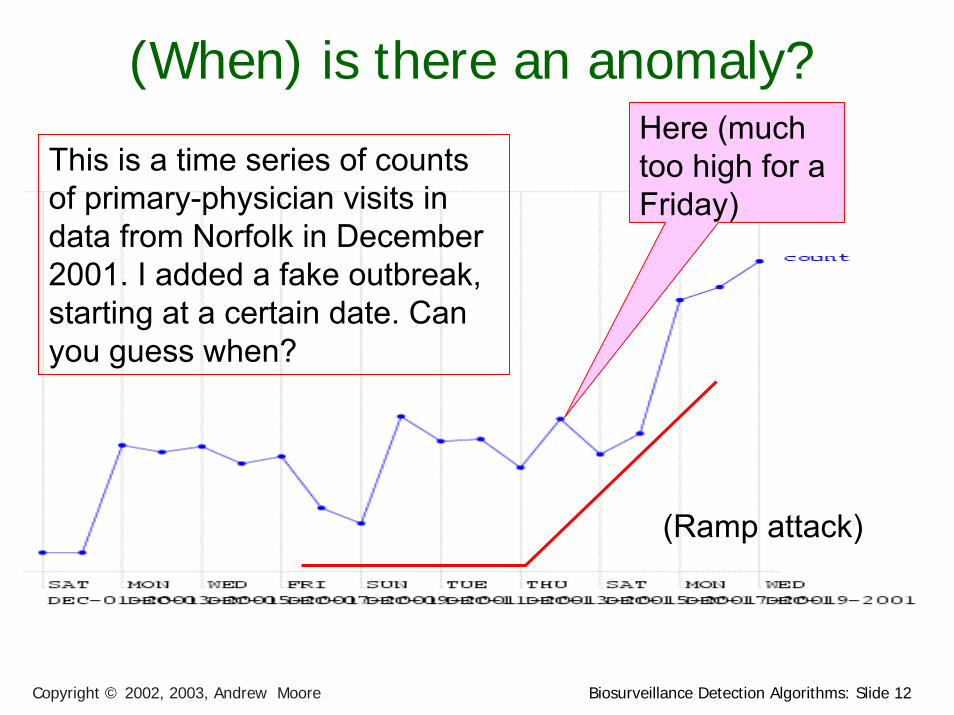
(When) is there an anomaly?
This is a time series of counts of primary-physician visits in data from Norfolk in December 2001. I added a fake outbreak, starting at a certain date. Can you guess when?
Biosurveillance Detection Algorithms: Slide 12Copyright © 2002, 2003, Andrew Moore
(When) is there an anomaly?
This is a time series of counts of primary-physician visits in data from Norfolk in December 2001. I added a fake outbreak, starting at a certain date. Can you guess when?
Here (much too high for a Friday)
(Ramp attack)
Biosurveillance Detection Algorithms: Slide 13Copyright © 2002, 2003, Andrew Moore
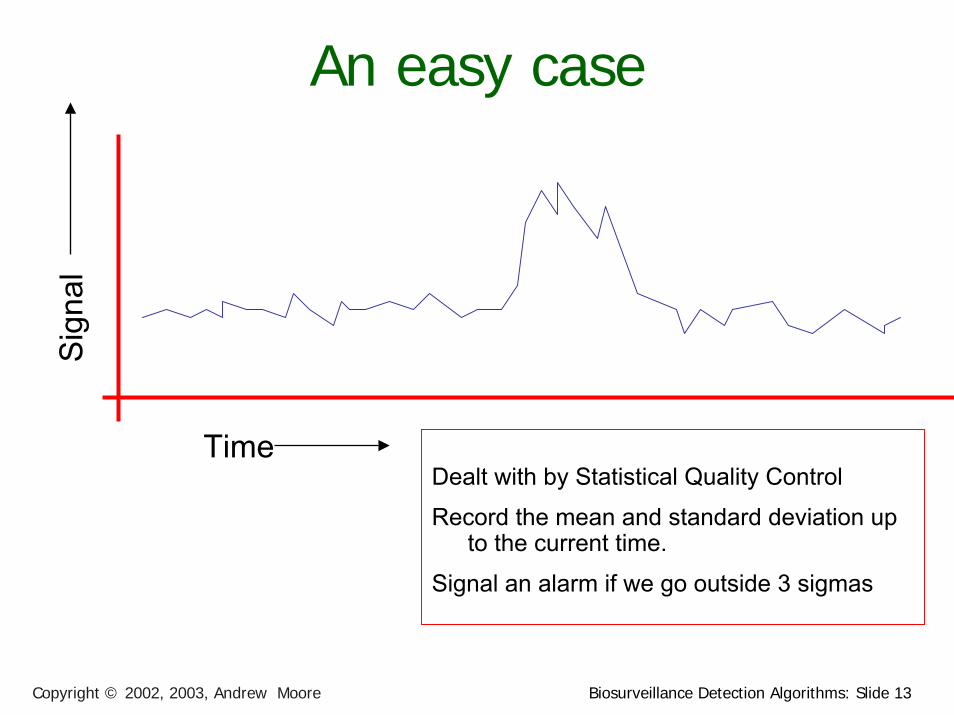
An easy caseS
igna
l
TimeDealt with by Statistical Quality Control
Record the mean and standard deviation up to the current time.
Signal an alarm if we go outside 3 sigmas
Biosurveillance Detection Algorithms: Slide 14Copyright © 2002, 2003, Andrew Moore
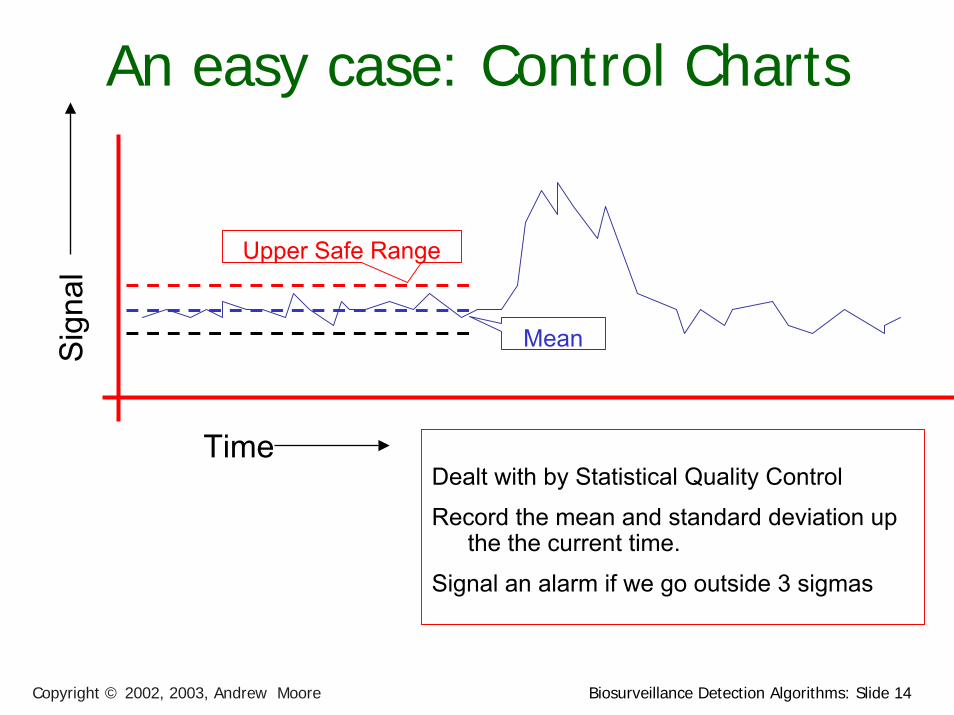
An easy case: Control Charts
Mean
Upper Safe Range
Sig
nal
TimeDealt with by Statistical Quality Control
Record the mean and standard deviation up the the current time.
Signal an alarm if we go outside 3 sigmas
Biosurveillance Detection Algorithms: Slide 15Copyright © 2002, 2003, Andrew Moore
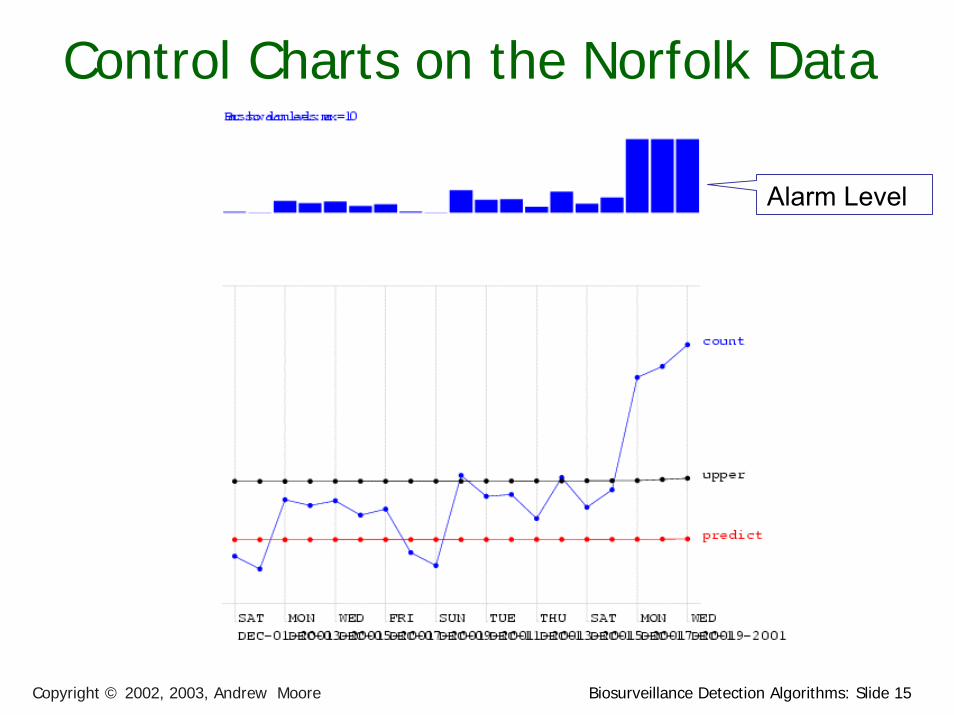
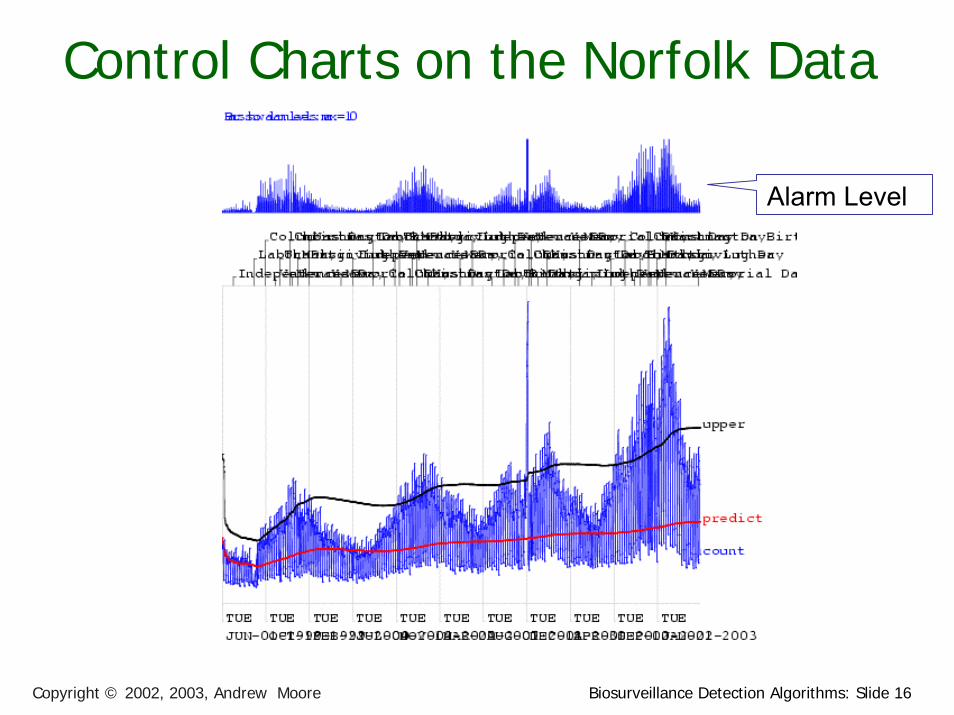
Control Charts on the Norfolk Data
Alarm Level
Biosurveillance Detection Algorithms: Slide 16Copyright © 2002, 2003, Andrew Moore
Control Charts on the Norfolk Data
Alarm Level
Biosurveillance Detection Algorithms: Slide 17Copyright © 2002, 2003, Andrew Moore
Looking at changes from yesterday
Biosurveillance Detection Algorithms: Slide 18Copyright © 2002, 2003, Andrew Moore
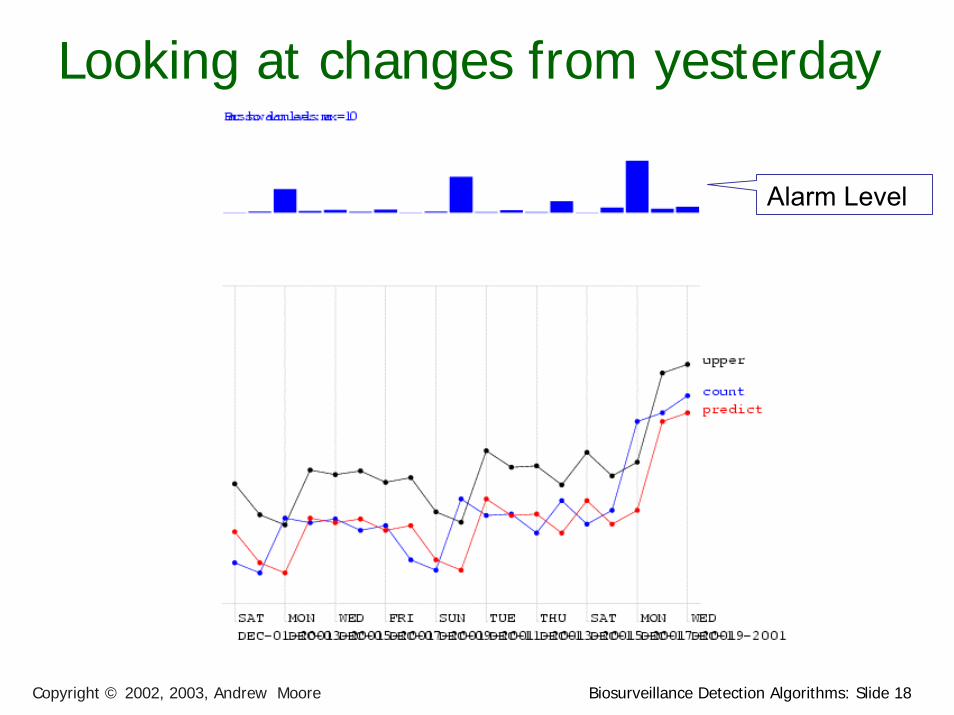
Looking at changes from yesterday
Alarm Level
Biosurveillance Detection Algorithms: Slide 19Copyright © 2002, 2003, Andrew Moore
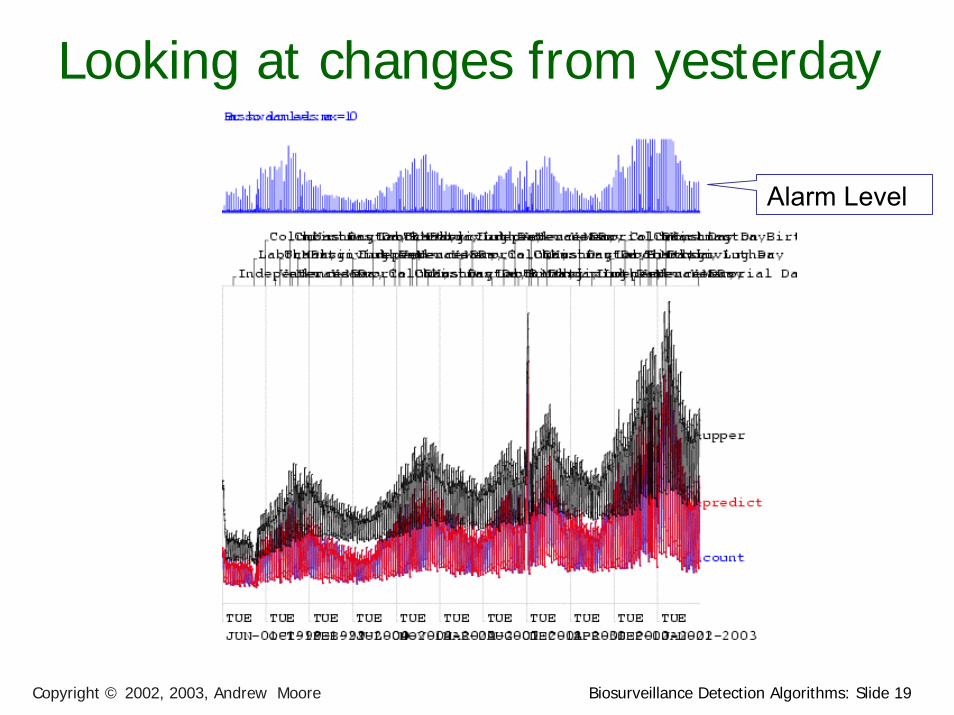
Looking at changes from yesterday
Alarm Level
Biosurveillance Detection Algorithms: Slide 20Copyright © 2002, 2003, Andrew Moore
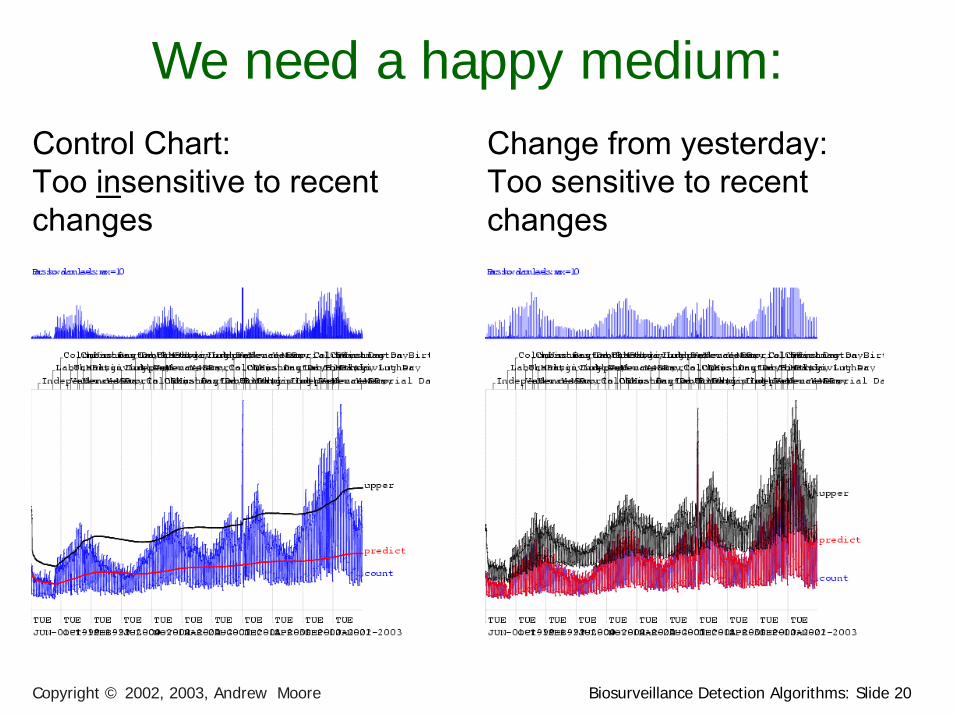
We need a happy medium:Change from yesterday: Too sensitive to recent changes
Control Chart: Too insensitive to recent changes
Biosurveillance Detection Algorithms: Slide 21Copyright © 2002, 2003, Andrew Moore
Moving Average
Biosurveillance Detection Algorithms: Slide 22Copyright © 2002, 2003, Andrew Moore
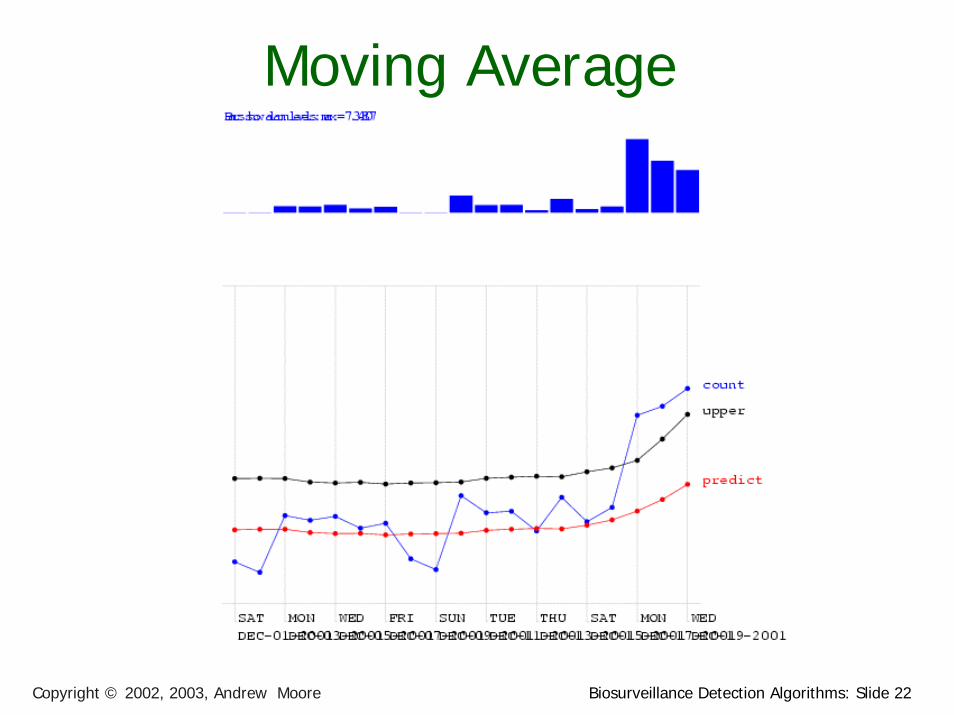
Moving Average
Biosurveillance Detection Algorithms: Slide 23Copyright © 2002, 2003, Andrew Moore
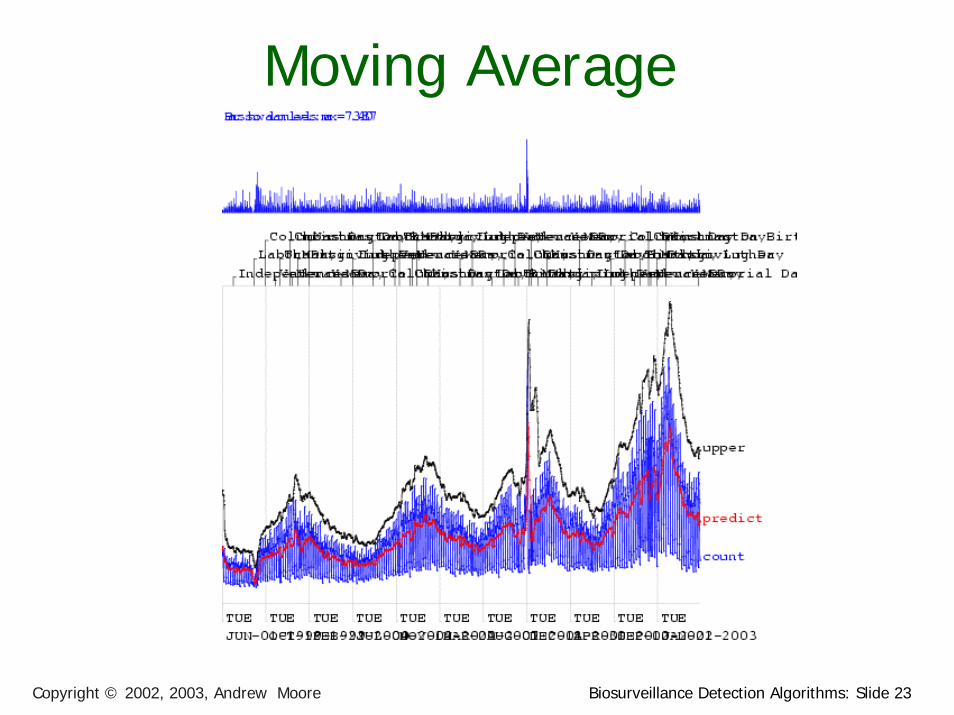
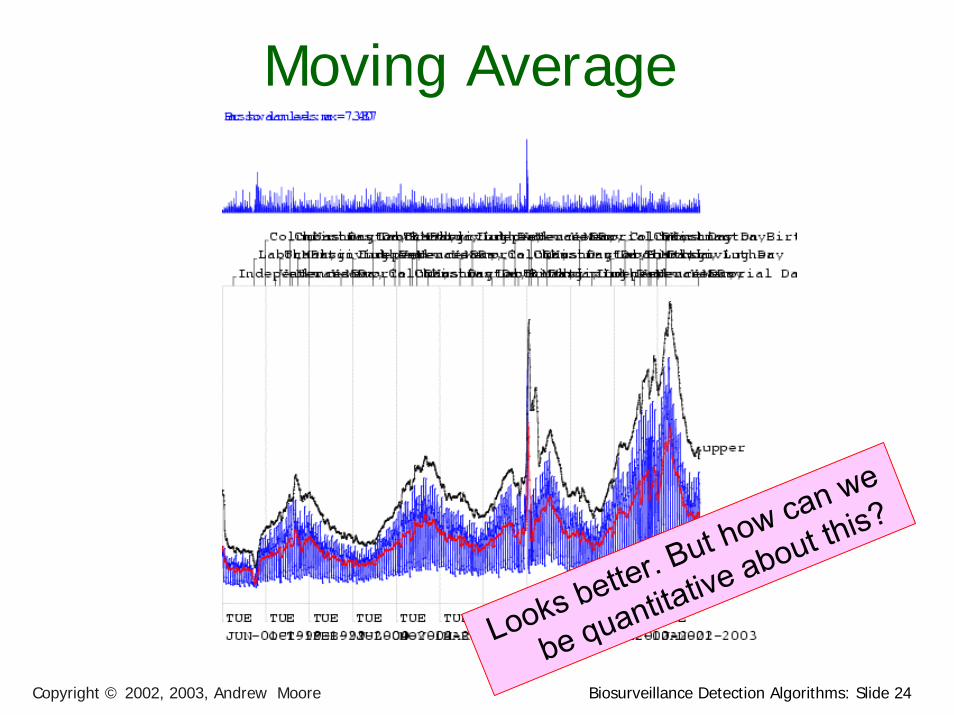
Moving Average
Biosurveillance Detection Algorithms: Slide 24Copyright © 2002, 2003, Andrew Moore
Moving Average
Looks better. But how can we
be quantitative about this?
Biosurveillance Detection Algorithms: Slide 25Copyright © 2002, 2003, Andrew Moore
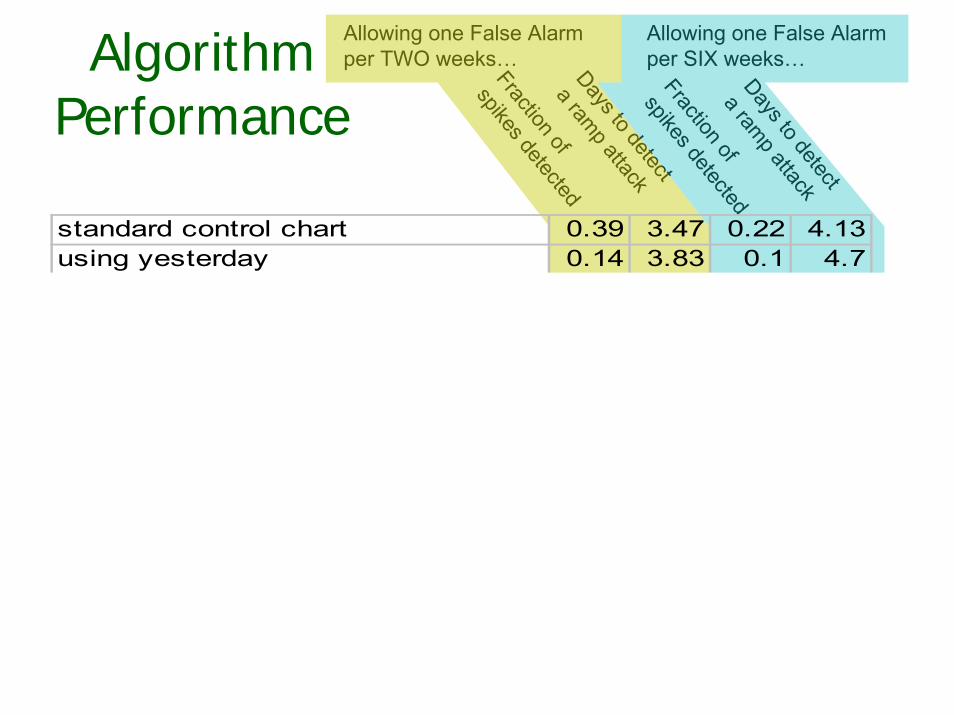
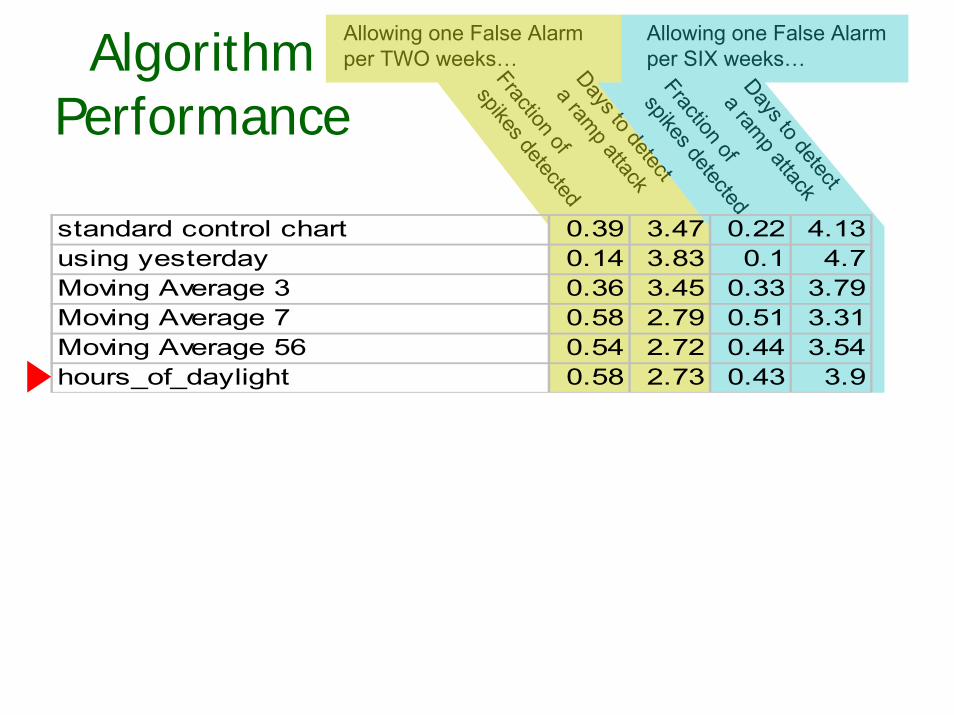
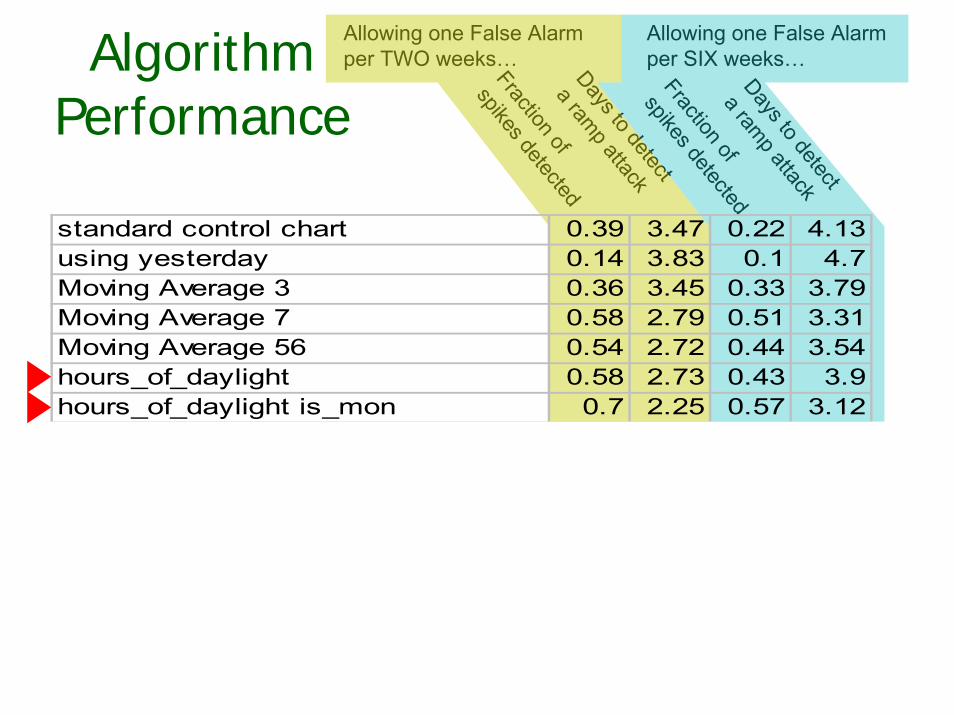
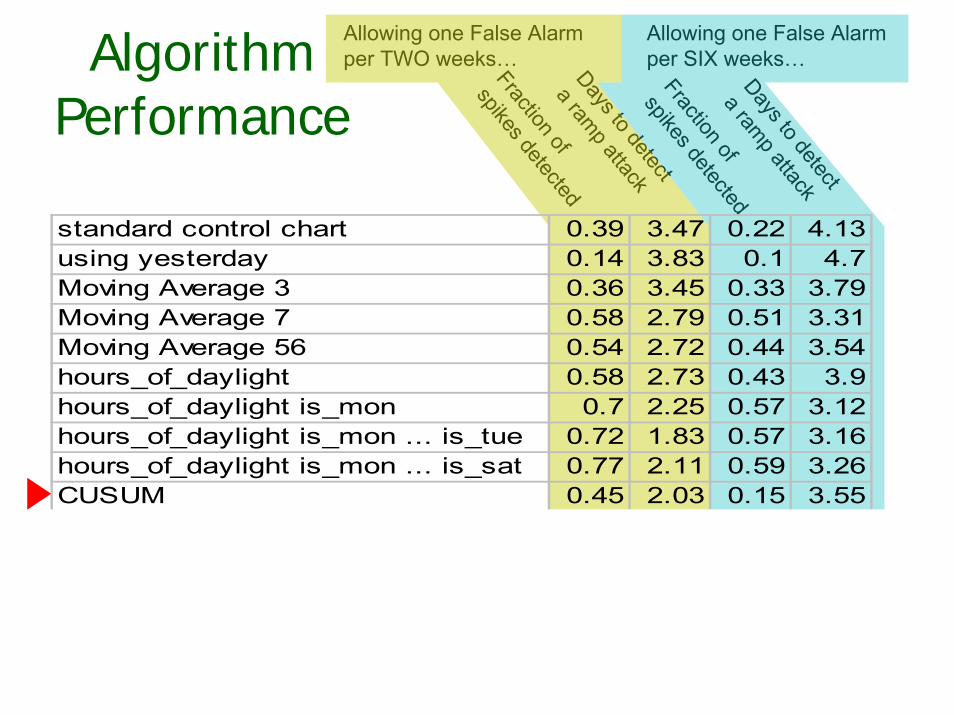
Algorithm Performance
Fraction of
spikes detectedDays to detect
a ramp attack
Allowing one False Alarm per TWO weeks…
Fraction of
spikes detectedDays to detect
a ramp attack
Allowing one False Alarm per SIX weeks…
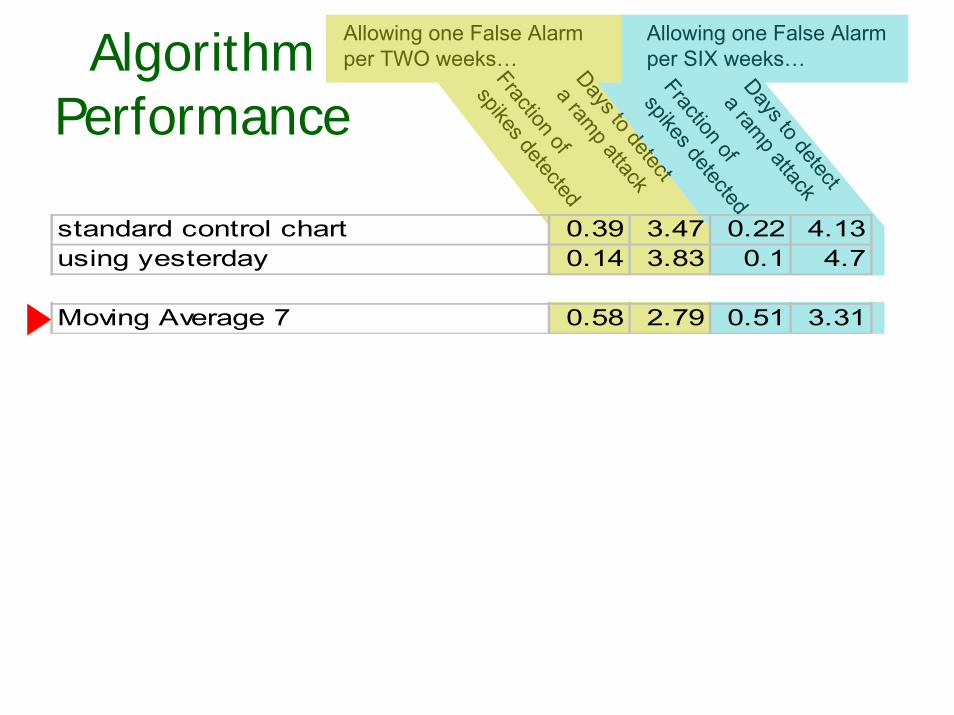
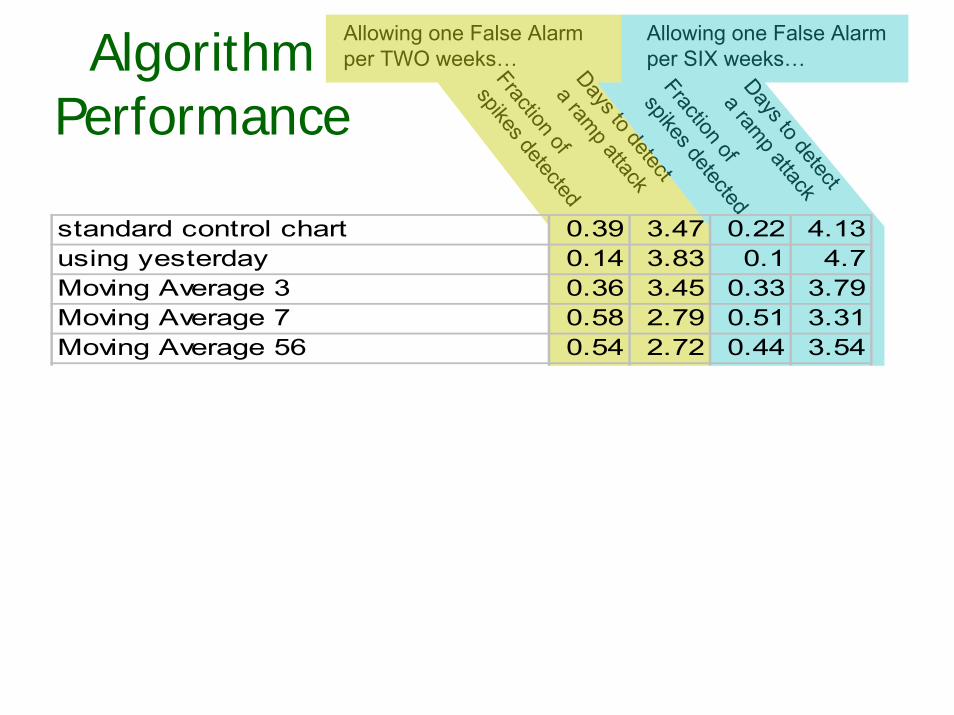
standard control chart 0.39 3.47 0.22 4.13using yesterday 0.14 3.83 0.1 4.7Moving Average 3 0.36 3.45 0.33 3.79Moving Average 7 0.58 2.79 0.51 3.31Moving Average 56 0.54 2.72 0.44 3.54hours_of_daylight 0.58 2.73 0.43 3.9hours_of_daylight is_mon 0.7 2.25 0.57 3.12hours_of_daylight is_mon ... is_tue 0.72 1.83 0.57 3.16hours_of_daylight is_mon ... is_sat 0.77 2.11 0.59 3.26CUSUM 0.45 2.03 0.15 3.55sa-mav-1 0.86 1.88 0.74 2.73sa-mav-7 0.87 1.28 0.83 1.87sa-mav-14 0.86 1.27 0.82 1.62sa-regress 0.73 1.76 0.67 2.21Cough with denominator 0.78 2.15 0.59 2.41Cough with MA 0.65 2.78 0.57 3.24
Biosurveillance Detection Algorithms: Slide 26Copyright © 2002, 2003, Andrew Moore
Algorithm Performance
Fraction of
spikes detectedDays to detect
a ramp attack
Allowing one False Alarm per TWO weeks…
Fraction of
spikes detectedDays to detect
a ramp attack
Allowing one False Alarm per SIX weeks…
standard control chart 0.39 3.47 0.22 4.13using yesterday 0.14 3.83 0.1 4.7Moving Average 3 0.36 3.45 0.33 3.79Moving Average 7 0.58 2.79 0.51 3.31Moving Average 56 0.54 2.72 0.44 3.54hours_of_daylight 0.58 2.73 0.43 3.9hours_of_daylight is_mon 0.7 2.25 0.57 3.12hours_of_daylight is_mon ... is_tue 0.72 1.83 0.57 3.16hours_of_daylight is_mon ... is_sat 0.77 2.11 0.59 3.26CUSUM 0.45 2.03 0.15 3.55sa-mav-1 0.86 1.88 0.74 2.73sa-mav-7 0.87 1.28 0.83 1.87sa-mav-14 0.86 1.27 0.82 1.62sa-regress 0.73 1.76 0.67 2.21Cough with denominator 0.78 2.15 0.59 2.41Cough with MA 0.65 2.78 0.57 3.24
Biosurveillance Detection Algorithms: Slide 27Copyright © 2002, 2003, Andrew Moore
Algorithm Performance
Fraction of
spikes detectedDays to detect
a ramp attack
Allowing one False Alarm per TWO weeks…
Fraction of
spikes detectedDays to detect
a ramp attack
Allowing one False Alarm per SIX weeks…
standard control chart 0.39 3.47 0.22 4.13using yesterday 0.14 3.83 0.1 4.7Moving Average 3 0.36 3.45 0.33 3.79Moving Average 7 0.58 2.79 0.51 3.31Moving Average 56 0.54 2.72 0.44 3.54hours_of_daylight 0.58 2.73 0.43 3.9hours_of_daylight is_mon 0.7 2.25 0.57 3.12hours_of_daylight is_mon ... is_tue 0.72 1.83 0.57 3.16hours_of_daylight is_mon ... is_sat 0.77 2.11 0.59 3.26CUSUM 0.45 2.03 0.15 3.55sa-mav-1 0.86 1.88 0.74 2.73sa-mav-7 0.87 1.28 0.83 1.87sa-mav-14 0.86 1.27 0.82 1.62sa-regress 0.73 1.76 0.67 2.21Cough with denominator 0.78 2.15 0.59 2.41Cough with MA 0.65 2.78 0.57 3.24
Biosurveillance Detection Algorithms: Slide 28Copyright © 2002, 2003, Andrew Moore
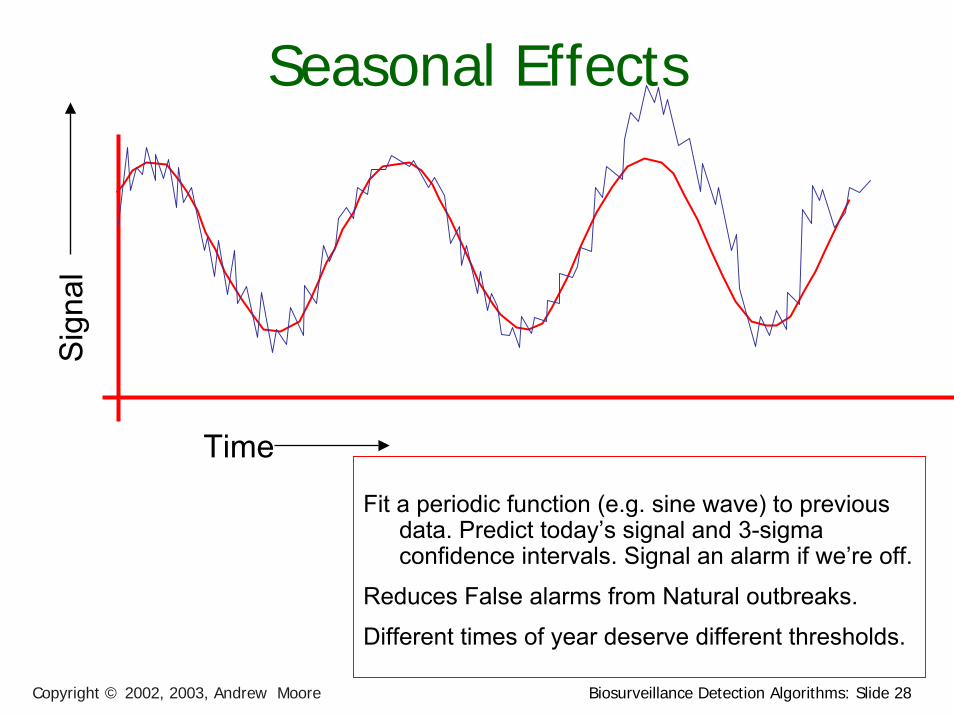
Seasonal Effects
Time
Sig
nal
Fit a periodic function (e.g. sine wave) to previous data. Predict today’s signal and 3-sigma confidence intervals. Signal an alarm if we’re off.
Reduces False alarms from Natural outbreaks.
Different times of year deserve different thresholds.
Biosurveillance Detection Algorithms: Slide 29Copyright © 2002, 2003, Andrew Moore
Algorithm Performance
Fraction of
spikes detectedDays to detect
a ramp attack
Allowing one False Alarm per TWO weeks…
Fraction of
spikes detectedDays to detect
a ramp attack
Allowing one False Alarm per SIX weeks…
standard control chart 0.39 3.47 0.22 4.13using yesterday 0.14 3.83 0.1 4.7Moving Average 3 0.36 3.45 0.33 3.79Moving Average 7 0.58 2.79 0.51 3.31Moving Average 56 0.54 2.72 0.44 3.54hours_of_daylight 0.58 2.73 0.43 3.9hours_of_daylight is_mon 0.7 2.25 0.57 3.12hours_of_daylight is_mon ... is_tue 0.72 1.83 0.57 3.16hours_of_daylight is_mon ... is_sat 0.77 2.11 0.59 3.26CUSUM 0.45 2.03 0.15 3.55sa-mav-1 0.86 1.88 0.74 2.73sa-mav-7 0.87 1.28 0.83 1.87sa-mav-14 0.86 1.27 0.82 1.62sa-regress 0.73 1.76 0.67 2.21Cough with denominator 0.78 2.15 0.59 2.41Cough with MA 0.65 2.78 0.57 3.24
Biosurveillance Detection Algorithms: Slide 30Copyright © 2002, 2003, Andrew Moore
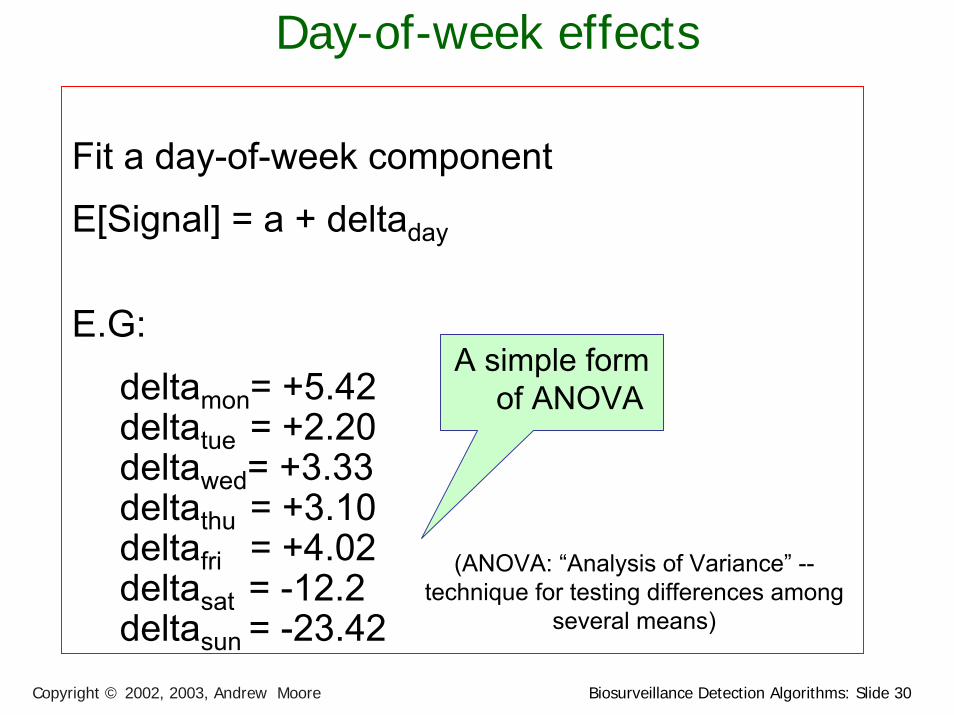
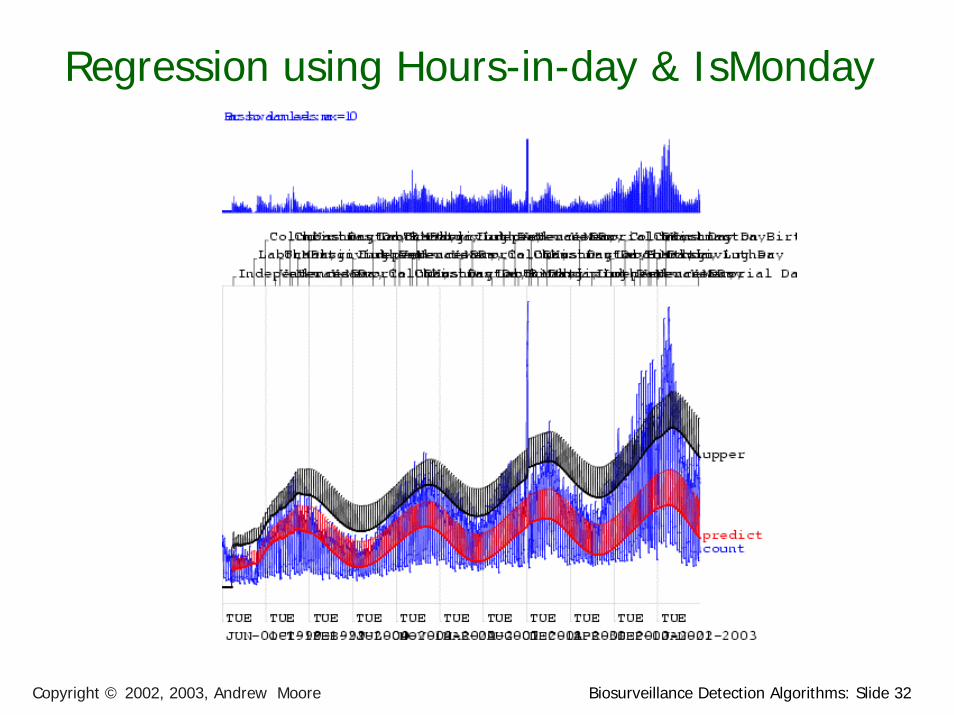
Day-of-week effects
Fit a day-of-week component
E[Signal] = a + deltaday
E.G:
deltamon= +5.42 deltatue = +2.20deltawed= +3.33deltathu = +3.10deltafri = +4.02deltasat = -12.2deltasun = -23.42
A simple form of ANOVA
(ANOVA: “Analysis of Variance” --technique for testing differences among
several means)
Biosurveillance Detection Algorithms: Slide 31Copyright © 2002, 2003, Andrew Moore
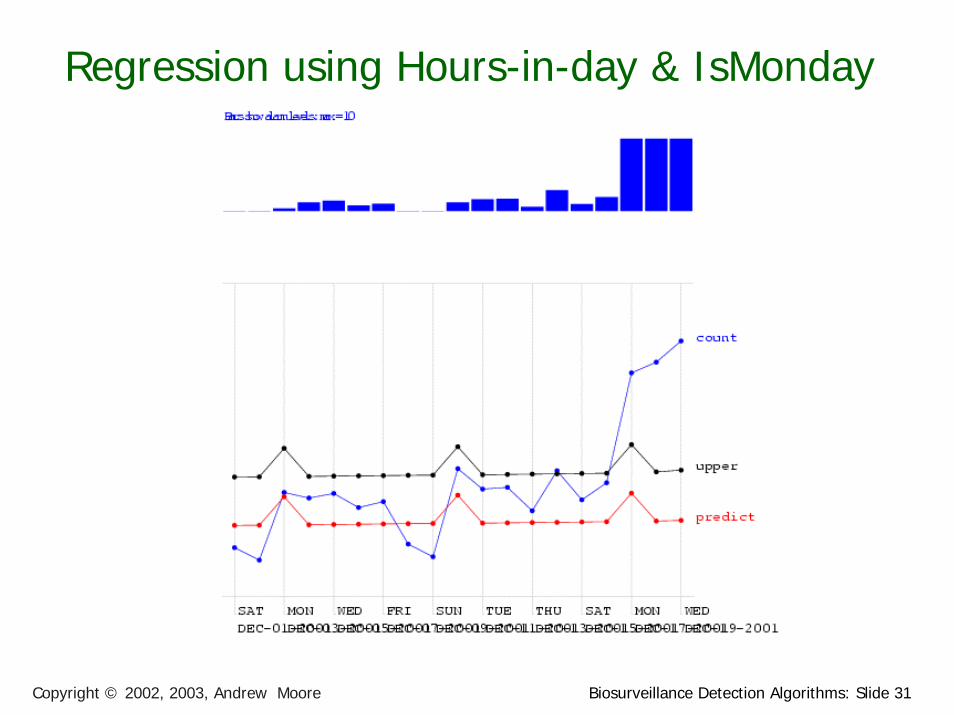
Regression using Hours-in-day & IsMonday
Biosurveillance Detection Algorithms: Slide 32Copyright © 2002, 2003, Andrew Moore
Regression using Hours-in-day & IsMonday
Biosurveillance Detection Algorithms: Slide 33Copyright © 2002, 2003, Andrew Moore
Algorithm Performance
Fraction of
spikes detectedDays to detect
a ramp attack
Allowing one False Alarm per TWO weeks…
Fraction of
spikes detectedDays to detect
a ramp attack
Allowing one False Alarm per SIX weeks…
standard control chart 0.39 3.47 0.22 4.13using yesterday 0.14 3.83 0.1 4.7Moving Average 3 0.36 3.45 0.33 3.79Moving Average 7 0.58 2.79 0.51 3.31Moving Average 56 0.54 2.72 0.44 3.54hours_of_daylight 0.58 2.73 0.43 3.9hours_of_daylight is_mon 0.7 2.25 0.57 3.12hours_of_daylight is_mon ... is_tue 0.72 1.83 0.57 3.16hours_of_daylight is_mon ... is_sat 0.77 2.11 0.59 3.26CUSUM 0.45 2.03 0.15 3.55sa-mav-1 0.86 1.88 0.74 2.73sa-mav-7 0.87 1.28 0.83 1.87sa-mav-14 0.86 1.27 0.82 1.62sa-regress 0.73 1.76 0.67 2.21Cough with denominator 0.78 2.15 0.59 2.41Cough with MA 0.65 2.78 0.57 3.24
Biosurveillance Detection Algorithms: Slide 34Copyright © 2002, 2003, Andrew Moore
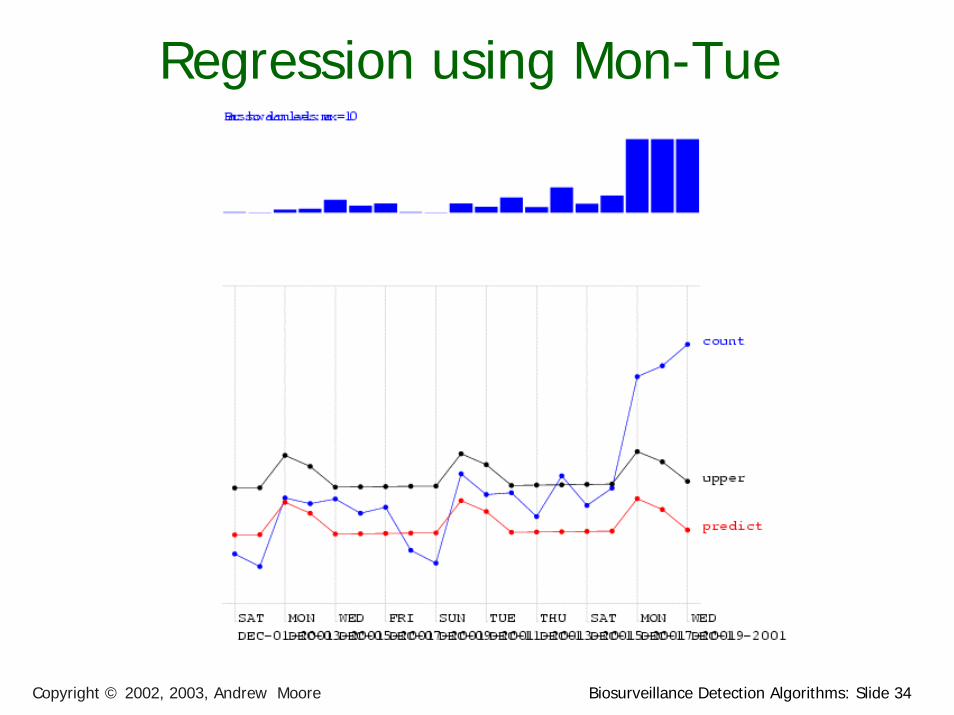
Regression using Mon-Tue

Biosurveillance Detection Algorithms: Slide 35Copyright © 2002, 2003, Andrew Moore
Algorithm Performance
Fraction of
spikes detectedDays to detect
a ramp attack
Allowing one False Alarm per TWO weeks…
Fraction of
spikes detectedDays to detect
a ramp attack
Allowing one False Alarm per SIX weeks…
standard control chart 0.39 3.47 0.22 4.13using yesterday 0.14 3.83 0.1 4.7Moving Average 3 0.36 3.45 0.33 3.79Moving Average 7 0.58 2.79 0.51 3.31Moving Average 56 0.54 2.72 0.44 3.54hours_of_daylight 0.58 2.73 0.43 3.9hours_of_daylight is_mon 0.7 2.25 0.57 3.12hours_of_daylight is_mon ... is_tue 0.72 1.83 0.57 3.16hours_of_daylight is_mon ... is_sat 0.77 2.11 0.59 3.26CUSUM 0.45 2.03 0.15 3.55sa-mav-1 0.86 1.88 0.74 2.73sa-mav-7 0.87 1.28 0.83 1.87sa-mav-14 0.86 1.27 0.82 1.62sa-regress 0.73 1.76 0.67 2.21Cough with denominator 0.78 2.15 0.59 2.41Cough with MA 0.65 2.78 0.57 3.24
Biosurveillance Detection Algorithms: Slide 36Copyright © 2002, 2003, Andrew Moore
CUSUM• CUmulative SUM Statistics
• Keep a running sum of “surprises”: a sum of excesses each day over the prediction
• When this sum exceeds threshold, signal alarm and reset sum
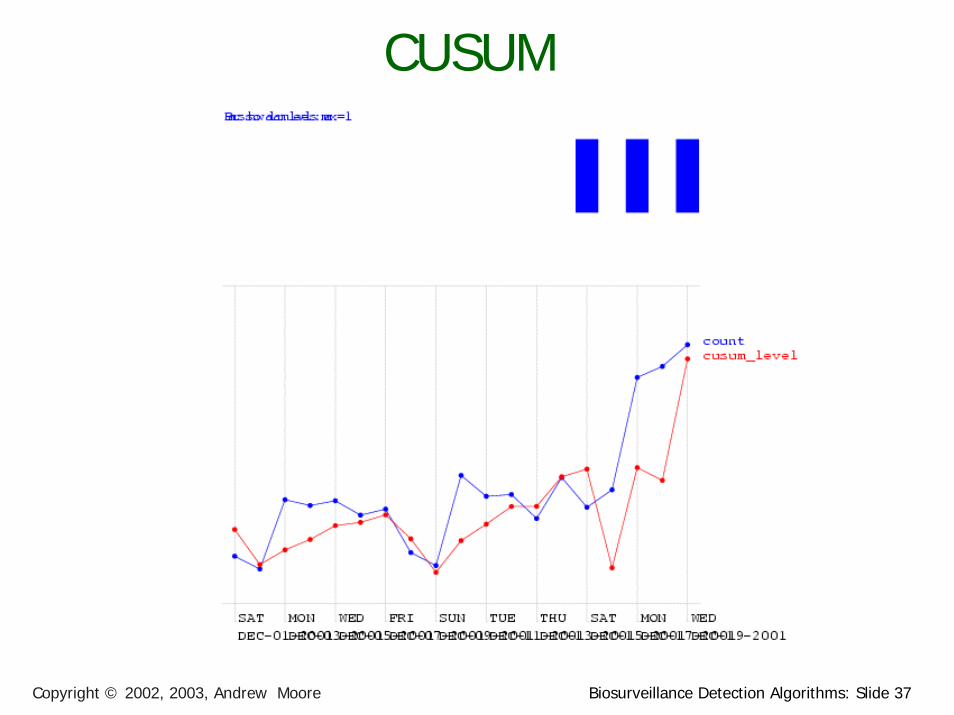
Biosurveillance Detection Algorithms: Slide 37Copyright © 2002, 2003, Andrew Moore
CUSUM
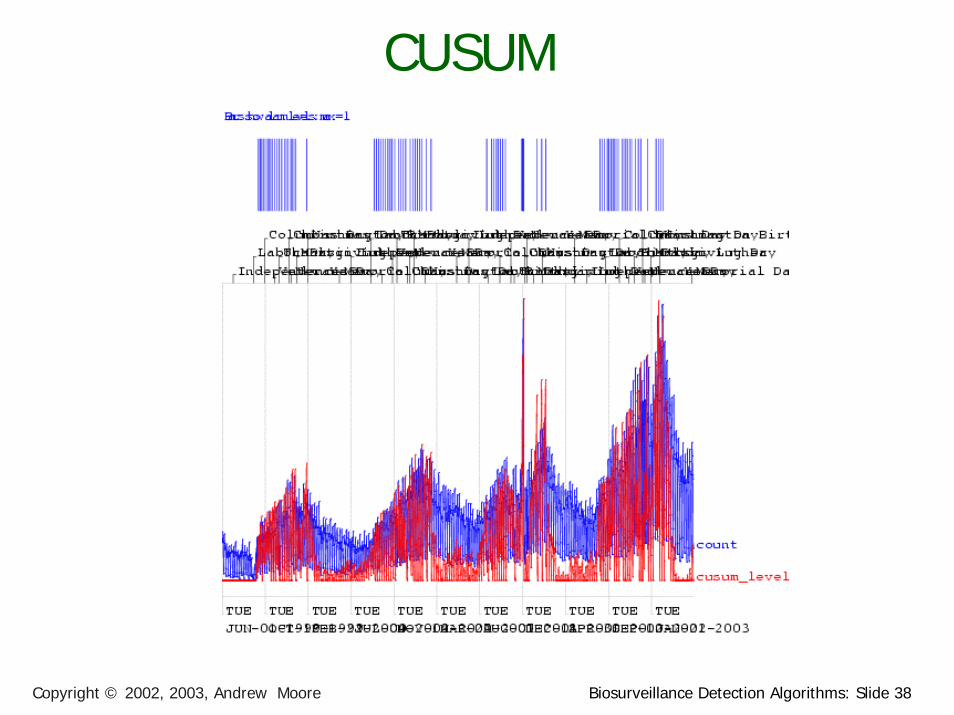
Biosurveillance Detection Algorithms: Slide 38Copyright © 2002, 2003, Andrew Moore
CUSUM
Biosurveillance Detection Algorithms: Slide 39Copyright © 2002, 2003, Andrew Moore
Algorithm Performance
Fraction of
spikes detectedDays to detect
a ramp attack
Allowing one False Alarm per TWO weeks…
Fraction of
spikes detectedDays to detect
a ramp attack
Allowing one False Alarm per SIX weeks…
standard control chart 0.39 3.47 0.22 4.13using yesterday 0.14 3.83 0.1 4.7Moving Average 3 0.36 3.45 0.33 3.79Moving Average 7 0.58 2.79 0.51 3.31Moving Average 56 0.54 2.72 0.44 3.54hours_of_daylight 0.58 2.73 0.43 3.9hours_of_daylight is_mon 0.7 2.25 0.57 3.12hours_of_daylight is_mon ... is_tue 0.72 1.83 0.57 3.16hours_of_daylight is_mon ... is_sat 0.77 2.11 0.59 3.26CUSUM 0.45 2.03 0.15 3.55sa-mav-1 0.86 1.88 0.74 2.73sa-mav-7 0.87 1.28 0.83 1.87sa-mav-14 0.86 1.27 0.82 1.62sa-regress 0.73 1.76 0.67 2.21Cough with denominator 0.78 2.15 0.59 2.41Cough with MA 0.65 2.78 0.57 3.24

Biosurveillance Detection Algorithms: Slide 40Copyright © 2002, 2003, Andrew Moore
Other state-of-the-art methods• Wavelets• Change-point detection• Kalman filters• Hidden Markov Models
Biosurveillance Detection Algorithms: Slide 41Copyright © 2002, 2003, Andrew Moore
What you’ll learn about
• Noticing events in bio-event time series
• Tracking many series at once
• Detecting geographic hotspots
• Finding emerging new patterns
Univariate Anomaly Detection
Multivariate Anomaly Detection
Spatial Scan StatisticsWSARE
Biosurveillance Detection Algorithms: Slide 42Copyright © 2002, 2003, Andrew Moore
Multiple Signals
Biosurveillance Detection Algorithms: Slide 43Copyright © 2002, 2003, Andrew Moore
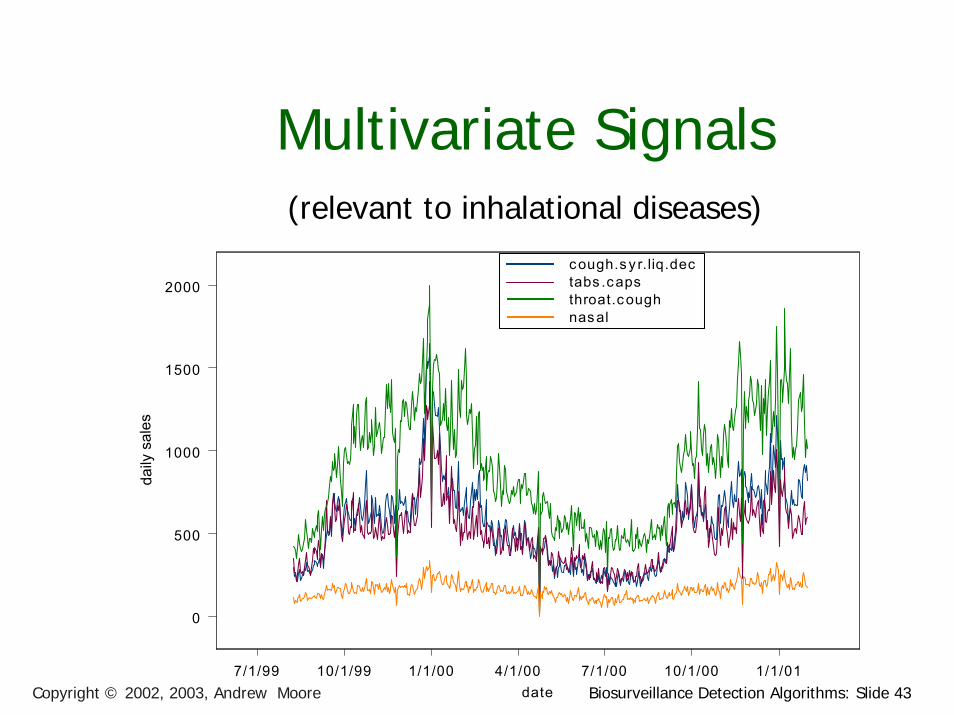
Multivariate Signals
7/1/99 10/1/99 1/1/00 4/1/00 7/1/00 10/1/00 1/1/01date
0
500
1000
1500
2000cough.sy r.liq.dectabs .capsthroat.coughnasal
daily
sal
es
(relevant to inhalational diseases)
Biosurveillance Detection Algorithms: Slide 44Copyright © 2002, 2003, Andrew Moore
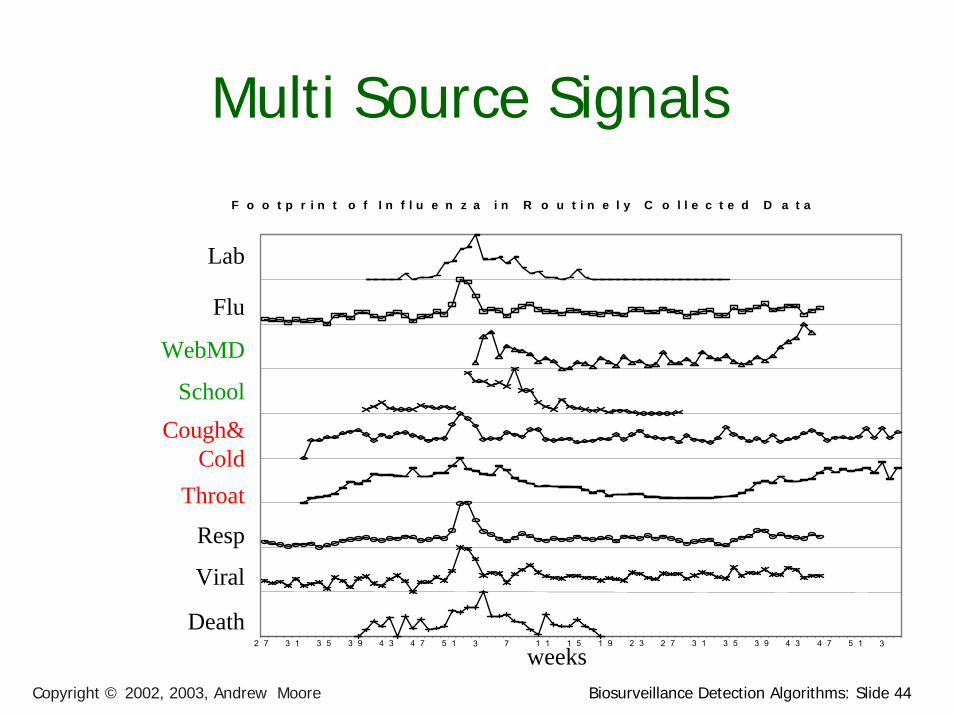
Multi Source Signals
2 7 3 1 3 5 3 9 4 3 4 7 5 1 3 7 1 1 1 5 1 9 2 3 2 7 3 1 3 5 3 9 4 3 4 7 5 1 3
D e a t h
L a b
F l u
W e b M D
S c h o o l
C o u g h & C o l d
C o u g h S y r u p
R e s p
V i r a l
F o o t p r i n t o f I n f l u e n z a i n R o u t i n e l y C o l l e c t e d D a t a
Lab
Flu
WebMD
SchoolCough&
ColdThroat
Resp
Viral
Deathweeks

Biosurveillance Detection Algorithms: Slide 45Copyright © 2002, 2003, Andrew Moore
What if you’ve got multiple signals?
Red: Cough Sales
Blue: ED Respiratory Visits
Sig
nal
TimeIdea One:
Simply treat it as two separate alarm-from-signal problems.
…Question: why might that not be the best we can do?

Biosurveillance Detection Algorithms: Slide 46Copyright © 2002, 2003, Andrew Moore
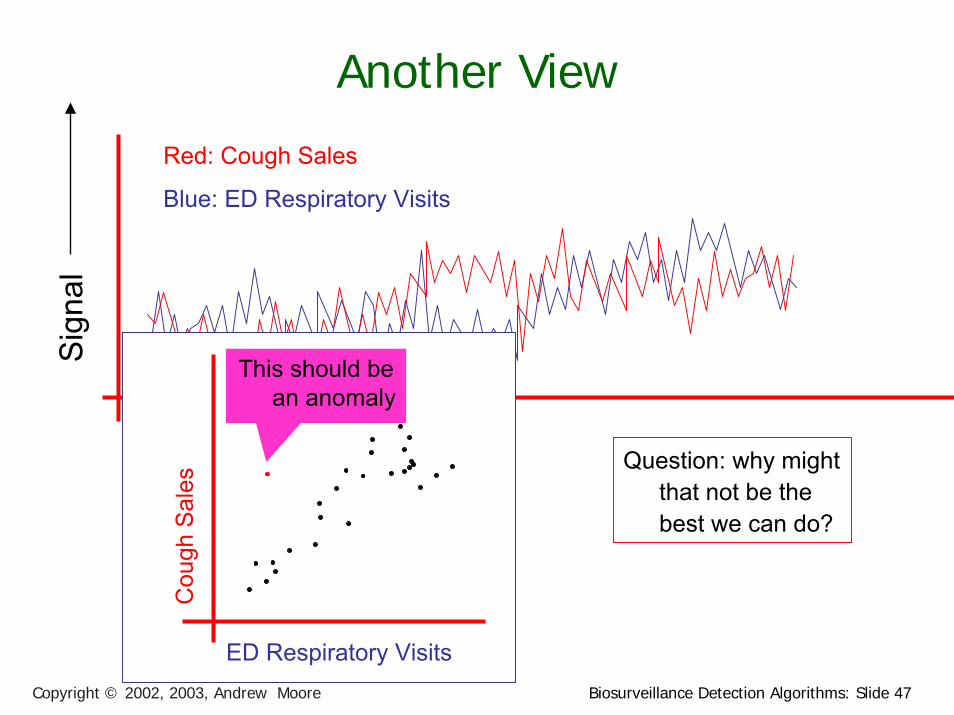
Another View
Red: Cough Sales
Blue: ED Respiratory Visits
Question: why might that not be the best we can do?
Cou
gh S
ales
ED Respiratory Visits
Sig
nal
Biosurveillance Detection Algorithms: Slide 47Copyright © 2002, 2003, Andrew Moore
Another View
Red: Cough Sales
Blue: ED Respiratory Visits
Sig
nal
Cou
gh S
ales
ED Respiratory Visits
This should be an anomaly
Question: why might that not be the best we can do?
Biosurveillance Detection Algorithms: Slide 48Copyright © 2002, 2003, Andrew Moore
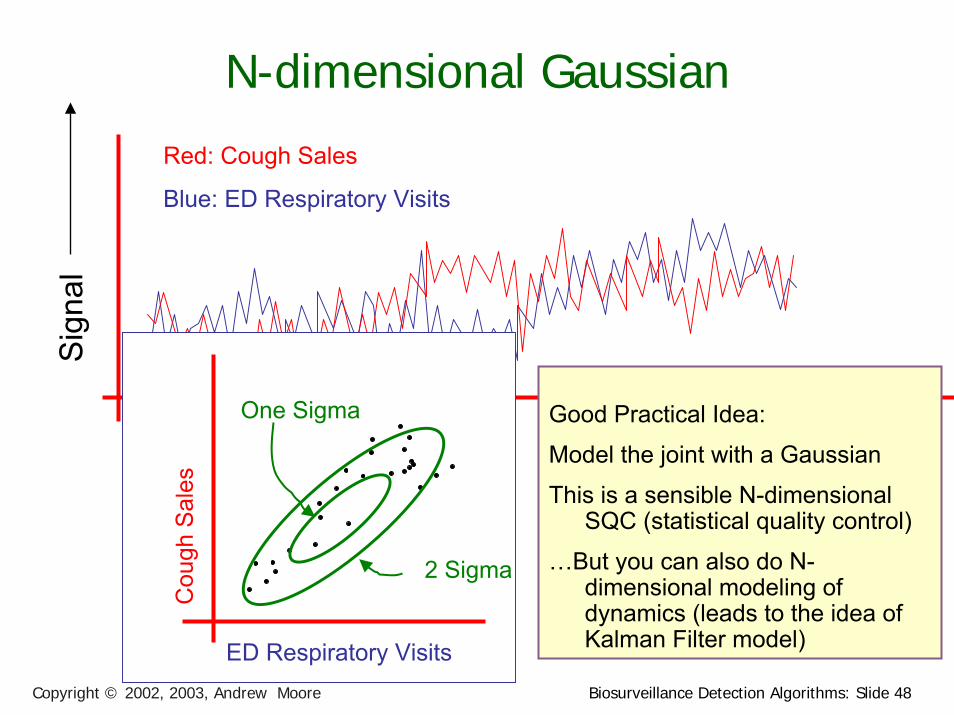
N-dimensional Gaussian
Red: Cough Sales
Blue: ED Respiratory Visits
Good Practical Idea:
Model the joint with a Gaussian
This is a sensible N-dimensional SQC (statistical quality control)
…But you can also do N-dimensional modeling of dynamics (leads to the idea of Kalman Filter model)
Sig
nal
Cou
gh S
ales
ED Respiratory Visits
One Sigma
2 Sigma
Biosurveillance Detection Algorithms: Slide 49Copyright © 2002, 2003, Andrew Moore
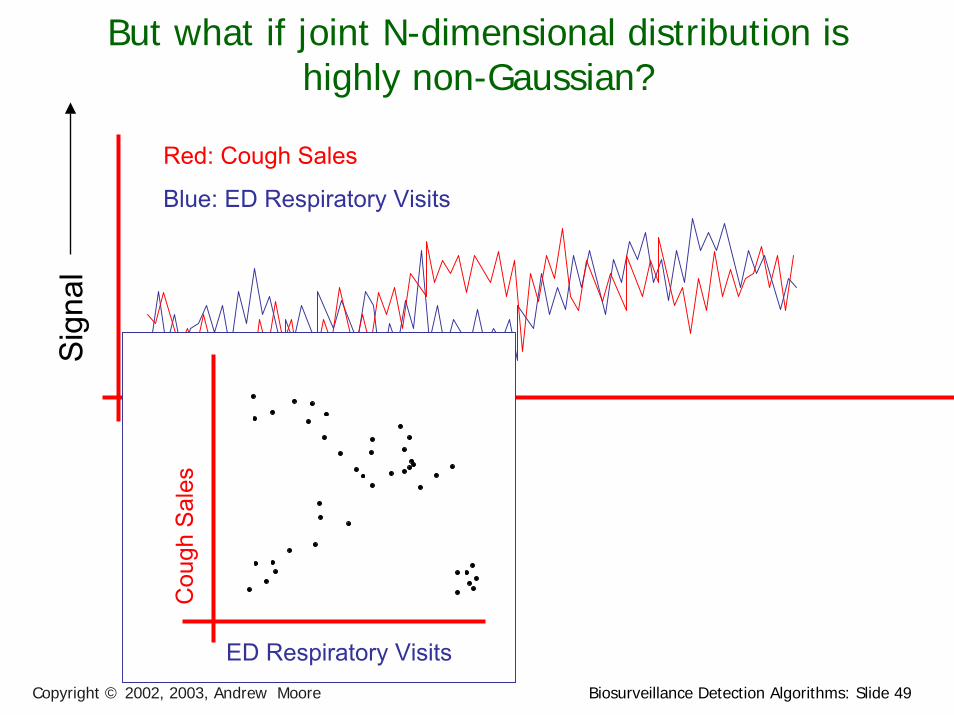
But what if joint N-dimensional distribution is highly non-Gaussian?
Red: Cough Sales
Blue: ED Respiratory Visits
Sig
nal
Cou
gh S
ales
ED Respiratory Visits
Biosurveillance Detection Algorithms: Slide 50Copyright © 2002, 2003, Andrew Moore
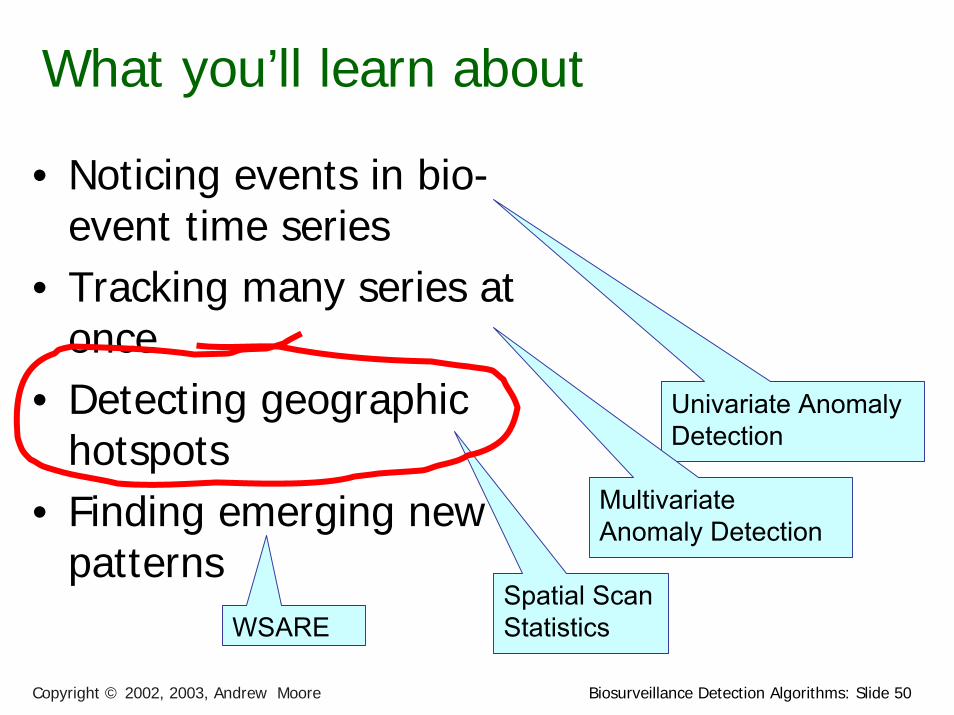
What you’ll learn about
• Noticing events in bio-event time series
• Tracking many series at once
• Detecting geographic hotspots
• Finding emerging new patterns
Univariate Anomaly Detection
Multivariate Anomaly Detection
Spatial Scan StatisticsWSARE
Biosurveillance Detection Algorithms: Slide 51Copyright © 2002, 2003, Andrew Moore
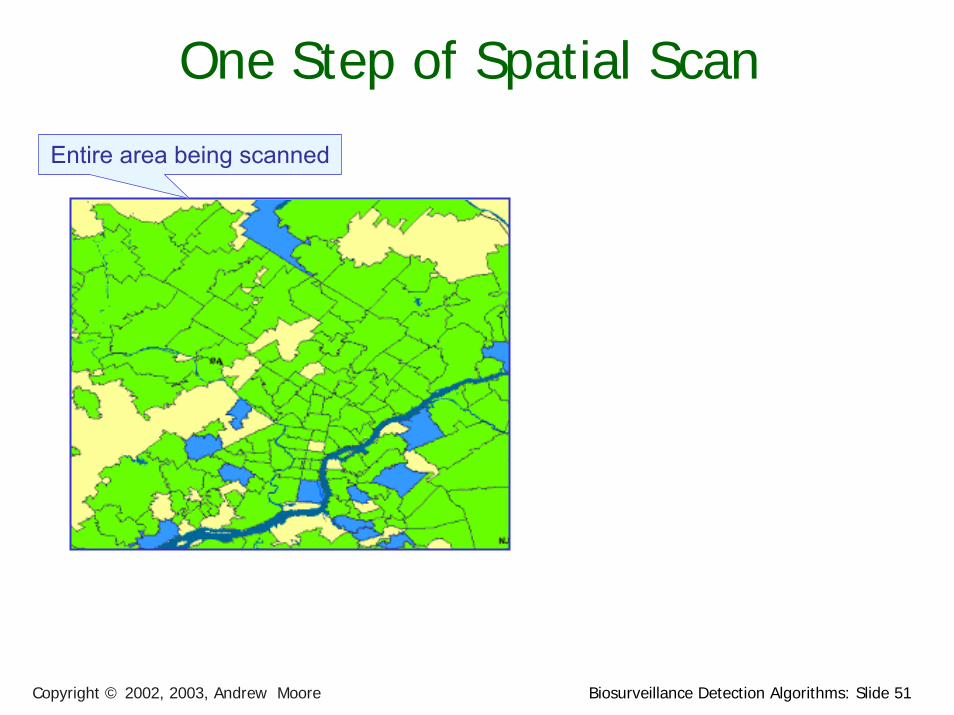
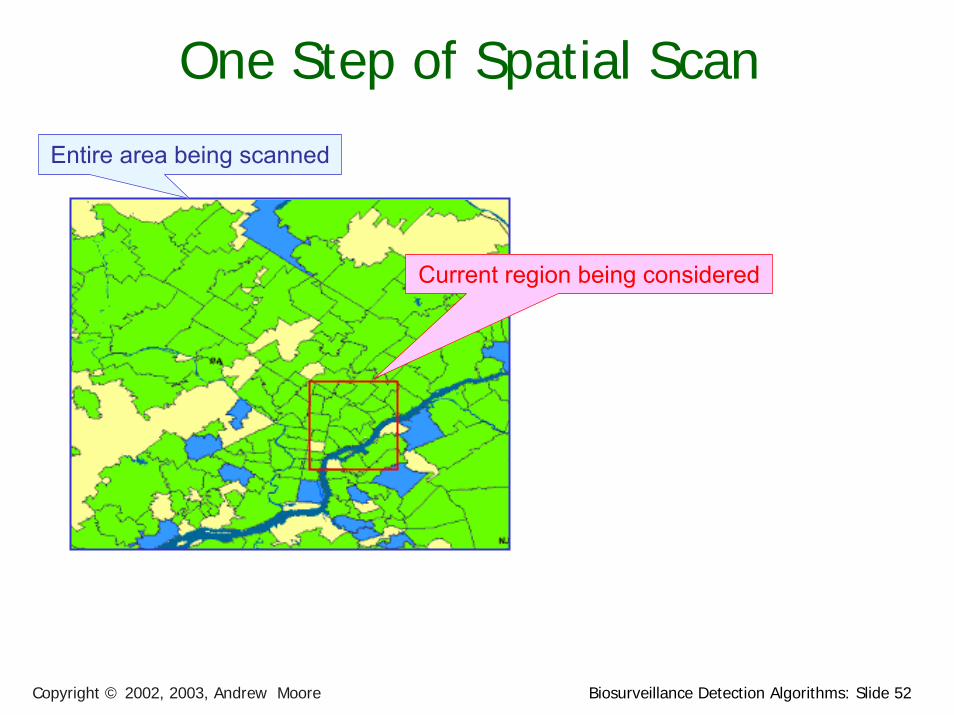
One Step of Spatial Scan
Entire area being scanned
Biosurveillance Detection Algorithms: Slide 52Copyright © 2002, 2003, Andrew Moore
One Step of Spatial Scan
Entire area being scanned
Current region being considered

Biosurveillance Detection Algorithms: Slide 53Copyright © 2002, 2003, Andrew Moore
One Step of Spatial Scan
Entire area being scanned
Current region being considered
I have a population of 5300 of whom 53 are sick (1%)
Everywhere else has a population of 2,200,000 of whom 20,000 are sick (0.9%)

Biosurveillance Detection Algorithms: Slide 54Copyright © 2002, 2003, Andrew Moore
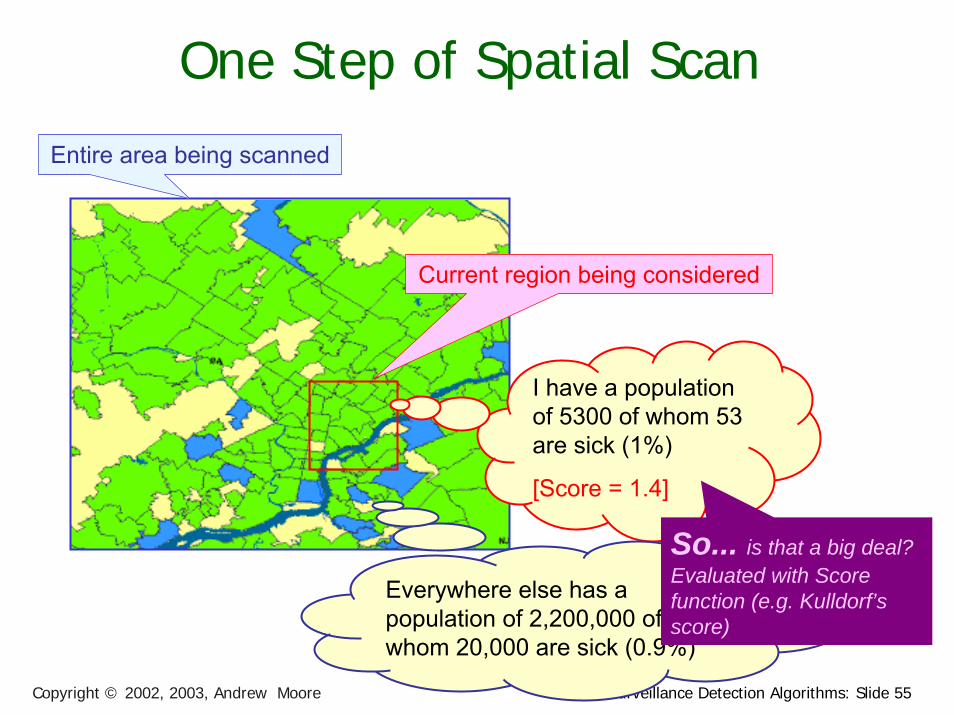
One Step of Spatial Scan
Entire area being scanned
Current region being considered
I have a population of 5300 of whom 53 are sick (1%)
Everywhere else has a population of 2,200,000 of whom 20,000 are sick (0.9%)
So... is that a big deal? Evaluated with Score function (e.g. Kulldorf’sscore)
Biosurveillance Detection Algorithms: Slide 55Copyright © 2002, 2003, Andrew Moore
One Step of Spatial Scan
Entire area being scanned
Current region being considered
I have a population of 5300 of whom 53 are sick (1%)
[Score = 1.4]
Everywhere else has a population of 2,200,000 of whom 20,000 are sick (0.9%)
So... is that a big deal? Evaluated with Score function (e.g. Kulldorf’sscore)
Biosurveillance Detection Algorithms: Slide 56Copyright © 2002, 2003, Andrew Moore
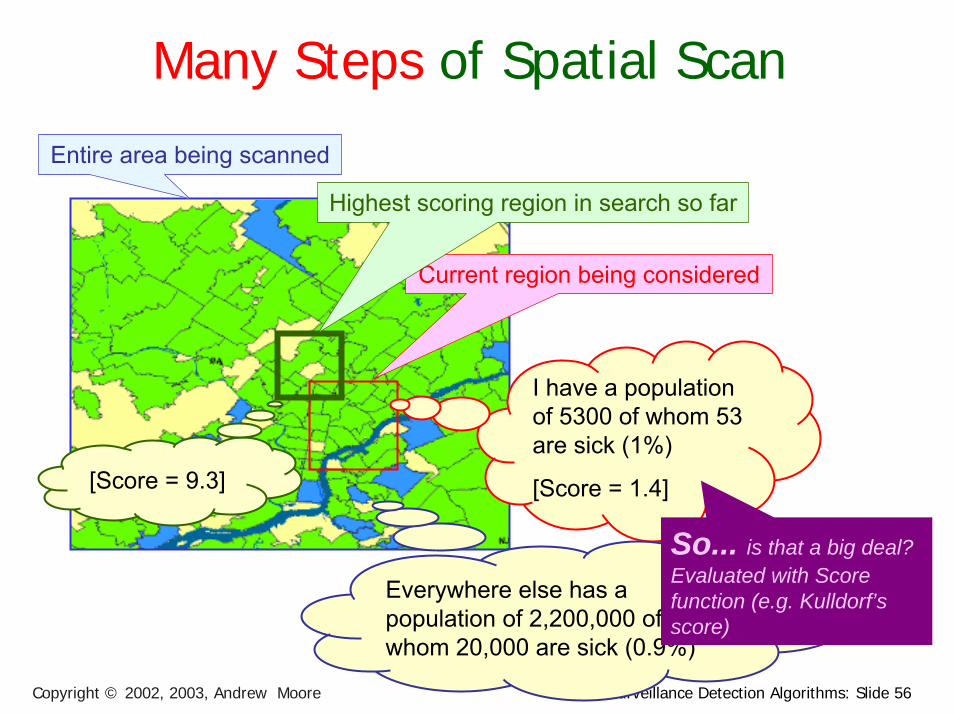
Many Steps of Spatial Scan
Entire area being scanned
Current region being considered
I have a population of 5300 of whom 53 are sick (1%)
[Score = 1.4]
Everywhere else has a population of 2,200,000 of whom 20,000 are sick (0.9%)
So... is that a big deal? Evaluated with Score function (e.g. Kulldorf’sscore)
Highest scoring region in search so far
[Score = 9.3]

Biosurveillance Detection Algorithms: Slide 57Copyright © 2002, 2003, Andrew Moore
Scan StatisticsStandard approach:
1. Compute the likelihood of the data given the hypothesis that the rate of occurrence is uniform everywhere, L0
2. For some geographical region, W, compute the likelihood that the rate of occurrence is uniform at one level inside the region and uniform at another level outside the region, L(W).
3. Compute the likelihood ratio, L(W)/L0
4. Repeat for all regions, and find the largest likelihood ratio. This is the scan statistic, S*W
5. Report the region, W, which yielded the max, S* W
See [Glaz and Balakrishnan, 99] for details
Standard scan statistic question:Given the geographical locations of occurrences of a phenomenon, is there a region with an unusually high (low) rate of these occurrences?
Biosurveillance Detection Algorithms: Slide 58Copyright © 2002, 2003, Andrew Moore
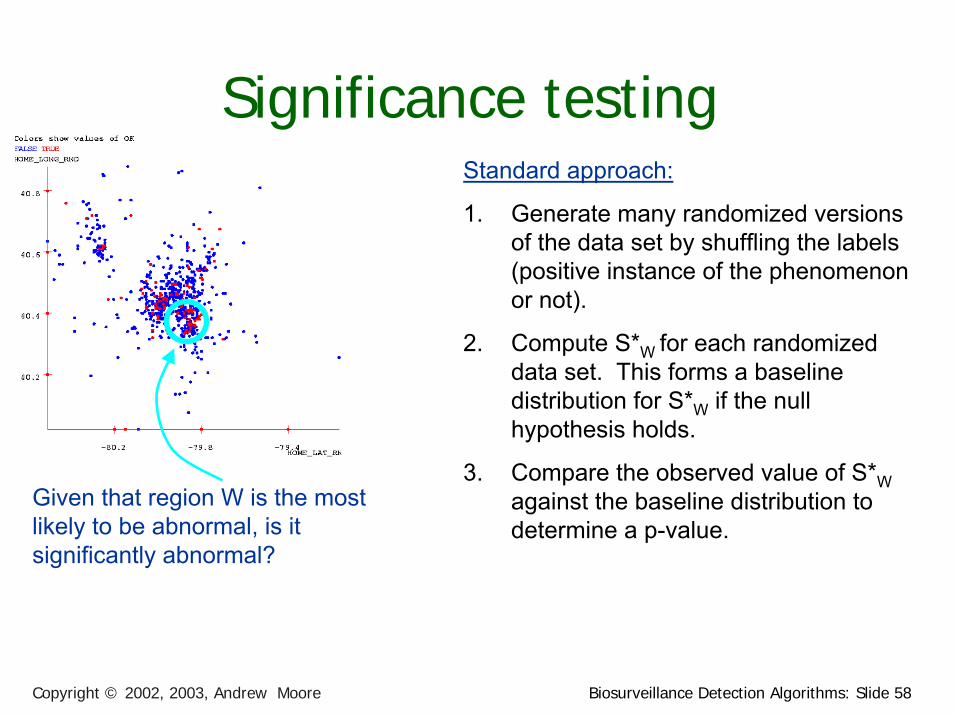
Significance testing
Given that region W is the most likely to be abnormal, is it significantly abnormal?
Standard approach:
1. Generate many randomized versions of the data set by shuffling the labels (positive instance of the phenomenon or not).
2. Compute S*W for each randomized data set. This forms a baseline distribution for S*W if the null hypothesis holds.
3. Compare the observed value of S*Wagainst the baseline distribution to determine a p-value.

Biosurveillance Detection Algorithms: Slide 59Copyright © 2002, 2003, Andrew Moore
N
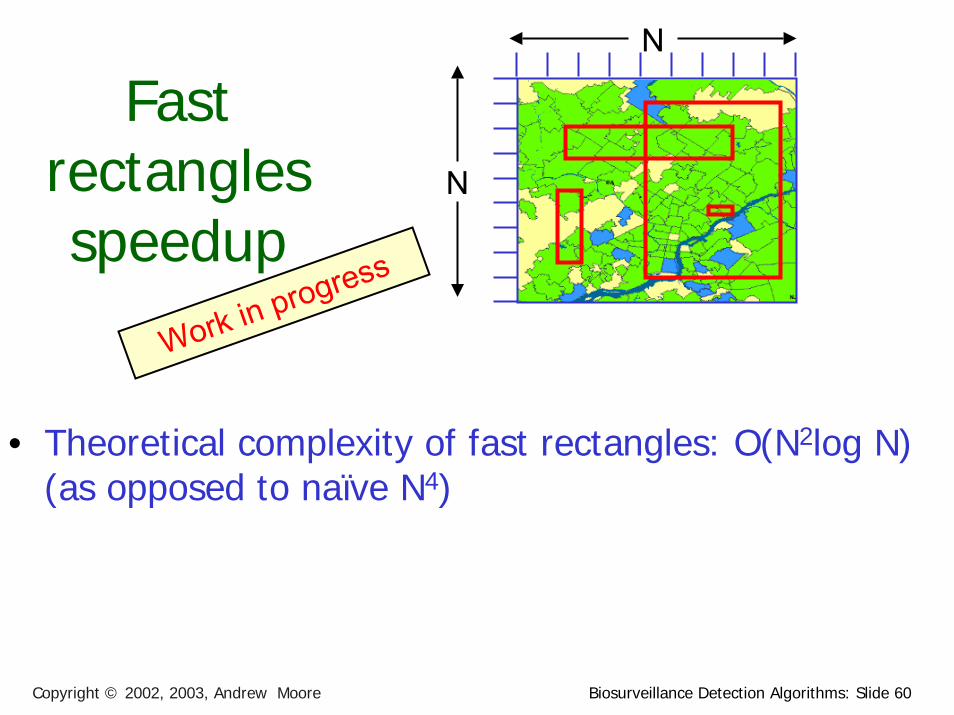
Fast squares speedup
N
• Theoretical complexity of fast squares: O(N2) (as opposed to naïve N3), if maximum density region sufficiently dense.
If not, we can use several other speedup tricks.• In practice: 10-200x speedups on real and artificially
generated datasets.Emergency Dept. dataset (600K records): 20 minutes, versus 66 hours with naïve approach.
Biosurveillance Detection Algorithms: Slide 60Copyright © 2002, 2003, Andrew Moore
N
Fast rectangles speedup
N
Work in progress
• Theoretical complexity of fast rectangles: O(N2log N) (as opposed to naïve N4)
Biosurveillance Detection Algorithms: Slide 61Copyright © 2002, 2003, Andrew Moore
N
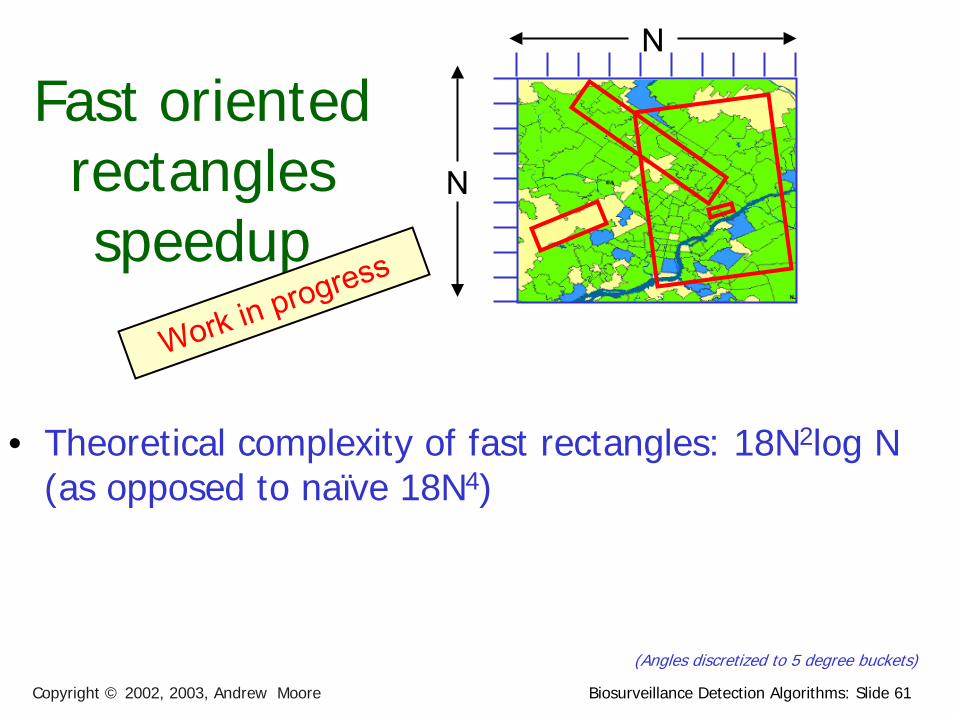
Fast oriented rectangles speedup
N
Work in progress
• Theoretical complexity of fast rectangles: 18N2log N (as opposed to naïve 18N4)
(Angles discretized to 5 degree buckets)
Biosurveillance Detection Algorithms: Slide 62Copyright © 2002, 2003, Andrew Moore
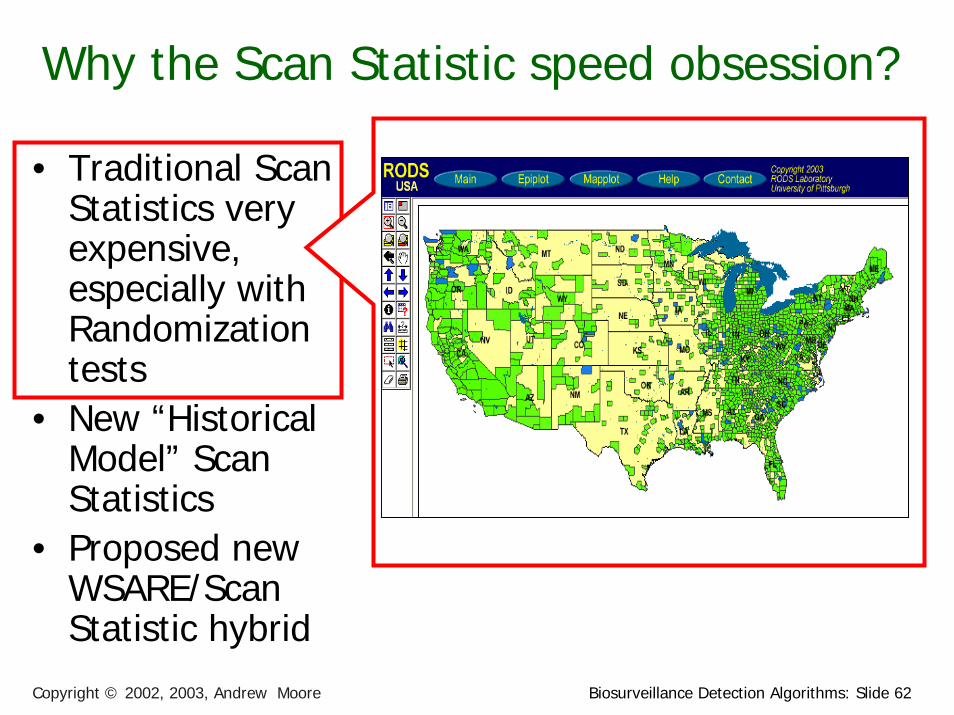
Why the Scan Statistic speed obsession?
• Traditional Scan Statistics very expensive, especially with Randomization tests
• New “Historical Model” Scan Statistics
• Proposed new WSARE/Scan Statistic hybrid

Biosurveillance Detection Algorithms: Slide 63Copyright © 2002, 2003, Andrew Moore
Why the Scan Statistic speed obsession?
• Traditional Scan Statistics very expensive, especially with Randomization tests
• New “Historical Model” Scan Statistics
• Proposed new WSARE/Scan Statistic hybrid
Biosurveillance Detection Algorithms: Slide 64Copyright © 2002, 2003, Andrew Moore
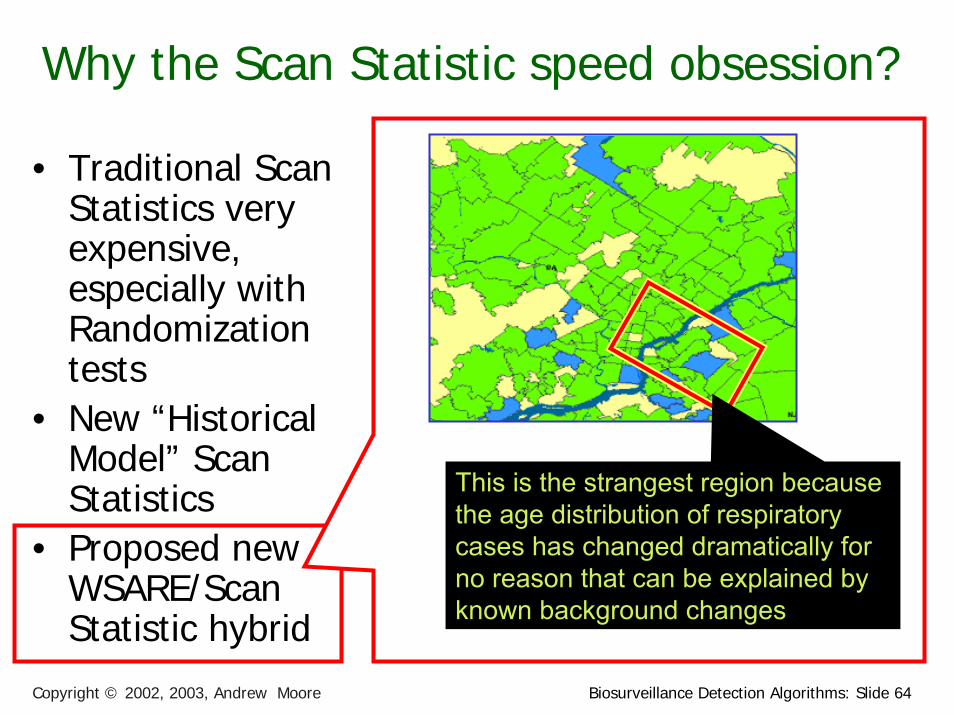
Why the Scan Statistic speed obsession?
• Traditional Scan Statistics very expensive, especially with Randomization tests
• New “Historical Model” Scan Statistics
• Proposed new WSARE/Scan Statistic hybrid
This is the strangest region because the age distribution of respiratory cases has changed dramatically for no reason that can be explained by known background changes
Biosurveillance Detection Algorithms: Slide 65Copyright © 2002, 2003, Andrew Moore
What you’ll learn about
• Noticing events in bio-event time series
• Tracking many series at once
• Detecting geographic hotspots
• Finding emerging new patterns
Univariate Anomaly Detection
Multivariate Anomaly Detection
Spatial Scan StatisticsWSARE

Biosurveillance Detection Algorithms: Slide 66Copyright © 2002, 2003, Andrew Moore
But there’s potentially more data than aggregates
Suppose we know that today in the ED we had…
• 421 Cases• 78 Respiratory Cases• 190 Males• 32 Children• 21 from North Suburbs• 2 Postal workers
(etc etc etc)
Have we made best use of all possible information?
Biosurveillance Detection Algorithms: Slide 67Copyright © 2002, 2003, Andrew Moore
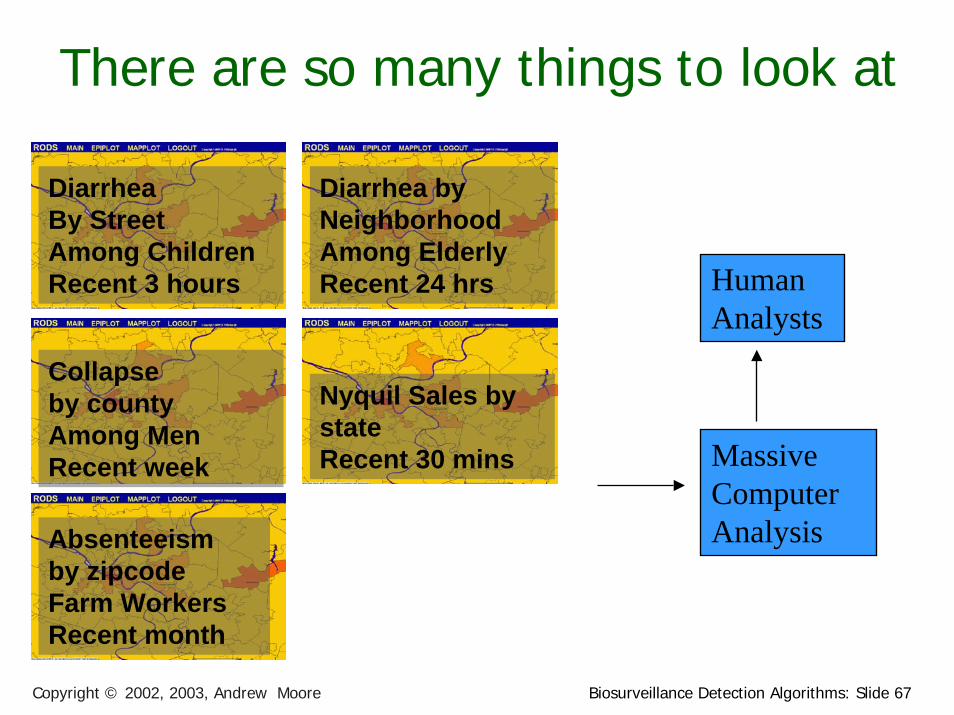
There are so many things to look at
DiarrheaBy StreetAmong ChildrenRecent 3 hours
Diarrhea byNeighborhoodAmong ElderlyRecent 24 hrs Human
AnalystsCollapseby countyAmong MenRecent week
Nyquil Sales by stateRecent 30 mins Massive
Computer AnalysisAbsenteeism
by zipcodeFarm WorkersRecent month
Biosurveillance Detection Algorithms: Slide 68Copyright © 2002, 2003, Andrew Moore
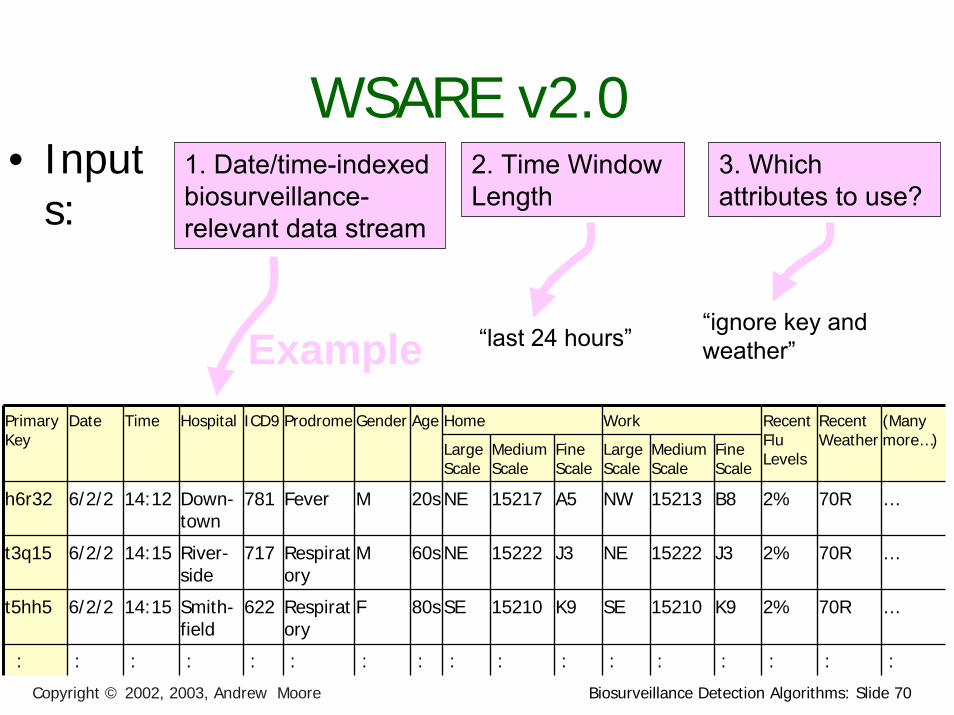
WSARE v2.0• What’s Strange About Recent Events?• Designed to be easily applicable to any
date/time-indexed biosurveillance-relevant data stream.
Biosurveillance Detection Algorithms: Slide 69Copyright © 2002, 2003, Andrew Moore
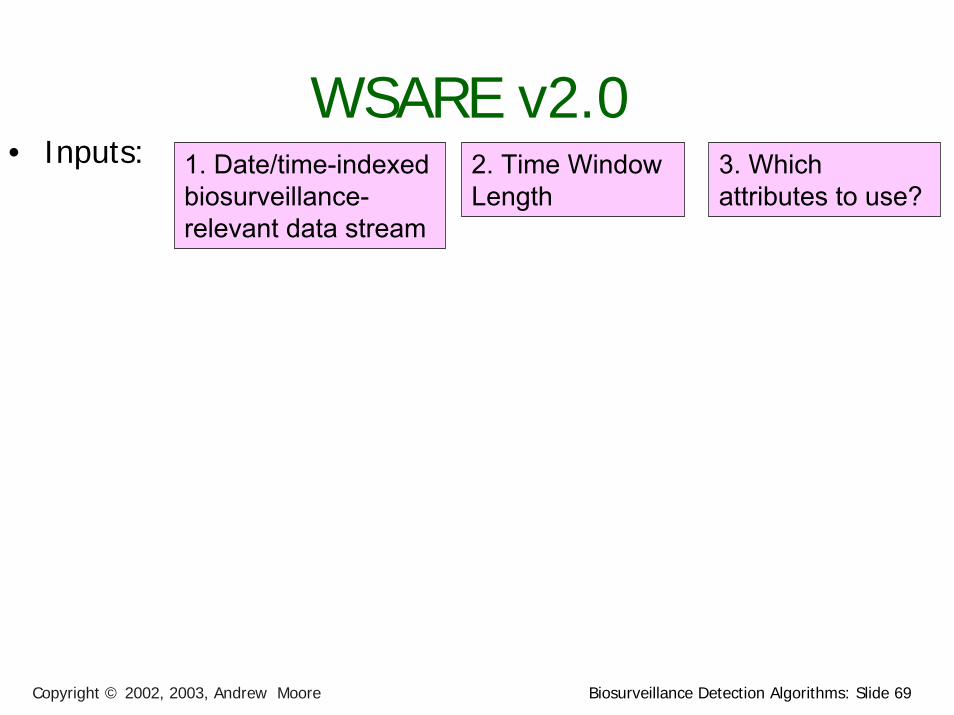
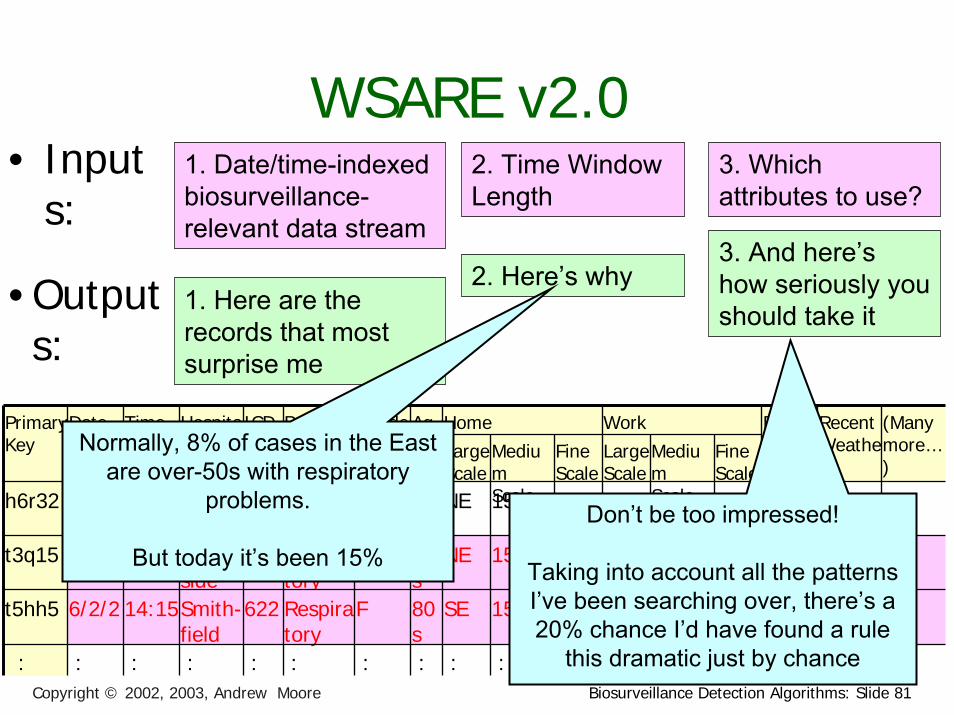
WSARE v2.0• Inputs: 1. Date/time-indexed
biosurveillance-relevant data stream
2. Time Window Length
3. Which attributes to use?
Biosurveillance Detection Algorithms: Slide 70Copyright © 2002, 2003, Andrew Moore
WSARE v2.0• Input
s:1. Date/time-indexed biosurveillance-relevant data stream
2. Time Window Length
3. Which attributes to use?
Example“ignore key and weather”“last 24 hours”
Home WorkPrimary Key
Date Time Hospital ICD9 Prodrome Gender Age
Large Scale
Medium Scale
Large Scale
Medium Scale
NE NW
NE
SE
:
NE
15213
15222
15210SE
: :
15217
15222
15210
:
Recent Flu Levels
Recent Weather
(Many more…)
M 2%
2%
2%
:
M
…70R
70R
F 70R
…
…
: ::
20s
60s
80s
:
Fine Scale
A5
J3
K9
:
Fine Scale
B8
J3
K9
:
h6r32 6/2/2 14:12 Down-town
781 Fever
t3q15 6/2/2 14:15 River-side
717 Respiratory
t5hh5 6/2/2 14:15 Smith-field
622 Respiratory
: : : : : :
Biosurveillance Detection Algorithms: Slide 71Copyright © 2002, 2003, Andrew Moore
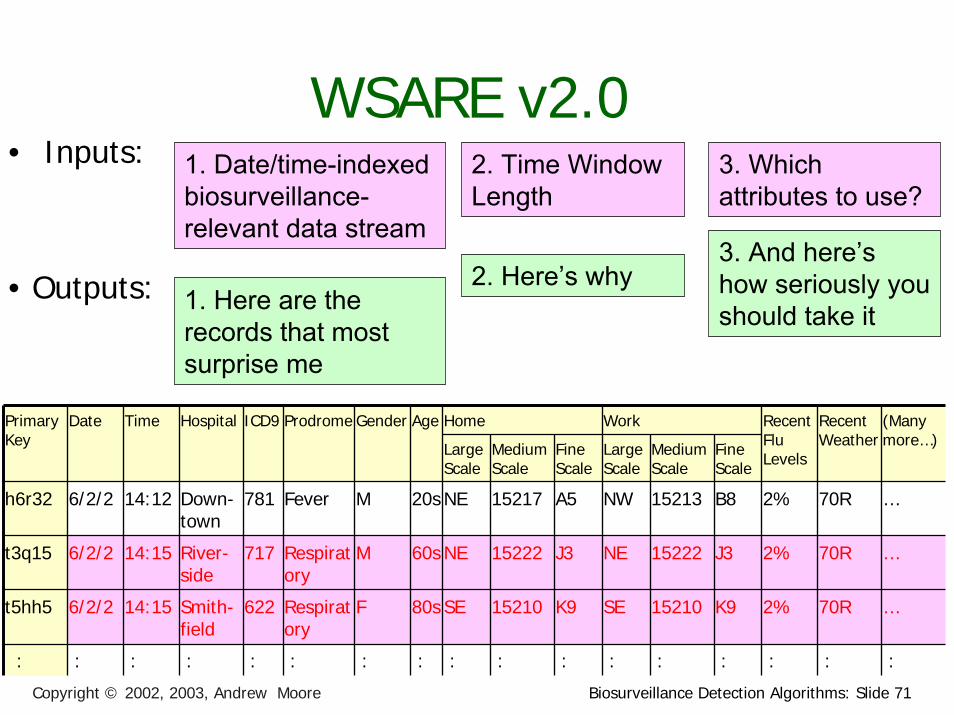
WSARE v2.0• Inputs: 1. Date/time-indexed
biosurveillance-relevant data stream
2. Time Window Length
3. Which attributes to use?
3. And here’s how seriously you should take it
2. Here’s why• Outputs: 1. Here are the records that most surprise me
Home WorkPrimary Key
Date Time Hospital ICD9 Prodrome Gender Age
Large Scale
Medium Scale
Large Scale
Medium Scale
NE NW
NE
SE
:
NE
15213
15222
15210SE
: :
15217
15222
15210
:
Recent Flu Levels
Recent Weather
(Many more…)
M 2%
2%
2%
:
M
…70R
70R
F 70R
…
…
: ::
20s
60s
80s
:
Fine Scale
A5
J3
K9
:
Fine Scale
B8
J3
K9
:
h6r32 6/2/2 14:12 Down-town
781 Fever
t3q15 6/2/2 14:15 River-side
717 Respiratory
t5hh5 6/2/2 14:15 Smith-field
622 Respiratory
: : : : : :
Biosurveillance Detection Algorithms: Slide 72Copyright © 2002, 2003, Andrew Moore
Simple WSAREDate Cases
Sat 12/9/2000 C1, C2, C3, C4 …
Thu 5/22/2000 C1, C2, C3, C4 …
Fri 5/23/2000 C1, C2, C3, C4 …
: :
: :
Sun 12/10/2000 C1, C2, C3, C4 …
: :
Sat 12/16/2000 C1, C2, C3, C4 …
: :
Sat 12/23/2000 C1, C2, C3, C4 …
: :
: :
Fri 9/14/2001 C1, C2, C3, C4 …
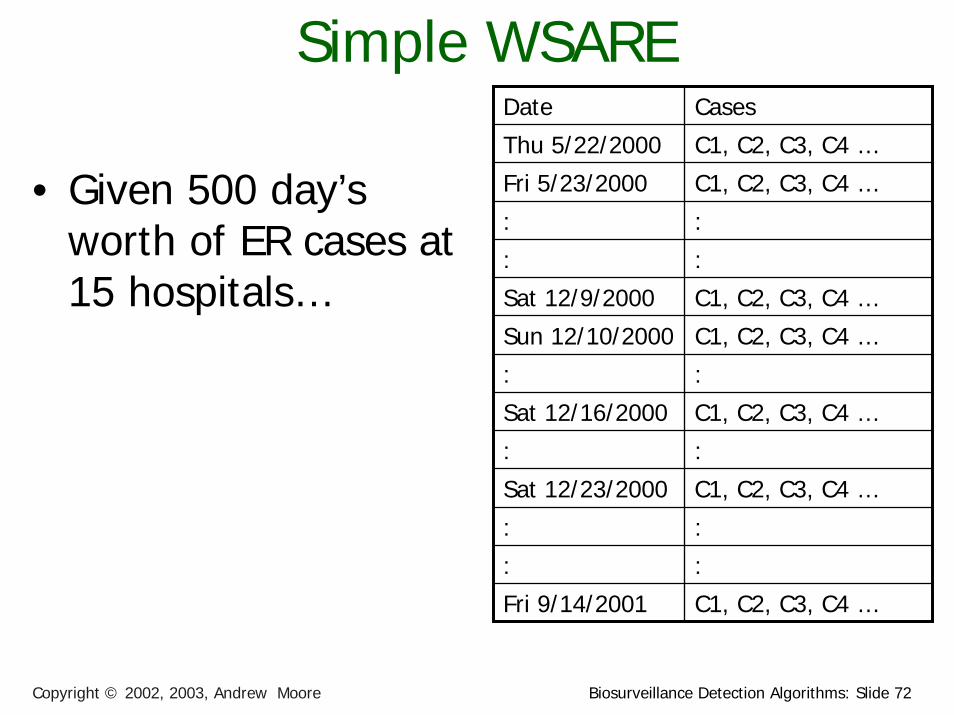
• Given 500 day’s worth of ER cases at 15 hospitals…
• Given 500 day’s worth of ER cases at 15 hospitals…
• For each day…• Take today’s cases
Date Cases
Sat 12/9/2000 C1, C2, C3, C4 …
Thu 5/22/2000 C1, C2, C3, C4 …
Fri 5/23/2000 C1, C2, C3, C4 …
: :
: :
Sun 12/10/2000 C1, C2, C3, C4 …
: :
Sat 12/16/2000 C1, C2, C3, C4 …
: :
Sat 12/23/2000 C1, C2, C3, C4 …
: :
: :
Fri 9/14/2001 C1, C2, C3, C4 …
Simple WSARE
Biosurveillance Detection Algorithms: Slide 73Copyright © 2002, 2003, Andrew Moore
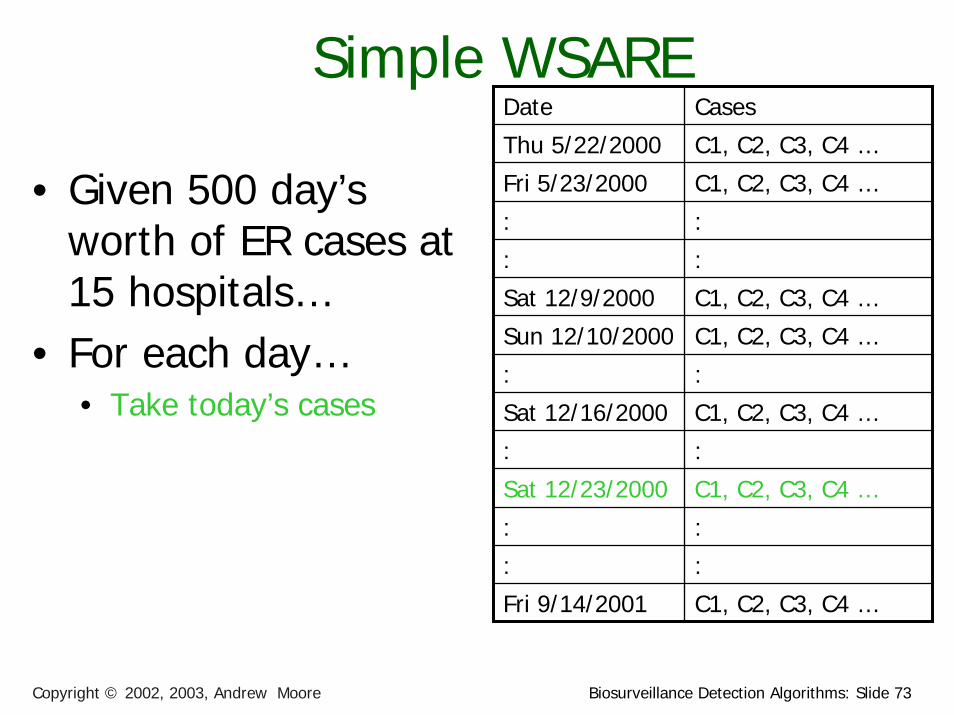
• Given 500 day’s worth of ER cases at 15 hospitals…
• For each day…• Take today’s cases• The cases one week ago• The cases two weeks ago
Date Cases
Sat 12/9/2000 C1, C2, C3, C4 …
Thu 5/22/2000 C1, C2, C3, C4 …
Fri 5/23/2000 C1, C2, C3, C4 …
: :
: :
Sun 12/10/2000 C1, C2, C3, C4 …
: :
Sat 12/16/2000 C1, C2, C3, C4 …
: :
Sat 12/23/2000 C1, C2, C3, C4 …
: :
: :
Fri 9/14/2001 C1, C2, C3, C4 …
Simple WSARE
Biosurveillance Detection Algorithms: Slide 74Copyright © 2002, 2003, Andrew Moore
Biosurveillance Detection Algorithms: Slide 75Copyright © 2002, 2003, Andrew Moore
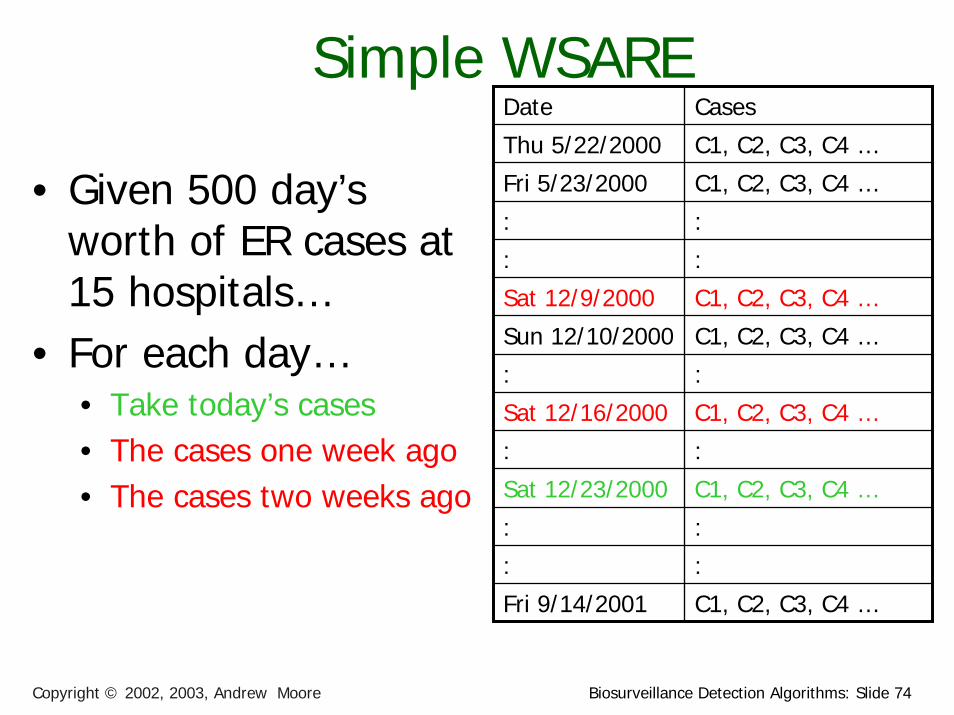
Simple WSARE
• Given 500 day’s worth of ER cases at 15 hospitals…
• For each day…• Take today’s cases• The cases one week ago• The cases two weeks ago
• Ask: “What’s different about today?”
DATE_ADMICD9 PRODROMGENDER place2 … …… …
12/9/00 786.05 3 F s-e … …12/9/00 789 1 F s-e … …12/9/00 789 1 M n-w … …12/9/00 786.05 3 M s-e … …
: : : : : … …12/16/00 787.02 2 M n-e … …12/16/00 782.1 4 F s-w … …12/16/00 789 1 M s-e … …12/16/00 786.09 3 M n-w … …12/23/00 789.09 1 M s-w … …12/23/00 789.09 1 F s-w … …12/23/00 782.1 4 M n-w … …
: : : : : … …12/23/00 786.09 3 M s-e … …12/23/00 786.09 3 M s-e … …12/23/00 780.9 2 F n-w … …12/23/00 V40.9 7 M s-w … …
Biosurveillance Detection Algorithms: Slide 76Copyright © 2002, 2003, Andrew Moore
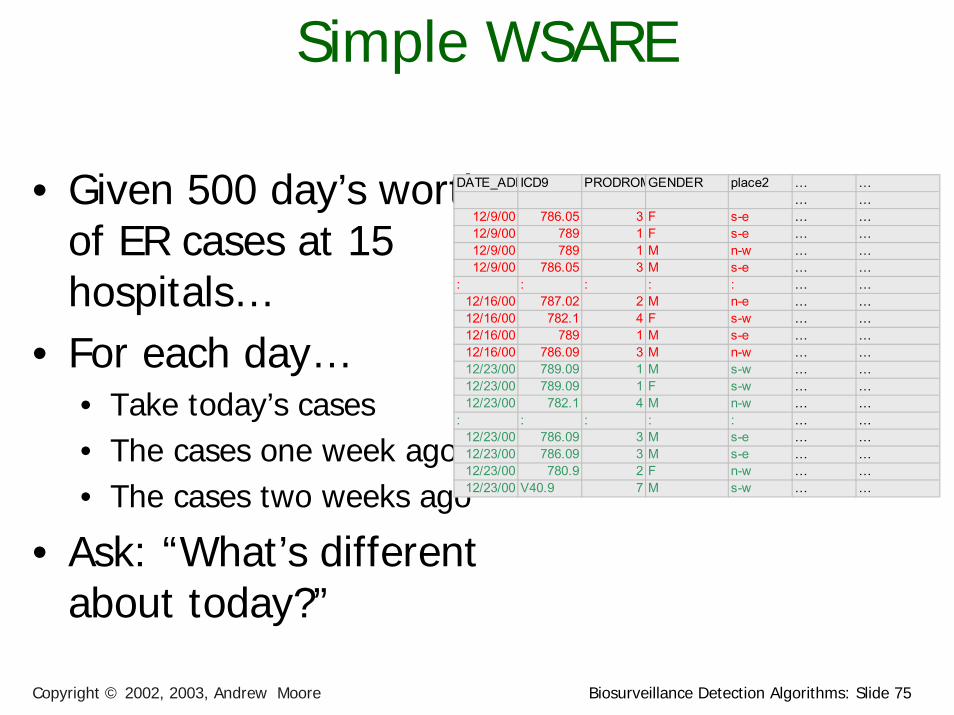
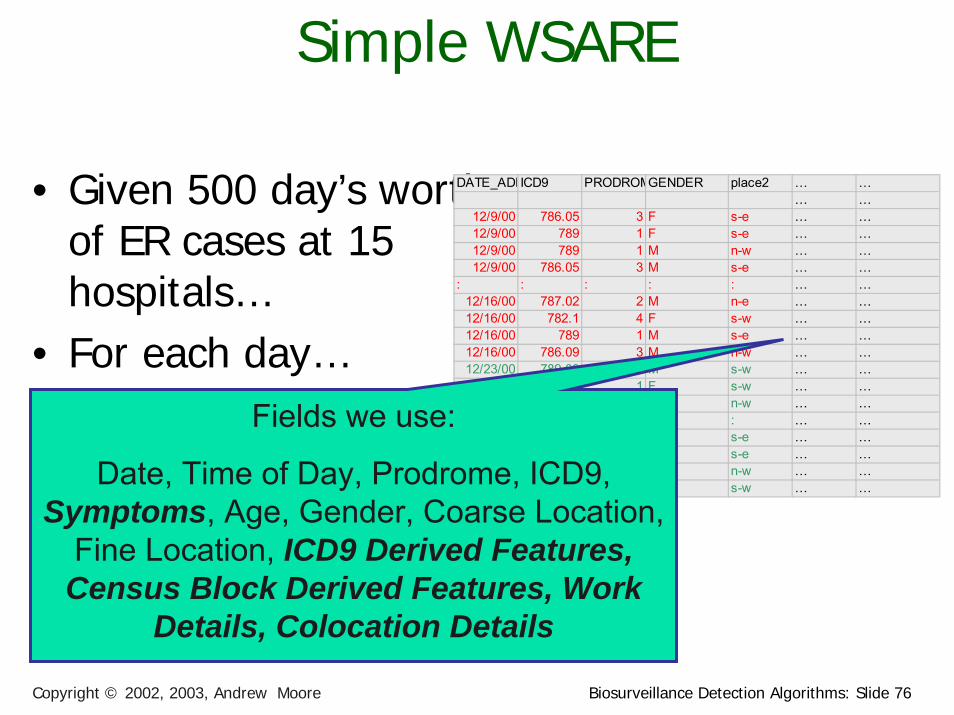
Simple WSARE
• Given 500 day’s worth of ER cases at 15 hospitals…
• For each day…• Take today’s cases• The cases one week ago• The cases two weeks ago
• Ask: “What’s different about today?”
DATE_ADMICD9 PRODROMGENDER place2 … …… …
12/9/00 786.05 3 F s-e … …12/9/00 789 1 F s-e … …12/9/00 789 1 M n-w … …12/9/00 786.05 3 M s-e … …
: : : : : … …12/16/00 787.02 2 M n-e … …12/16/00 782.1 4 F s-w … …12/16/00 789 1 M s-e … …12/16/00 786.09 3 M n-w … …12/23/00 789.09 1 M s-w … …12/23/00 789.09 1 F s-w … …12/23/00 782.1 4 M n-w … …
: : : : : … …12/23/00 786.09 3 M s-e … …12/23/00 786.09 3 M s-e … …12/23/00 780.9 2 F n-w … …12/23/00 V40.9 7 M s-w … …
Fields we use:
Date, Time of Day, Prodrome, ICD9, Symptoms, Age, Gender, Coarse Location,
Fine Location, ICD9 Derived Features, Census Block Derived Features, Work
Details, Colocation Details

Biosurveillance Detection Algorithms: Slide 77Copyright © 2002, 2003, Andrew Moore
Example
Sat 12-23-2001 (daynum 36882, dayindex 239)
35.8% ( 48/134) of today's cases have 30 <= age < 4017.0% ( 45/265) of other cases have 30 <= age < 40
Biosurveillance Detection Algorithms: Slide 78Copyright © 2002, 2003, Andrew Moore
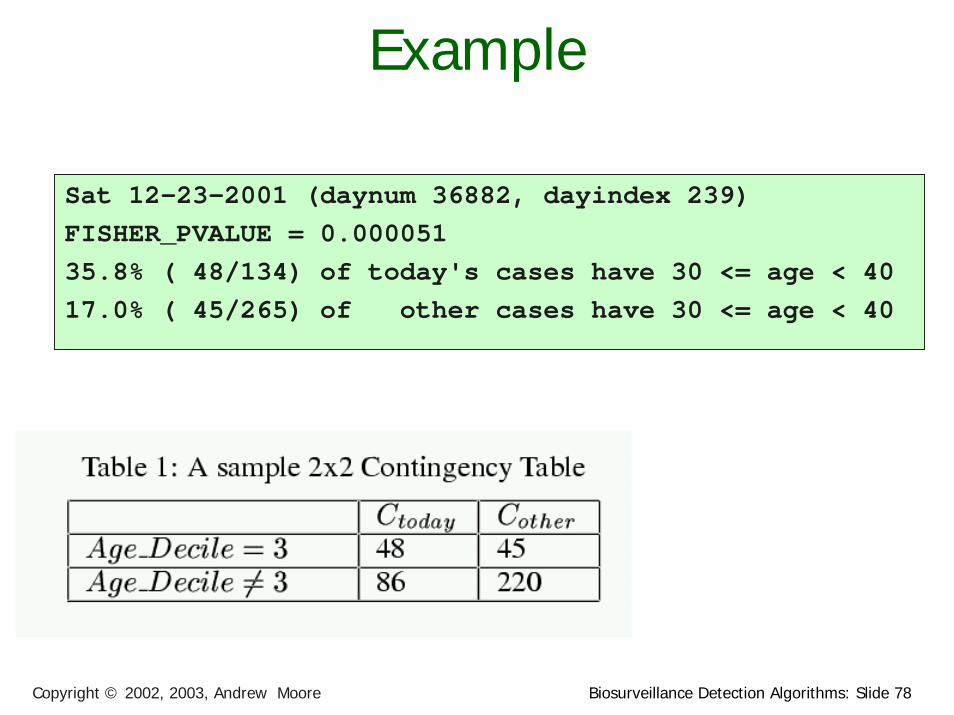
Example
Sat 12-23-2001 (daynum 36882, dayindex 239)FISHER_PVALUE = 0.000051 35.8% ( 48/134) of today's cases have 30 <= age < 4017.0% ( 45/265) of other cases have 30 <= age < 40
Biosurveillance Detection Algorithms: Slide 79Copyright © 2002, 2003, Andrew Moore
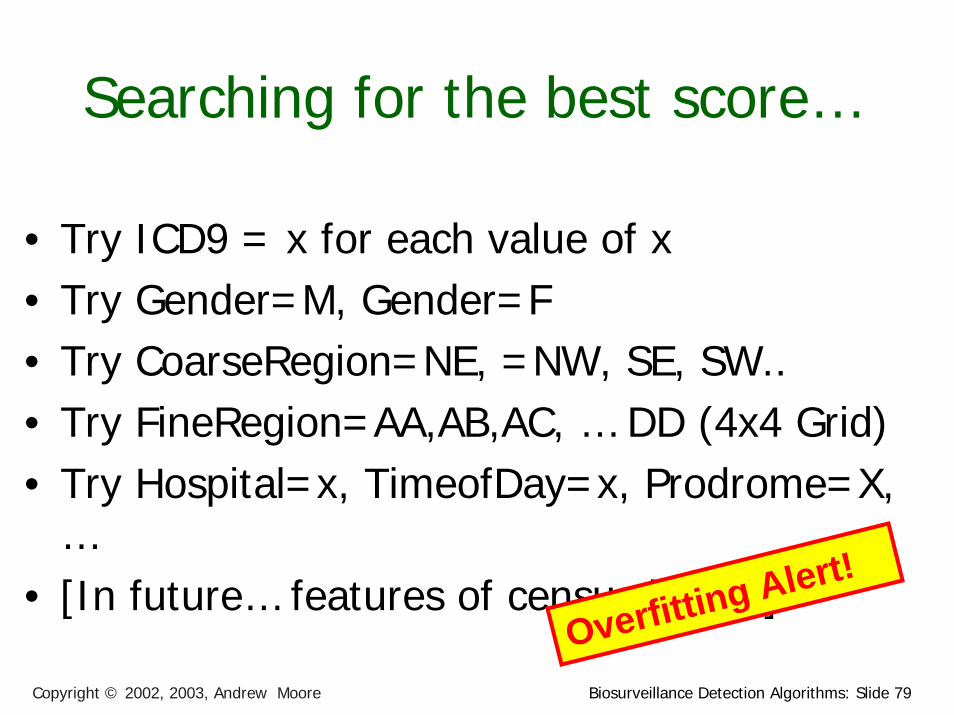
Searching for the best score…
• Try ICD9 = x for each value of x• Try Gender=M, Gender=F• Try CoarseRegion=NE, =NW, SE, SW..• Try FineRegion=AA,AB,AC, … DD (4x4 Grid)• Try Hospital=x, TimeofDay=x, Prodrome=X,
…• [In future… features of census blocks]
Overfitting Alert!
Biosurveillance Detection Algorithms: Slide 80Copyright © 2002, 2003, Andrew Moore
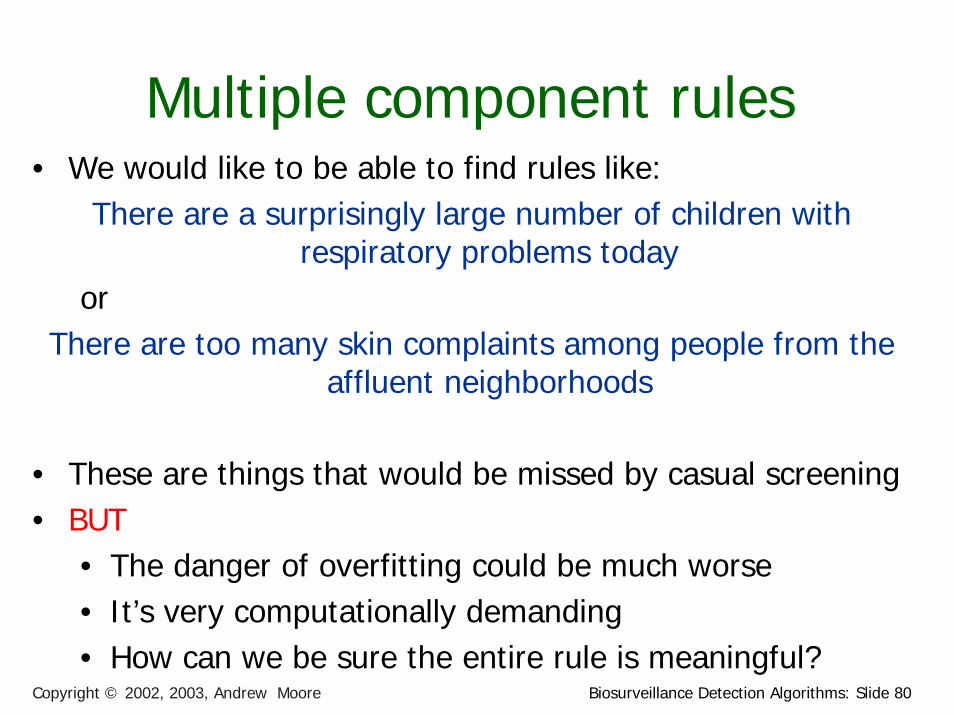
Multiple component rules• We would like to be able to find rules like:
There are a surprisingly large number of children with respiratory problems today
orThere are too many skin complaints among people from the
affluent neighborhoods
• These are things that would be missed by casual screening• BUT
• The danger of overfitting could be much worse• It’s very computationally demanding• How can we be sure the entire rule is meaningful?
Biosurveillance Detection Algorithms: Slide 81Copyright © 2002, 2003, Andrew Moore
WSARE v2.0• Input
s:1. Date/time-indexed biosurveillance-relevant data stream
2. Time Window Length
3. Which attributes to use?
3. And here’s how seriously you should take it
2. Here’s why•Outputs:
1. Here are the records that most surprise me
Home WorkPrimary Key
Date Time Hospital
ICD9
Prodrome
Gender
Age Large
ScaleMedium Scale
Large Scale
Medium ScaleNE NW
NE
SE
:
NE
15213
15222
15210SE
: :
15217
15222
15210
:
Recent Flu Levels
Recent Weather
(Many more…)
M 2%
2%
2%
:
M
…70R
70R
F 70R
…
…
: ::
20s60s80s:
Fine ScaleA5
J3
K9
:
Fine ScaleB8
J3
K9
:
h6r32 6/2/2 14:12Down-town
781 Fever
t3q15 6/2/2 14:15River-side
717 Respiratory
t5hh5 6/2/2 14:15Smith-field
622 Respiratory
: : : : : :
Normally, 8% of cases in the East are over-50s with respiratory
problems.
But today it’s been 15%
Don’t be too impressed!
Taking into account all the patterns I’ve been searching over, there’s a 20% chance I’d have found a rule
this dramatic just by chance
Biosurveillance Detection Algorithms: Slide 82Copyright © 2002, 2003, Andrew Moore
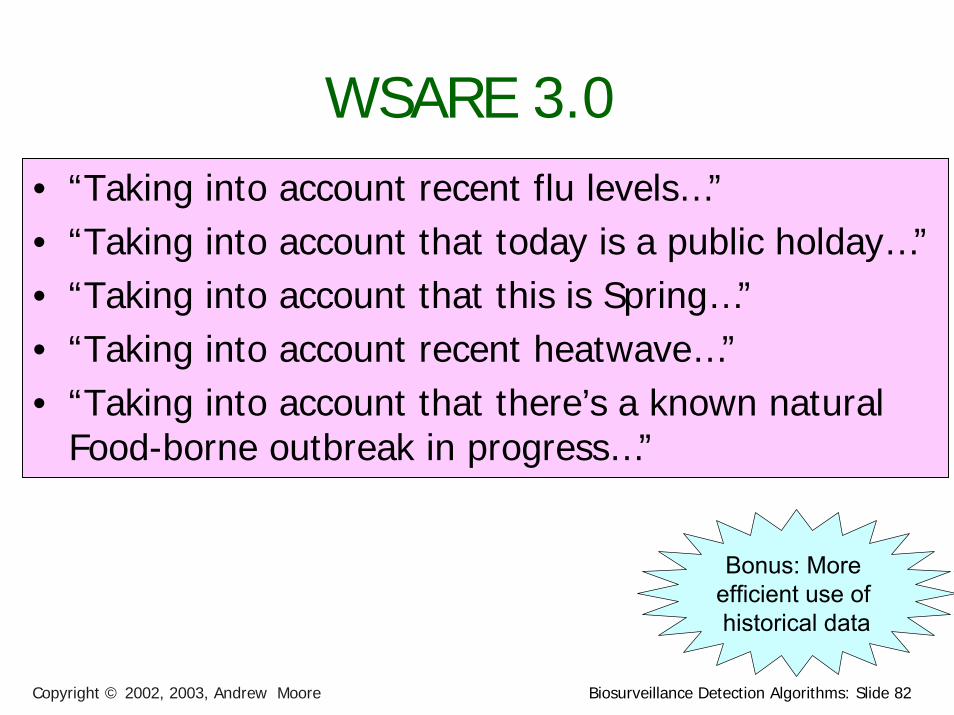
WSARE 3.0 • “Taking into account recent flu levels…”• “Taking into account that today is a public holday…”• “Taking into account that this is Spring…”• “Taking into account recent heatwave…”• “Taking into account that there’s a known natural
Food-borne outbreak in progress…”
Bonus: More efficient use of historical data
Biosurveillance Detection Algorithms: Slide 83Copyright © 2002, 2003, Andrew Moore
Analysis of variance• Good news:
If you’re tracking a daily aggregate (e.g. number of flu cases in your ED, or Nyquil Sales)…then ANOVA can take care of many of these effects.
• But…What if you’re tracking a whole joint distribution
of transactional events?

Biosurveillance Detection Algorithms: Slide 84Copyright © 2002, 2003, Andrew Moore
Idea: Bayesian Networks“Patients from West Park Hospital
are less likely to be young”
“On Cold Tuesday Mornings the folks coming in from the North
part of the city are more likely to have respiratory problems”
“The Viral prodrome is more likely to co-occur with a Rash
prodrome than Botulinic”
“On the day after a major holiday, expect a boost in the morning followed by a lull in
the afternoon”
Biosurveillance Detection Algorithms: Slide 85Copyright © 2002, 2003, Andrew Moore
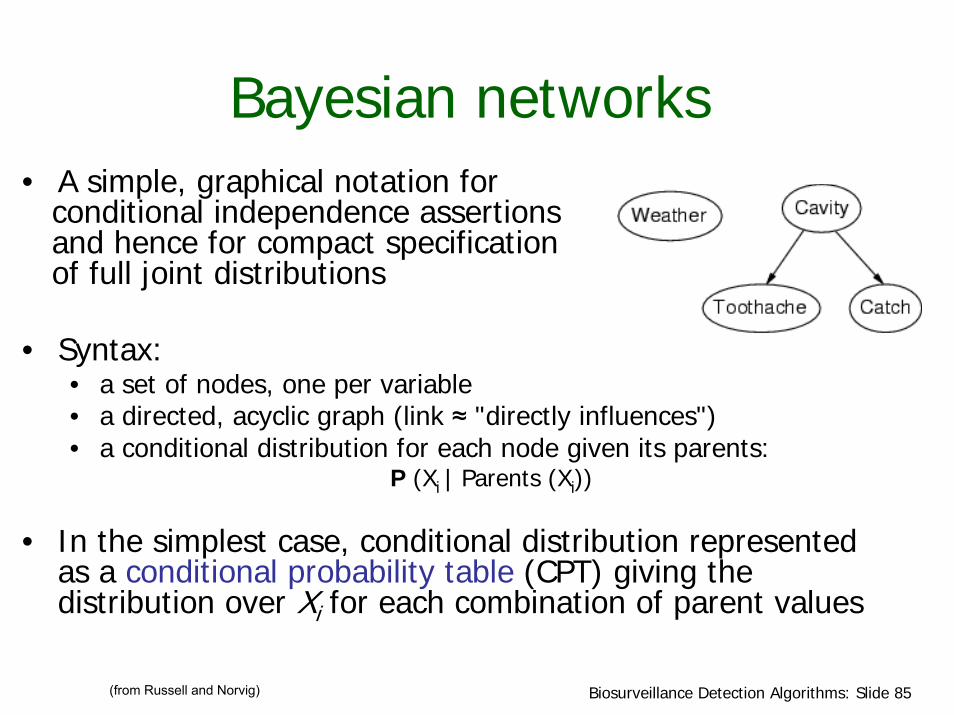
Bayesian networks• A simple, graphical notation for
conditional independence assertions and hence for compact specification of full joint distributions
• Syntax:• a set of nodes, one per variable• a directed, acyclic graph (link ≈ "directly influences")• a conditional distribution for each node given its parents:
P (Xi | Parents (Xi))
• In the simplest case, conditional distribution represented as a conditional probability table (CPT) giving the distribution over Xi for each combination of parent values
(from Russell and Norvig)
Biosurveillance Detection Algorithms: Slide 86Copyright © 2002, 2003, Andrew Moore
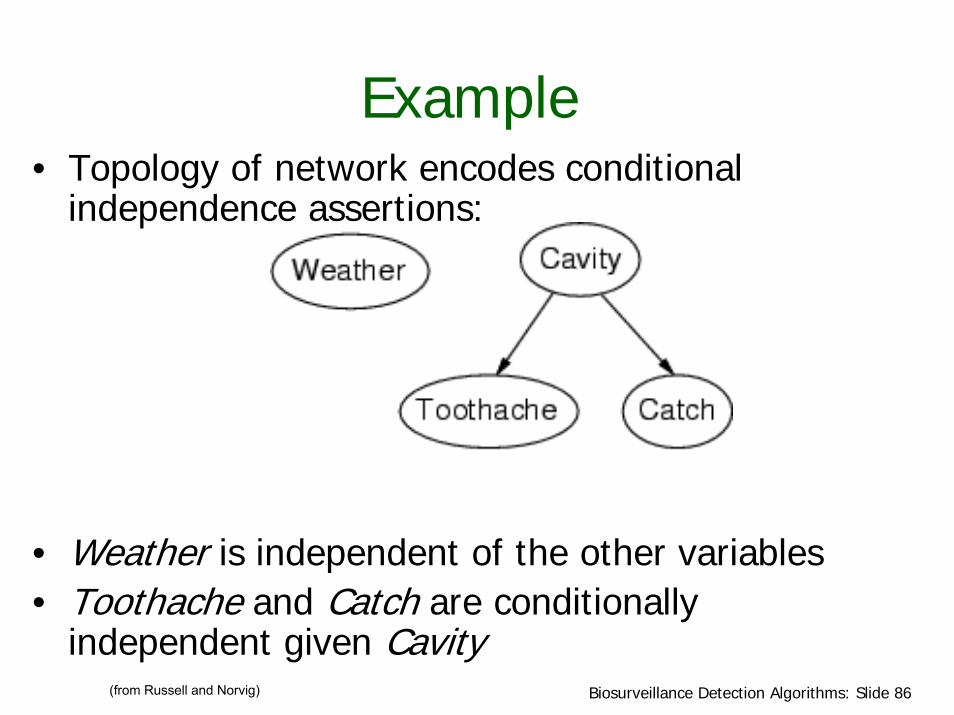
Example• Topology of network encodes conditional
independence assertions:
• Weather is independent of the other variables• Toothache and Catch are conditionally
independent given Cavity(from Russell and Norvig)

Biosurveillance Detection Algorithms: Slide 87Copyright © 2002, 2003, Andrew Moore
Example• I'm at work, neighbor John calls to say my alarm is ringing, but neighbor Mary
doesn't call. Sometimes it's set off by minor earthquakes. Is there a burglar?
• Variables: Burglary, Earthquake, Alarm, JohnCalls, MaryCalls
• Network topology reflects "causal" knowledge:• A burglar can set the alarm off• An earthquake can set the alarm off• The alarm can cause Mary to call• The alarm can cause John to call
(from Russell and Norvig)
Biosurveillance Detection Algorithms: Slide 88Copyright © 2002, 2003, Andrew Moore
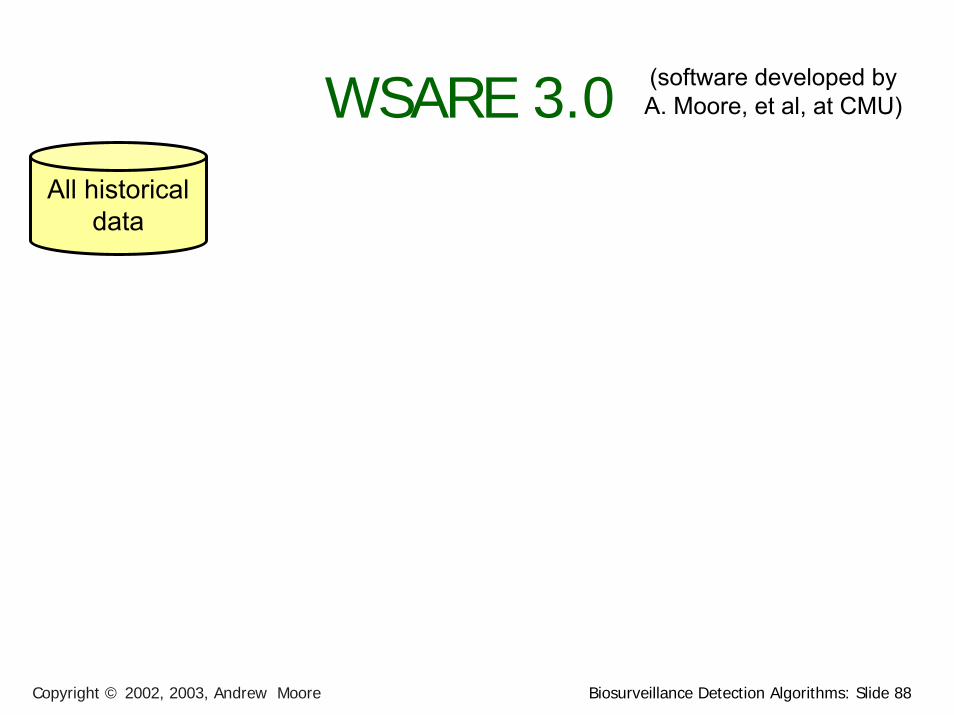
WSARE 3.0 (software developed by A. Moore, et al, at CMU)
All historicaldata
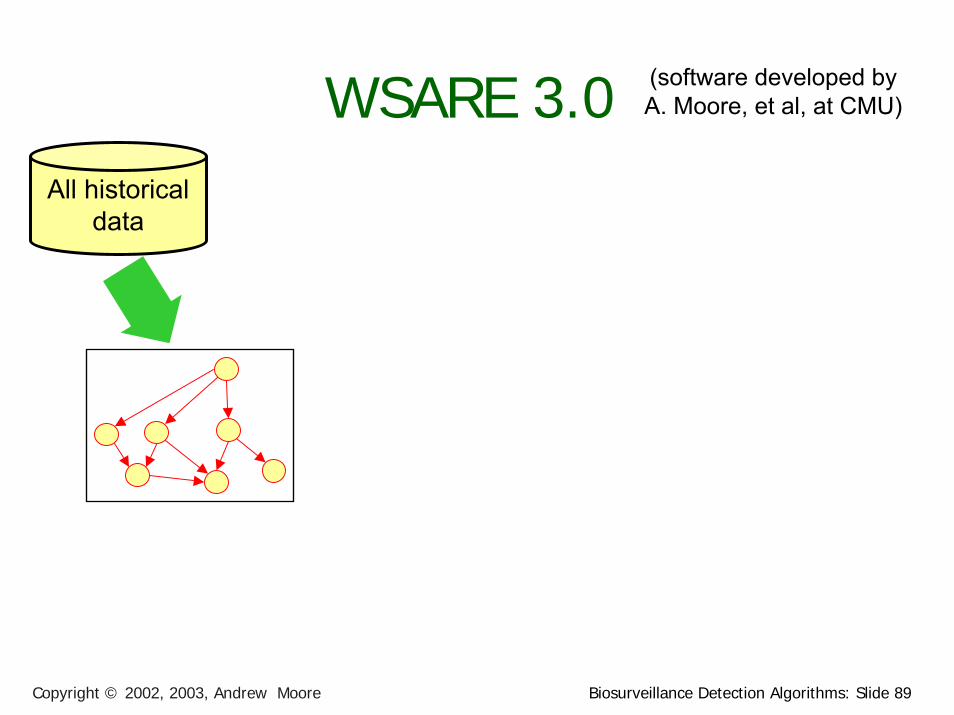
Biosurveillance Detection Algorithms: Slide 89Copyright © 2002, 2003, Andrew Moore
WSARE 3.0 (software developed by A. Moore, et al, at CMU)
All historicaldata

Biosurveillance Detection Algorithms: Slide 90Copyright © 2002, 2003, Andrew Moore
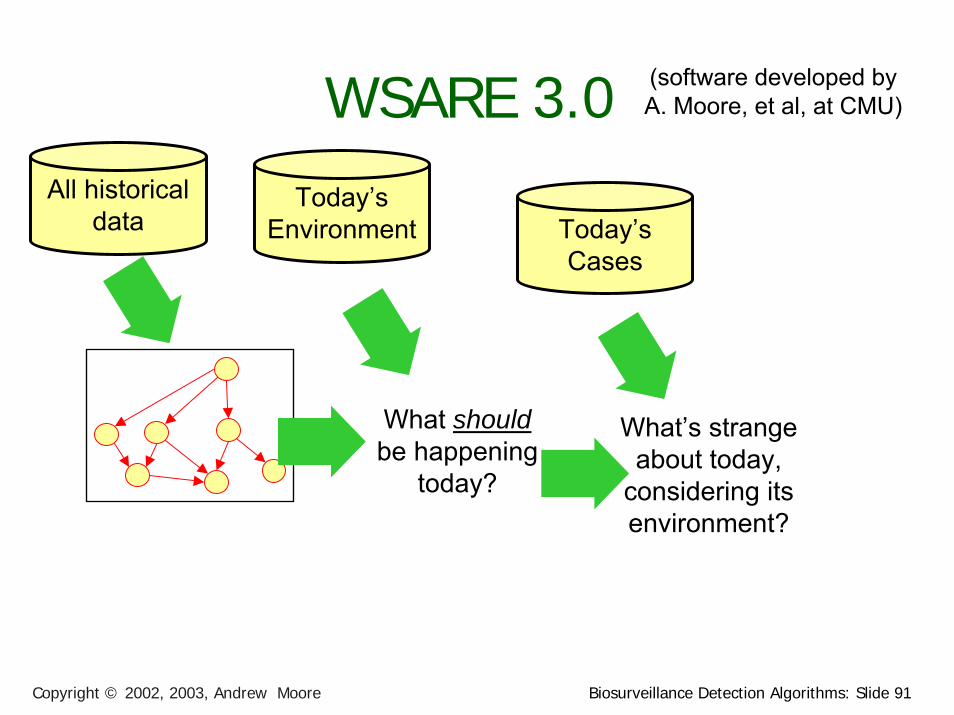
WSARE 3.0 (software developed by A. Moore, et al, at CMU)
All historicaldata
Today’sEnvironment
What shouldbe happening
today?
Biosurveillance Detection Algorithms: Slide 91Copyright © 2002, 2003, Andrew Moore
WSARE 3.0 (software developed by A. Moore, et al, at CMU)
All historicaldata
Today’sEnvironment
What shouldbe happening
today?
Today’sCases
What’s strange about today,
considering its environment?
Biosurveillance Detection Algorithms: Slide 92Copyright © 2002, 2003, Andrew Moore
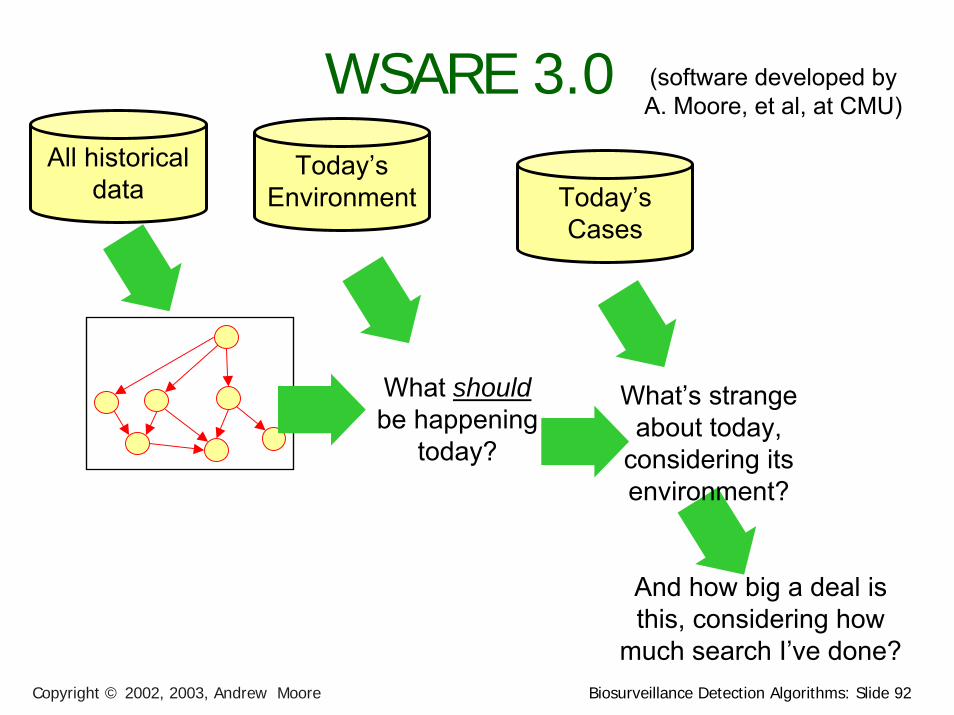
WSARE 3.0All historical
dataToday’s
Environment
What shouldbe happening
today?
Today’sCases
What’s strange about today,
considering its environment?
And how big a deal is this, considering how
much search I’ve done?
(software developed by A. Moore, et al, at CMU)
Biosurveillance Detection Algorithms: Slide 93Copyright © 2002, 2003, Andrew Moore
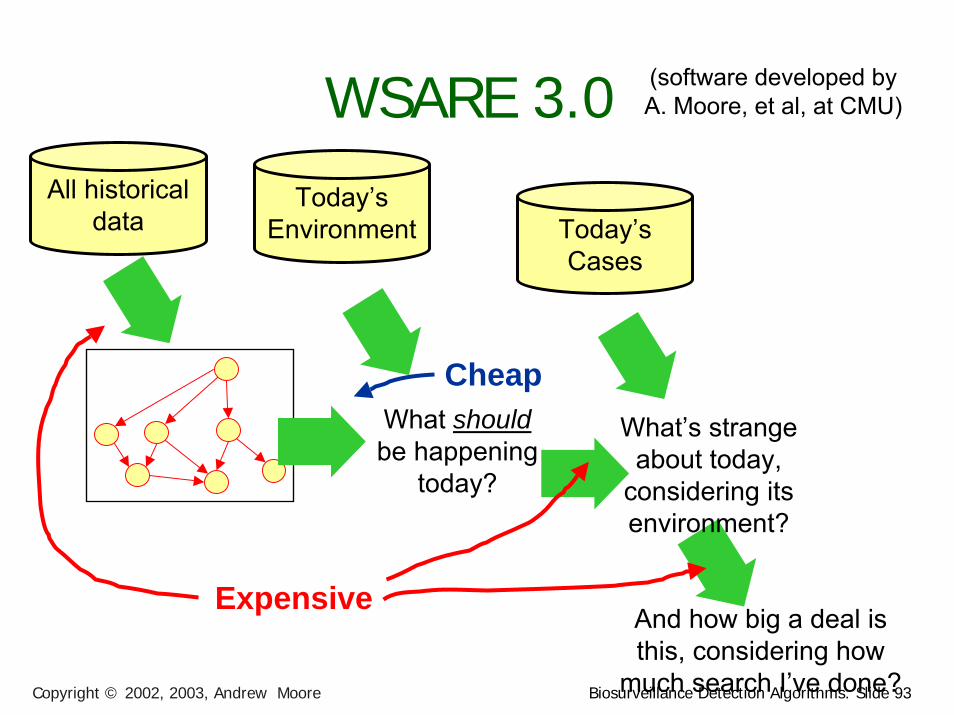
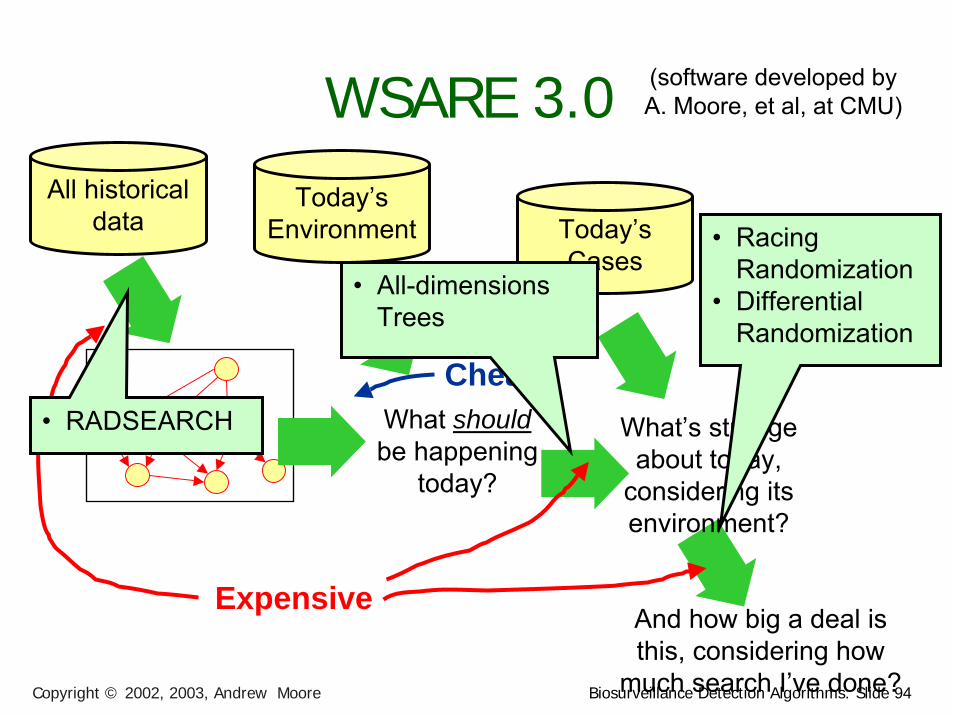
WSARE 3.0 (software developed by A. Moore, et al, at CMU)
All historicaldata
Today’sEnvironment
What shouldbe happening
today?
Today’sCases
What’s strange about today,
considering its environment?
And how big a deal is this, considering how
much search I’ve done?
Expensive
Cheap
WSARE 3.0
Biosurveillance Detection Algorithms: Slide 94Copyright © 2002, 2003, Andrew Moore
All historicaldata
Today’sEnvironment
What shouldbe happening
today?
Today’sCases
What’s strange about today,
considering its environment?
And how big a deal is this, considering how
much search I’ve done?
Expensive
Cheap
• Racing Randomization
• Differential Randomization
• All-dimensions Trees
• RADSEARCH
(software developed by A. Moore, et al, at CMU)
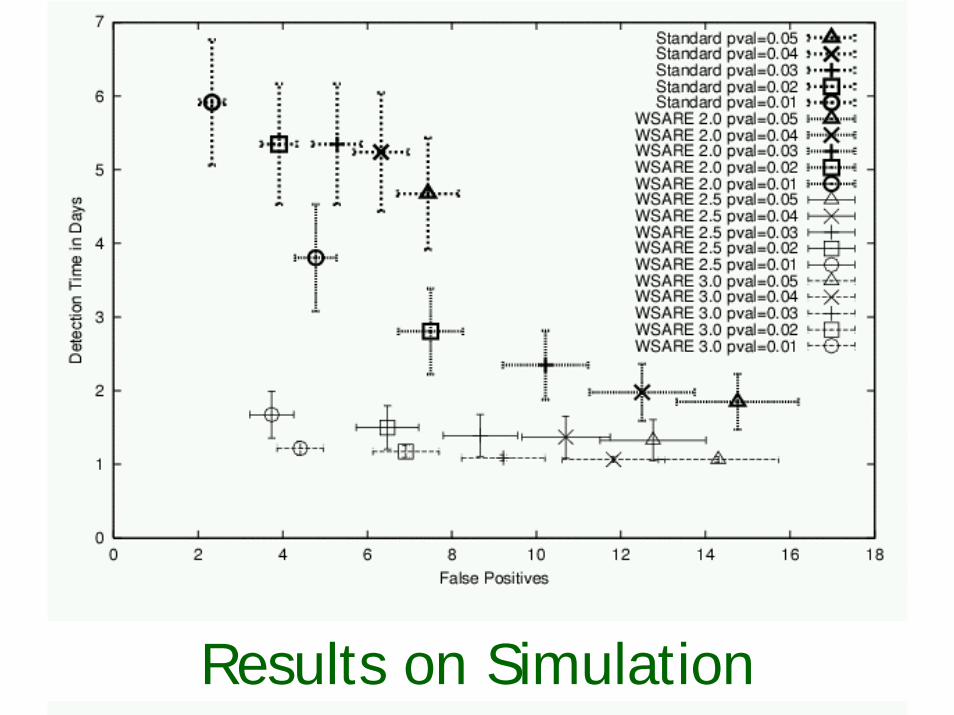
Biosurveillance Detection Algorithms: Slide 95Copyright © 2002, 2003, Andrew MooreResults on Simulation
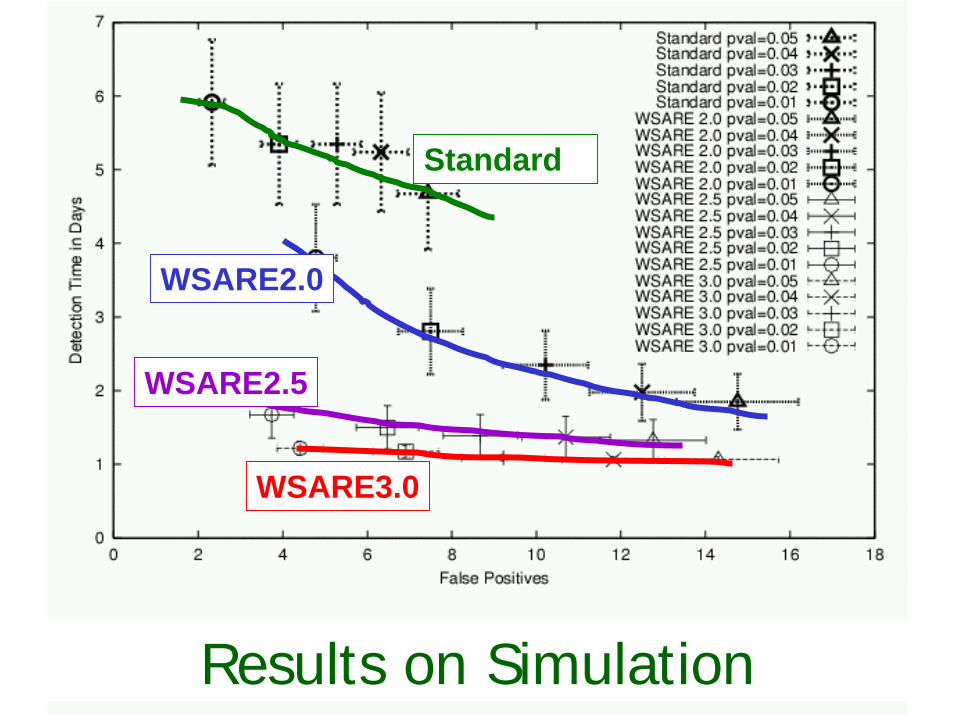
Biosurveillance Detection Algorithms: Slide 96Copyright © 2002, 2003, Andrew MooreResults on Simulation
Standard
WSARE2.0
WSARE2.5
WSARE3.0
Biosurveillance Detection Algorithms: Slide 97Copyright © 2002, 2003, Andrew Moore
Conclusion
• WSARE: One approach to biosurveillance: one algorithm monitoring millions of signals derived from multivariate data
instead ofHundreds of univariate detectors
• Modeling historical data with Bayesian Networks to allow conditioning on unique features of today
• Computationally intense unless we’re tricksy!WSARE 2.0 Deployed during the past yearWSARE 3.0 about to go onlineWSARE now being extended to additionally exploit over the
counter medicine sales

Biosurveillance Detection Algorithms: Slide 98Copyright © 2002, 2003, Andrew Moore
Conclusion• One approach to biosurveillance: one algorithm
monitoring millions of signals derived from multivariate data
instead ofHundreds of univariate detectors
• Modeling historical data with Bayesian Networks to allow conditioning on unique features of today
• Computationally intense unless we’re tricksy!WSARE 2.0 Deployed during the past yearWSARE 3.0 about to go onlineWSARE now being extended to additionally exploit
over the counter medicine sales
• Searching over thousands of contingency tables on a large database...
• ...only we have to do it 10,000 times on the replicas during randomization
• ...we also need to learn Bayes Nets from databases with millions of records...
• ...and keep relearning them as data arrives online...• ...in the end we typically search about a billion alternative
Bayes net structures for modeling 800,000 records in 10 minutes
Biosurveillance Detection Algorithms: Slide 99Copyright © 2002, 2003, Andrew Moore
The End… ☺