Embed Size (px)
Citation preview

OutlierDetectionMethodsformixed-typeandlarge-scaledatalikeCensus
AlessandraSozziDataScientist,[email protected]
FrantisekHajnovicDataScientist,[email protected]

Content
● Background● Challenges● Algorithms● Wrapup

Background

• Outlierdetection(OD)referstotheproblemoffindingpatternsindatathatdonotconformtoexpectednormalbehaviour.
• Outliersincensushaveinthepastaroseduetovariousreasons
• Amechanismforpointingintherightdirectionwill:savetime,improvequalityandminimisetheriskofseriouserrorsidentifyingthemearlier.
Background
Scanning errors
Coding errors
Imputation errors Errors introduced at later steps of the Census processing
Purely normal anomalies, worth flagging to ensure it’s no error
Unknown unknowns: errors we don’t know yet (new online Census)
Errors in the questionnaire by the respondent

Examples
Examplen.1 Examplen.2
NAME:LarryAGE:2yoJOB:Securityguard
NAME:PaulAGE:92yoWorkingHrs/Week:40
IconsmadebyFreepikfromwww.flaticon.comislicensedbyCC3.0BY

Examples
Examplen.1 Examplen.2
NAME:LarryAGE:2yoJOB:Securityguard
NAME:PaulAGE:92yo20yo(1919—>1991)WorkingHrs/Week:40
IconsmadebyFreepikfromwww.flaticon.comislicensedbyCC3.0BY

Examples
Examplen.1 Examplen.2
NAME:LarryAGE:2yoJOB:SecurityguardTRUE S
TORY
https://www.channel4.com/news/census-ons-office-for-national-statistics-pets-sex-race
IconsmadebyFreepikfromwww.flaticon.comislicensedbyCC3.0BYIconsmadebysurangfromwww.flaticon.comislicensedbyCC3.0BY
NAME:PaulAGE:92yo20yo(1919—>1991)WorkingHrs/Week:40

ChallengesScale
Missing valuesSkewed distributions
Continuous space vs categorical space
No Code Required questions
High-dimensional input data

Challenges
SKEWED DISTRIBUTIONS: e.g. 90% of entries
The scale and nature of such data pose computational challenges to traditional OD methods.
MIXED TYPE: census questions are of mixed type (numeric, categorical, ordinal, etc.) and detecting outliers in this multi-dimensional space is an open area of research.
SCALE: census is too large for a sequential execution. Most of the methods need either a distributed implementation or separate runs of the algorithm on chunks of the dataset.
MISSING VALUES: missing values tend also not to be very frequent in census and thus records containing missing values can end up flagged as outliers.
DEPENDENCIES: some variable’s value depending on other variable. E.g. “No code required” if the person is not old enough.
H I G H - D I M I N P U T: w h e n t h e dimensionality increases, the volume of the space increases so fast that the data
AlgorithmsClassifications
Regressors
Pattern Analysis
Decision trees
Probability distributions
Frequent ItemsetsClustering
Nearest neighbours
Distributed implementations
Spark/PySparkPython/Scala

KAMILA
• Iterativeclusteringformixed-typedata
• IntegratesK-Means+GaussianMultinomialMixturemodelstobalancetheeffectofnumericandcategoricalfeatureswithoutspecifyingweights
KAMILA
Iterative clustering method on a mixed-type dataset that equitably balances the contribution of continuous and categorical variables. KAMILA integrates two different kinds of clustering algorithms:• K-means algorithm: no strong parametric assumptions• Gaussian multinomial mixture models: KAMILA uses
the properties of Gaussian-multinomial mixture models to balance the effect of numeric and categorical features without specifying weights.
Clustering
SCALABILITY:MIXED TYPE: IMPLEMENTATION
STATUS:OD SCORE:
HIGH - DIM INPUT:
ODMAD
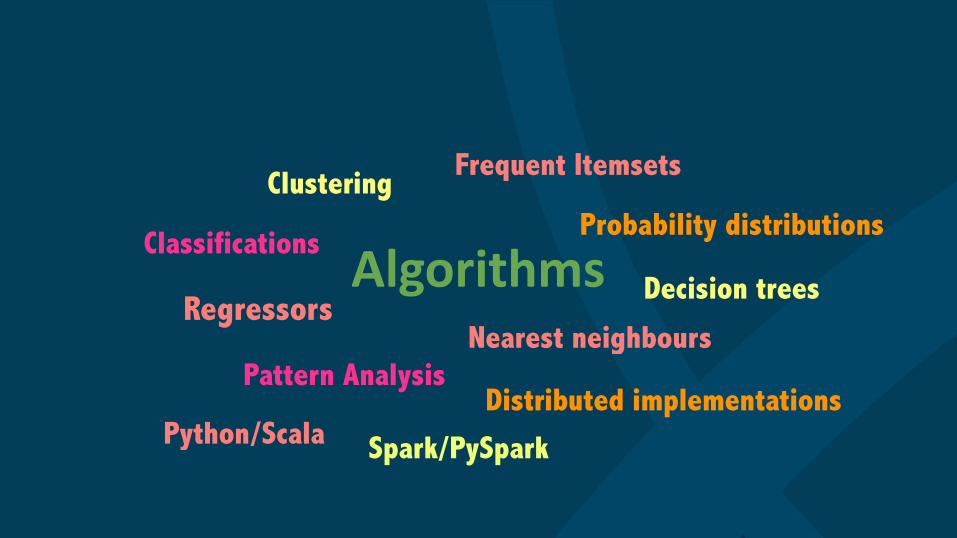
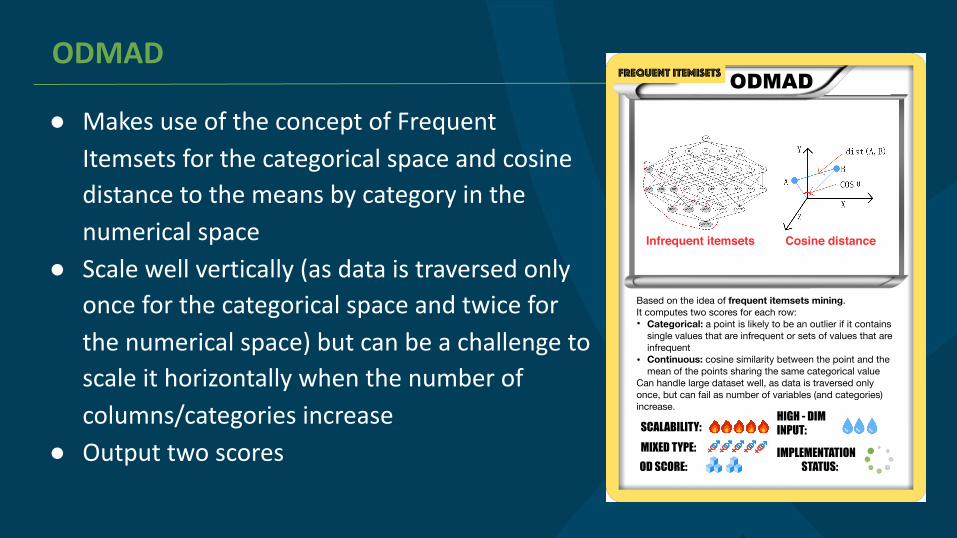
● MakesuseoftheconceptofFrequentItemsetsforthecategoricalspaceandcosinedistancetothemeansbycategoryinthenumericalspace
● Scalewellvertically(asdataistraversedonlyonceforthecategoricalspaceandtwiceforthenumericalspace)butcanbeachallengetoscaleithorizontallywhenthenumberofcolumns/categoriesincrease
● Outputtwoscores
ODMADFrequent itemiseTs
Infrequent itemsets Cosine distance
SCALABILITY:MIXED TYPE: IMPLEMENTATION
STATUS:OD SCORE:
HIGH - DIM INPUT:
Based on the idea of frequent itemsets mining. It computes two scores for each row: • Categorical: a point is likely to be an outlier if it contains
single values that are infrequent or sets of values that are infrequent
• Continuous: cosine similarity between the point and the mean of the points sharing the same categorical value
Can handle large dataset well, as data is traversed only once, but can fail as number of variables (and categories) increase.

SPAD
● Suitableforcategoricaldata(numericalneedstobebinned/discretised)
● Score=log-probabilityoftherecord● Assumesindependenceacrossmultiple
variables● Possibleextensionwithrandom
combinationsofcolumns(tuples,triples)● Fastandresultseasilyinterpretable
SPAD
SPAD: a Simple Probabilistic Anomaly Detection. It works only with categorical data, continues data can be binned/discretised as categorical variables. A score for an example is related to the log-probability of the record (the lower, the higher OD score). Assumes the attributes are independent of each other, so cannot detect outliers across multiple variables. An extension addressing this drawback considers random subsets of variables.
P(x)
SCALABILITY:MIXED TYPE: IMPLEMENTATION
STATUS:OD SCORE:
HIGH - DIM INPUT:

iFOREST
● Worksonnumericdata,categoricalcolumnsneedstobeexploded
● Canstrugglewithhigh-dimensionalinputs● Basedontheideaofisolation:Samplesofthe
datasetarerecursivelysplitonarandomchosenvariable.Thiscreatessortofbinary/decisiontreesforeachsample—>moreanomalousrecordsaremorelikelytobeisolatedearlierintheprocess(haveshorterpathstotheroot)
iFOREST
iForest (isolation forest) works on numeric data. Categorical data can be converted in numeric format using e.g. dummy variables. Outliers are detected based on the idea of isolation. Samples of the dataset are recursively split on a randomly chosen variable (at a random point in the variable's range). This creates (for each sample) a sort of binary/decision tree. The dataset is then run through all such created trees. More anomalous records are more likely to be isolated earlier in the process (have shorter paths from the root).
TREE
SCALABILITY:MIXED TYPE: IMPLEMENTATION
STATUS:OD SCORE:
HIGH - DIM INPUT:

POD
● Usesasubsetofvariables(Xs)topredictanothervariable(Y)
● PredictionsarethenusedtocalculateanOutlierscore(howdifferentisthepredictedscorefromtheoriginalvalue)
● TheprocessisrepeatedfordifferentcombinationsofXsandY:finallyallscoresareusedtocalculateafinalone(canbeintensive)
● Anyalgorithmcanbeplugged● Offerlotsofinsights—>youcandrilldowntofindwhy
therecordisanoutlier
POD
Pattern based Outlier Detection (POD) is a technique where group of variables (Xs) are used to predict another variable (Y). The prediction is then compared with the actual value and an OD score is computed for the given variable. The process is repeated for different combination of Xs and Y and single OD scores are combined into a final one.Any algorithm can be used to predict the Y and scalability, how mixed type and high-dim data are handled depend on that choice (mainly SVM, logistic regression or random forests).
MULTI
SCALABILITY:MIXED TYPE: IMPLEMENTATION
STATUS:OD SCORE:
HIGH - DIM INPUT:

SNLA_SPR
● BasedontheideaofK-nearestneighbours
● Euclideandistanceandhammingdistance(butanycanbeused)
● Thecomplexityisgreatlyreducedviaapruningtechnique
● Returnonlyapre-fixednumberofoutliers
SNLA_SPRNEIGHBOURS
SNLA_SPR is based on the idea of K-nearest neighbours for continuous variables. Categorical data can be converted in numeric format using e.g. dummy variables. It uses two nested loops, however, the complexity is greatly reduced via a pruning technique: it keeps track of closest neighbours found so far for an example and, once an exclusion condition gets satisfied, it stops computing additional neighbours and remove this example from future computations as it cannot be an outlier. Return only a pre-fixed number of outliers.
SCALABILITY:MIXED TYPE: IMPLEMENTATION
STATUS:OD SCORE:
HIGH - DIM INPUT:

Summary
KAMILA ODMAD SPAD iFOREST POD SNLA_SPR
SCALABILITY
MIXED TYPE
HIGH - DIM INPUT
OD SCORE

Wrapup

Wrapup
● Ongoingproject● PotentialnotjustforCensus!● CurrentlytestingmethodsonrawCensus2011data● PlantotestthemethodsintheCensusrehearsal—>endof
thisyear● PlantopublishalgorithmsonGitHub
● Promisingresults(foundtheobvious)butno🐶found,yet!

References
• iFOREST:L.F.Tony,T.K.MingandZ.Zhi-Hua,Isolation-basedanomalydetection,ACMTransactionsonKnowledgeDiscoveryfromData(TKDD)6.1(2012),3.
•SNLA_SPR:S.D.BayandM.A.Schwabacher,Miningdistance-basedoutliersinnearlineartimewithrandomizationandasimplepruningrule,ACMSIGKDDinternationalconferenceonKnowledgediscoveryanddatamining(2003).
•ODMAD:A.KoufakouandM.Georgiopoulos,Afastoutlierdetectionstrategyfordistributedhigh-dimensionaldatasetswithmixedattributes,DataMiningandKnowledgeDiscovery(2010),20:p.259–289.
•SPAD:S.Aryal,K.M.TingandG.Haffari,RevisitingAttributeIndependenceAssumptioninProbabilisticUnsupervisedAnomalyDetection,PAISI(2016).
•POD:M.S.Mausam,R.Bart,S.SoderlandandO.Etzioni,Openlanguagelearningforinformationextraction,EmpiricalMethodsinNaturalLanguageProcessingandComputationalNaturalLanguageLearning(2012),p.523-534.
•KAMILA:A.Foss,M.Markatou,B.RayandA.Heching,Asemiparametricmethodforclusteringmixeddata,MachineLearning(2016).

Thankyou!