Embed Size (px)
Citation preview

Outlook for China Glyphosate Market 2016-2020
The Eighth Edition
Jan. 2017
Data & Business
Intelligence
Researched & prepared by:
Kcomber Inc.
Copyright by Kcomber Inc.
Any publication, distribution or copying of the content in this report is
prohibited.
CCM
1
Contents
Executive summary ..................................................................................................................1
Methodology .............................................................................................................................4
1 Factors influencing China’s glyphosate industry ..............................................................8
1.1 Economic environment ............................................................................................. 8
1.2 Government policy .................................................................................................. 12
1.3 Global demand ......................................................................................................... 13
1.4 Competition with overseas glyphosate industry .................................................. 15
1.5 Entry barriers of glyphosate industry .................................................................... 16
2 Glyphosate upstream industry.......................................................................................... 19
2.1 Introduction to key raw materials & intermediates of glyphosate ...................... 19
2.1.1 Glycine ................................................................................................................... 22
2.1.2 IDAN ....................................................................................................................... 28
2.1.3 DEA ........................................................................................................................ 32
2.1.4 Paraformaldehyde ................................................................................................ 37
2.1.5 PMIDA .................................................................................................................... 45
2.1.6 Natural gas ............................................................................................................ 47
2.2 Impacts of raw materials on glyphosate industry ................................................ 49
3 Glyphosate supply ............................................................................................................. 51
3.1 Glyphosate registration situation .......................................................................... 51
3.2 Glyphosate technical ............................................................................................... 53
3.2.1 China's position in global glyphosate technical supply .................................. 53
3.2.2 Total supply ........................................................................................................... 55
3.2.3 Supplier ................................................................................................................. 55
3.2.4 Production by region ........................................................................................... 63
3.2.5 Production by production route .......................................................................... 64
3.3 Glyphosate formulations ......................................................................................... 66
3.3.1 Overview ................................................................................................................ 66
3.3.2 Introduction to specific formulations ................................................................. 67
3.3.3 China’s weakness in formulation production .................................................... 68
3.3.4 China’s glyphosate formulation trend and its impacts on global market ...... 69
3.4 Forecast on glyphosate supply in the next five years ......................................... 71
4 Circulation ........................................................................................................................... 73
4.1 Trade analysis .......................................................................................................... 73
4.1.1 Trade position in the world .................................................................................. 73
4.1.2 Antidumping issues involving Chinese glyphosate ......................................... 74
2
4.1.3 Export situation of PMIDA and glyphosate ........................................................ 77
4.1.4 Chinese glyphosate flow ..................................................................................... 88
4.1.5 Trade trends .......................................................................................................... 91
4.2 Price .......................................................................................................................... 92
4.2.1 Price changes in the past and key factors ......................................................... 92
4.2.2 Price forecast, 2017-2020 ..................................................................................... 95
5 Demand for glyphosate...................................................................................................... 97
5.1 Global demand for glyphosate ............................................................................... 97
5.1.1 Overview of global genetically modified crop ................................................... 97
5.1.2 Global demand for glyphosate ............................................................................ 99
5.2 Domestic demand for glyphosate ........................................................................ 100
5.2.1 Overview of China's glyphosate consumption................................................ 100
5.2.2 Position and market size of glyphosate in herbicide industry ...................... 101
5.2.3 Glyphosate application in China ....................................................................... 102
5.2.3.1 By specific formulation .................................................................... 102
5.2.3.2 By crop............................................................................................... 103
5.3 Forecast on glyphosate demand in the next five years ...................................... 114
6 Production technology & technology level .................................................................... 116
6.1 AEA pathway .......................................................................................................... 117
6.1.1 Description ............................................................................................ 117
6.1.2 Development of AEA pathway in China .............................................. 118
6.1.3 Theoretical consumption of raw materials for AEA pathway .......... 122
6.1.4 Advantages and problems .................................................................. 123
6.2 DEA route ............................................................................................................... 124
6.2.1 Description ........................................................................................... 124
6.2.2 Development of DEA pathway in China ............................................. 126
6.2.3 Theoretical consumption of raw materials for DEA pathway .......... 128
6.2.4 Advantages and problems .................................................................. 128
6.3 IDAN route .............................................................................................................. 129
6.3.1 Description ........................................................................................... 129
6.3.2 Development of IDAN pathway in China ........................................... 130
6.3.3 Theoretical consumption of raw materials for IDAN pathway ........ 131
6.3.4 Advantages and problems .................................................................. 131
6.4 Comparison of different pathways and development trend ............................. 132
6.5 Wastewater treatment technology ....................................................................... 133
7 Competitive landscape of Chinese glyphosate industry ............................................. 143
8 Challenges, commercial opportunities and recommendation..................................... 149
3
9 Profiles of key glyphosate technical producers ........................................................... 152
9.1 Hubei Trisun Chemicals Co., Ltd. ......................................................................... 152
9.2 Fuhua Tongda Agro-chemical Technology Co., Ltd. .......................................... 153
9.3 Zhejiang Wynca Chemical Group Co., Ltd. ......................................................... 155
9.4 Nantong Jiangshan Agrochemical & Chemicals Co., Ltd. ................................. 158
9.5 Jiangsu Good Harvest-Weien Agrochemical Co., Ltd. ....................................... 160
9.6 Jiangsu Yangnong Chemical Co., Ltd. ................................................................. 161
9.7 Zhejiang Jinfanda Biochemical Co., Ltd. ............................................................. 162
9.8 Shandong Weifang Rainbow Chemical Co., Ltd. ................................................ 164
9.9 Hubei Sanonda Co., Ltd......................................................................................... 165
LIST OF TABLES
Table 1-1 Factors influencing China’s glyphosate industry, 2015
Table 1.1-1 China’s policies to boost farmers' income in recent years
Table 1.4-1 Key players of glyphosate technical in the world, as of H1 2016
Table 1.5-1 Capital barriers for glyphosate manufacturers in China
Table 2.1.1-1 Raw material consumption and unit cost of chloroacetic acid ammonolysis
process for glycine production in China, Dec. 2015
Table 2.1.1-2 Capacity and output of glycine in China, 2011-2015
Table 2.1.1-3 Producers of industrial grade glycine in China, 2011-2015
Table 2.1.1-4 Consumption of glycine in glyphosate production in China, 2011-2015
Table 2.1.1-5 Main glycine producers and glycine consumers in glyphosate industry in China,
2015
Table 2.1.2-1 Capacity and output of IDAN producers in China, 2011-2015
Table 2.1.2-2 Key glyphosate technical producers adopting IDA pathway in China, as of H1
2016
Table 2.1.3-1 Capacity and output of DEA producers in China, 2011-2016
Table 2.1.3-2 China's anti-dumping duties on EA for different companies, as of 13 Nov., 2015
Table 2.1.3-3 Output of PMIDA & glyphosate technical by taking DEA as raw material and
consumption volume of DEA, 2011-2015, tonne
Table 2.1.3-4 Producers of PMIDA & glyphosate technical taking DEA as raw material in China,
2011-2015, tonne
Table 2.1.4-1 Basic info of key PF producers in China
Table 2.1.4-2 Capacity and output of key PF producers in China, 2011-Aug. 2016
Table 2.1.4-3 China's imports & exports of PF, 2011-2015
Table 2.1.4-4 Consumption of PF in agrochemical industry in China, 2011-2015, tonne
Table 2.1.4-5 Comparison of different production pathways of glyphosate technical in China
Table 2.1.5-1 Capacity and output of PMIDA manufacturers in China, 2011-2016
Table 2.1.6-1 Average market price of natural gas for industrial use in some cities of China,
May to August 2016
Table 3.1-1 Registrations of glyphosate in China, as of March 2012 and Oct. 2016
Table 3.1-2 Registrations of glyphosate technical by content in China, as of Oct. 2016
Table 3.1-3 Registrations of glyphosate technical by AI in China, as of Oct. 2016
Table 3.1-4 Registrations of single glyphosate formulations by specification in China, as of Oct.
4
2016
Table 3.2.1-1 Output of China's glyphosate and share in global market, 2011-2015
Table 3.2.1-2 Situation of China's glyphosate in overseas market, 2011-2015
Table 3.2.3-1 Basic info of glyphosate technical manufacturers in China
Table 3.2.3-2 Capacity and output of glyphosate technical by producer in China, 2011-H1 2016
Table 3.2.4-1 Capacity and output of glyphosate technical in China by region, 2011-2015
Table 3.2.5-1 Capacity of glyphosate technical in China by production route, 2006-2016
Table 3.2.5-2 Output of glyphosate technical in China by production route, 2006-2015
Table 3.3.1-1 Key glyphosate formulations in China
Table 3.3.1-2 Output of key glyphosate formulations in China, 2011-H1 2016, tonne
Table 3.3.3-1 Comparison of weed control effect between Roundup and glyphosate
formulations made in China
Table 3.4-1 Expansion plan of glyphosate technical in China, as of Dec. 2016
Table 4.1.3-1 Major overseas buyers of China's PMIDA, 2015, tonne
Table 4.1.3-2 Export volume of China's glyphosate by continent, 2011-H1 2016
Table 4.1.3-3 China's exports of glyphosate by month, 2013
Table 4.1.3-4 China's exports of glyphosate by month, 2014
Table 4.1.3-5 China's exports of glyphosate by month, 2015
Table 4.1.3-6 China's exports of glyphosate by month, H1 2016
Table 4.1.3-7 China's exports of glyphosate by destination, 2013
Table 4.1.3-8 China's exports of glyphosate by destination, 2014
Table 4.1.3-9 China's exports of glyphosate by destination, 2015
Table 4.1.3-10 China's exports of glyphosate by destination, H1 2016
Table 4.1.4-1 Cooperation between key overseas and Chinese players
Table 4.2.2-1 Year-on-year growth rates of glyphosate’s annual average ex-works price and
export volume in China, 2006-2016
Table 5.1.1-1 Global planting area of GM crops by country, 2006-2015, million ha
Table 5.2.2-1 Supply and consumption of glyphosate and share in herbicides in China,
2006-2015, tonne
Table 5.2.3.1-1 Consumption of glyphosate formulations in China, 2011-2015
Table 5.2.3.2-1 Planting area of main crops in China, 2011-2015, '000 hectare
Table 5.2.3.2-2 Consumption of glyphosate (calculated by 95% technical) in China by crop,
2011-2015, tonne
Table 5.2.3.2-3 Consumption of glyphosate (calculated by 95% technical) in fruits in China,
2011-2015, tonne
Table 6.1.2-1 Major achievements for recycling raw materials in glyphosate technical
production by AEA pathway
Table 6.1.2-2 Improvements in hydrolysis of glyphosate technical production by AEA pathway
in China
Table 6.1.3-1 Raw material cost of AEA pathway for glyphosate technical production in China,
June 2016
Table 6.2.3-1 Raw material cost of DEA route for glyphosate technical production in China,
June 2016
Table 6.3.3-1 Raw material cost of IDAN route for glyphosate technical production in China,
5
June 2016
Table 6.4-1 Comparison of the three production routes of glyphosate technical in China
Table 6.5-1 Name list of four glyphosate (PMIDA) manufacturers passing the environmental
protection verification launched by the Ministry of Environmental Protection of China, 2014
Table 6.5-2 Source and content of glyphosate liquid waste
Table 6.5-3 Comparison of membrane method and selective transformation and burning
method for disposal of glyphosate mother liquid
Table 6.5-4 Investment in 100,000 t/a organophosphorus wastewater treatment project by
Zhejiang Wynca Chemical Group Co., Ltd.
Table 6.5-5 Hydrogen utilization project of Youth Chemical Co., Ltd.
Table 7-1 Comparison between glyphosate and paraquat
Table 9.1.1-1 Capacity and output of glyphosate technical in Hubei Trisun, 2008-2015
Table 9.1.2-1 Ownership structure of Fuhua Tongda, June 2016
Table 9.1.2-2 Subsidiaries of Fuhua Tongda, June 2016
Table 9.1.2-3 Capacity and output of glyphosate technical in Fuhua Tongda, 2006-2015
Table 9.1.3-1 Capacity and output of glyphosate technical in Zhejiang Wynca, 2006-2015
Table 9.1.4-1 Nantong Jiangshan’s major subsidiaries
Table 9.1.4-2 Capacity of major products in Nantong Jiangshan, 2015
Table 9.1.4-3 Glyphosate technical and its supporting products in Nantong Jiangshan, 2015
Table 9.1.4-4 Capacity and output of glyphosate technical in Nantong Jiangshan, 2008-2015
Table 9.1.4-5 Revenue, cost and profit of glyphosate in Nantong Jiangshan, 2008-2015, million
USD
Table 9.1.5-1 Capacity and output of glyphosate technical in Jiangsu Weien, 2008-2015
Table 9.1.6-1 Capacity and output of glyphosate technical in Jiangsu Yangnong, 2008- 2015
Table 9.1.7-1 Capacity and output of glyphosate technical in Zhejiang Jinfanda, 2006-2015
Table 9.1.7-2 Capacity of glyphosate technical and its related products in Zhejiang Jinfanda
and Jiangxi Jinlong, 2015, t/a
Table 9.1.8-1 Factories of Shandong Rainbow and its main products
Table 9.1.8-2 Capacity and output of glyphosate technical in Shandong Rainbow, 2011-2015
Table 9.1.9-1 Capacity of major products in Hubei Sanonda, 2015
Table 9.1.9-2 Capacity and output of glyphosate technical in Hubei Sanonda, 2006-2015
LIST OF FIGURES
Figure 1.1-1 China's GDP growth, 2006-2015
Figure 1.1-2 Per capita annual net income of rural residents in China, 2006-2015
Figure 1.1-3 Engel's Coefficient in China, 2006-2015
Figure 1.1-4 Population structure in China, 2006-2015
Figure 1.3-1 China's export and global demand (China excluded) of glyphosate, 20011-2015
Figure 1.4-1 China's capacity and global demand for glyphosate, 2006-2015
Figure 2.1-1 Concise flow charts of IDA and AEA pathway for producing glyphosate technical
Figure 2.1-2 Different pathways for producing glyphosate technical and value chain of key raw
materials
Figure 2.1.1-1 Flowchart of chloroacetic acid ammonolysis process for glycine production
Figure 2.1.1-2 Flowchart of Strecker process for glycine production
6
Figure 2.1.1-3 Flowchart of hydantion process for glycine production
Figure 2.1.1-4 Monthly average ex-works price of tech-grade glycine and glyphosate 95%
technical in China, 2011-2016
Figure 2.1.2-1 Production process of IDAN by natural gas route in China
Figure 2.1.2-2 Capacity and output of IDAN in China, 2005-2015
Figure 2.1.2-3 Monthly average ex-works price of IDAN and glyphosate 95% technical in
China, Jan. 2009-Nov. 2016
Figure 2.1.3-1 Capacity and output of DEA in China, 2011-2015
Figure 2.1.3-2 China's imports of DEA, 2006-Nov. 2016
Figure 2.1.3-3 Apparent consumption of DEA in China, 2011-2015
Figure 2.1.4-1 Capacity and output of PF in China, 2011-2015
Figure 2.1.4-2 Ex-works price of 95% methanol and 96% PF in China, 2011-2015
Figure 2.1.4-3 Apparent consumption and its growth rate of PF in China, 2011-2015
Figure 2.1.4-4 Consumption of PF in China by end use segment, 2015
Figure 2.1.4-5 Consumption of PF in glyphosate in China, 2011-2015, tonne
Figure 2.1.4-6 Output share of glyphosate technical by pathway in China, 2011-2015
Figure 2.1.5-1 Output of PMIDA in China, 2011-2015
Figure 2.1.6-1 Output and apparent consumption of natural gas in China, 2011-2015
Figure 3.1-1 Active registrations of single glyphosate formulations by specification in China, as
of Oct. 2016
Figure 3.2.2-1 Capacity and output of glyphosate technical in China, 2006-2015
Figure 3.2.4-1 Output share of glyphosate technical in China by region, 2015
Figure 3.3.3-1 China's export volume of glyphosate formulations by specification, 2011-2015
Figure 3.4-1 Forecast on glyphosate technical output in China, 2016-2020
Figure 4.1.1-1 China's export and global demand for glyphosate, 2011-2015
Figure 4.1.3-1 China's export volume of glyphosate and PMIDA, 2006-H1 2016
Figure 4.1.3-2 China's export value of glyphosate and PMIDA, 2006-H1 2016
Figure 4.1.3-3 China's annual average export price of PMIDA and glyphosate, 2006-H1 2016
Figure 4.1.3-4 Key export destinations of China's PMIDA, 2006-H1 2016
Figure 4.1.4-1 China's glyphosate technical flow, 2015
Figure 4.1.4-2 Major overseas importers of Chinese glyphosate technical, 2015
Figure 4.1.4-3 China's glyphosate formulation flow, 2015
Figure 4.2.1-1 Monthly average ex-works price of glyphosate technical and key formulations in
China, Jan. 2009-Dec. 2016
Figure 4.2.1-2 Annual average ex-works price of glyphosate technical and annual export
volume of glyphosate in China, 2006-2016
Figure 4.2.1-3 Ex-works prices of glyphosate technical & key raw materials in China, Jan.
2009-Dec. 2016
Figure 4.2.2-1 Monthly ex-works price of glyphosate technical in China, Jan. 2009-Dec. 2016
Figure 4.2.2-2 Forecast on glyphosate technical price in China, 2017-2020
Figure 5.1.1-1 Global planting area of GM crop by trait, 2006-2015
Figure 5.1.1-2 Global planting area of GM crops by crop, 2006-2015
Figure 5.1.2-1 Global glyphosate demand and its growth rate, 2011-2015
Figure 5.1.2-2 Global consumption of glyphosate by continent, 2015
7
Figure 5.2.1-1 Output, export and consumption of glyphosate in China, 2011-2015
Figure 5.2.2-1 Consumption structure of main herbicides in China, 2015
Figure 5.2.3.2-1 Geographical distribution of main orchards in China, 2015
Figure 5.2.3.2-2 Geographical distribution of corn planting area in China, 2015
Figure 5.2.3.2-3 Geographical distribution of rice planting area in China, 2015
Figure 5.2.3.2-4 Geographical distribution of wheat planting area in China, 2015
Figure 5.2.3.2-5 Geographical distribution of bean planting area in China, 2015
Figure 5.2.3.2-6 Geographical distribution of cotton planting area in China, 2015
Figure 5.2.3.2-7 Geographical distribution of tea planting area in China, 2015
Figure 5.2.3.2-8 Geographical distribution of sugarcane planting area in China, 2015
Figure 5.2.3.2-9 Geographical distribution of rubber planting area in China, 2015
Figure 5.3-1 Forecast on glyphosate demand in China, 2016-2020
Figure 6.1-1 Production pathways of glyphosate technical in China
Figure 6.1.1-1 Brief pathway of AEA pathway for glyphosate technical production in China
Figure 6.1.1-2 Flowchart of AEA pathway for glyphosate technical production in China
Figure 6.1.2-1 Recycling system of glyphosate technical production by AEA pathway in China
Figure 6.2.1-1 Brief pathway of DEA route for glyphosate technical production in China
Figure 6.2.1-2 Flowchart of DEA route for glyphosate technical production in China
Figure 6.3.1-1 Brief pathway of IDAN route for glyphosate technical production in China
Figure 6.3.1-2 Flowchart of IDAN route for glyphosate technical production in China
Figure 6.5-1 Traditional wastewater treatment process for glyphosate in China
Figure 6.5-2 Brief technology diagram of water recycling with membrane method
Figure 6.5-3 Diagram of membrane separation technology
Figure 6.5-4 Flowchart of catalytic wet air oxidation technology for glyphosate waste treatment
Figure 9.1.3-1 Main business structure of Zhejiang Wynca by revenue, 2015
Figure 9.1.3-2 Ownership structure of Zhejiang Wynca, 2015
Figure 9.1.9-1 Ownership structure of Hubei Sanonda, 2015
8
1. Introduction
Outlook for China Glyphosate Market 2016-2020 is a preliminary report on China’s glyphosate
market finished by CCM in Jan. 2017. This report attaches importance to the following parts:
- Key factors influencing China’s glyphosate industry;
- Key upstream products of glyphosate technical including glycine, DEA, IDAN,
paraformaldehyde, and PMIDA;
- Supply of glyphosate technical (capacity, output, by producer and by production route) in
China;
- Key producers of glyphosate technical in China;
- Supply and demand of glyphosate formulation by specification in China;
- China's export of glyphosate technical, various glyphosate formulations and PMIDA, by key
destination and by key trader, 2011-2015
- Price of glyphosate technical and future trend;
- Production technology & technology level of glyphosate technical in China
- Breakdown of glyphosate consumption by crop in China, 2011-2015
9
2. Approach for the report
This report has been drafted by diverse methods which are as follows:
Desk research
The sources of desk research are various, including published magazines, journals,
government statistics, industrial statistics, customs statistics, association seminars as well as
information from the Internet. A lot of work went into compiling and analyzing the information
obtained. Where necessary, checks were made with the Chinese suppliers regarding market
information such as production, demand, use, competition, etc.
Telephone interview
CCM carried out extensive telephone interviews with all manufacturers of glyphosate technical
and PMIDA producers as well as some producers of glyphosate formulations. Detailed
production information and market situation were sourced and verified.
For directly analyzing the imports and exports of glyphosate technical, its formulations and
PMIDA, many importers and exporters were contacted whenever the verification was needed.
Raw material (glycine, DEA, IDAN, PMIDA, etc.) suppliers were also contacted to help
understand the price, supply as well as governmental policies on raw materials and their
impact on the glyphosate industry.
Site visit
CCM has conducted site visits and carried out in-depth interviews with some major glyphosate
producers such as Fuhua Tongda and Zhejiang Wynca, in order to verify the data of production,
market, sales and technology to figure out the glyphosate supply/demand situation in China.
Through site visits, more accurate information was obtained to enhance the understanding of
the glyphosate industry.
Import & export analysis
Analysis of export data (HS code 29310000, 29319019, 29319011, 38089311 and 38089319)
from the China Customs helps work out China's exports of glyphosate (glyphosate technical,
glyphosate formulations and PMIDA) by producer, trader and destination.
Report generation
Logical analysis and scientific ratiocination were conducted to generate the report, such as
supply & demand analysis and cross-checking of all data. All the data and findings obtained
through the above methods will be presented in the report clearly.
10
3. Executive summary
The sales of herbicides have grown fast in the world in the past few years mainly thanks to the
boom in planting of biofuel crops, especially corn grown as an input for ethanol. The global
corn planting area increased from XX million hectares in 2002 to XX million hectares in 2015.
Many of the latter crops are genetically modified to make them "Roundup ready", which
enables herbicides to kill surrounding grasses and weeds without damaging the core crops.
Glyphosate, the key active ingredient of Roundup, is one of the most commonly sold
herbicides on the market today. With rapidly increasing demand, glyphosate has shared more
than 30% of the global herbicide market in terms of sales volume.
- Position of Chinese glyphosate in the world
After nearly 30 years' development, China has become the largest production base of
glyphosate technical in the world and has been supplying over XX% of the global production of
glyphosate.
The output of glyphosate technical in China was about XX tonnes in 2015, XX% of which was
exported to more than XX countries and regions worldwide.
- Production
Stimulated by increasing global demand for glyphosate, the domestic output of glyphosate
technical kept increasing from XX tonnes in 2011 to XX tonnes in 2014. However, it decreased
to XX tonnes in 2015 because of the decreasing demand for glyphosate beyond China caused
by the decreasing planting area of GM crops in 2015.
Glyphosate production adopting the AEA pathway remains dominant in China, with its output
reaching XX tonnes and taking up XX% of national total in 2015.
In the past few years, the domestic production of glyphosate technical trended to transfer from
East China to Central China (Hubei, Jiangxi, Anhui, etc.) and Southwest China (Sichuan), and
Northwest China (Inner Mongolia). The output of glyphosate technical in Sichuan, Hubei,
Jiangxi, Anhui, and Inner Mongolia has kept increasing from about XX tonnes in 2011 to over
XX tonnes in 2014-2015.
There are only XX producers of glyphosate technical (both active and idle are included) in
China as of Dec. 2016, decreasing from over XX in 2011-2015, caused by the low price and
then low profit of glyphosate technical in 2015 and H1 2016.
Chinese glyphosate industry is dominated by the companies who own the latest technology,
large scale production capacity, strong financial and sales strength and complete industrial
chain, etc. Leading producers of glyphosate technical in the country include Hubei Trisun (XX
11
t/a), Fuhua Tongda (XX t/a), Zhejiang Wynca (XX t/a), Nantong Jiangshan (XX t/a), Jiangsu
Weien (XX t/a), Jiangsu Yangnong (XX t/a), Shandong Rainbow (XX t/a), etc.
- Export
Glyphosate is the largest export commodity in the pesticide sector in China in terms of both
volume and value. China's glyphosate industry highly depends on overseas market, with over
XX% of its output exported every year. Besides, China has become the largest exporter of
glyphosate in the world, and the export volume (glyphosate technical and formulations
included and converted to 95% technical) has reached over XX tonnes in 2015, satisfying over
XX% of the global demand.
China's glyphosate export value kept increasing from over USDXX billion in 2011 to over
USDXX billion in 2012 and over USDXX billion in 2013, driven by both increasing export
volume and export price. The export value decreased a little to USDXX billion in 2014 because
of the declining export price though the export volume increased, and it decreased sharply to
USDXX billion in 2015 attributing to decreasing export volume and export price.
The major export destinations of Chinese glyphosate technical are Argentina, the US, Brazil,
Malaysia, Indonesia, Australia, and Russia, and the major destinations of glyphosate
formulations are Thailand, Australia, Vietnam, the US, Ghana, Nigeria, Russia, Brazil, Uruguay,
the Philippines, Japan, Mexico, Indonesia, Ukraine, Columbia, Chile, etc.
- Demand
Glyphosate has taken an irreplaceable position for the control of weeds in China. Its
consumption has grown at a CAGR of XX% in 2011-2015, higher than that of the total
herbicide consumption (about XX%) during the same period, reaching about XX tonnes
(converted to 95% technical) in 2015, accounting for XX% of the total herbicide consumption in
China (converted to the most frequently used technical of each herbicide).
In China, glyphosate is quite important for the weeding in orchard, vegetables, wasteland
reclamation and traditional crop fields in the period of pre-seeding. Orchard is the largest
consumption field of glyphosate, with a demand share of about XX% in 2015, followed by
vegetables, corn, rice, wheat, tea, rubber, etc.
- Production technology
There are two pathways for glyphosate production in China including the iminodiacetic acid
(IDA) pathway and the aminoethanoic acid (AEA) pathway. According to the starting raw
material, the former can also be subdivided into two routes, namely the diethanolamine (DEA)
route and the iminodiacetonitrile (IDAN) route.
The IDA pathway has been developing rapidly in 2005-2009, and many domestic companies
12
set up glyphosate technical production lines of IDA pathway especially IDAN route. After that,
the DEA route showed a downtrend with the number of producers kept decreasing from XX in
2009 to only XX in 2014-2015 because of the strong competitiveness of IDAN route (low cost,
sufficient IDAN supply, etc.).
Because of the mature technology, plus the sufficient raw material supply in China, the AEA
pathway is widely adopted in China's glyphosate industry. In 2015, the capacity of glyphosate
technical by this pathway was about XX t/a, accounting for XX% of China's total capacity.
Generally, the glyphosate production technologies of all these three routes are mature, with
only small innovations on increasing the unit output. However, under the pressure of stricter
environmental protection policies like the environmental protection verification launched by the
Chinese government, the glyphosate producers began to focus on the innovation on waste
treatment technology. Among the waste treatment technologies, the burning method is the
rising one because of its high comprehensive utilization rate of phosphorus element.
Along with producers' increasing input on waste treatment, the production cost of glyphosate
also increases in China. Though the cost of AEA pathway is more affected by the
environmental protection policies, it still has a similar cost with the one of IDAN route and has
cost advantage over DEA route for its high production efficiency, complete industrial layout and
high value of byproducts.
- Price
Glyphosate price in China fluctuated in 2011-2016.
The annual average ex-works price of glyphosate technical increased from USDXX/t in 2011 to
USDXX/t in 2012 and USDXX/t in 2013, because of the sharply increasing export volume of
China’s glyphosate (increasing demand beyond China) and China’s environmental protection
verification (EPV) on glyphosate (PMIDA) producers.
However, it decreased to USDXX/t in 2014 and USDXX/t in 2015, because of the falling export
volume as a result of a decreasing demand beyond China and decreasing planting area of
genetically modified (GM) crops in 2015.
The price decreased to USDXX/t in 2016, because of the oversupply of glyphosate technical.
13
4. What’s in this report?
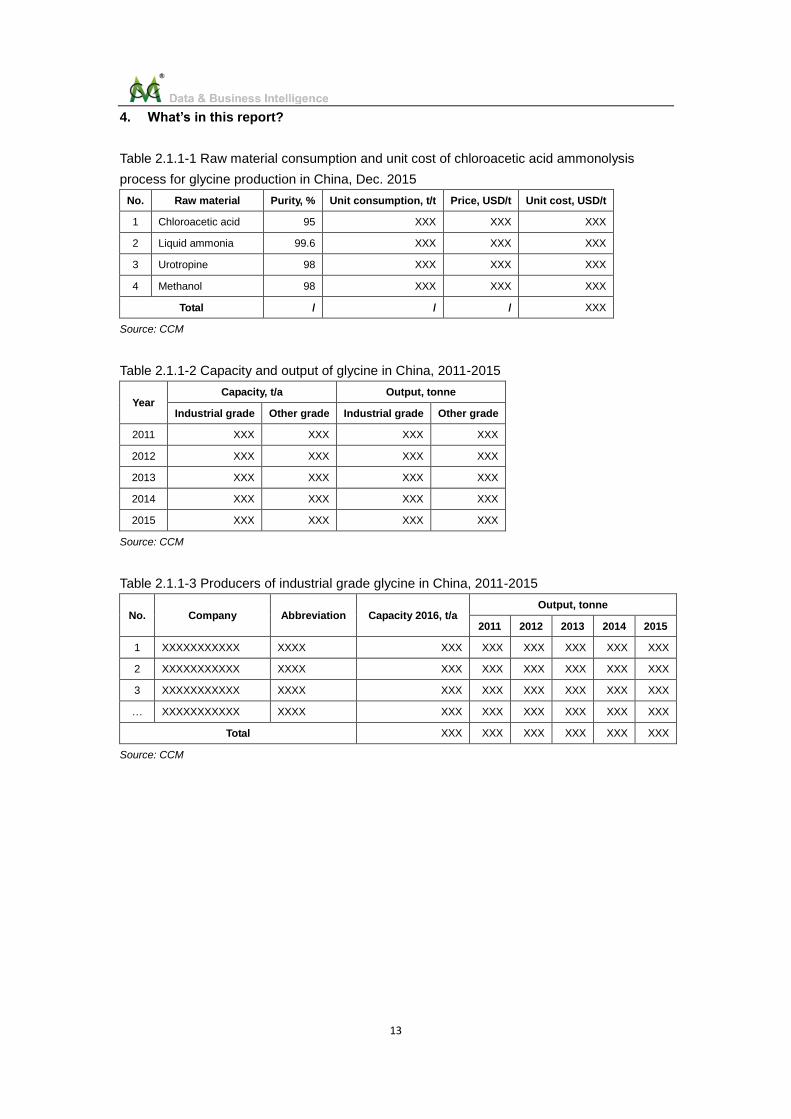
Table 2.1.1-1 Raw material consumption and unit cost of chloroacetic acid ammonolysis
process for glycine production in China, Dec. 2015
No. Raw material Purity, % Unit consumption, t/t Price, USD/t Unit cost, USD/t
1 Chloroacetic acid 95 XXX XXX XXX
2 Liquid ammonia 99.6 XXX XXX XXX
3 Urotropine 98 XXX XXX XXX
4 Methanol 98 XXX XXX XXX
Total / / / XXX
Source: CCM
Table 2.1.1-2 Capacity and output of glycine in China, 2011-2015
Year Capacity, t/a Output, tonne
Industrial grade Other grade Industrial grade Other grade
2011 XXX XXX XXX XXX
2012 XXX XXX XXX XXX
2013 XXX XXX XXX XXX
2014 XXX XXX XXX XXX
2015 XXX XXX XXX XXX
Source: CCM
Table 2.1.1-3 Producers of industrial grade glycine in China, 2011-2015
No. Company Abbreviation Capacity 2016, t/a Output, tonne
2011 2012 2013 2014 2015
1 XXXXXXXXXXX XXXX XXX XXX XXX XXX XXX XXX
2 XXXXXXXXXXX XXXX XXX XXX XXX XXX XXX XXX
3 XXXXXXXXXXX XXXX XXX XXX XXX XXX XXX XXX
… XXXXXXXXXXX XXXX XXX XXX XXX XXX XXX XXX
Total XXX XXX XXX XXX XXX XXX
Source: CCM
14
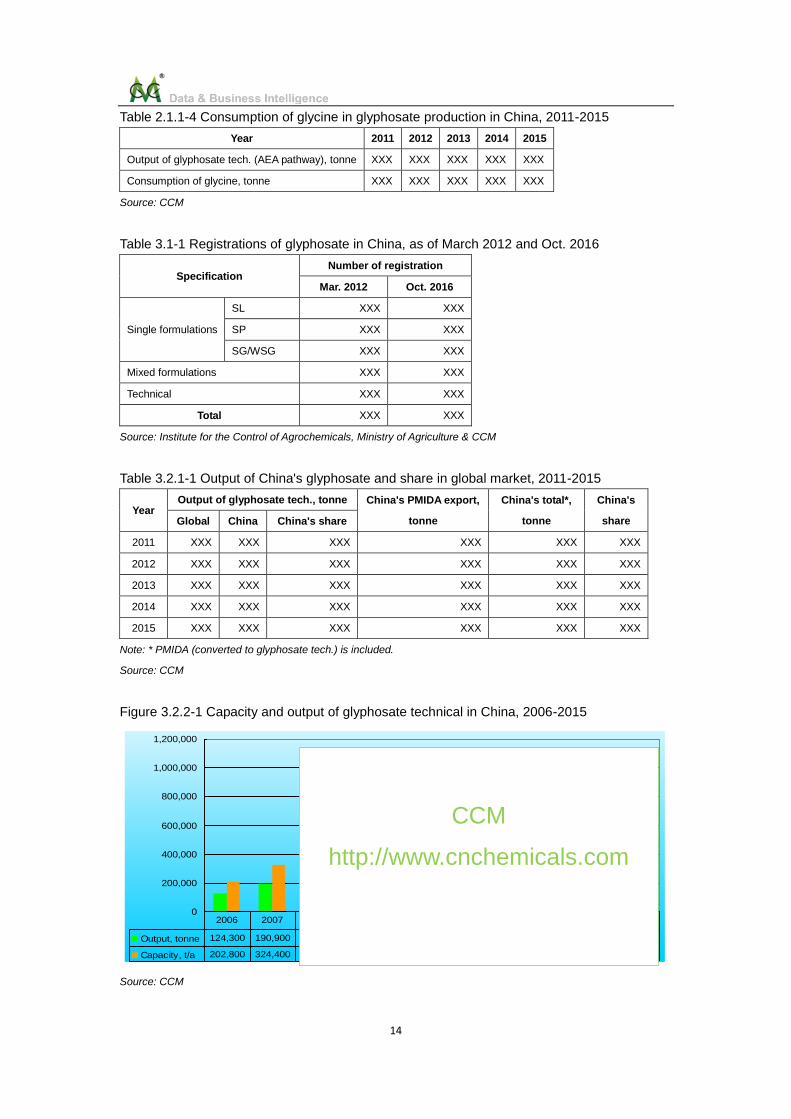
Table 2.1.1-4 Consumption of glycine in glyphosate production in China, 2011-2015
Year 2011 2012 2013 2014 2015
Output of glyphosate tech. (AEA pathway), tonne XXX XXX XXX XXX XXX
Consumption of glycine, tonne XXX XXX XXX XXX XXX
Source: CCM
Table 3.1-1 Registrations of glyphosate in China, as of March 2012 and Oct. 2016
Specification Number of registration
Mar. 2012 Oct. 2016
Single formulations
SL XXX XXX
SP XXX XXX
SG/WSG XXX XXX
Mixed formulations XXX XXX
Technical XXX XXX
Total XXX XXX
Source: Institute for the Control of Agrochemicals, Ministry of Agriculture & CCM
Table 3.2.1-1 Output of China's glyphosate and share in global market, 2011-2015
Year Output of glyphosate tech., tonne China's PMIDA export,
tonne
China's total*,
tonne
China's
share Global China China's share
2011 XXX XXX XXX XXX XXX XXX
2012 XXX XXX XXX XXX XXX XXX
2013 XXX XXX XXX XXX XXX XXX
2014 XXX XXX XXX XXX XXX XXX
2015 XXX XXX XXX XXX XXX XXX
Note: * PMIDA (converted to glyphosate tech.) is included.
Source: CCM
Figure 3.2.2-1 Capacity and output of glyphosate technical in China, 2006-2015
0
200,000
400,000
600,000
800,000
1,000,000
1,200,000
Output, tonne 124,300 190,900 320,000 330,500 320,000 340,000 430,000 512,000 534,000 510,000
Capacity, t/a 202,800 324,400 518,900 689,900 833,900 777,500 806,500 906,500 909,500 1,109,500
2006 2007 2008 2009 2010 2011 2012 2013 2014 2015
Source: CCM
CCM
http://www.cnchemicals.com
15
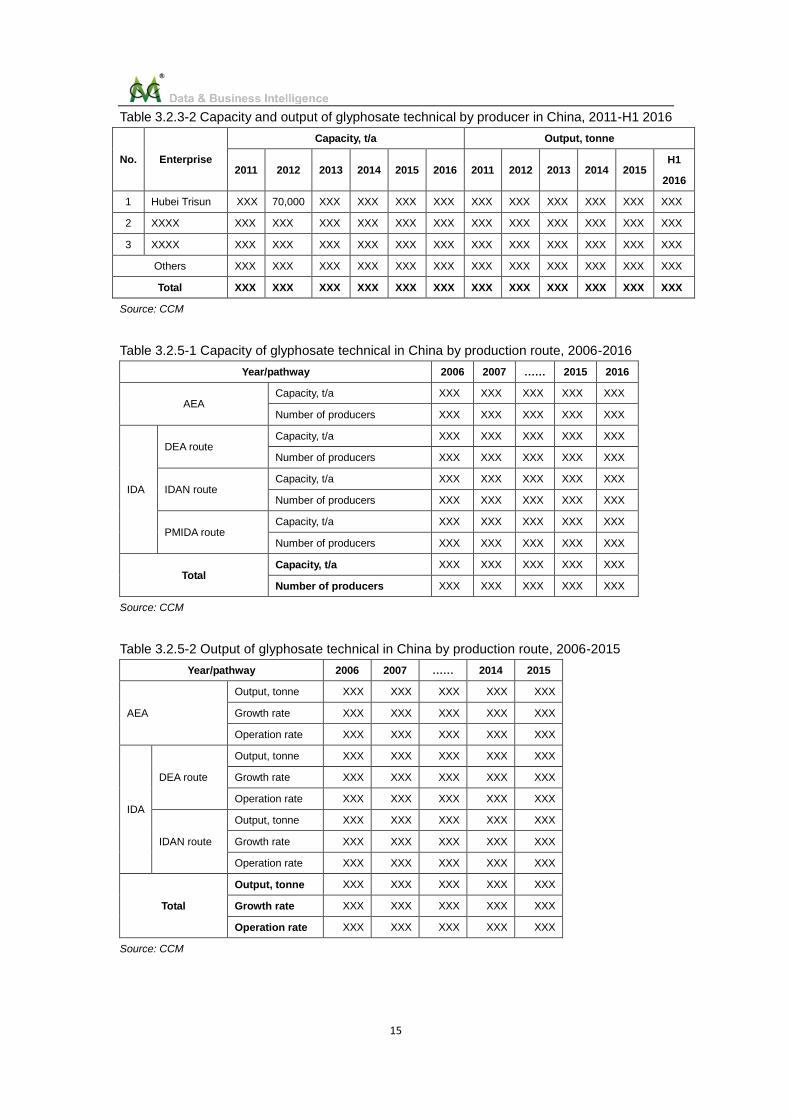
Table 3.2.3-2 Capacity and output of glyphosate technical by producer in China, 2011-H1 2016
No. Enterprise
Capacity, t/a Output, tonne
2011 2012 2013 2014 2015 2016 2011 2012 2013 2014 2015 H1
2016
1 Hubei Trisun XXX 70,000 XXX XXX XXX XXX XXX XXX XXX XXX XXX XXX
2 XXXX XXX XXX XXX XXX XXX XXX XXX XXX XXX XXX XXX XXX
3 XXXX XXX XXX XXX XXX XXX XXX XXX XXX XXX XXX XXX XXX
Others XXX XXX XXX XXX XXX XXX XXX XXX XXX XXX XXX XXX
Total XXX XXX XXX XXX XXX XXX XXX XXX XXX XXX XXX XXX
Source: CCM
Table 3.2.5-1 Capacity of glyphosate technical in China by production route, 2006-2016
Year/pathway 2006 2007 …… 2015 2016
AEA Capacity, t/a XXX XXX XXX XXX XXX
Number of producers XXX XXX XXX XXX XXX
IDA
DEA route Capacity, t/a XXX XXX XXX XXX XXX
Number of producers XXX XXX XXX XXX XXX
IDAN route Capacity, t/a XXX XXX XXX XXX XXX
Number of producers XXX XXX XXX XXX XXX
PMIDA route Capacity, t/a XXX XXX XXX XXX XXX
Number of producers XXX XXX XXX XXX XXX
Total Capacity, t/a XXX XXX XXX XXX XXX
Number of producers XXX XXX XXX XXX XXX
Source: CCM
Table 3.2.5-2 Output of glyphosate technical in China by production route, 2006-2015
Year/pathway 2006 2007 …… 2014 2015
AEA
Output, tonne XXX XXX XXX XXX XXX
Growth rate XXX XXX XXX XXX XXX
Operation rate XXX XXX XXX XXX XXX
IDA
DEA route
Output, tonne XXX XXX XXX XXX XXX
Growth rate XXX XXX XXX XXX XXX
Operation rate XXX XXX XXX XXX XXX
IDAN route
Output, tonne XXX XXX XXX XXX XXX
Growth rate XXX XXX XXX XXX XXX
Operation rate XXX XXX XXX XXX XXX
Total
Output, tonne XXX XXX XXX XXX XXX
Growth rate XXX XXX XXX XXX XXX
Operation rate XXX XXX XXX XXX XXX
Source: CCM

16
Table 3.3.1-2 Output of key glyphosate formulations in China, 2011-H1 2016, tonne
Year 30% SL
(41% IPA mainly)
51% SL
(51% IPA)
62% SL
(62% IPA)
68% SG
(75.7% WSG) Others
2011 XXX XXX XXX XXX XXX
2012 XXX XXX XXX XXX XXX
2013 XXX XXX XXX XXX XXX
2014 XXX XXX XXX XXX XXX
2015 XXX XXX XXX XXX XXX
H1 2016 XXX XXX XXX XXX XXX
Note: Quite a number of 10%SL, which has been banned since Jan. 2012, is consumed in China in 2011.
Source: CCM
Table 4.1.3-1 Major overseas buyers of China's PMIDA, 2015, tonne
No. Buyer Argentina India The US Others
1 XXXXXXXXXXX XXX XXX XXX XXX
2 XXXXXXXXXXX XXX XXX XXX XXX
3 XXXXXXXXXXX XXX XXX XXX XXX
… XXXXXXXXXXX XXX XXX XXX XXX
… XXXXXXXXXXX XXX XXX XXX XXX
Others XXX XXX XXX XXX
Total XXX XXX XXX XXX
Source: China Customs & CCM
Table 4.1.3-10 China's exports of glyphosate by destination, H1 2016
No. Destination
41% IPA 51% IPA 62% IPA 75.7% WSG Tech. Total
value,
USD
Volume,
tonne
Price,
USD/kg
Volume,
tonne
Price,
USD/kg
Volume,
tonne
Price,
USD/kg
Volume,
tonne
Price,
USD/kg
Volume,
tonne
Price,
USD/kg
1 XXXX XXX XXX XXX XXX XXX XXX XXX XXX XXX XXX XXX
2 XXXX XXX XXX XXX XXX XXX XXX XXX XXX XXX XXX XXX
…. XXXX XXX XXX XXX XXX XXX XXX XXX XXX XXX XXX XXX
29 XXXX XXX XXX XXX XXX XXX XXX XXX XXX XXX XXX XXX
30 XXXX XXX XXX XXX XXX XXX XXX XXX XXX XXX XXX XXX
Others XXX XXX XXX XXX XXX XXX XXX XXX XXX XXX XXX
Total XXX XXX XXX XXX XXX XXX XXX XXX XXX XXX XXX
Source: China Customs & CCM
17
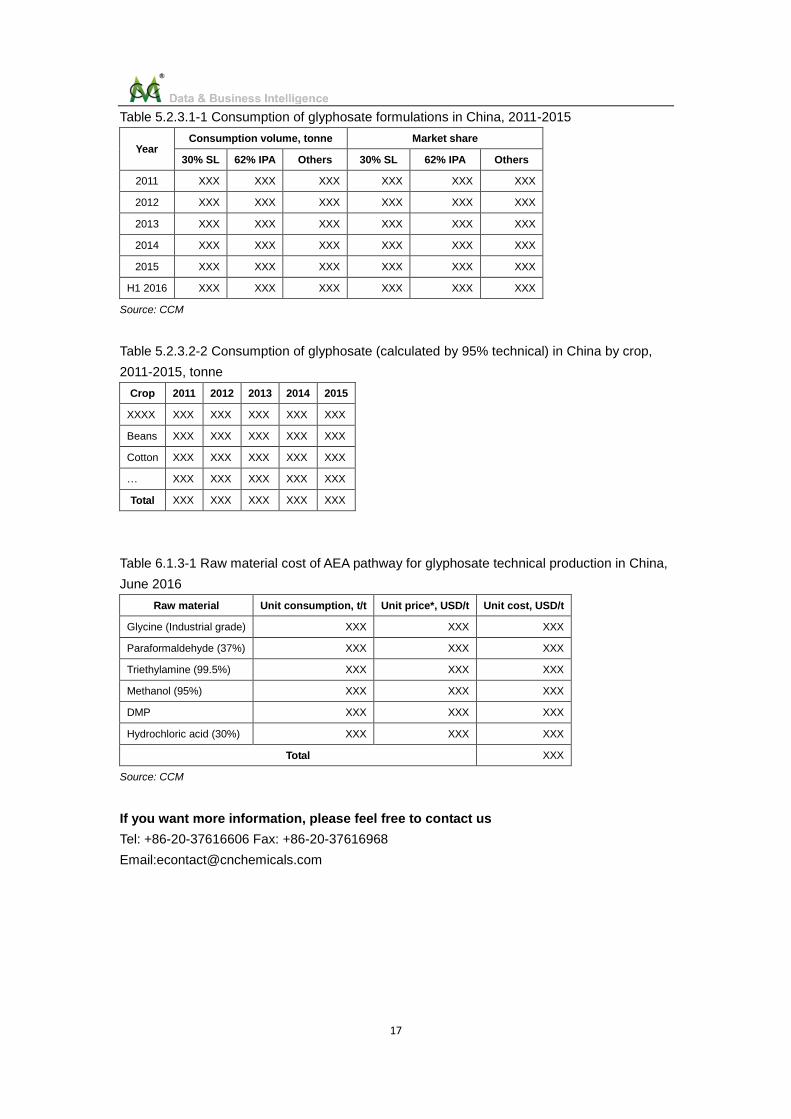
Table 5.2.3.1-1 Consumption of glyphosate formulations in China, 2011-2015
Year Consumption volume, tonne Market share
30% SL 62% IPA Others 30% SL 62% IPA Others
2011 XXX XXX XXX XXX XXX XXX
2012 XXX XXX XXX XXX XXX XXX
2013 XXX XXX XXX XXX XXX XXX
2014 XXX XXX XXX XXX XXX XXX
2015 XXX XXX XXX XXX XXX XXX
H1 2016 XXX XXX XXX XXX XXX XXX
Source: CCM
Table 5.2.3.2-2 Consumption of glyphosate (calculated by 95% technical) in China by crop,
2011-2015, tonne
Crop 2011 2012 2013 2014 2015
XXXX XXX XXX XXX XXX XXX
Beans XXX XXX XXX XXX XXX
Cotton XXX XXX XXX XXX XXX
… XXX XXX XXX XXX XXX
Total XXX XXX XXX XXX XXX
Table 6.1.3-1 Raw material cost of AEA pathway for glyphosate technical production in China,
June 2016
Raw material Unit consumption, t/t Unit price*, USD/t Unit cost, USD/t
Glycine (Industrial grade) XXX XXX XXX
Paraformaldehyde (37%) XXX XXX XXX
Triethylamine (99.5%) XXX XXX XXX
Methanol (95%) XXX XXX XXX
DMP XXX XXX XXX
Hydrochloric acid (30%) XXX XXX XXX
Total XXX
Source: CCM
If you want more information, please feel free to contact us
Tel: +86-20-37616606 Fax: +86-20-37616968
Email:[email protected]


![Diagrama de flujo[3.3.4 ]](https://img.pdfslide.net/doc/110x75/58a7c0981a28ab6b5a8b4a7f/diagrama-de-flujo334-.jpg)

