Embed Size (px)
Citation preview
July 30, 2016 Bank of Japan
Outlook for Economic Activity and Prices
July 2016
(English translation prepared by the Bank's staff based on the Japanese original)
Not to be released until 2:00 p.m.
Japan Standard Time on Saturday, July 30, 2016.
Please contact the Bank of Japan at the address below in advance to request permission
when reproducing or copying the content of this document for commercial purposes.
Secretariat of the Policy Board, Bank of Japan
P.O. Box 30, Nihonbashi, Tokyo 103-8660, Japan
Please credit the source when quoting, reproducing, or copying the content of this
document.
1
The Bank's View1
Summary
Japan's economy has continued its moderate recovery trend, although exports and production have been sluggish due mainly to the effects of the slowdown in emerging economies. Looking ahead, sluggishness is expected to remain in exports and production for some time, and the pace of economic recovery is likely to remain slow. Thereafter, domestic demand is likely to follow an uptrend, with a virtuous cycle from income to spending being maintained in both the household and corporate sectors, and exports are expected to head toward a moderate increase as overseas economies move out of their deceleration phase. Thus, Japan's economy is likely to be on a moderate expanding trend.
The year-on-year rate of change in the consumer price index (CPI, all items less fresh food) is likely to be slightly negative or about 0 percent for the time being, due to the effects of the decline in energy prices, and, as the underlying trend in inflation steadily rises, accelerate toward 2 percent. Meanwhile, assuming that crude oil prices will rise moderately from the recent level, it is likely that the contribution of energy items to the year-on-year rate of change in the CPI will decrease from the current level of slightly more than minus 1 percentage point, but remain negative until the end of fiscal 2016.2 Based on this assumption, the baseline scenario is that the timing of the year-on-year rate of change in the CPI reaching around 2 percent -- the price stability target -- will be during fiscal 2017, although this is accompanied by considerable uncertainties including those surrounding overseas economies going forward.3 Thereafter, the year-on-year rate of change in the CPI is likely to be around 2 percent on average.
Comparing the current projections with the previous ones, the projected growth rates are higher, particularly for the first half of the projection period, due in part to the effects of economic stimulus measures from the fiscal side. The front-loaded increase and subsequent decline in demand prior to and after the consumption tax hike that was planned to take place in April 2017 are likely to be smoothed out by the postponement of the hike. The projected rate of increase in the CPI for fiscal 2016 is lower, mainly reflecting the appreciation of the yen and the delay in the timing of improvement in the medium- to long-term inflation expectations, albeit with the higher growth projections; however, the projected rates of increase for fiscal 2017 and 2018 are more or less unchanged.
As for the conduct of monetary policy, the Bank will continue with "Quantitative and Qualitative Monetary Easing (QQE) with a Negative Interest Rate," aiming to achieve the price stability target of 2 percent, as long as it is necessary for maintaining that target in a stable manner. It will examine risks to economic activity and prices, and take additional easing measures in terms of three dimensions -- quantity, quality, and the interest rate -- if it is judged necessary for achieving the price stability target.
1 The text of "The Bank's View" was decided by the Policy Board at the Monetary Policy Meeting held on July 28 and 29, 2016. 2 Individual Policy Board members make their forecasts assuming that Dubai crude oil prices will rise moderately from the recent 45 U.S. dollars per barrel to around 50 dollars per barrel toward the end of the projection period; that is, fiscal 2018. Under this assumption, the contribution of energy items to the year-on-year rate of change in the CPI (all items less fresh food) is estimated to be approximately in the range of minus 0.6 to minus 0.7 percentage point for fiscal 2016. More specifically, the contribution is expected to start to lessen in the second half of fiscal 2016 and reach around 0 percentage point in early fiscal 2017. 3 The Bank has set the price stability target at 2 percent in terms of the year-on-year rate of change in the all-item CPI. Projections are made on the all-item CPI excluding fresh food, for which prices tend to be largely affected by unpredictable factors such as weather.
2
I. The Current Situation of Economic Activity and Prices in Japan
Japan's economy has continued its moderate recovery trend, although exports and
production have been sluggish due mainly to the effects of the slowdown in emerging
economies. Overseas economies have continued to grow at a moderate pace, but the pace of
growth has somewhat decelerated mainly in emerging economies. In this situation, exports
have been more or less flat. On the domestic demand side, business fixed investment has
been on a moderate increasing trend as corporate profits have been at high levels. Against
the background of steady improvement in the employment and income situation, private
consumption has been resilient, although relatively weak developments have been seen in
some indicators. Housing investment has resumed its pick-up, and the decline in public
investment has leveled off. Reflecting these developments in demand both at home and
abroad and the effects of the Kumamoto Earthquake, industrial production has continued to
be more or less flat. Business sentiment has generally stayed at a favorable level, although it
has been diminishing. Financial conditions are highly accommodative. On the price front,
the year-on-year rate of change in the CPI (all items less fresh food, and the same hereafter)
has been slightly negative. Although inflation expectations appear to be rising on the whole
from a somewhat longer-term perspective, they have recently weakened.
II. Baseline Scenario of the Outlook for Economic Activity and Prices in Japan
A. Outlook for Economic Activity
Looking ahead, sluggishness is expected to remain in exports and production for some time,
and the pace of economic recovery is likely to remain slow. Thereafter, domestic demand is
likely to follow an uptrend, with a virtuous cycle from income to spending being maintained
in both the household and corporate sectors, and exports are expected to head toward a
moderate increase as overseas economies move out of their deceleration phase. Thus,
3
Japan's economy is likely to be on a moderate expanding trend. Reflecting this outlook, the
growth rate during the projection period is expected to be above its potential.4
The above projection assumes the following underlying developments.
First, as the Bank continues with "QQE with a Negative Interest Rate," aiming to achieve
the price stability target of 2 percent, as long as it is necessary for maintaining that target in
a stable manner, financial conditions are likely to remain highly accommodative, with real
interest rates being negative throughout the projection period, and continue stimulating the
economy.5
Second, overseas economies are projected to remain slightly subdued for some time, and
there is high uncertainty, mainly associated with the United Kingdom's vote to leave the
European Union (EU). However, they are expected to moderately increase their growth
rates going forward, as it is likely that advanced economies will continue to see steady
growth and emerging economies will move out of their deceleration phase on the back of
the developments in advanced economies and emerging economies' policy effects.
Third, the decline in public investment has leveled off recently and it is likely that public
investment will start increasing, mainly due to the earlier implementation of the budget for
fiscal 2016 and the positive effects resulting from a set of economic measures that are
planned to be decided by the government before long. From the middle of the projection
period, it is likely to remain at a relatively high level, partly because investment related to
hosting the Olympic Games will become large.
4 Japan's potential growth rate is estimated to be in the range of 0.0-0.5 percent recently under a specific methodology, and is expected to rise gradually toward the end of the projection period. However, the estimate of the potential growth rate varies depending on the methodologies employed and could be revised as the sample period becomes longer over time. Thus, it should be regarded as being subject to a considerable margin of error. 5 Individual Policy Board members make their forecasts taking into account the effects of past policy decisions and with reference to views incorporated in financial markets regarding future policy. Specifically, each Policy Board member makes an assumption about the future path of short- and long-term interest rates based on their market rates, with the difference in the outlook for prices between that presented in the Outlook for Economic Activity and Prices (Outlook Report) and that of market participants in mind.
4
Fourth, firms' and households' medium- to long-term growth expectations are expected to
rise moderately against the backdrop of progress in implementation of the government's
growth strategy, including regulatory and institutional reforms, an increase in labor
participation by women and the elderly under such strategy, firms' continued efforts toward
improving productivity and discovering potential domestic and external demand, and steady
progress in overcoming of deflation.
Given these assumptions, economic activity during the projection period can be elaborated
on as follows. In fiscal 2016, exports are likely to continue exhibiting sluggishness for some
time but head toward a moderate increase thereafter as overseas economies move out of
their deceleration phase. Corporate profits are projected to decline compared to the previous
fiscal year but are expected to remain at high levels, especially in the nonmanufacturing
sector. In this situation, business fixed investment is projected to continue its uptrend,
additionally pushed up by a further decline in real interest rates with the Bank's monetary
easing. Some weakness has been seen recently in private consumption, partly due to the
negative wealth effects brought about by a decline in stock prices; however, it is projected
to rise moderately as the employment and income situation continues to improve steadily.
Meanwhile, public investment is expected to start increasing moderately, mainly due to the
earlier implementation of the budget for fiscal 2016 and the positive effects resulting from
the set of economic measures that are planned to be decided by the government before long.
Reflecting these factors with regard to demand at home and abroad, the economic growth
rate is expected to be above its potential.
From fiscal 2017 through fiscal 2018, exports are projected to continue increasing
moderately owing to a rise in growth rates in overseas economies. On the domestic demand
side, business fixed investment is likely to maintain its moderate increasing trend, supported
by accommodative financial conditions, heightened growth expectations, and increases in
Olympic Games-related demand. Private consumption is also expected to continue
increasing moderately on the back of an improvement in employee income. Meanwhile,
public investment is projected to increase through fiscal 2017, mainly reflecting the set of
economic measures that are planned to be decided by the government before long, and
thereafter remain at a high level with Olympic Games-related demand, although the effects
5
resulting from the economic measures will diminish. In this situation, the economic growth
rate is expected to be above its potential.
Through the projection period, Japan's potential growth rate is expected to follow a
moderate increasing trend, pushing up the economy's growth pace in the medium to long
term.
Comparing the current projections with the previous ones, the projected growth rates are
higher, particularly for the first half of the projection period, due in part to the effects of
economic stimulus measures from the fiscal side. The front-loaded increase and subsequent
decline in demand prior to and after the consumption tax hike that was planned to take place
in April 2017 are likely to be smoothed out by the postponement of the hike.6
B. Outlook for Prices
The outlook for prices is as follows. The year-on-year rate of change in the CPI is likely to
be slightly negative or about 0 percent for the time being, due to the effects of the decline in
energy prices, and, as the underlying trend in inflation steadily rises, accelerate toward 2
percent. Meanwhile, assuming that crude oil prices will rise moderately from the recent
level, it is likely that the contribution of energy items to the year-on-year rate of change in
the CPI will decrease from the current level of slightly more than minus 1 percentage point,
but remain negative until the end of fiscal 2016. Based on this assumption, the baseline
scenario is that the timing of the year-on-year rate of change in the CPI reaching around 2
percent -- the price stability target -- will be during fiscal 2017, although this is
accompanied by considerable uncertainties including those surrounding overseas economies
going forward. Thereafter, the year-on-year rate of change in the CPI is likely to be around
2 percent on average.
Comparing the current projections with the previous ones, the projected rate of increase in
the CPI for fiscal 2016 is lower, mainly reflecting the appreciation of the yen and the delay
6 In the Basic Policy on Economic and Fiscal Management and Reform 2016 decided by the Cabinet on June 2, the government presented its plan to postpone the consumption tax hike that had been planned to take place in April 2017 by two and a half years, to October 2019. Projections presented in this Outlook Report factor in this government policy.
6
in the timing of improvement in the medium- to long-term inflation expectations, albeit
with the higher growth projections; however, the projected rates of increase for fiscal 2017
and 2018 are more or less unchanged.
In formulating these projections, major factors that determine inflation rates are evaluated
as follows. First, the aggregate supply and demand balance (the output gap), which shows
the utilization of labor and capital, is more or less unchanged, as the tightening of labor
market conditions has continued while an improvement in manufacturers' capacity
utilization rates has been delayed against the background of the slowdown in emerging
economies.7 Going forward, due in part to the effects resulting from the set of economic
measures, the tightening of labor market conditions is likely to continue, accompanied by a
decline in the unemployment rate, and upward pressure on wages such as part-time
employees' hourly cash earnings is projected to heighten. Capacity utilization rates also are
expected to increase again as exports and production are likely to pick up. Against this
backdrop, the output gap is expected to move into positive territory through the end of fiscal
2016. Thus, upward pressure on wages and prices due to the tightening of supply-demand
conditions is likely to steadily increase.
Second, medium- to long-term inflation expectations have weakened recently, although they
appear to be rising on the whole from a somewhat longer-term perspective. Market
indicators and survey results regarding inflation expectations in particular have declined. As
the background to this, the decline in inflation expectations seems to have been brought
about by the observed CPI having been at about 0 percent on a year-on-year basis for over a
year; this could be understood as an "adaptive formation mechanism" of inflation
expectations. Meanwhile, against the backdrop of relatively weak developments in private
consumption observed recently, firms seem to be putting off price increases -- mainly those
of goods such as food products and durable consumer goods -- since the turn of the fiscal
year. 7 There are two approaches to estimating the output gap: (1) estimating potential GDP and then measuring its difference from actual GDP and (2) directly measuring the utilization of production factors (labor and capital). As the output gap in the Outlook Report has been estimated based on the latter approach, changes in the GDP growth rate do not have a one-to-one relationship with the expansion/narrowing of the output gap. It should be noted that estimates of the output gap could differ depending on the specific methodology employed and data used, and therefore they are subject to a considerable margin of error.
7
As for the outlook, based on the aforementioned projections, firms' price-setting stance is
expected to revert to raising prices accompanied by a pick-up in private consumption.
Turning to their wage-setting stance, the results of the labor-management wage negotiations
this spring show that wages increased at a smaller rate than last year, but base pay rose for
the third consecutive year and wage increases have been spreading to small firms. In
addition, wages of non-regular employees, which tend to be highly responsive to labor
market conditions, have been rising clearly. These developments indicate that the high
corporate profits have continued to positively affect employee income, and the mechanism
in which inflation rises moderately accompanied by wage increases has continued to
operate. Looking ahead, the observed inflation rate is expected to rise, mainly due to the
dissipation of the downward pressure of energy prices. In sum, as the Bank pursues "QQE
with a Negative Interest Rate" with the aim of achieving the price stability target of 2
percent, medium- to long-term inflation expectations are likely to return to an increasing
trend and gradually converge to around 2 percent.
Third, through import prices, the past decline in international commodity prices including
crude oil prices will exert downward pressure on consumer prices for the time being, but the
effects of such pressure are expected to wane. Meanwhile, the impact of foreign exchange
rates on consumer prices through import prices is likely to restrain upward pressure on
prices, due in part to the recent appreciation of the yen.
III. Upside and Downside Risks
A. Risks to Economic Activity
The following are upside and downside risks to the Bank's baseline scenario regarding the
economy. First, there is uncertainty regarding developments in overseas economies. The
impact that uncertainties associated with the United Kingdom's vote to leave the EU would
have on the global financial markets and global economy warrant attention. Future
developments in emerging and commodity-exporting economies including China are also
highly uncertain. Moreover, the following are considered as risks: developments in the U.S.
economy and the influences of its monetary policy response to them on the global financial
markets; prospects regarding the European debt problem including the financial sector, and
the momentum of economic activity and prices in Europe; and geopolitical risks. These
8
developments in overseas economies and the global financial markets could directly affect
Japan's exports and imports; in addition, it is necessary to pay attention to the possibility
that these developments exert influence on firms' and households' sentiment and restrain
spending behavior, such as business fixed investment and consumption.
Second, firms' and households' medium- to long-term growth expectations may be either
raised or lowered depending on future developments in regulatory and institutional reforms,
innovation in the corporate sector, and the employment and income situation surrounding
the household sector. It is desirable that firms more effectively invest their ample cash flow
arising from their profits at high levels; for example, in physical and human capital.
Third, in the event that confidence in fiscal sustainability in the medium to long term
declines, the economy may deviate downward from the baseline scenario through
increasing concerns regarding the future and rises in long-term interest rates that are
unwarranted by economic fundamental conditions. On the other hand, there is also a
possibility that the economy will deviate upward from the baseline scenario if confidence in
the path toward fiscal consolidation strengthens and people's concerns regarding the future
are alleviated.
B. Risks to Prices
In case the aforementioned upside and downside risks to the economy materialize, it is
likely that prices will also be affected to a certain degree. Other factors that could exert
upside and downside risks to prices are as follows. The first factor is developments in firms'
and households' medium- to long-term inflation expectations. The baseline scenario
assumes that, as the pick-up in private consumption becomes evident, firms' price-setting
stance is expected to revert to raising prices, and with a continued rise in wages
accompanied by an improvement in labor market conditions, medium- to long-term
inflation expectations will gradually converge to around 2 percent -- the price stability
target. However, the following two points are subject to uncertainties: (1) the extent to
which the acceleration in the expected inflation rates is contained through the "adaptive
formation mechanism" of inflation expectations in a case where the rate of increase in the
all-item CPI will be low for the time being due to the effects of the past decline in energy
9
prices, and (2) the impact of uncertainties surrounding the economic outlook, mainly for
overseas economies, on firms' price- and wage-setting stance.
The second factor is developments in the output gap, particularly in labor market conditions.
The baseline scenario assumes that the recent increase in labor participation by the elderly
and women and recent movements by firms to convert part-time employees into regular
ones will underpin labor supply, but there are both upside and downside risks associated
with this assumption.
The third factor is the responsiveness of inflation to the output gap. There is a particular
concern about the continued dull responses of administered prices, some services prices,
and housing rent, which might continue to constrain the acceleration of CPI inflation.
Fourth, developments in import prices, reflecting fluctuations in international commodity
prices such as crude oil prices and foreign exchange rates, as well as the extent to which
such developments will spread to domestic prices, may lead prices to deviate either upward
or downward from the baseline scenario.
IV. Conduct of Monetary Policy
In the context of the price stability target, the Bank assesses the aforementioned economic
and price situation from two perspectives and then outlines its thinking on the future
conduct of monetary policy.8
The first perspective concerns an examination of the baseline scenario for the outlook.
Japan's economy is judged as likely to achieve around 2 percent inflation during fiscal 2017
and thereafter gradually shift to a growth path that sustains such inflation in a stable
manner.
The second perspective involves an examination of the risks considered most relevant to the
conduct of monetary policy. With regard to the baseline scenario for economic activity, risks
are skewed to the downside, particularly those regarding developments in overseas
8 As for the examination from two perspectives in the context of the price stability target, see the Bank's statement released on January 22, 2013, entitled "The 'Price Stability Target' under the Framework for the Conduct of Monetary Policy."
10
economies. With regard to the baseline scenario for prices, risks are skewed to the downside
as there is considerable uncertainty over both the outlook for overseas economies and
developments in medium- to long-term inflation expectations in light of this outlook.
Examining financial imbalances from a longer-term perspective, there is no sign at this
point of excessively bullish expectations in asset markets or in the activities of financial
institutions. At the same time, a risk of a gradual pullback in financial intermediation
brought about by downward pressure on financial institutions' profits due to low interest
rates is judged as not significant, because financial institutions have sufficient capital bases
that will allow them to continue with healthy risk taking. However, in a situation where the
amount outstanding of government debt has shown a cumulative increase, due attention
needs to be paid to the fact that financial institutions' holdings of government bonds have
remained at an elevated level, although they have been on a declining trend on the whole.
As for the conduct of monetary policy, the Bank will continue with "QQE with a Negative
Interest Rate," aiming to achieve the price stability target of 2 percent, as long as it is
necessary for maintaining that target in a stable manner. It will examine risks to economic
activity and prices, and take additional easing measures in terms of three dimensions --
quantity, quality, and the interest rate -- if it is judged necessary for achieving the price
stability target.
11
(Appendix)
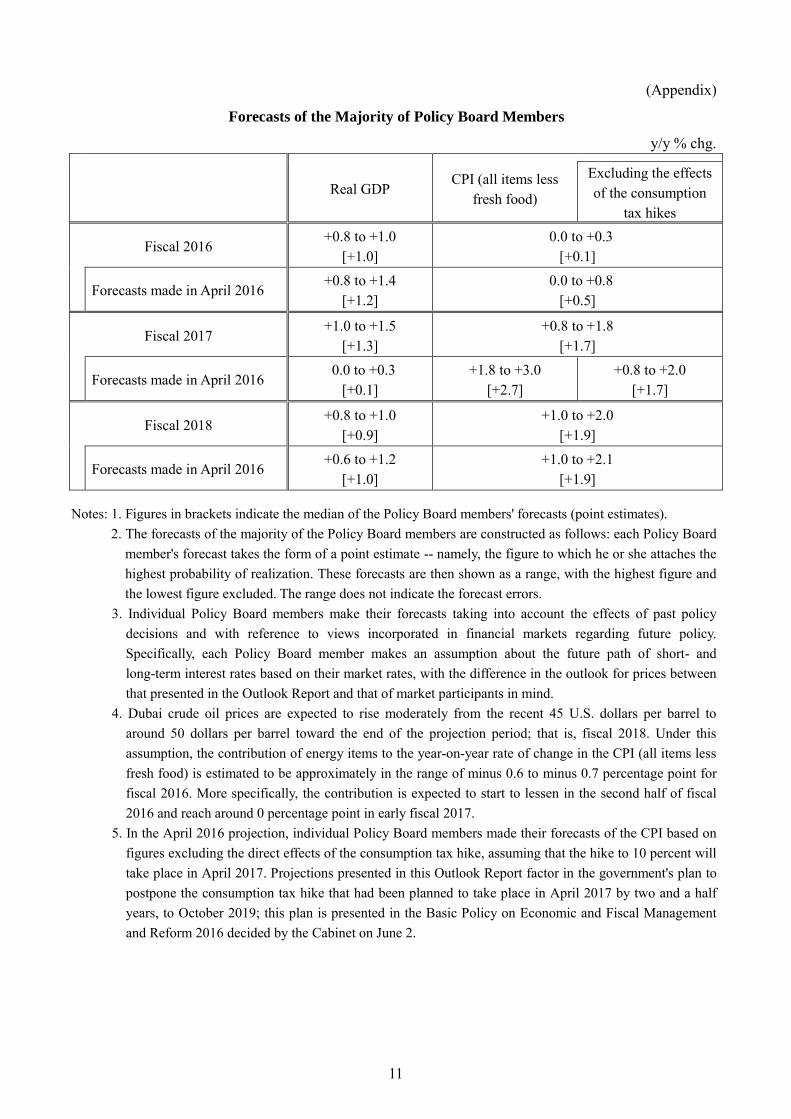
Forecasts of the Majority of Policy Board Members
y/y % chg.
Real GDP CPI (all items less
fresh food)
Excluding the effects of the consumption
tax hikes
Fiscal 2016 +0.8 to +1.0
[+1.0] 0.0 to +0.3
[+0.1]
Forecasts made in April 2016 +0.8 to +1.4
[+1.2] 0.0 to +0.8
[+0.5]
Fiscal 2017 +1.0 to +1.5
[+1.3] +0.8 to +1.8
[+1.7]
Forecasts made in April 2016 0.0 to +0.3
[+0.1] +1.8 to +3.0
[+2.7] +0.8 to +2.0
[+1.7]
Fiscal 2018 +0.8 to +1.0
[+0.9] +1.0 to +2.0
[+1.9]
Forecasts made in April 2016 +0.6 to +1.2
[+1.0] +1.0 to +2.1
[+1.9]
Notes: 1. Figures in brackets indicate the median of the Policy Board members' forecasts (point estimates). 2. The forecasts of the majority of the Policy Board members are constructed as follows: each Policy Board
member's forecast takes the form of a point estimate -- namely, the figure to which he or she attaches the highest probability of realization. These forecasts are then shown as a range, with the highest figure and the lowest figure excluded. The range does not indicate the forecast errors.
3. Individual Policy Board members make their forecasts taking into account the effects of past policy decisions and with reference to views incorporated in financial markets regarding future policy. Specifically, each Policy Board member makes an assumption about the future path of short- and long-term interest rates based on their market rates, with the difference in the outlook for prices between that presented in the Outlook Report and that of market participants in mind.
4. Dubai crude oil prices are expected to rise moderately from the recent 45 U.S. dollars per barrel to around 50 dollars per barrel toward the end of the projection period; that is, fiscal 2018. Under this assumption, the contribution of energy items to the year-on-year rate of change in the CPI (all items less fresh food) is estimated to be approximately in the range of minus 0.6 to minus 0.7 percentage point for fiscal 2016. More specifically, the contribution is expected to start to lessen in the second half of fiscal 2016 and reach around 0 percentage point in early fiscal 2017.
5. In the April 2016 projection, individual Policy Board members made their forecasts of the CPI based on figures excluding the direct effects of the consumption tax hike, assuming that the hike to 10 percent will take place in April 2017. Projections presented in this Outlook Report factor in the government's plan to postpone the consumption tax hike that had been planned to take place in April 2017 by two and a half years, to October 2019; this plan is presented in the Basic Policy on Economic and Fiscal Management and Reform 2016 decided by the Cabinet on June 2.
12
-1.5
-1.0
-0.5
0.0
0.5
1.0
1.5
2.0
2.5
3.0
-1.5
-1.0
-0.5
0.0
0.5
1.0
1.5
2.0
2.5
3.0
2010 2011 2012 2013 2014 2015 2016 2017 2018 2019
y/y % chg. y/y % chg.
FY
-1.0
-0.5
0.0
0.5
1.0
1.5
2.0
2.5
3.0
3.5
-1.0
-0.5
0.0
0.5
1.0
1.5
2.0
2.5
3.0
3.5
2010 2011 2012 2013 2014 2015 2016 2017 2018 2019
y/y % chg. y/y % chg.
FY
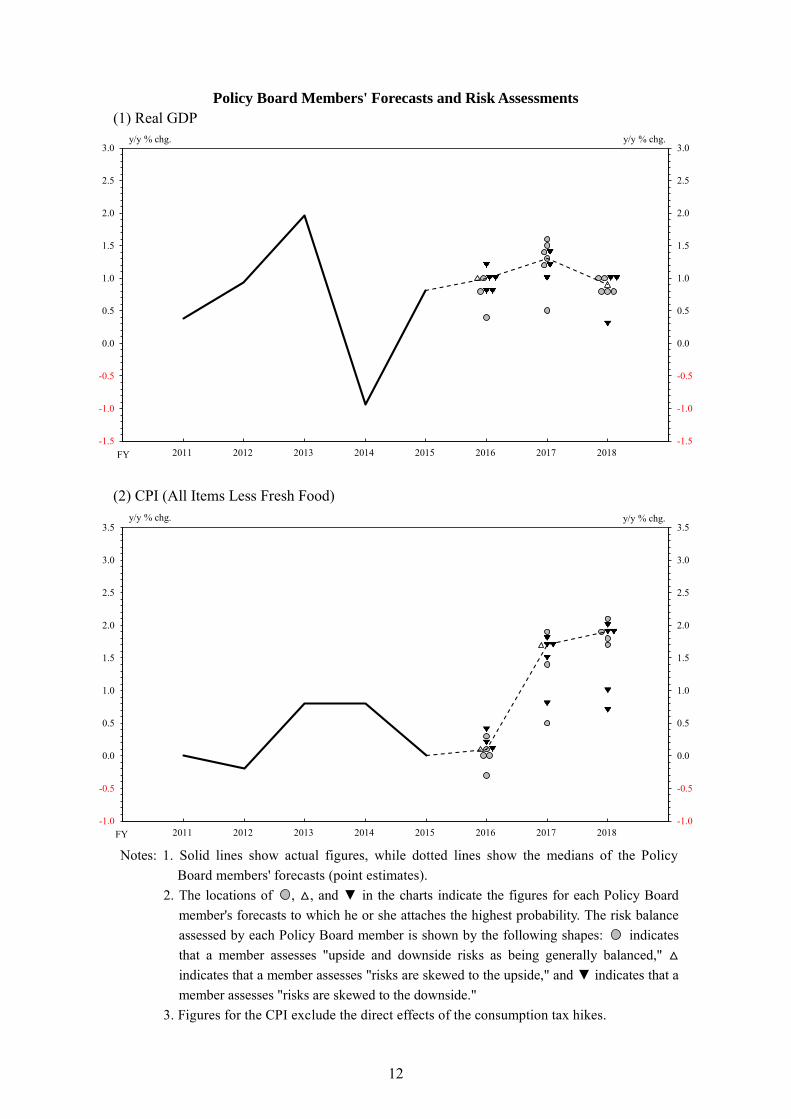
Policy Board Members' Forecasts and Risk Assessments
(1) Real GDP
(2) CPI (All Items Less Fresh Food) Notes: 1. Solid lines show actual figures, while dotted lines show the medians of the Policy
Board members' forecasts (point estimates). 2. The locations of , △, and ▼ in the charts indicate the figures for each Policy Board
member's forecasts to which he or she attaches the highest probability. The risk balance assessed by each Policy Board member is shown by the following shapes: indicates that a member assesses "upside and downside risks as being generally balanced," △ indicates that a member assesses "risks are skewed to the upside," and ▼ indicates that a member assesses "risks are skewed to the downside."
3. Figures for the CPI exclude the direct effects of the consumption tax hikes.
13
The Background9
I. The Current Situation of Economic Activity and Its Outlook
A. Economic Developments
Looking back at Japan's economy since the April 2016 Outlook Report, it continued its
moderate recovery trend, with a virtuous cycle from income to spending being maintained,
although exports and production in particular were sluggish, due mainly to the effects of the
slowdown in emerging economies and of the Kumamoto Earthquake. Real GDP decreased
in the October-December quarter of 2015 by an annualized rate of 1.8 percent but increased
in the January-March quarter by an annualized rate of 1.9 percent; real GDP growth has
been broadly about the same level as the growth potential when fluctuations are smoothed
out (Chart 1). Real GNI -- representing the aggregate effect of income formations -- has
been rising moderately (Chart 2 [1] and [2]). The output gap -- which captures the
utilization of labor and capital -- is more or less unchanged at around 0 percent. The labor
input gap has been on a moderate improving trend due to the tightening of labor market
conditions, while the capital input gap (i.e., the manufacturing sector's capacity utilization
gap) has been negative, reflecting the slowdown in emerging economies (Chart 3).
Projections for the economy are as follows. The recent appreciation trend of the yen and
uptrend in crude oil prices tend to weaken Japan's capacity to generate income by
negatively affecting net income from overseas and deterioration in the terms of trade.
Nevertheless, Japan's fiscal policy is likely to stimulate the economy far more greatly than
expected in the previous projections, reflecting the positive effects of the second
postponement of the consumption tax hike and the upcoming large-scale economic
measures; financial conditions are also expected to solidly support an increase in domestic
private demand, with highly accommodative conditions being maintained under "QQE with
a Negative Interest Rate."10 Considering the stimulative effects on the economy of these
expansionary fiscal and monetary easing measures, the virtuous cycle that has been
operating in the economy is expected to continue uninterrupted even under the current
9 "The Background" provides explanations of "The Bank's View" decided by the Policy Board of the Bank of Japan at the Monetary Policy Meeting held on July 28 and 29, 2016. 10 For the effects of the second postponement of the consumption tax hike on real GDP, see Box 1.
14
foreign exchange rates and crude oil prices, and is highly likely to continue growing at a
pace above its potential through the projection period.
Details of the outlook for each fiscal year are as follows. The economy is projected to
continue to see a slower recovery in fiscal 2016, negatively affected by the yen's
appreciation and a rise in crude oil prices amid the continued slowdown in overseas
economies. Exports and industrial production are expected to remain more or less flat
generally, albeit with some fluctuations resulting from the effects of the earthquake.
Corporate profits as a whole are likely to be at high levels, although profits in the
manufacturing sector are likely to decrease as they will be adversely affected by the
slowdown in overseas economies and the yen's appreciation. Against this backdrop,
business fixed investment is projected to maintain its moderate increasing trend, driven by
nonmanufacturers, but investment by manufacturers is likely to see a pause in its
momentum. The pick-up in private consumption is expected to become evident gradually,
supported by the increase in employee income and by the government's provision of
benefits to pensioners. Public investment is likely to start increasing moderately, mainly
owing to measures for restoration and rebuilding following the Kumamoto Earthquake, and
underpin the economy. Through the end of fiscal 2016, economic recovery is likely to
gradually become robust. This is based on the projection that (1) as the effects of the
slowdown in overseas economies and of the past appreciation of the yen wane, exports and
production will gradually return to an improving trend, and (2) domestic demand will gain
further momentum, partly backed by the upcoming large-scale economic measures.
Reflecting these developments, it is projected that the output gap will move into positive
territory through the end of fiscal 2016 after being more or less unchanged at around 0
percent.
In fiscal 2017, the economy is expected to continue expanding firmly -- driven by domestic
demand -- mainly owing to the effects resulting from the set of economic measures. Turning
to domestic demand, public investment is likely to continue rising on the back of a variety
of infrastructure enhancement and post-earthquake rebuilding projects, which are expected
to be included in the set of economic measures. Moreover, private consumption is likely to
increase moderately on the back of an improvement in disposable income, and business
15
fixed investment is projected to maintain its solid increasing trend underpinned by the
effects of various policy measures, including monetary easing. Meanwhile, exports are
likely to start increasing moderately, reflecting an improvement in overseas economies.
Reflecting these economic developments, in fiscal 2017, the GDP growth rate is projected
to clearly exceed the potential and the output gap is likely to widen further within positive
territory.
In fiscal 2018, the economy is likely to maintain a moderate expansion with domestic and
foreign demand increasing in a well-balanced manner. Looking at this in detail, the pace of
increase in exports is projected to moderately climb, and domestic private demand, on the
back of accommodative financial conditions and Olympic Games-related demand, is also
expected to continue a steady increase. Meanwhile, public investment is likely to decline
from the previous fiscal year because the positive effects resulting from the set of economic
measures will diminish, but is projected to maintain its high level underpinned by Olympic
Games-related demand. On this basis, the GDP growth rate for fiscal 2018 is projected to
continue exceeding the potential, although weaken compared to the previous fiscal year, and
the output gap is likely to continue improving.
B. Developments in Major Expenditure Items and Their Background
Government Spending
The decline in public investment has leveled off recently, due in part to projects for disaster
relief, disaster prevention, and disaster reduction planned in the supplementary budget for
fiscal 2015, as well as to the earlier implementation of the budget for fiscal 2016 (Chart 4).
Going forward, it is likely to rise moderately through the middle of the projection period,
underpinned by (1) the disaster relief construction after the Kumamoto Earthquake under
the supplementary budget for fiscal 2016 approved around mid-May and (2) the upcoming
large-scale economic measures. Thereafter, it is expected to start declining, reflecting the
diminishing of the positive effects of the aforementioned economic measures, but remain at
a high level due to a gradual increase in investment related to hosting the Olympic Games.
16
Overseas Economies
Overseas economies have continued to grow at a moderate pace, but the pace of growth has
decelerated somewhat, mainly in emerging economies (Chart 5). The Purchasing Managers'
Index (PMI) and world trade volume indicate that manufacturers' economic activity has
been relatively weak recently, especially in emerging and commodity-exporting economies
(Charts 6 and 10 [1]). Looking at developments by major region, the U.S. economy has
continued to be on a recovery trend on the back of firmness in household spending,
although the industrial sector still lacks momentum. The European economy also has
continued to recover moderately, supported by an increase in private consumption. The
Chinese economy has remained slightly subdued, particularly in the manufacturing sector,
which faces an overhang of production capacities. Other emerging economies and
commodity-exporting economies as a whole also have remained subdued due to the spread
of the effects of the slowdown in the Chinese economy and to sluggishness in IT-related
demand, although the effects of economic stimulus measures have materialized in some
economies.
In terms of the outlook, overseas economies are projected to remain slightly subdued for
some time, and there is high uncertainty, mainly associated with the United Kingdom's vote
to leave the EU. However, they are expected to moderately increase their growth rates, as it
is likely that advanced economies will continue to see steady growth and emerging
economies will move out of their deceleration phase on the back of the developments in
advanced economies and emerging economies' policy effects. Compared to the time when
the April 2016 Outlook Report was published, global growth projections by the
International Monetary Fund (IMF) have been revised slightly downward, particularly for
Europe, reflecting the effects of the United Kingdom's vote to leave the EU (Chart 5).
By major region, the U.S. economy is expected to continue its firm growth driven by
domestic private demand, reflecting accommodative financial conditions, although the
industrial sector is likely to lack momentum for the time being. The European economy is
projected to see a temporary slowdown in its pace of improvement as firms' and households'
sentiment is becoming cautious due to uncertainty, mainly associated with the United
Kingdom's vote to leave the EU; thereafter, it is likely to return to a moderate recovery path.
17
The Chinese economy is likely to broadly follow a stable growth path as authorities
proactively carry out both fiscal and financial measures to support economic activity,
although sluggishness in the growth pace is expected to remain in the manufacturing sector.
Other emerging economies and commodity-exporting economies are expected to remain
subdued for some time, but then the growth rates are likely to increase gradually, due
mainly to the effects of the economic stimulus measures and the spread of the effects of
steady growth in advanced economies.
Exports and Imports
Exports, mainly automobile-related exports, to advanced economies have continued
increasing steadily when temporary fluctuations are smoothed out, whereas those to
emerging economies have been sluggish, especially of capital goods and parts, IT-related
goods, and material -- such as iron and steel; therefore, exports as a whole have continued
to be more or less flat (Charts 7, 8, and 9).
Exports are projected to generally remain more or less flat in fiscal 2016, due partly to the
effects of the slowdown in overseas economies and of the recent appreciation of the yen,
with some fluctuations resulting from the effects of the earthquake. From the middle of the
projection period, as the effects of the slowdown in overseas economies and the
appreciation of the yen are expected to gradually wane, the world trade volume and Japan's
share of exports are both likely to head toward improvement.11 Thus, Japan's exports are
projected to moderately increase again (Chart 10).
Looking at the world trade volume and Japan's share of exports in world trade in more
detail, the former has tended to grow at a slower pace than world economic growth since
2011, and thus its ratio to world GDP has followed a declining trend. It is likely that the
world trade volume to GDP ratio will follow a downtrend for some time as firms' restrained
stance toward fixed investment expenditure is expected to continue globally against the
backdrop of the decline in growth expectations of emerging economies and uncertainties
associated with the United Kingdom's vote to leave the EU. Nevertheless, through the end
11 The world trade volume is calculated by adding up real imports in each country.
18
of the projection period, as adjustments of capital stock overhang in emerging economies
progress and as uncertainties associated with the United Kingdom gradually recede, the
world trade ratio is likely to gradually stop declining. Japan's share of exports in world trade
is likely to remain more or less flat at a low level for some time, given the relative decline
in Japan's competitiveness due to the appreciation of the yen. From the middle of the
projection period, its share is projected to modestly rise on the back of (1) the full-fledged
production of automakers at production sites that have shifted back to Japan, (2) the
diminishing downward pressure resulting from the yen's appreciation, and (3) the pick-up in
exports of capital goods, in which Japan has a comparative advantage.
Meanwhile, the travel receipts, which are categorized as exports of services in the Balance
of Payments, are seeing a pause in their improving trend because of a slowdown in the
momentum of an increase in the number of foreign visitors and because of some contraction
in the consumption per foreign visitor (Chart 11 [1] and [2]). These developments are due to
the effects of the Kumamoto Earthquake, the appreciation of the yen, and China's increase
in tariffs. These receipts are likely to see a slowdown in their pace of improvement, but are
projected to follow a moderate improving trend -- supported by governmental measures to
attract foreign tourists to Japan in view of the country hosting the 2020 Tokyo Olympics --
and continue underpinning exports.
Imports have been more or less flat recently (Chart 7 [1]). Going forward, they are expected
to increase moderately, mainly reflecting developments in domestic demand.
External Balance
The nominal current account surplus has continued its expanding trend since 2014.
Nevertheless, the pace of expansion is slowing, due mainly to the decline in the surplus of
the primary income balance that reflects the appreciation of the yen (Chart 11 [3]). The
nominal current account surplus is expected to see a decline at some point owing to the
effects of the yen's appreciation and the rise in crude oil prices, but will likely revert to a
moderate expansion from the middle of the projection period as the trade and income
19
balances are projected to head toward improvement, reflecting a recovery in overseas
economies.12
Industrial Production
Industrial production has continued to be more or less flat, against the background of the
slowdown in emerging economies and the effects of the earthquake (Charts 12 [1] and 13).
Transport equipment production has been on a pick-up trend with an increase in shipments
to the United States and Europe and a shift of production sites from overseas back to Japan,
despite being affected temporarily by the supply-chain disruptions due to a steel plant
accident and the Kumamoto Earthquake and by a fuel-efficiency data scandal (Chart 12 [2]).
In contrast, the production of machinery (i.e., "general-purpose, production and business
oriented machinery" in the Indices of Industrial Production) and electronic parts and
devices has been relatively weak recently, due mainly to the effects of the slowdown in
emerging economies and sluggishness in IT-related demand globally.
Industrial production is projected to remain more or less flat for some time due to continued
effects of the slowdown in overseas economies, but from the end of this fiscal year, it is
likely to head toward a moderate increase, reflecting an increase in final demand at home
and abroad.13
12 Regarding the outlook for the domestic saving-investment balance, which by definition equals the current account balance, excess saving in the private sector will temporarily decline marginally -- particularly in the corporate sector -- as a result of the decline in direct investment income, reflecting the yen's appreciation, and deterioration in the terms of trade resulting from the rise in crude oil prices; from the middle of the projection period, however, savings will be more or less unchanged with a relatively large excess. Meanwhile, despite the latest postponement of the consumption tax hike, the deficit in the general government is expected to decrease modestly, mainly due to the increase in the contribution toward the social security system from the private sector. Consequently, excess saving as a whole is expected to follow a modest rising trend after declining marginally. 13 Based on interviews with firms, industrial production for the July-September quarter of 2016 is projected to increase firmly on a quarter-on-quarter basis, mainly due to an acceleration of transport equipment production to offset the impact of the earthquake and to its stimulative effects on related sectors.
20
Corporate Profits
Corporate profits have been at high levels. According to the Financial Statements Statistics
of Corporations by Industry, Quarterly, the ratio of current profits to sales, particularly of
large firms, is declining at present due to the contraction in direct investment income
resulting from the yen's appreciation, as well as to temporary factors that exert downward
pressure on profits, whereas the ratio of operating profits to sales has remained at a high
level on the whole against the backdrop of an improvement in the terms of trade resulting
from the past low crude oil prices (Chart 14).14 Business sentiment has generally stayed at a
favorable level on the back of corporate profits remaining at high levels, but it has been
diminishing owing to the Kumamoto Earthquake, relatively weak developments seen in
some indicators of private consumption, and the effects of the yen's appreciation (Chart 15).
Although corporate profits as a whole are expected to remain at a high level, they are likely
to see a pause in their improving trend in fiscal 2016. The projection behind this is as
follows: corporate profits, especially in the manufacturing sector, are likely to be adversely
affected by the slowdown in overseas economies and the yen's appreciation; in addition,
corporate profits, including those in the nonmanufacturing sector, are expected to be pushed
down by the deterioration in the terms of trade resulting from the increase in crude oil
prices. Thereafter, corporate profits are projected to follow a steady improving trend again,
reflecting an expansion of the economy owing to a rise in demand at home and abroad.
Business Fixed Investment
Business fixed investment has been on a moderate increasing trend as corporate profits have
been at high levels. While the aggregate supply of capital goods, a coincident indicator, is
more or less unchanged, albeit with temporary fluctuations, partly owing to an increase in
machinery investment with a long lead time from orders to shipment, the Financial
Statements Statistics of Corporations by Industry, Quarterly, another coincident indicator,
shows that business fixed investment in nominal terms has been trending moderately
14 The decrease in current profits at present is largely attributable to temporary factors, such as restructuring costs of some major manufacturers as well as losses from commodity-related business conducted by major trading companies; thus, this needs to be assessed with certain qualifications.
21
upward (Chart 16). 15 According to the June 2016 Short-Term Economic Survey of
Enterprises in Japan (Tankan), firmness is seen in business fixed investment plans for fiscal
2016 as a whole, including those of large manufacturers, whose profit projections have
deteriorated as the expected exchange rate has shifted toward appreciation of the yen
(Charts 17 and 18). For example, business investment (on the basis close to GDP definition;
business investment -- including software investment, but excluding land purchasing
expenses -- in all industries including the financial industry) increased by 4.3 percent in
fiscal 2015, and business fixed investment plans for fiscal 2016 saw a year-on-year rate of
increase of 4.8 percent -- which is in line with the average of plans for the past five years,
when a continued increase was seen in business fixed investment (Chart 18 [2]). Reflecting
firms' positive fixed investment stance, machinery orders and construction starts (in terms
of planned expenses for private and nondwelling construction), as leading indicators, have
continued a moderate increasing trend, albeit with some fluctuations (Chart 19).
Business fixed investment, mainly in manufacturing firms, is likely to be affected
temporarily toward the end of fiscal 2016 by the slowdown in overseas economies and the
yen's appreciation. However, throughout the projection period, it is projected to continue to
see a moderate uptrend on the back of (1) corporate profits at high levels, (2) extremely
stimulative financial conditions such as low interest rates and accommodative lending
attitudes, (3) the effects of various policy measures from the fiscal side, and (4) moderate
improvement in growth expectations. As mentioned earlier, the environment surrounding
corporate profits is likely to become severe in response to the yen's appreciation and the rise
in crude oil prices, but firms' fixed investment stance is expected to be less affected by the
changes in profits. This is based on the understanding that (1) firms tend to consider
fluctuations in profits attributable to changes in the environment for prices -- such as the
foreign exchange rate and crude oil prices -- as temporary, and thus the spending propensity
is not high for these temporary changes in profits, and (2) investment for maintenance and
replacement of equipment and investment in labor-saving machinery and equipment -- both
15 The aggregate supply of capital goods measures business fixed investment for which shipments are completed. The Financial Statements Statistics of Corporations by Industry, Quarterly records assets in a construction in progress (CIP) account as business fixed investment, regardless of the status of shipments.
22
of which have been increasing in recent years -- as well as investment in growth areas, all
tend to be undertaken independently from temporary developments in corporate profits.
From the viewpoint of the capital stock cycle, which is based on the assumption that the
investment will be undertaken in order to realize the level of capital stock necessary for
production activity under the specific rate of expected growth, it is deemed that capital
stock has been increasing moderately at a pace consistent with the expected growth rate,
which is about the same as the recent growth potential estimate in the range of 0.0-0.5
percent (Chart 20). The projected pace of accumulation is consistent with the expected
growth rate that somewhat exceeds growth potential and reflects the continued highly
accommodative financial conditions under "QQE with a Negative Interest Rate" and a
gradual increase in Olympic Games-related demand.
The Employment and Income Situation
Supply-demand conditions in the labor market have continued to improve steadily and
employee income has increased moderately. The pace of increase in the Labour Force
Survey-based number of employees has been accelerating recently (Chart 21 [1]). Against
this backdrop, the active job openings-to-applicants ratio has continued to see a steady rise,
and a perception of labor shortage suggested by the employment conditions diffusion index
(DI) in the June Tankan has generally heightened; both indicators are almost at the same
levels as around 1991-1992 (Chart 21 [2] and [3]). The unemployment rate continued on a
moderate improving trend, albeit with some fluctuations, and recently has been in the range
of 3.0-3.5 percent, which is around the structural unemployment rate (Chart 22 [1] and
[2]).16 Labor force participation rates -- especially those for women and the elderly -- have
remained on a moderate uptrend after bottoming out around 2012, despite the structural
downward pressure due to the aging population (Chart 22 [3]). As Japan's economy is likely 16 The structural unemployment rate can be defined in a variety of ways, but in Chart 22 (1), it is defined, based on the idea of the so-called Beveridge Curve, as one where the unemployment rate and the vacancy rate are equal to each other (i.e., when the aggregate supply and demand in the labor market -- excluding unemployment arising from the mismatch between job openings and job applicants -- is judged as being in equilibrium). Therefore, the structural unemployment rate defined here differs from the concept of Non-Accelerating Inflation Rate of Unemployment (NAIRU), and does not show a direct relationship with prices or wages.
23
to continue growing at a pace above its potential, the number of employees is likely to
continue increasing and the supply-demand conditions in the labor market are expected to
further tighten.
On the wage side, total cash earnings per employee have risen moderately, albeit with some
fluctuations (Chart 23 [1]). Looking at this in detail, the year-on-year rate of increase in
scheduled cash earnings as a whole has accelerated moderately, with those of full-time
employees having increased at a moderately faster pace, whereas the rise in the ratio of
part-time workers has continued to exert downward pressure (Chart 23 [2]). Hourly cash
earnings are also assessed as continuing a moderate improving trend, when fluctuations are
smoothed out (Chart 23 [3]). In particular, hourly cash earnings of part-time employees,
which are responsive to labor market conditions, have continued to show relatively high
growth at around 1.5-2.0 percent. Meanwhile, real wages -- likewise, cash earnings -- have
been rising moderately (Chart 25 [1]).
In the annual spring labor-management wage negotiations, which have large impacts on
full-time employees' cash earnings, base pay for fiscal 2016 was revised upward for the
third consecutive year, but to a marginally smaller extent than last year, mainly because of
the low all-item CPI.17,18 Looking ahead, a rise in base pay is expected to accelerate again
against the backdrop of a rise in inflation expectations, which partly reflects the leveling off
of energy prices; hourly cash earnings of part-time employees are also projected to increase
further in response to the marked tightening of labor market conditions and an increase in
minimum wages. Under this situation, the rate of increase in overall employees' hourly cash
earnings is projected to rise moderately at almost the same pace as trend labor productivity
growth in nominal terms (Chart 42 [2]).19
17 For characteristics of the relationship between wage negotiations and inflation expectations in comparing Japan with the United States and Europe, see Box 2. 18 Rengo's report shows that the raise in base pay for fiscal 2016 was 0.44 percent on an annual basis, which is a marginal decline from 0.69 percent in fiscal 2015. 19 The labor share is likely to be more or less flat, somewhat below the long-term average, through the projection period (Chart 24 [2]).

24
In light of the aforementioned employment and wage conditions, employee income has
increased moderately (Charts 24 [1] and 25 [2]). Going forward, through the projection
period, the rate of increase in employee income is expected to continue rising moderately at
around the same rate as nominal GDP growth.
Household Spending
Private consumption has generally maintained its resilience against the background of
steady improvement in the employment and income situation, although relatively weak
developments have been seen in some indicators due to the downward pressure of the
negative wealth effects brought about by the decline in stock prices.20
From the viewpoint of gauging consumption activity in a comprehensive manner, the
Consumption Activity Index (CAI, adjusting travel balance) -- which is calculated by
combining various sales and supply-side statistics -- declined temporarily toward the end of
2015 but is heading toward a pick-up, mainly in durable goods (automobile sales) and
non-durable goods (food and beverages) (Charts 26 and 27 [1]).21 Turning to individual
indicators, the aggregate supply of consumer goods -- that is, the supply-side statistics -- has
continued to be more or less unchanged, albeit with fluctuations (Chart 27 [2]). According
to various sales statistics, sales at department stores have shown somewhat weak
developments recently against the backdrop of (1) the wealthy being less motivated to
consume, reflecting the decline in stock prices, and (2) a sluggish increase in demand from
foreign visitors to Japan, reflecting the appreciation trend of the yen and China's increase in
tariffs (Chart 28). On the other hand, sales at supermarkets and convenience stores have
been resilient. With regard to durable goods sales, automobile sales have been more or less
unchanged when smoothing out fluctuations that stemmed from supply-chain disruptions
and a fuel-efficiency data scandal, while sales of household electrical appliances are judged
as being somewhat weak recently (Chart 29 [1]). Services consumption as a whole,
including dining-out and travel, has been resilient (Chart 29 [2]). Looking at confidence
20 For background factors to the prolonged weakness in private consumption since the consumption tax hike in April 2014, see Box 3. 21 For details, see the Bank's research paper "The Consumption Activity Index" released in May 2016.
25
indicators related to private consumption, the Consumer Confidence Index has continued to
be more or less flat, while the Economy Watchers Survey and the DIs for business
conditions of industries related to private consumption in the Tankan have been declining,
reflecting the effects of the Kumamoto Earthquake, sluggish increase in demand from
foreign visitors to Japan, and heightening uncertainty associated with the United Kingdom's
vote to leave the EU (Chart 30).
In the outlook, private consumption is expected to increase its resilience gradually,
supported by an improvement in real disposable income -- including benefits to pensioners
-- and the effects of various policy measures, with the negative wealth effects dissipating
gradually. In fiscal 2016 in particular, the pace of increase in private consumption is
expected to somewhat exceed that in real disposable income, and the propensity to consume
is likely to start picking up, because (1) automobile sales are likely to be pushed up by a
recovery in production following the restoration of supply chains, and (2) non-durable
goods (seasonal goods) that had declined due to the irregular weather in fiscal 2015 are
projected to increase (Chart 26 [2]). Thereafter, private consumption is expected to increase
at generally the same pace as real disposable income, and the propensity to consume is
likely to gradually become stable at around the average level of the past ten years.
Housing investment has resumed its pick-up, mainly in housing for rent, which meets the
increased demand for asset management and tax saving, on the back of accommodative
financial conditions (Chart 31). Against the backdrop of the continued steady improvement
in the employment and income situation, it is likely to continue picking up, also backed by a
decline in interest rates on housing loans.
II. The Current Situation of Prices and Their Outlook
Developments in Prices
The rate of decline in the producer price index (PPI, adjusted for the effects of seasonal
changes in electricity rates) has been on a downtrend relative to three months earlier,
reflecting developments in international commodity prices and foreign exchange rates
(Charts 32 and 33 [1]). Turning to the services producer price index (SPPI, excluding
26
international transportation), although the year-on-year rate of increase in prices for items
related to selling, general and administrative expenses has been accelerating, that in prices
for fixed investment-related items in particular has been decelerating, and the SPPI is
currently around 0.5 percent or lower (Chart 33 [2]).
The year-on-year rate of increase in the CPI (all items less fresh food and energy) has
decelerated somewhat recently, as firms' price-setting stance has become relatively cautious
against the background of relatively weak developments in some indicators of private
consumption (Charts 35 [1] and 38 [2]). As a result, the year-on-year rate of change in the
CPI (all items less fresh food) as a whole has been slightly negative as the negative
contribution of energy prices, for which the rate of decline had fallen further due to the past
decline in crude oil prices, exceeded to some extent the positive contribution of the CPI for
items other than energy (the CPI for all items less fresh food and energy) (Charts 32 [3] and
38 [1]). Looking at this in detail, many firms seem to be putting off price increases this year
for goods, mainly food products, durable goods, and others (goods related to daily
necessities) for which increases were seen last year, and the rate of increase in prices of
goods as a whole has been slowing (Chart 34 and Box Chart 5 [1]). On the other hand,
prices for several general services -- such as housework-related services -- have been raised,
reflecting wage increases due to the labor shortage, but the price rise is not enough to offset
the slowdown in the rate of increase in prices for goods. Meanwhile, administered prices
have seen a relatively large decline, mainly due to reductions in electricity and gas prices
through the Fuel Cost Adjustment System.
The recent developments in the indicators for capturing the underlying trend in the CPI are
as follows (Chart 35).22 The rate of increase in the trimmed mean has been slightly
decelerating recently.23 Looking at annual price changes across all items (less fresh food),
the share of price-increasing items minus the share of price-decreasing items has maintained
22 For more details on the core price indicators, see "Core Inflation and the Business Cycle," Bank of Japan Review Series (2015-E-6), and "Performance of Core Indicators of Japan's Consumer Price Index," Bank of Japan Review Series (2015-E-7). 23 The effects of large relative price fluctuations are eliminated by simply excluding items that belong to a certain percentage of the upper and lower tails of the price fluctuation distribution (10 percent of each tail in this report).
27
its historically high level, but is declining slightly at present. The mode has decelerated
slightly of late, and the weighted median is currently at around 0 percent (Chart 36).24
The year-on-year rate of change in the GDP deflator is currently around 1 percent, mainly
due to the decline in the import deflator arising from the past decline in crude oil prices
(Chart 37). In contrast, the year-on-year rate of change in the domestic demand deflator has
been slightly negative, due in part to the effects of the decline in energy prices.
The Environment surrounding Prices
In the outlook for prices, the main factors that determine inflation rates are assessed as
follows. First, the output gap has been more or less unchanged at around 0 percent recently
(Charts 3 [1] and 38 [2]). It is likely to remain so for some time, due mainly to sluggish
improvement in the manufacturing sector's capacity utilization gap, but thereafter it is
projected to start increasing through the end of fiscal 2016, at which time it is expected that
the effects of the slowdown in overseas economies will wane and that the effects resulting
from the set of economic measures will become evident. From fiscal 2017, the output gap is
projected to continue expanding steadily in positive territory owing to both the capital and
labor factors, as domestic and foreign demand increase.
Second, medium- to long-term inflation expectations have weakened recently, although they
appear to be rising on the whole from a somewhat longer-term perspective. Market
indicators and survey results regarding inflation expectations in particular have declined.
Meanwhile, against the backdrop of relatively weak developments in private consumption
observed recently, firms seem to be putting off price increases -- mainly those of goods such
as food products and durable consumer goods -- since the turn of the fiscal year. As for the
outlook, firms' price-setting stance is expected to revert to raising prices accompanied by a
pick-up in private consumption. Turning to their wage-setting stance, the high corporate
profits have continued to positively affect employee income, and the mechanism in which
inflation rises moderately accompanied by wage increases has continued to operate. 24 The mode is the inflation rate with the highest density in the distribution. The weighted median is the weighted average of the inflation rates of the items at around the 50 percentile point of the distribution.
28
Looking ahead, the observed inflation rate is expected to rise, mainly due to the dissipation
of the downward pressure of energy prices. In sum, as the Bank pursues "QQE with a
Negative Interest Rate" with the aim of achieving the price stability target of 2 percent,
medium- to long-term inflation expectations are likely to return to an increasing trend and
gradually converge to around 2 percent.
The third factor is developments in import prices (Chart 32). The Bank assumes that Dubai
crude oil prices will rise moderately from the recent 45 U.S. dollars per barrel to around 50
dollars per barrel toward the end of the projection period -- that is, fiscal 2018 -- and this is
generally in line with what the futures prices suggest. Under this assumption, the
contribution of energy items (petroleum products, electricity, and manufactured and piped
gas) to the year-on-year rate of change in the CPI (all items less fresh food) is expected to
be negative at around minus 1 percentage point in the first half of fiscal 2016, and then the
negative contribution is estimated to clearly lessen to the range of 0.0-0.5 percentage point
in the second half and reach around 0 percentage point in early fiscal 2017. As for the
effects of foreign exchange rates on consumer prices, the recent appreciation of the yen will
likely constrain the upward pressure on prices of items that are responsive to exchange rates,
such as food products, durable goods, and goods related to daily necessities, for a while
through the decline in input prices.
The Outlook for Prices
The outlook for prices is as follows. The momentum of the year-on-year rate of change in
the CPI (all items less fresh food and energy) is projected to remain subdued for some time,
mainly for goods, due to relatively weak developments in some indicators of private
consumption and the effects of the appreciation of the yen, but it is expected to remain at
around the current level. Thereafter, the year-on-year rate of change in the CPI is expected
to steadily accelerate to around 2 percent as (1) the output gap is likely to improve steadily,
accompanied by the pick-up in private consumption, and (2) in this situation, the rise in
inflation expectations is likely to become clearer against the backdrop that firms'
price-setting stance is expected to revert to raising prices and the effects of the past decline
in energy prices are likely to dissipate. The year-on-year rate of change in the CPI (all items
29
less fresh food) is likely to be slightly negative in the first half of fiscal 2016, as the
negative contribution of energy prices is projected to exceed the positive contribution of the
CPI for items other than energy (the CPI for all items less fresh food and energy).25
Subsequently, it is likely to increase firmly, and approach around 2 percent toward the end
of fiscal 2017, as the negative contributions of energy items are expected to decrease clearly
and the CPI inflation excluding fresh food and energy is projected to accelerate. Thereafter,
the rate of change is likely to be around 2 percent on average.
Such projections are made under the same baseline scenario as before that the inflation rate
will respond fairly clearly to the improvement in the output gap compared to the past and
the Phillips curve will gradually shift upward, reflecting a rise in medium- to long-term
inflation expectations (Chart 41). However, compared to the projection made in the April
Outlook Report, the projected rate of increase in the CPI for fiscal 2016 is lower, reflecting
the recent appreciation of the yen and a decline in inflation expectations suggested by
sluggishness in base pay rises.26
With regard to the relationship between prices and nominal wages, the CPI and hourly
nominal wages move almost in parallel in the long run and the relationship is stable (Chart
42 [1]). Specifically, there are interactive effects between rises in nominal wages and prices:
firms try to pass on cost increases due to nominal wage increases by raising sales prices and
households try to keep real income unchanged by demanding wage increases in line with
price increases. In the outlook, hourly cash earnings -- especially scheduled cash earnings --
are expected to rise moderately, reflecting the tightening of labor market conditions and the
rise in inflation expectations. The underlying rate of increase in the CPI is projected to
accelerate gradually in a consistent manner with such wage developments.
25 In August 2016, the base year for the CPI is scheduled to be changed from 2010 to 2015, and the annual CPI inflation for January 2016 onward will be retroactively revised. Given the recent developments in the Laspeyres chain index and the new weights released in July, no substantial change will likely be seen in the year-on-year rate of change in the CPI inflation (all items less fresh food) between the 2010 base and the 2015 base. 26 A rise in administered prices and housing rent, both of which have a certain weight in the CPI, has remained sluggish, and this could also constrain the acceleration of the CPI inflation. See Box 4 for further details.
30
III. Financial Developments in Japan
Financial Conditions
Financial conditions are highly accommodative.
With the Bank pursuing "QQE with a Negative Interest Rate," the monetary base has been
increasing at a high year-on-year growth rate of around 25 percent (Chart 43).
Firms' funding costs have been hovering at extremely low levels. Issuance rates for CP have
remained at an extremely low level (Chart 44 [1]).27 Issuing conditions for CP have been
favorable, and the DI in the June Tankan was at the highest level since 2008, which is when
it was introduced in the Tankan. Issuance rates for corporate bonds have remained at
extremely low levels (Chart 44 [2]). As for lending rates, the average interest rates on new
loans and discounts have declined and are around historical low levels (Chart 45 [1]). In
these circumstances, interest payments by firms have been at considerably low levels
compared with their profits (Chart 45 [2]).
With regard to the availability of funds for firms, financial institutions' lending attitudes --
as perceived by large as well as small firms -- have been highly accommodative (Chart 46
[1]). In the June Tankan, the DI for large firms was at a high level last seen in the second
half of the 1990s, and that for small firms was at a high level last seen at the end of the
1980s. Firms' financial positions have been favorable for both large and small firms (Chart
46 [2]). In the June Tankan, the DIs for both large and small firms reached high levels that
are almost the same as those seen around 1990.
Demand for funds related to mergers and acquisitions of firms, as well as for funds for
business fixed investment, has continued to increase moderately. In these circumstances, the
year-on-year rate of change in the amount outstanding of bank lending has been around 2
percent (Chart 47 [1]). Meanwhile, the year-on-year rate of change in the aggregate amount
outstanding of CP and corporate bonds has been positive (Chart 47 [3]). Although issuing 27 Regarding issuance rates for CP, the release of the statistics by the Japan Securities Depository Center has been suspended since late March 2016. According to news reports and anecdotal information, issuance rates for CP seem to be at an extremely low level on the whole.
31
conditions for CP have been favorable, the year-on-year rate of change in the amount
outstanding of CP has been at around 0 percent, partly due to a decrease in funding of
working capital by commodity-related firms. Amid a further decline in interest rates with
long maturities, the amount of issuance of super-long-term corporate bonds has been
increasing significantly.
The year-on-year rate of change in the money stock (M2) has been at around 3.5 percent, as
bank lending has increased (Chart 48 [1]). The ratio of M2 to nominal GDP has been on a
moderate increasing trend (Chart 48 [2]).
Developments in Financial Markets
In global financial markets, investor sentiment had been supported until early June against
the backdrop of expectations that the pace of the policy interest rate hike in the United
States would be moderate, and of the rise in crude oil prices. In response to the result of the
United Kingdom's referendum in late June, in which the majority voted to leave the EU,
uncertainty over the global economy going forward heightened and investors' risk aversion
rapidly strengthened. However, global financial markets have been regaining some
calmness.
With regard to financial market developments in major economies, after stock prices had
been more or less unchanged, albeit with fluctuations, they declined considerably in late
June in response to the result of the referendum in the United Kingdom (Chart 49 [1]).
Thereafter, with the markets regaining calmness gradually, U.S. stock prices have increased,
exceeding the peak seen in the middle of 2015, whereas European stock prices have shown
weaker developments than U.S. stock prices, partly due to uncertainty about future
developments following the United Kingdom's vote to leave the EU.
Yields on 10-year government bonds in the United States had been more or less unchanged
until around May. Since June, however, they have declined, temporarily to a level below the
bottom marked in the middle of 2012 (Chart 50 [1]). This is partly attributable to growing
expectations among market participants that the pace of the policy interest rate hike by the
32
Federal Reserve would be moderate in response to the significantly lower-than-expected
indicator for employment and to the result of the referendum in the United Kingdom. Yields
on 10-year government bonds in Germany have declined into negative territory for the first
time ever, against the background of the purchases of government bonds by the European
Central Bank (ECB) and of concern over the consequences for the European economy
stemming from the United Kingdom's vote to leave the EU.
The LIBOR-OIS spreads for the U.S. dollar and the euro have generally remained at low
levels (Chart 51 [3]). Meanwhile, Japanese banks do not face quantitative constraints on
foreign currency funding at this moment, although premiums for U.S. dollar funding
through the dollar/yen foreign exchange swap market have been at relatively high levels,
due to the tight supply-demand conditions, compared with those seen before last summer
(Chart 51 [2]).
Regarding financial market developments in Japan, short-term interest rates -- on both
overnight and term instruments -- have been at about 0 percent or in negative territory under
the Bank's "QQE with a Negative Interest Rate" (Chart 51 [1]). Yields on treasury discount
bills (T-Bills) have remained in negative territory. Meanwhile, credit spreads on interbank
transactions have remained stable as the balance sheets of Japanese financial institutions
have maintained their soundness (Chart 51 [3]).
Yields on 10-year Japanese government bonds (JGBs) have remained in negative territory
under the Bank's "QQE with a Negative Interest Rate," and declined further, partly in
response to the result of the referendum in the United Kingdom (Chart 50).
Stock prices had been more or less unchanged until early June, albeit with fluctuations
(Chart 49 [1]). They then declined significantly as the yen appreciated, but recovered after
mid-July as the market gradually regained calmness. With these fluctuations smoothed out,
they have been more or less unchanged. In the Japan real estate investment trust (J-REIT)
market, prices have declined slightly -- when fluctuations are smoothed out -- partly
supported by the decline in long-term interest rates, although they fell considerably at one
point (Chart 49 [2]).

33
In foreign exchange markets, the yen appreciated considerably against the U.S. dollar,
reflecting expectations that the pace of the policy interest rate hike in the United States
would be moderate and concerns over the consequences stemming from the United
Kingdom's vote to leave the EU; since mid-July, the yen has depreciated against the U.S.
dollar (Chart 52). The yen has appreciated against the euro.
34
(Box 1) Effects of the Second Postponement of the Consumption Tax Hike on Real GDP
The July 2016 Outlook Report factors in the Cabinet decision on June 2 to postpone the
consumption tax hike to 10 percent by two and a half years, to October 2019, which is
described in the Basic Policy on Economic and Fiscal Management and Reform 2016.
The effects of this second postponement of the consumption tax hike on real GDP growth
rate can be estimated as follows (Box Chart 1 [1]). Compared to the estimation made in the
previous Outlook Report, the real GDP growth rate for fiscal 2016 will decrease by 0.4
percentage point mainly in household expenditure, given that the front-loaded increase in
demand that was expected to arise prior to the consumption tax hike will no longer be seen.
That for fiscal 2017, on the other hand, will increase by 0.6 percentage point as a
subsequent decline in demand will not be observed and a decline in real income, which
would have been seen if the consumption tax hike were to be conducted, will not take place.
In fiscal 2018, the positive effects on the real GDP growth rate -- which were presumed to
be brought about by the dissipation of the subsequent decline in demand -- will not
materialize; rather, the front-loaded increase in demand prior to the consumption tax hike
scheduled to take place in October 2019 will likely be seen in part. Thus, it is projected that
the effects of the consumption tax hike on the real GDP growth rate for fiscal 2018 will be
unchanged from the previous projection. Estimations of both real GDP and the level of the
output gap for the middle of the projection period and onward are to be higher than those
made in the previous Outlook Report because, while a disappearance of the front-loaded
increase and subsequent decline in demand will only smooth out fluctuations of real GDP, a
disappearance of the negative effects on real income will raise the level of real GDP.
In the April Outlook Report, assuming the possibility that the front-loaded increase in
demand prior to the April 2014 consumption tax hike would have included demand in some
durable goods in expectation of the hike to 10 percent, it was estimated that the scale of the
front-loaded increase in demand prior to the hike to 10 percent will be somewhat smaller
than that implied by the degree of the increase in the tax rate -- i.e., the front-loaded
increase in demand prior to the hike to 10 percent is expected to be one half instead of two
35
thirds of that observed prior to the hike in April 2014 (Box Chart 1 [2]).28 However, it is
likely that stock adjustments of durable goods that had been accumulated due to the April
2014 consumption tax hike will progress to a certain extent by 2019, given that the
postponement of the hike means that there will be an interval of more than five years
between the hikes. Therefore, in this Outlook Report, it is estimated that the scale of the
front-loaded increase in demand prior to the October 2019 consumption tax hike will be
about two thirds of the one seen last time, in proportion to the change in tax rate.
28 See Box 1 in the April 2016 Outlook Report.
36
(Box 2) Wage Negotiations and Inflation Expectations
In comparison with the United States and Europe, wage negotiations in Japan are more
affected by past inflation, including the fluctuations of energy prices. This indicates that the
wage-setting process in Japan is characterized as more backward-looking than in the United
States and Europe.
In order to quantify this, a simple "hybrid-type wage-version of the Phillips curve" is
estimated by regressing nominal negotiated wages in Japan, the United States, and Germany
using the following three variables: medium- to long-term inflation expectations, the past
inflation rate, and the unemployment rate gap. 29 The estimation results reveal the
following: (1) in the Unites States and Germany, the coefficients on medium- to long-term
inflation expectations (α1 in Box Chart 2 [1]) are substantially large, while the coefficients
on the past inflation rate (1-α1) are low in statistical significance; on the other hand, (2) as
for the rise in base pay in Japan, the coefficients on medium- to long-term inflation
expectations and the past inflation rate are both statistically significant, and the impact of
the latter somewhat outweighs that of the former.
Since the end of 2014, the headline inflation rate has been lowered significantly in Japan,
the Unites States, and Germany, affected by the decline in crude oil prices (Box Chart 2 [2]).
The decline in the past inflation rate due to the decline in crude oil prices clearly has exerted
downward pressure on the base pay increase in Japan, while its impact on wages in the
United States and Germany is limited (Box Chart 2 [3]). This difference is partly due to the
fact that, as the negotiated wages are applicable for a longer time in the United States and
Germany than in Japan, medium-term inflation tends to be taken into account in the wage
negotiations in these countries (Box Chart 2 [4]). On such occasions, the inflation targets set
by respective central banks are an important reference. For instance, many labor unions in
Germany are known to attach more importance in their wage negotiations with firms to the
29 For the impact of medium- to long-term inflation expectations on firms' wage-setting behavior, see "Firms' Inflation Expectations and Wage-setting Behaviors," Bank of Japan Working Paper Series (2016-E-10).
37
quantitative definition of price stability by the ECB -- inflation rate of below, but close to, 2
percent -- than to the past inflation rate.30
30 See, for example, "The Phillips curve as an instrument for analyzing prices and forecasting inflation in Germany" in the April 2016 Monthly Report published by the Deutsche Bundesbank.
38
(Box 3) Frequency Spectrum Analysis of Private Consumption
Private consumption has been resilient on the whole, although relatively weak
developments have been seen for a prolonged time since the consumption tax hike in April
2014 (Box Chart 3 [1]). Various factors have been pointed out as attributable to such
weakness, including (a) stock adjustments in durable goods, (b) a decline in real disposable
income due to the consumption tax hike and the rise that happened mainly in food prices,
(c) a negative wealth effect due in part to a decline in stock prices, (d) bad weather, and (e)
anxiety over the social security system, including pensions.
In order to quantitatively gauge what factor is contributing to exerting downward pressure
on private consumption, and to what degree, private consumption is decomposed into some
cyclical components through a frequency spectrum analysis. Roughly speaking, a frequency
spectrum analysis involves replacing time series data with cyclical components that have
various frequencies (Box Chart 3 [2]). When it comes to (a) stock adjustments in durable
goods, in light of the average year of use of durable goods, the effects of stock adjustments
in digital appliances, etc. can be categorized as a medium-term cycle of 2-7 years, while
those in automobiles and white goods can be captured through a long-term cycle of 7-12
years (Box Chart 4 [1] and [2]). Meanwhile, as the effects of (d) bad weather are temporary,
these can be categorized as a short-term cycle of less than 2 years. A front-loaded increase
and subsequent decline in demand prior to and after the consumption tax hikes also can be
captured as a short-term cycle in the framework of this analysis. It is not so clear which
cycle can capture (b) the decline in real disposable income and (c) the negative wealth
effect; however, as employee compensation broadly follows the business cycle and asset
prices, such as stock prices, fluctuate in a volatile manner, (b) developments in real
disposable income can be captured through a medium-term cycle and (c) the wealth effect
due to stock prices through a short-term cycle (Box Chart 4 [3]). (e) Anxiety over the social
security system does not seem to be cyclical, and instead can be represented as a trend
component, calculated as a residual in this analysis.
In light of the frequencies of cycles classified by the above factors, recent developments in
private consumption expenditure in terms of quarterly change can be decomposed as the
39
following (Box Chart 4 [4]). (1) The short-term cycle showed substantial fluctuations in
2014 due to the front-loaded increase and subsequent decline in demand prior to and after
the consumption tax hike, followed by downward pressure in the October-December quarter
of 2015 and the January-March quarter of 2016 -- the bad weather in the October-December
quarter of 2015 and negative wealth effect in the January-March quarter of 2016 due to the
decline in stock prices since the turn of the year seem to have contributed to exerting this
downward pressure; (2) the medium-term cycle exerted adverse effects in 2014, reflecting
developments in real disposable income, but is generating positive effects recently; (3) the
long-term cycle has consistently been exerting adverse effects due to stock adjustments in
durable goods; and (4) the trend component has consistently been trending upward,
suggesting that anxiety over the social security system from a long-term perspective may
not be a factor that has been exerting significant downward pressure on private
consumption.
40
(Box 4) Developments in Administered Prices and Housing Rent in the CPI
Administered prices and housing rent, both of which have a substantial weight in the CPI,
have long been slow to increase and have not shown noticeable improvement since the
launch of QQE, amid the steady rise in prices of goods and general services (Box Chart 5
[1]).31 Among Japan, the United States, and Germany, Japan showed the smallest rise in
fiscal 2015 in terms of the year-on-year rate of change in the CPI for all items excluding
food and energy. This is due largely to the fact that the rises in administered prices and
housing rent in Japan are smaller than those in the United States and Germany: in fact, the
rises in prices of "others" are much larger than those in the United States (Chart Box 5 [2]).
One of the factors behind the sluggish rise in administered prices and housing rent in Japan
is somehow attributable to the difference in inflation expectations toward prices in general,
such that inflation expectations are not anchored at 2 percent in Japan. In addition, the
following factors that are unique to administered prices and housing rent in Japan can
account for the different moves in their prices.
One of the reasons why the rise in administered prices in Japan has been sluggish compared
to those in Europe and the United States is that government subsidies for supplementing
revenues are constantly injected to public enterprises and administered prices do not
sufficiently reflect operating expenses and depreciation costs of equipment (Box Chart 6
[1]).32 On the contrary, in Europe and the United States, governments directly intervene
only to a marginal extent in the process of setting administered prices; independent
regulatory commissions have authority over setting administered prices that is not based on
receiving subsidies while taking account of their cost structure (Box Chart 6 [2]). Assuming
that public enterprises will raise charges to eliminate their operating losses, with the aim to
achieve fiscal consolidation by fiscal 2020, it is roughly estimated that administered prices
should be raised at a pace more than 1.5 times higher than the actual price increase since
fiscal 2010, which is 0.9 percent annually (Box Chart 6 [3]).
31 Administered prices in fiscal 2014, however, temporarily rose at a higher rate, due in part to downsizing the various measures for discounting the highway toll. 32 For details, see "Administered Prices in Japan: Institutional Comparisons with Europe and the United States," Bank of Japan Review Series (2016-E-9).
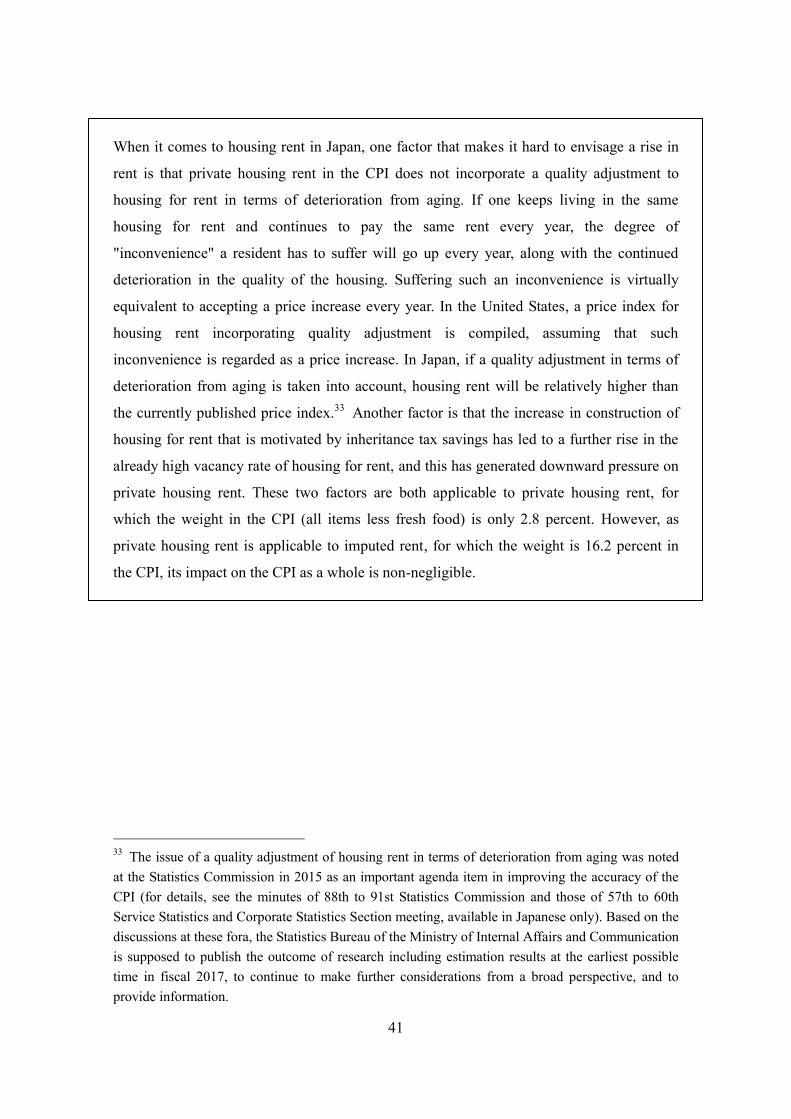
41
When it comes to housing rent in Japan, one factor that makes it hard to envisage a rise in
rent is that private housing rent in the CPI does not incorporate a quality adjustment to
housing for rent in terms of deterioration from aging. If one keeps living in the same
housing for rent and continues to pay the same rent every year, the degree of
"inconvenience" a resident has to suffer will go up every year, along with the continued
deterioration in the quality of the housing. Suffering such an inconvenience is virtually
equivalent to accepting a price increase every year. In the United States, a price index for
housing rent incorporating quality adjustment is compiled, assuming that such
inconvenience is regarded as a price increase. In Japan, if a quality adjustment in terms of
deterioration from aging is taken into account, housing rent will be relatively higher than
the currently published price index.33 Another factor is that the increase in construction of
housing for rent that is motivated by inheritance tax savings has led to a further rise in the
already high vacancy rate of housing for rent, and this has generated downward pressure on
private housing rent. These two factors are both applicable to private housing rent, for
which the weight in the CPI (all items less fresh food) is only 2.8 percent. However, as
private housing rent is applicable to imputed rent, for which the weight is 16.2 percent in
the CPI, its impact on the CPI as a whole is non-negligible.
33 The issue of a quality adjustment of housing rent in terms of deterioration from aging was noted at the Statistics Commission in 2015 as an important agenda item in improving the accuracy of the CPI (for details, see the minutes of 88th to 91st Statistics Commission and those of 57th to 60th Service Statistics and Corporate Statistics Section meeting, available in Japanese only). Based on the discussions at these fora, the Statistics Bureau of the Ministry of Internal Affairs and Communication is supposed to publish the outcome of research including estimation results at the earliest possible time in fiscal 2017, to continue to make further considerations from a broad perspective, and to provide information.
Charts
Chart 1 Real GDP
Chart 2 Aggregate Income Formation and Indexes of Business Conditions
Chart 3 Output Gap and Potential Growth Rate
Chart 4 Public Investment
Chart 5 Overseas Economies
Chart 6 Environment Surrounding Exports
Chart 7 Real Exports and Real Imports
Chart 8 Real Exports
Chart 9 Overseas Motor Vehicle Sales and Exports of Capital Goods
Chart 10 World Trade Volume and Japan's Share of Exports in World Trade
Chart 11 Services Balance and Current Account
Chart 12 Production, Shipments, and Inventories
Chart 13 Shipment-Inventory Balance
Chart 14 Corporate Profits, by Industry and Enterprise Size
Chart 15 Business Conditions
Chart 16 Coincident Indicators of Business Fixed Investment
Chart 17 Business Fixed Investment Plans, by Industry and Enterprise Size
Chart 18 Planned and Actual Business Fixed Investment
Chart 19 Leading Indicators of Business Fixed Investment
Chart 20 Expected Growth Rate and Capital Stock Cycles
Chart 21 Employment and Labor Market Conditions
Chart 22 Unemployment Rate and Labor Force Participation Rate
Chart 23 Nominal Wages
Chart 24 Employee Income
Chart 25 Real Wages and Real Employee Income
Chart 26 Private Consumption
Chart 27 Private Consumption by Type and Supply and Demand Side Statistics
Chart 28 Sales Statistics (Current Survey of Commerce)
Chart 29 Consumption of Durable Goods and Services
Chart 30 Confidence Indicators Related to Private Consumption
Chart 31 Housing Investment
Chart 32 Import Prices and International Commodity Prices
Chart 33 Producer Price Index and Services Producer Price Index
Chart 34 Consumer Price Index
Chart 35 Measures of Underlying Inflation
Chart 36 Distributions of Price Changes and Measures of Underlying Inflation
Chart 37 GDP Deflator
Chart 38 Consumer Price Index and Output Gap
Chart 39 Inflation Expectations (1)
Chart 40 Inflation Expectations (2)
Chart 41 Output Gap and Inflation Rate
Chart 42 Prices and Wages
Chart 43 Monetary Base and JGB Purchases
Chart 44 Issuance Conditions for CP and Corporate Bonds
Chart 45 Bank Lending Rates
Chart 46 Corporate Finance-Related Indicators
Chart 47 Amount Outstanding of Bank Lending, CP, and Corporate Bonds
Chart 48 Money Stock
Chart 49 Stock Prices and REIT Prices
Chart 50 Nominal Benchmark Yields
Chart 51 Money Market Rates
Chart 52 Exchange Rates Box Chart 1 Effects of the Delayed Consumption Tax
Hike on Real Economy
Box Chart 2 Negotiated Wages and Inflation Expectations
Box Chart 3 Frequency Spectrum Analysis of Private Consumption (1)
Box Chart 4 Frequency Spectrum Analysis of Private Consumption (2)
Box Chart 5 Developments in Administered Prices and Housing Rent
Box Chart 6 Administered Prices in Japan
Reference Economic Assessment by Region (Regional Economic Report)
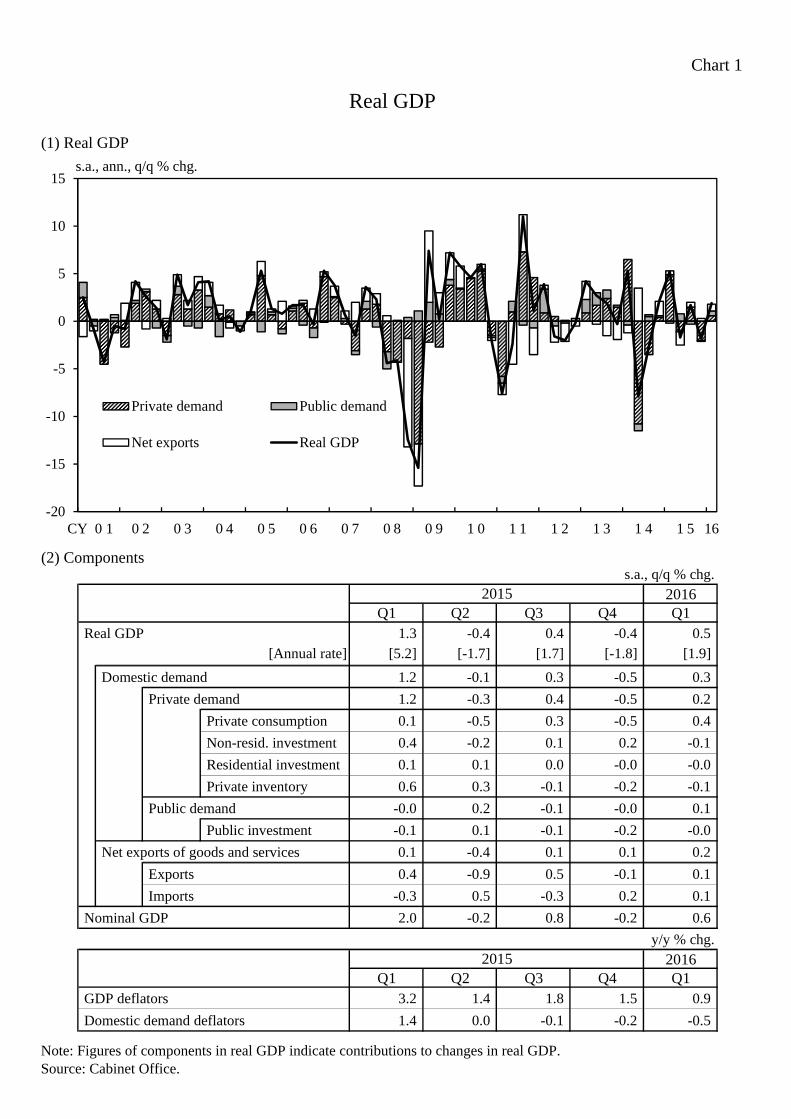
Chart 1
(1) Real GDP
(2) Components
Note: Figures of components in real GDP indicate contributions to changes in real GDP.Source: Cabinet Office.
Real GDP
-20
-15
-10
-5
0
5
10
15
CY 0 1 0 2 0 3 0 4 0 5 0 6 0 7 0 8 0 9 1 0 1 1 1 2 1 3 1 4 1 5 16
Private demand Public demand
Net exports Real GDP
s.a., ann., q/q % chg.
s.a., q/q % chg.
2016Q1 Q2 Q3 Q4 Q1
Real GDP 1.3 -0.4 0.4 -0.4 0.5
[Annual rate] [5.2] [-1.7] [1.7] [-1.8] [1.9]
Domestic demand 1.2 -0.1 0.3 -0.5 0.3
Private demand 1.2 -0.3 0.4 -0.5 0.2
Private consumption 0.1 -0.5 0.3 -0.5 0.4
Non-resid. investment 0.4 -0.2 0.1 0.2 -0.1
Residential investment 0.1 0.1 0.0 -0.0 -0.0
Private inventory 0.6 0.3 -0.1 -0.2 -0.1
Public demand -0.0 0.2 -0.1 -0.0 0.1
Public investment -0.1 0.1 -0.1 -0.2 -0.0
Net exports of goods and services 0.1 -0.4 0.1 0.1 0.2
Exports 0.4 -0.9 0.5 -0.1 0.1
Imports -0.3 0.5 -0.3 0.2 0.1
Nominal GDP 2.0 -0.2 0.8 -0.2 0.6
y/y % chg.
2016Q1 Q2 Q3 Q4 Q1
GDP deflators 3.2 1.4 1.8 1.5 0.9
Domestic demand deflators 1.4 0.0 -0.1 -0.2 -0.5
2015
2015
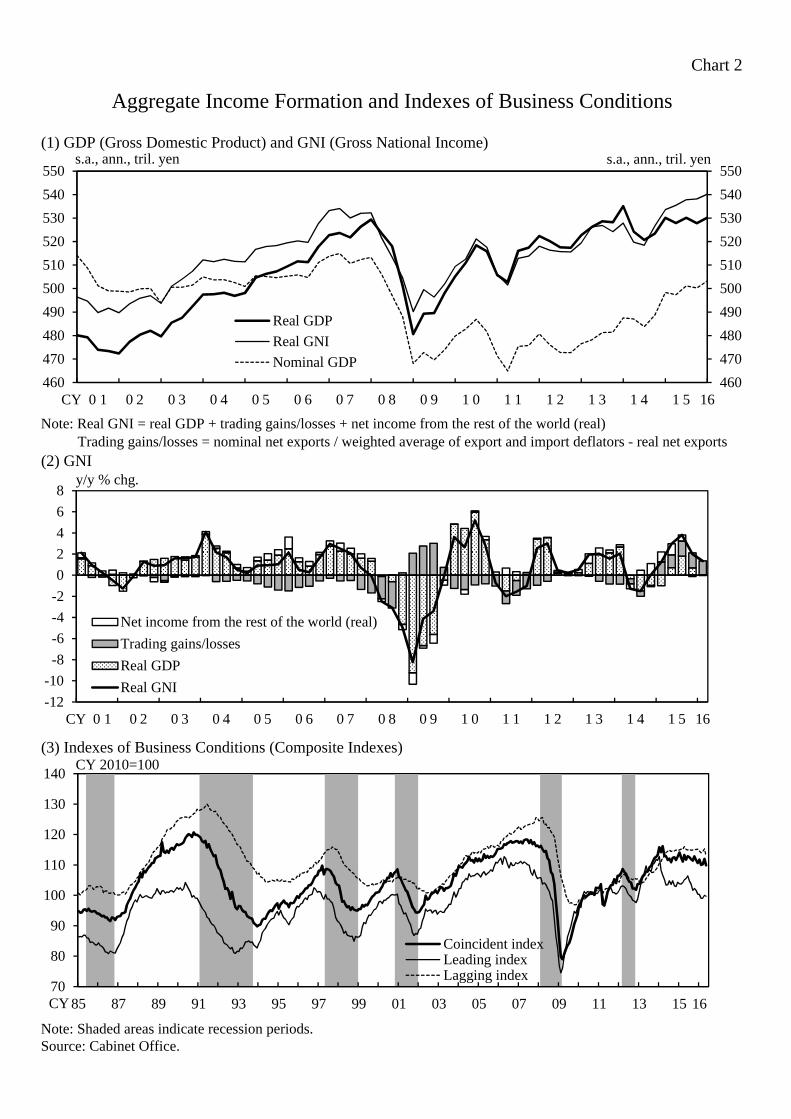
Chart 2
(1) GDP (Gross Domestic Product) and GNI (Gross National Income)
Note: Real GNI = real GDP + trading gains/losses + net income from the rest of the world (real) Trading gains/losses = nominal net exports / weighted average of export and import deflators - real net exports(2) GNI
(3) Indexes of Business Conditions (Composite Indexes)
Note: Shaded areas indicate recession periods.Source: Cabinet Office.
Aggregate Income Formation and Indexes of Business Conditions
460
470
480
490
500
510
520
530
540
550
460
470
480
490
500
510
520
530
540
550
CY 0 1 0 2 0 3 0 4 0 5 0 6 0 7 0 8 0 9 1 0 1 1 1 2 1 3 1 4 1 5 16
Real GDP
Real GNI
Nominal GDP
s.a., ann., tril. yen s.a., ann., tril. yen
-12
-10
-8
-6
-4
-2
0
2
4
6
8
CY 0 1 0 2 0 3 0 4 0 5 0 6 0 7 0 8 0 9 1 0 1 1 1 2 1 3 1 4 1 5 16
Net income from the rest of the world (real)
Trading gains/losses
Real GDP
Real GNI
y/y % chg.
70
80
90
100
110
120
130
140
85 87 89 91 93 95 97 99 01 03 05 07 09 11 13 15 16
Coincident indexLeading indexLagging index
CY
CY 2010=100
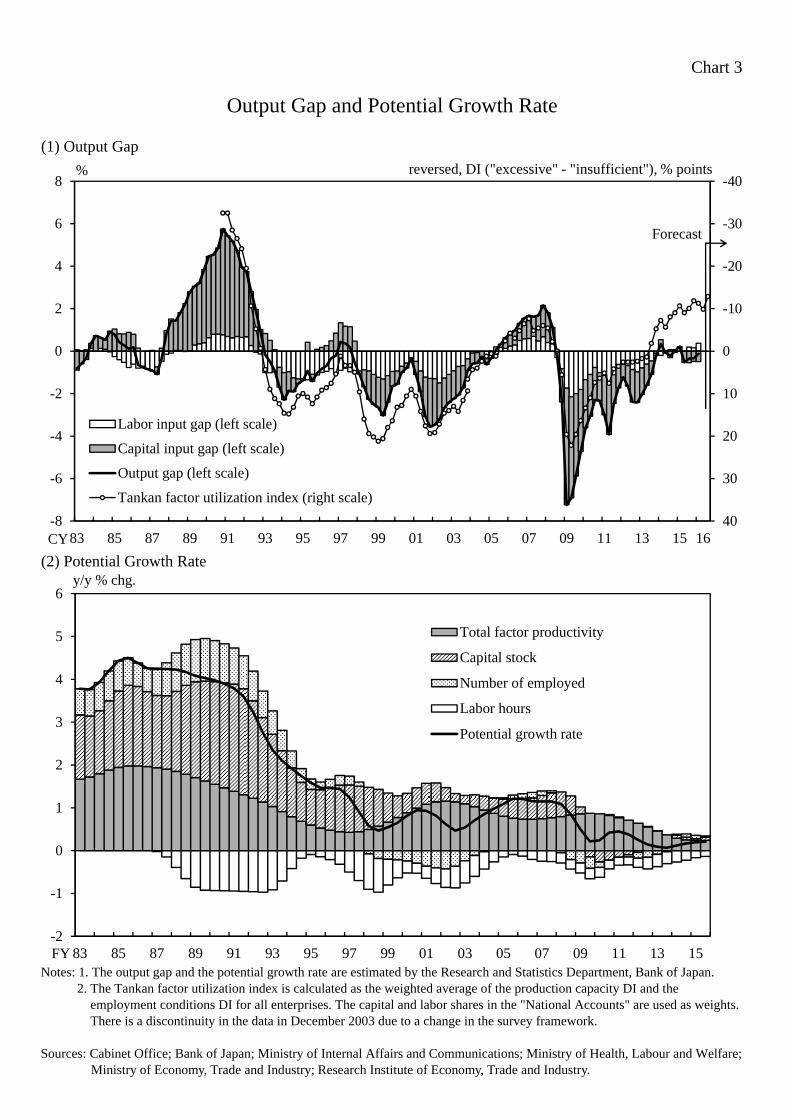
Chart 3
(1) Output Gap
(2) Potential Growth Rate
Notes: 1. The output gap and the potential growth rate are estimated by the Research and Statistics Department, Bank of Japan. 2. The Tankan factor utilization index is calculated as the weighted average of the production capacity DI and the employment conditions DI for all enterprises. The capital and labor shares in the "National Accounts" are used as weights. There is a discontinuity in the data in December 2003 due to a change in the survey framework.
Sources: Cabinet Office; Bank of Japan; Ministry of Internal Affairs and Communications; Ministry of Health, Labour and Welfare; Ministry of Economy, Trade and Industry; Research Institute of Economy, Trade and Industry.
Output Gap and Potential Growth Rate
-2
-1
0
1
2
3
4
5
6
83 85 87 89 91 93 95 97 99 01 03 05 07 09 11 13 15
Total factor productivity
Capital stock
Number of employed
Labor hours
Potential growth rate
y/y % chg.
FY
-40
-30
-20
-10
0
10
20
30
40-8
-6
-4
-2
0
2
4
6
8
83 85 87 89 91 93 95 97 99 01 03 05 07 09 11 13 15 16
Labor input gap (left scale)
Capital input gap (left scale)
Output gap (left scale)
Tankan factor utilization index (right scale)
Forecast
reversed, DI ("excessive" - "insufficient"), % points
CY
%
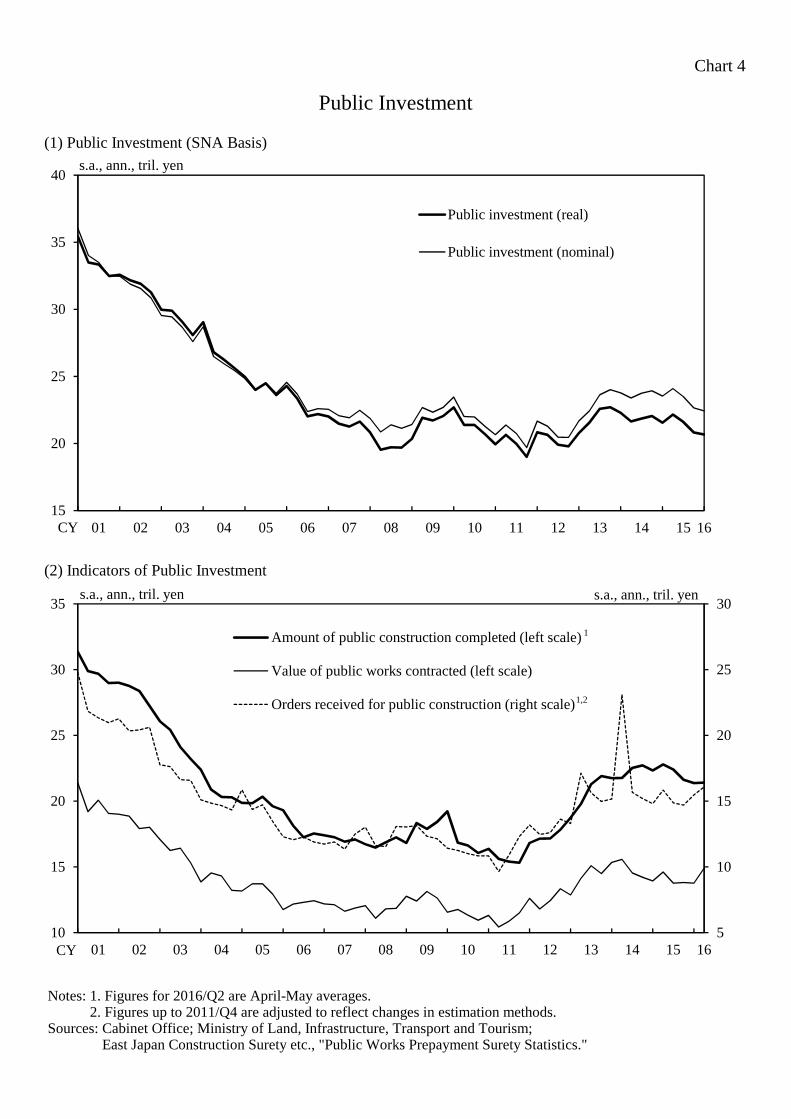
Chart 4
(1) Public Investment (SNA Basis)
(2) Indicators of Public Investment
Notes: 1. Figures for 2016/Q2 are April-May averages. Notes: 2. Figures up to 2011/Q4 are adjusted to reflect changes in estimation methods. Sources: Cabinet Office; Ministry of Land, Infrastructure, Transport and Tourism; Sources: East Japan Construction Surety etc., "Public Works Prepayment Surety Statistics."
Public Investment
15
20
25
30
35
40
01 02 03 04 05 06 07 08 09 10 11 12 13 14 15 16
Public investment (real)
Public investment (nominal)
s.a., ann., tril. yen
CY
5
10
15
20
25
30
10
15
20
25
30
35
01 02 03 04 05 06 07 08 09 10 11 12 13 14 15 16
Amount of public construction completed (left scale)
Value of public works contracted (left scale)
Orders received for public construction (right scale)
s.a., ann., tril. yen
CY
1,2
1
s.a., ann., tril. yen
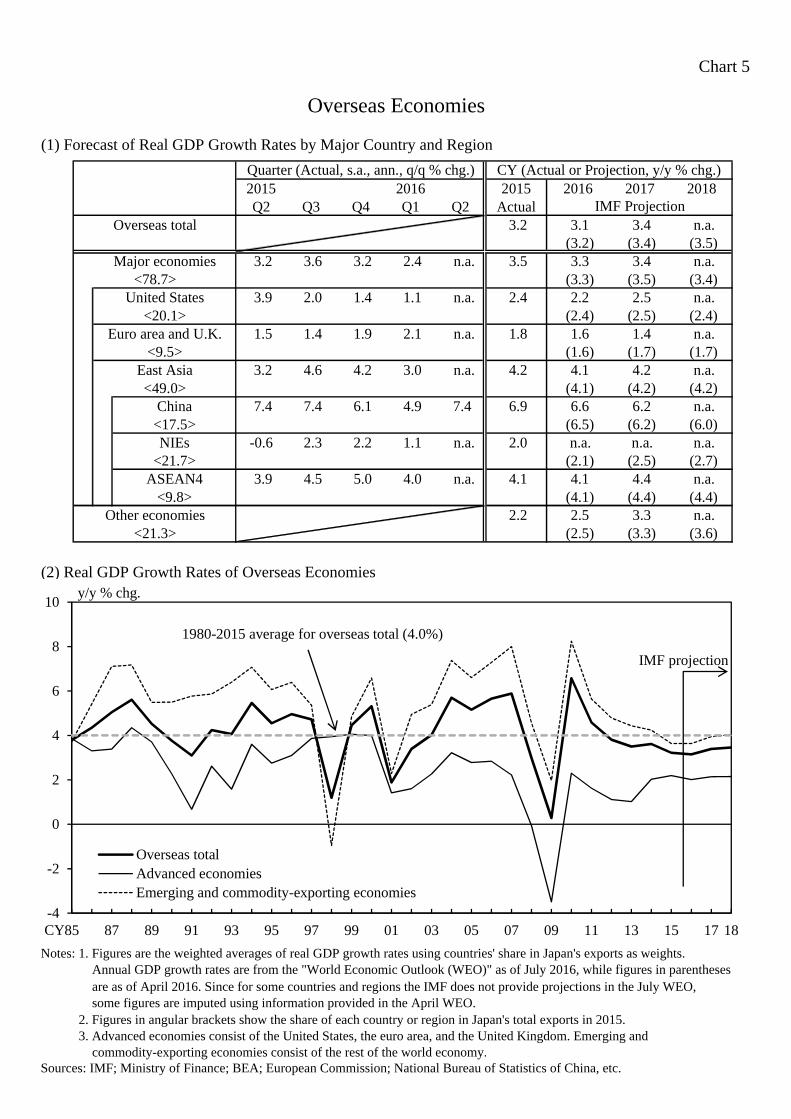
Chart 5
(1) Forecast of Real GDP Growth Rates by Major Country and Region
(2) Real GDP Growth Rates of Overseas Economies
Notes: 1. Figures are the weighted averages of real GDP growth rates using countries' share in Japan's exports as weights.Notes: 1. Annual GDP growth rates are from the "World Economic Outlook (WEO)" as of July 2016, while figures in parenthesesNotes: 1. are as of April 2016. Since for some countries and regions the IMF does not provide projections in the July WEO,Notes: 1. some figures are imputed using information provided in the April WEO.Notes: 2. Figures in angular brackets show the share of each country or region in Japan's total exports in 2015.Notes: 3. Advanced economies consist of the United States, the euro area, and the United Kingdom. Emerging andNotes: 3. commodity-exporting economies consist of the rest of the world economy.Sources: IMF; Ministry of Finance; BEA; European Commission; National Bureau of Statistics of China, etc.
Overseas Economies
2015 2016 2015 2016 2017 2018Q2 Q3 Q4 Q1 Q2 Actual
Overseas total 3.2 3.1 3.4 n.a. (3.2) (3.4) (3.5)
Major economies 3.2 3.6 3.2 2.4 n.a. 3.5 3.3 3.4 n.a. <78.7> (3.3) (3.5) (3.4)
United States 3.9 2.0 1.4 1.1 n.a. 2.4 2.2 2.5 n.a. <20.1> (2.4) (2.5) (2.4)
Euro area and U.K. 1.5 1.4 1.9 2.1 n.a. 1.8 1.6 1.4 n.a. <9.5> (1.6) (1.7) (1.7)
East Asia 3.2 4.6 4.2 3.0 n.a. 4.2 4.1 4.2 n.a. <49.0> (4.1) (4.2) (4.2)
China 7.4 7.4 6.1 4.9 7.4 6.9 6.6 6.2 n.a. <17.5> (6.5) (6.2) (6.0)NIEs -0.6 2.3 2.2 1.1 n.a. 2.0 n.a. n.a. n.a.
<21.7> (2.1) (2.5) (2.7)ASEAN4 3.9 4.5 5.0 4.0 n.a. 4.1 4.1 4.4 n.a.
<9.8> (4.1) (4.4) (4.4)Other economies 2.2 2.5 3.3 n.a.
<21.3> (2.5) (3.3) (3.6)
Quarter (Actual, s.a., ann., q/q % chg.) CY (Actual or Projection, y/y % chg.)
IMF Projection
-4
-2
0
2
4
6
8
10
85 87 89 91 93 95 97 99 01 03 05 07 09 11 13 15 17 18
Overseas totalAdvanced economiesEmerging and commodity-exporting economies
IMF projection
CY
y/y % chg.
1980-2015 average for overseas total (4.0%)
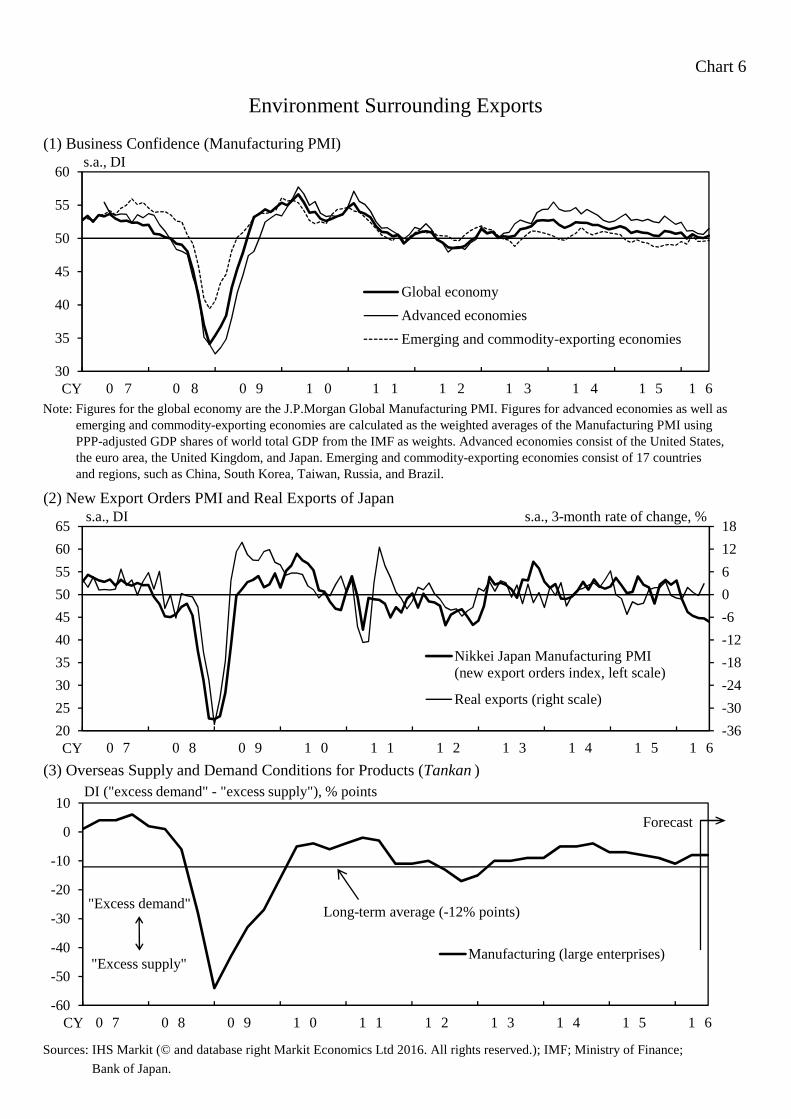
Chart 6
(1) Business Confidence (Manufacturing PMI)
Note: Figures for the global economy are the J.P.Morgan Global Manufacturing PMI. Figures for advanced economies as well asNote: emerging and commodity-exporting economies are calculated as the weighted averages of the Manufacturing PMI usingNote: PPP-adjusted GDP shares of world total GDP from the IMF as weights. Advanced economies consist of the United States,Note: the euro area, the United Kingdom, and Japan. Emerging and commodity-exporting economies consist of 17 countriesNote: and regions, such as China, South Korea, Taiwan, Russia, and Brazil.
(2) New Export Orders PMI and Real Exports of Japan
(3) Overseas Supply and Demand Conditions for Products (Tankan )
Sources: IHS Markit (© and database right Markit Economics Ltd 2016. All rights reserved.); IMF; Ministry of Finance;
Sources: Bank of Japan.
Environment Surrounding Exports
30
35
40
45
50
55
60
0 7 0 8 0 9 1 0 1 1 1 2 1 3 1 4 1 5 1 6
Global economy
Advanced economies
Emerging and commodity-exporting economies
s.a., DI
CY
-36
-30
-24
-18
-12
-6
0
6
12
18
20
25
30
35
40
45
50
55
60
65
0 7 0 8 0 9 1 0 1 1 1 2 1 3 1 4 1 5 1 6
Nikkei Japan Manufacturing PMI(new export orders index, left scale)
Real exports (right scale)
s.a., DI s.a., 3-month rate of change, %
CY
-60
-50
-40
-30
-20
-10
0
10
0 7 0 8 0 9 1 0 1 1 1 2 1 3 1 4 1 5 1 6
Manufacturing (large enterprises)
DI ("excess demand" - "excess supply"), % points
Long-term average (-12% points)
Forecast
"Excess demand"
"Excess supply"
CY
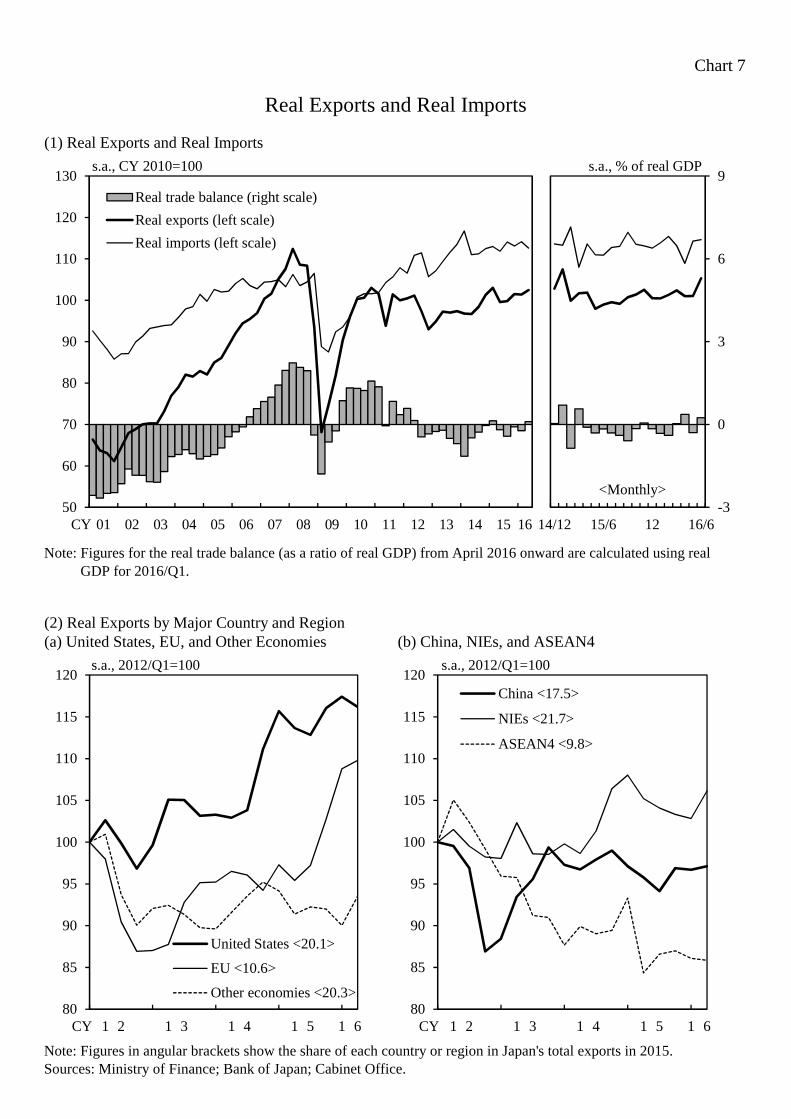
Chart 7
(1) Real Exports and Real Imports
Note: Figures for the real trade balance (as a ratio of real GDP) from April 2016 onward are calculated using realNote: GDP for 2016/Q1.
(2) Real Exports by Major Country and Region(a) United States, EU, and Other Economies (b) China, NIEs, and ASEAN4
Note: Figures in angular brackets show the share of each country or region in Japan's total exports in 2015.Sources: Ministry of Finance; Bank of Japan; Cabinet Office.
Real Exports and Real Imports
80
85
90
95
100
105
110
115
120
1 2 1 3 1 4 1 5 1 6
United States <20.1>
EU <10.6>
Other economies <20.3>
s.a., 2012/Q1=100
CY 80
85
90
95
100
105
110
115
120
1 2 1 3 1 4 1 5 1 6
China <17.5>
NIEs <21.7>
ASEAN4 <9.8>
s.a., 2012/Q1=100
CY
50
60
70
80
90
100
110
120
130
01 02 03 04 05 06 07 08 09 10 11 12 13 14 15 16
Real trade balance (right scale)
Real exports (left scale)
Real imports (left scale)
s.a., CY 2010=100
CY -3
0
3
6
9
14/12 15/6 12 16/6
s.a., % of real GDP
<Monthly>
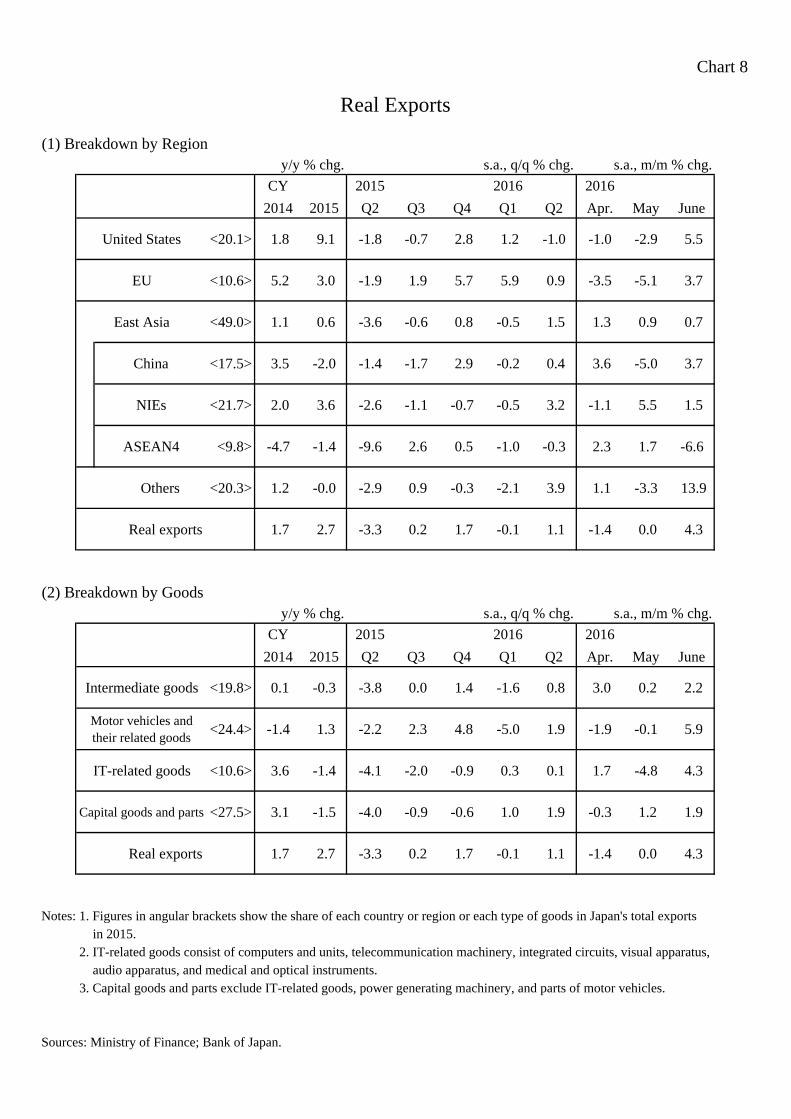
Chart 8
(1) Breakdown by Regiony/y % chg. s.a., q/q % chg. s.a., m/m % chg.
CY 2015 2016 2016
2014 2015 Q2 Q3 Q4 Q1 Q2 Apr. May June
United States <20.1> 1.8 9.1 -1.8 -0.7 2.8 1.2 -1.0 -1.0 -2.9 5.5
EU <10.6> 5.2 3.0 -1.9 1.9 5.7 5.9 0.9 -3.5 -5.1 3.7
East Asia <49.0> 1.1 0.6 -3.6 -0.6 0.8 -0.5 1.5 1.3 0.9 0.7
China <17.5> 3.5 -2.0 -1.4 -1.7 2.9 -0.2 0.4 3.6 -5.0 3.7
NIEs <21.7> 2.0 3.6 -2.6 -1.1 -0.7 -0.5 3.2 -1.1 5.5 1.5
ASEAN4 <9.8> -4.7 -1.4 -9.6 2.6 0.5 -1.0 -0.3 2.3 1.7 -6.6
Others <20.3> 1.2 -0.0 -2.9 0.9 -0.3 -2.1 3.9 1.1 -3.3 13.9
Real exports 1.7 2.7 -3.3 0.2 1.7 -0.1 1.1 -1.4 0.0 4.3
(2) Breakdown by Goods y/y % chg. s.a., q/q % chg. s.a., m/m % chg.
CY 2015 2016 2016
2014 2015 Q2 Q3 Q4 Q1 Q2 Apr. May June
Intermediate goods <19.8> 0.1 -0.3 -3.8 0.0 1.4 -1.6 0.8 3.0 0.2 2.2
Motor vehicles andtheir related goods
<24.4> -1.4 1.3 -2.2 2.3 4.8 -5.0 1.9 -1.9 -0.1 5.9
IT-related goods <10.6> 3.6 -1.4 -4.1 -2.0 -0.9 0.3 0.1 1.7 -4.8 4.3
Capital goods and parts <27.5> 3.1 -1.5 -4.0 -0.9 -0.6 1.0 1.9 -0.3 1.2 1.9
Real exports 1.7 2.7 -3.3 0.2 1.7 -0.1 1.1 -1.4 0.0 4.3
Notes: 1. Figures in angular brackets show the share of each country or region or each type of goods in Japan's total exportsNotes: 1. in 2015.Notes: 2. IT-related goods consist of computers and units, telecommunication machinery, integrated circuits, visual apparatus,Notes: 2. audio apparatus, and medical and optical instruments.Notes: 3. Capital goods and parts exclude IT-related goods, power generating machinery, and parts of motor vehicles.
Sources: Ministry of Finance; Bank of Japan.
Real Exports
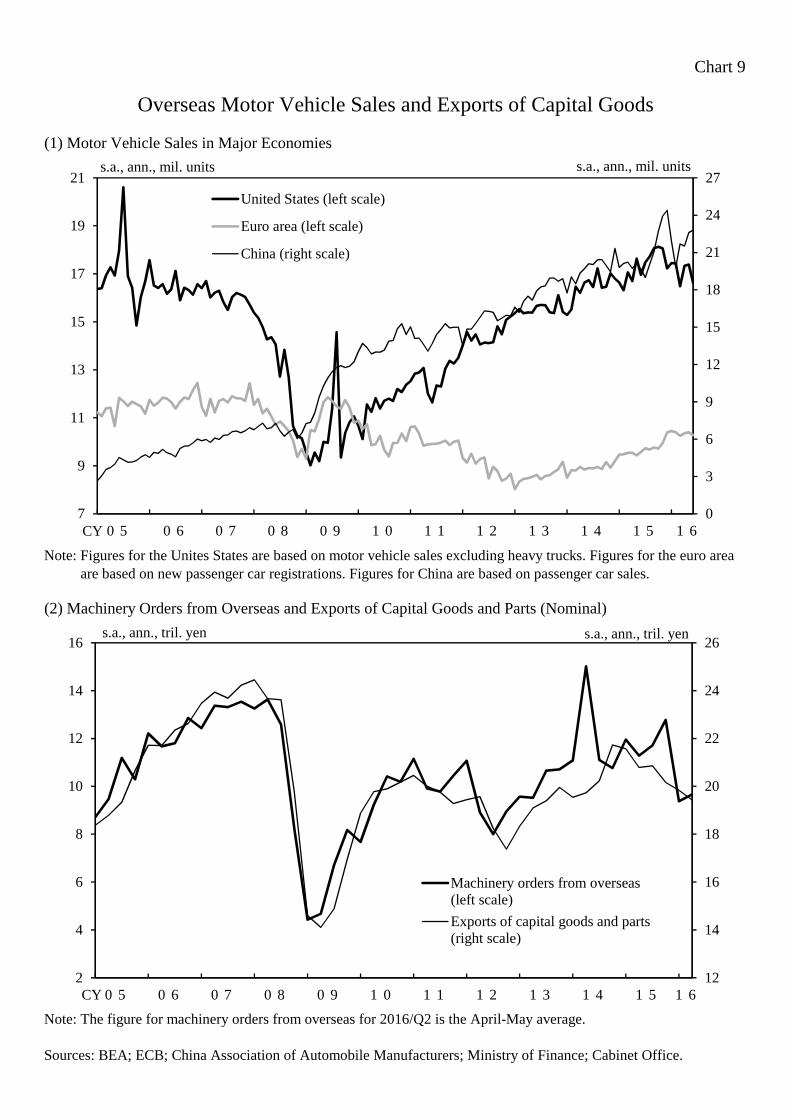
Chart 9
(1) Motor Vehicle Sales in Major Economies
Note: Figures for the Unites States are based on motor vehicle sales excluding heavy trucks. Figures for the euro areaNote: are based on new passenger car registrations. Figures for China are based on passenger car sales.
(2) Machinery Orders from Overseas and Exports of Capital Goods and Parts (Nominal)
Note: The figure for machinery orders from overseas for 2016/Q2 is the April-May average.
Sources: BEA; ECB; China Association of Automobile Manufacturers; Ministry of Finance; Cabinet Office.
Overseas Motor Vehicle Sales and Exports of Capital Goods
12
14
16
18
20
22
24
26
2
4
6
8
10
12
14
16
0 5 0 6 0 7 0 8 0 9 1 0 1 1 1 2 1 3 1 4 1 5 1 6
Machinery orders from overseas(left scale)
Exports of capital goods and parts(right scale)
s.a., ann., tril. yen s.a., ann., tril. yen
CY
0
3
6
9
12
15
18
21
24
27
7
9
11
13
15
17
19
21
0 5 0 6 0 7 0 8 0 9 1 0 1 1 1 2 1 3 1 4 1 5 1 6
United States (left scale)
Euro area (left scale)
China (right scale)
s.a., ann., mil. units
CY
s.a., ann., mil. units
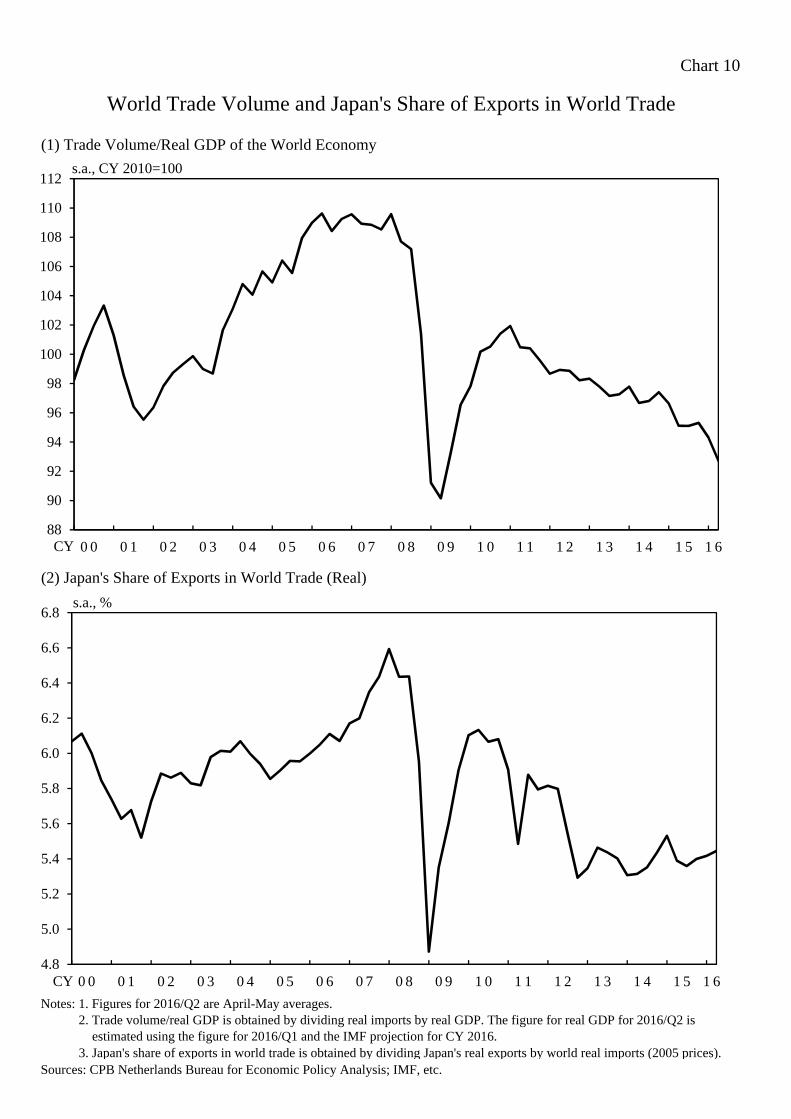
Chart 10
(1) Trade Volume/Real GDP of the World Economy
(2) Japan's Share of Exports in World Trade (Real)
Notes: 1. Figures for 2016/Q2 are April-May averages.Notes: 2. Trade volume/real GDP is obtained by dividing real imports by real GDP. The figure for real GDP for 2016/Q2 isNotes: 2. estimated using the figure for 2016/Q1 and the IMF projection for CY 2016.Notes: 3. Japan's share of exports in world trade is obtained by dividing Japan's real exports by world real imports (2005 prices).Sources: CPB Netherlands Bureau for Economic Policy Analysis; IMF, etc.
World Trade Volume and Japan's Share of Exports in World Trade
4.8
5.0
5.2
5.4
5.6
5.8
6.0
6.2
6.4
6.6
6.8
0 0 0 1 0 2 0 3 0 4 0 5 0 6 0 7 0 8 0 9 1 0 1 1 1 2 1 3 1 4 1 5 1 6CY
s.a., %
88
90
92
94
96
98
100
102
104
106
108
110
112
0 0 0 1 0 2 0 3 0 4 0 5 0 6 0 7 0 8 0 9 1 0 1 1 1 2 1 3 1 4 1 5 1 6CY
s.a., CY 2010=100
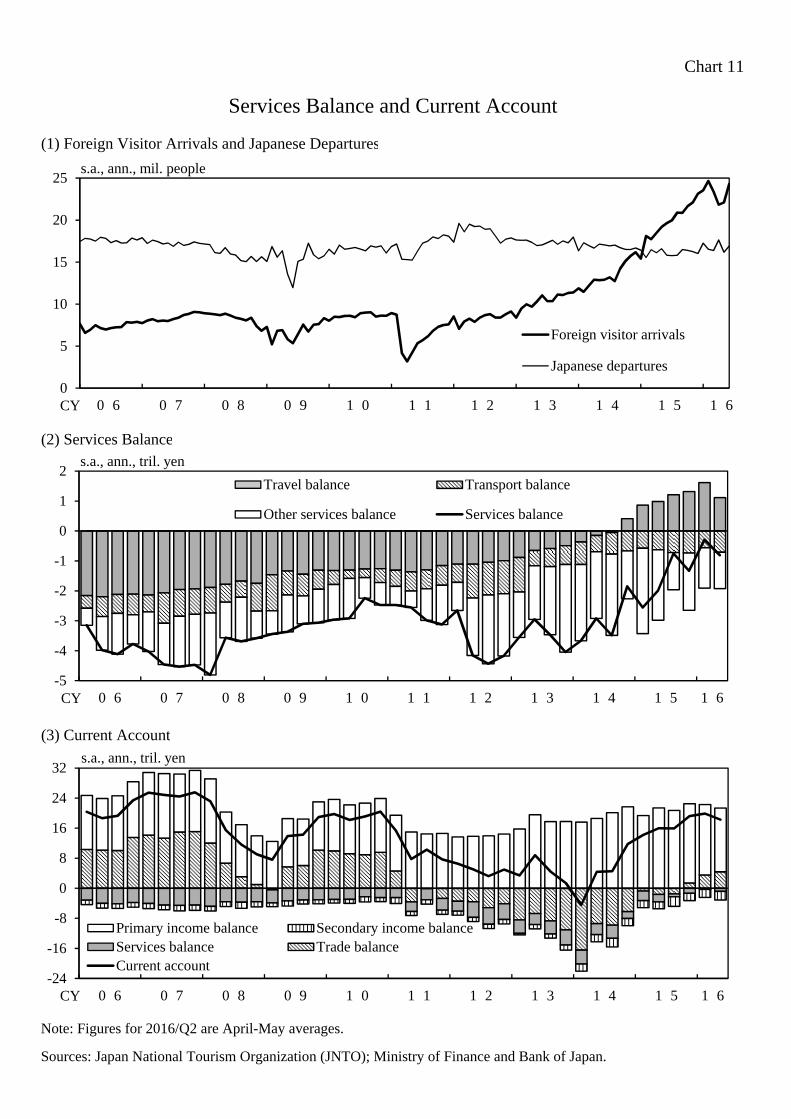
Chart 11
(1) Foreign Visitor Arrivals and Japanese Departures
(2) Services Balance
(3) Current Account
Note: Figures for 2016/Q2 are April-May averages.
Sources: Japan National Tourism Organization (JNTO); Ministry of Finance and Bank of Japan.
Services Balance and Current Account
0
5
10
15
20
25
0 6 0 7 0 8 0 9 1 0 1 1 1 2 1 3 1 4 1 5 1 6
Foreign visitor arrivals
Japanese departures
s.a., ann., mil. people
CY
-5
-4
-3
-2
-1
0
1
2
0 6 0 7 0 8 0 9 1 0 1 1 1 2 1 3 1 4 1 5 1 6
Travel balance Transport balance
Other services balance Services balance
s.a., ann., tril. yen
CY
-24
-16
-8
0
8
16
24
32
0 6 0 7 0 8 0 9 1 0 1 1 1 2 1 3 1 4 1 5 1 6
Primary income balance Secondary income balanceServices balance Trade balanceCurrent account
s.a., ann., tril. yen
CY
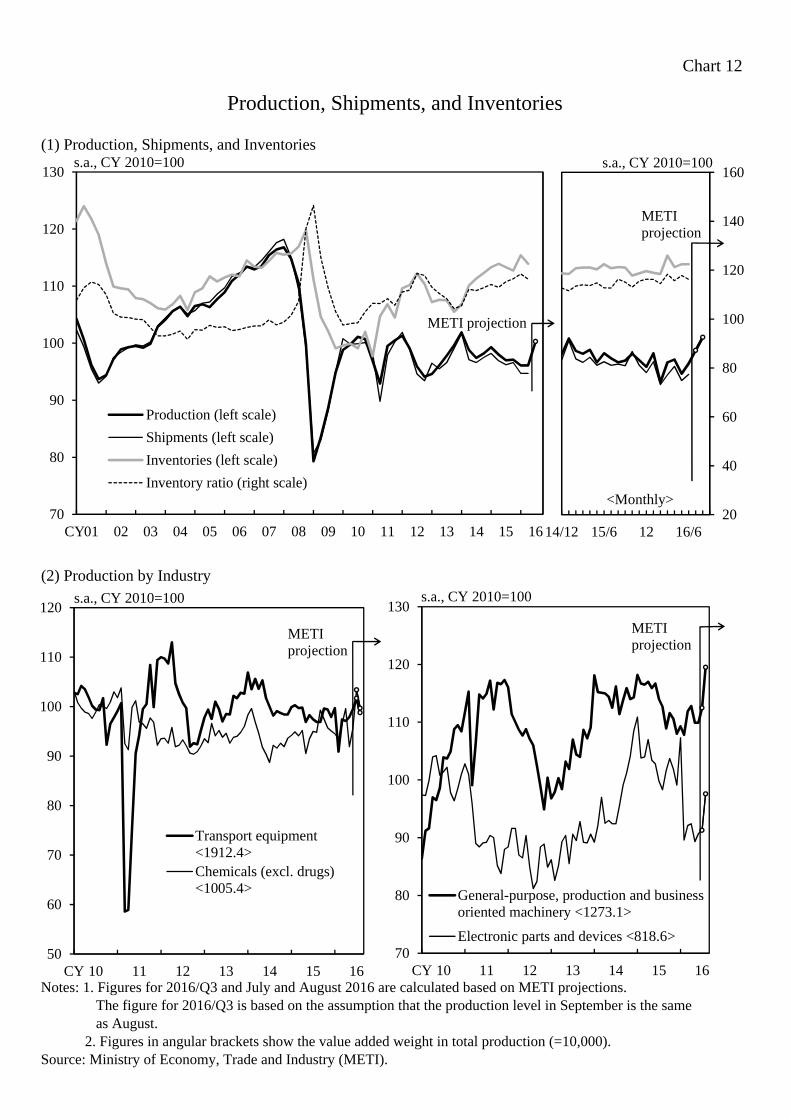
Chart 12
(1) Production, Shipments, and Inventories
(2) Production by Industry
Notes: 1. Figures for 2016/Q3 and July and August 2016 are calculated based on METI projections. The figure for 2016/Q3 is based on the assumption that the production level in September is the same as August. 2. Figures in angular brackets show the value added weight in total production (=10,000).Source: Ministry of Economy, Trade and Industry (METI).
Production, Shipments, and Inventories
20
40
60
80
100
120
140
160
14/12 15/6 12 16/6
METI projection
s.a., CY 2010=100
<Monthly>70
80
90
100
110
120
130
CY01 02 03 04 05 06 07 08 09 10 11 12 13 14 15 16
Production (left scale)
Shipments (left scale)
Inventories (left scale)
Inventory ratio (right scale)
s.a., CY 2010=100
METI projection
50
60
70
80
90
100
110
120
CY 10 11 12 13 14 15 16
Transport equipment<1912.4>Chemicals (excl. drugs)<1005.4>
METI projection
s.a., CY 2010=100
70
80
90
100
110
120
130
CY 10 11 12 13 14 15 16
General-purpose, production and businessoriented machinery <1273.1>
Electronic parts and devices <818.6>
METI projection
s.a., CY 2010=100
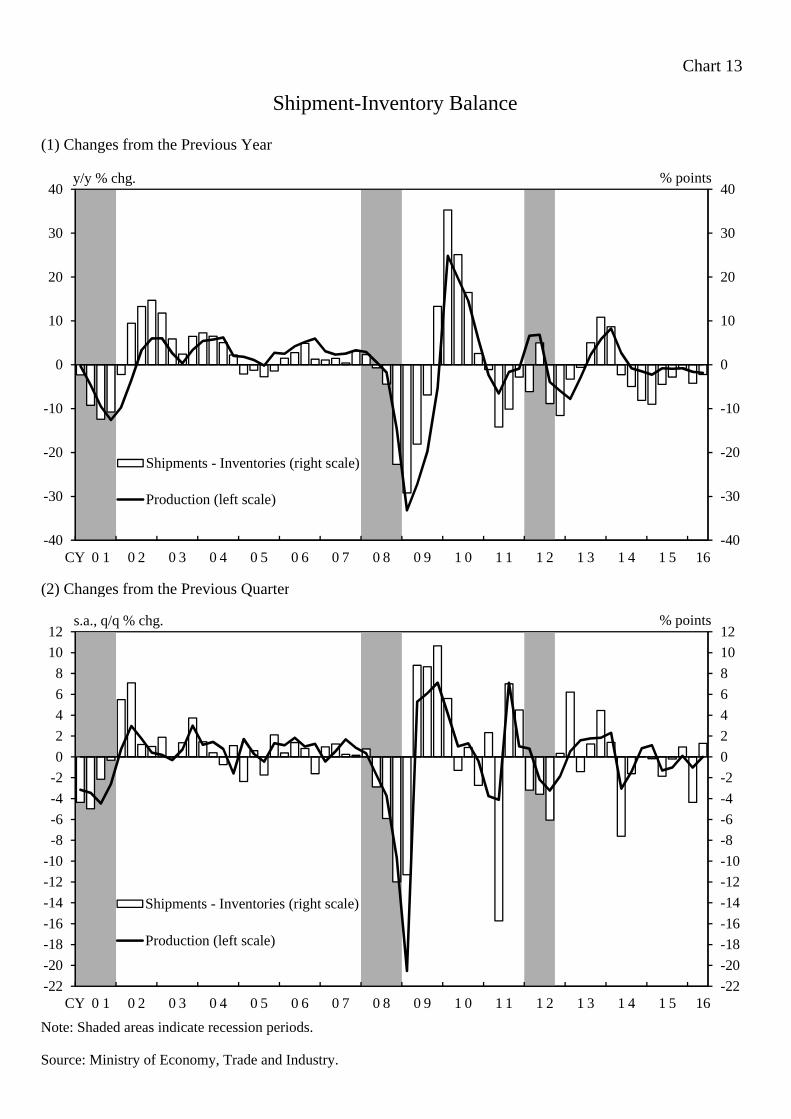
Chart 13
(1) Changes from the Previous Year
(2) Changes from the Previous Quarter
Note: Shaded areas indicate recession periods.
Source: Ministry of Economy, Trade and Industry.
Shipment-Inventory Balance
-40
-30
-20
-10
0
10
20
30
40
-40
-30
-20
-10
0
10
20
30
40
CY 0 1 0 2 0 3 0 4 0 5 0 6 0 7 0 8 0 9 1 0 1 1 1 2 1 3 1 4 1 5 16
Shipments - Inventories (right scale)
Production (left scale)
y/y % chg. % points
-22
-20
-18
-16
-14
-12
-10
-8
-6
-4
-2
0
2
4
6
8
10
12
-22
-20
-18
-16
-14
-12
-10
-8
-6
-4
-2
0
2
4
6
8
10
12
CY 0 1 0 2 0 3 0 4 0 5 0 6 0 7 0 8 0 9 1 0 1 1 1 2 1 3 1 4 1 5 16
Shipments - Inventories (right scale)
Production (left scale)
s.a., q/q % chg. % points
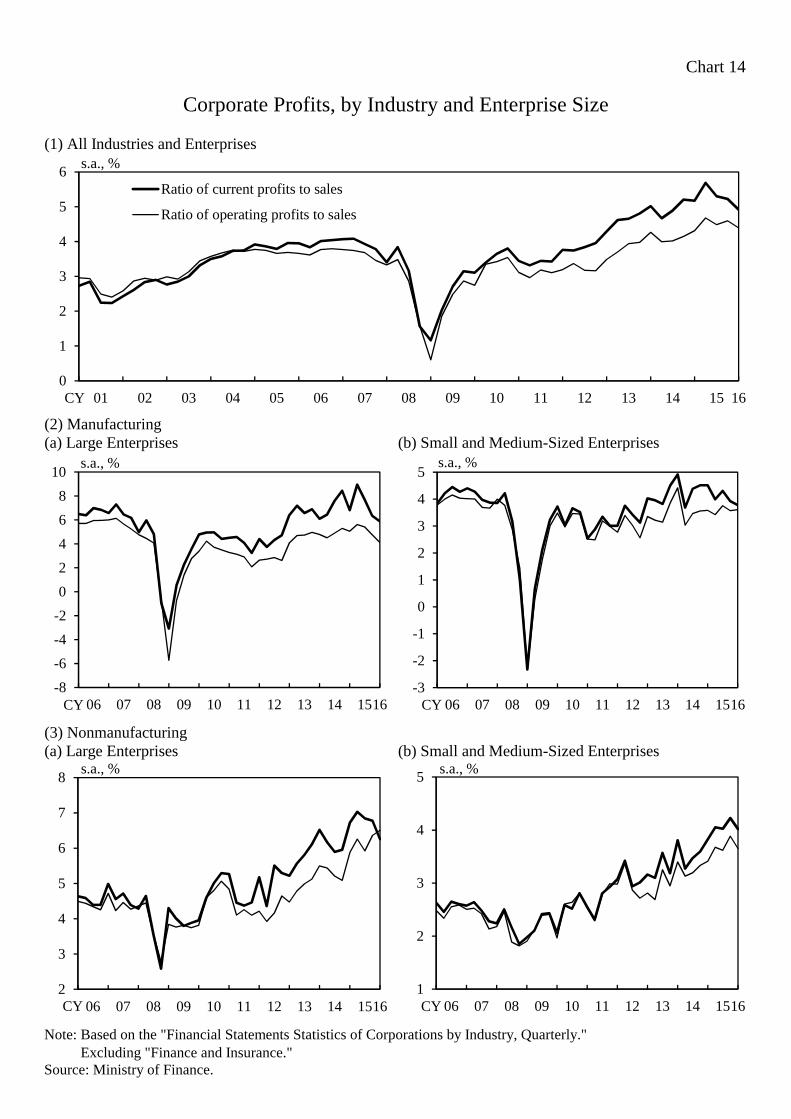
Chart 14
(1) All Industries and Enterprises
(2) Manufacturing(a) Large Enterprises (b) Small and Medium-Sized Enterprises
(3) Nonmanufacturing(a) Large Enterprises (b) Small and Medium-Sized Enterprises
Note: Based on the "Financial Statements Statistics of Corporations by Industry, Quarterly." Note: Excluding "Finance and Insurance."Source: Ministry of Finance.
Corporate Profits, by Industry and Enterprise Size
-8
-6
-4
-2
0
2
4
6
8
10
06 07 08 09 10 11 12 13 14 1516
s.a., %
CY
2
3
4
5
6
7
8
06 07 08 09 10 11 12 13 14 1516
s.a., %
CY
-3
-2
-1
0
1
2
3
4
5
06 07 08 09 10 11 12 13 14 1516
s.a., %
CY
1
2
3
4
5
06 07 08 09 10 11 12 13 14 1516
s.a., %
CY
0
1
2
3
4
5
6
01 02 03 04 05 06 07 08 09 10 11 12 13 14 15 16
Ratio of current profits to sales
Ratio of operating profits to sales
s.a., %
CY
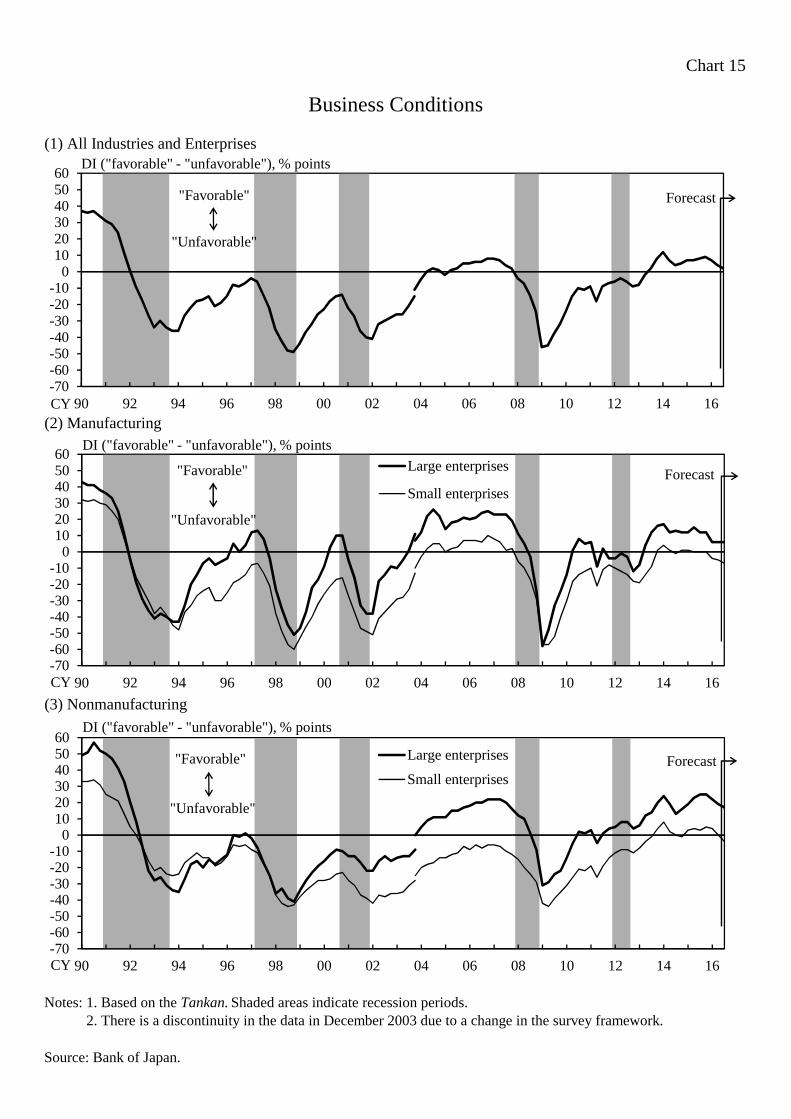
Chart 15
(1) All Industries and Enterprises
(2) Manufacturing
(3) Nonmanufacturing
Notes: 1. Based on the Tankan. Shaded areas indicate recession periods.Notes: 2. There is a discontinuity in the data in December 2003 due to a change in the survey framework.
Source: Bank of Japan.
Business Conditions
-70-60-50-40-30-20-10
0102030405060
90 92 94 96 98 00 02 04 06 08 10 12 14 16
Large enterprises
Small enterprises
DI ("favorable" - "unfavorable"), % points
"Favorable"
"Unfavorable"
Forecast
CY
-70-60-50-40-30-20-10
0102030405060
90 92 94 96 98 00 02 04 06 08 10 12 14 16
Large enterprises
Small enterprises
DI ("favorable" - "unfavorable"), % points
"Favorable"
"Unfavorable"
Forecast
CY
-70-60-50-40-30-20-10
0102030405060
90 92 94 96 98 00 02 04 06 08 10 12 14 16
DI ("favorable" - "unfavorable"), % points
"Favorable"
"Unfavorable"
Forecast
CY
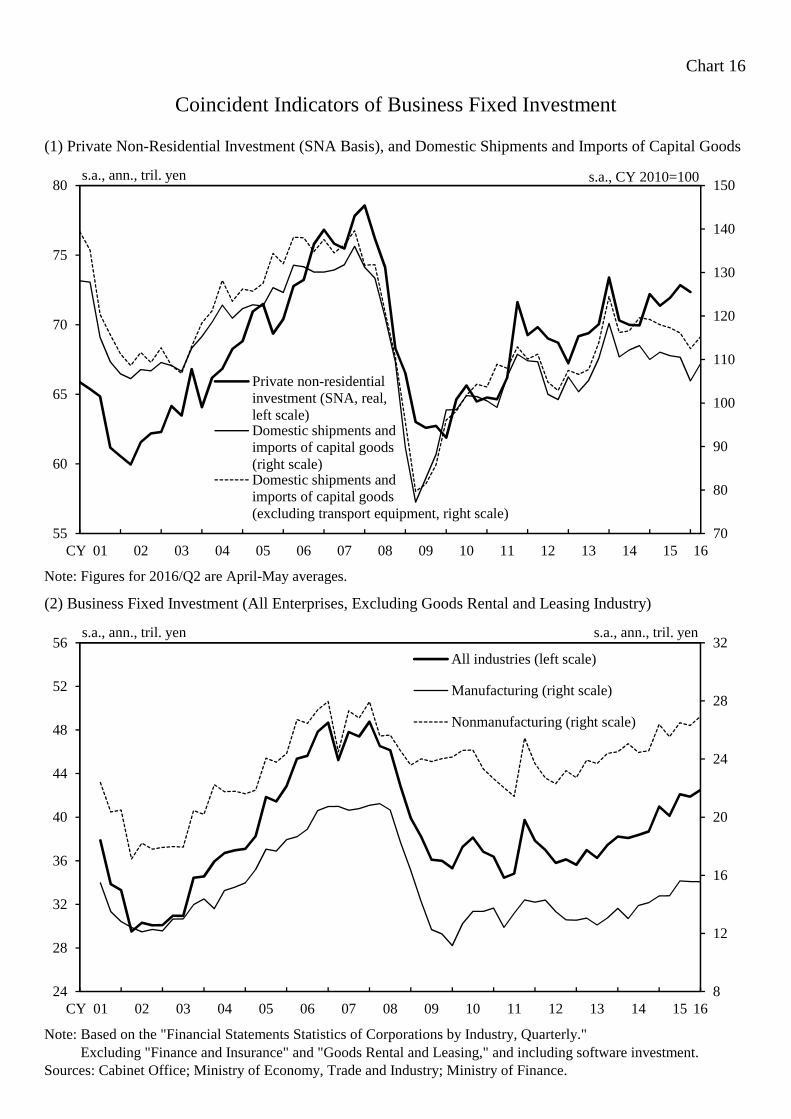
Chart 16
(1) Private Non-Residential Investment (SNA Basis), and Domestic Shipments and Imports of Capital Goods
Note: Figures for 2016/Q2 are April-May averages.
(2) Business Fixed Investment (All Enterprises, Excluding Goods Rental and Leasing Industry)
Note: Based on the "Financial Statements Statistics of Corporations by Industry, Quarterly." Note: Excluding "Finance and Insurance" and "Goods Rental and Leasing," and including software investment.Sources: Cabinet Office; Ministry of Economy, Trade and Industry; Ministry of Finance.
Coincident Indicators of Business Fixed Investment
8
12
16
20
24
28
32
24
28
32
36
40
44
48
52
56
CY 01 02 03 04 05 06 07 08 09 10 11 12 13 14 15 16
All industries (left scale)
Manufacturing (right scale)
Nonmanufacturing (right scale)
s.a., ann., tril. yen s.a., ann., tril. yen
70
80
90
100
110
120
130
140
150
55
60
65
70
75
80
CY 01 02 03 04 05 06 07 08 09 10 11 12 13 14 15 16
Private non-residentialinvestment (SNA, real,left scale)Domestic shipments andimports of capital goods(right scale)Domestic shipments andimports of capital goods(excluding transport equipment, right scale)
s.a., ann., tril. yen s.a., CY 2010=100
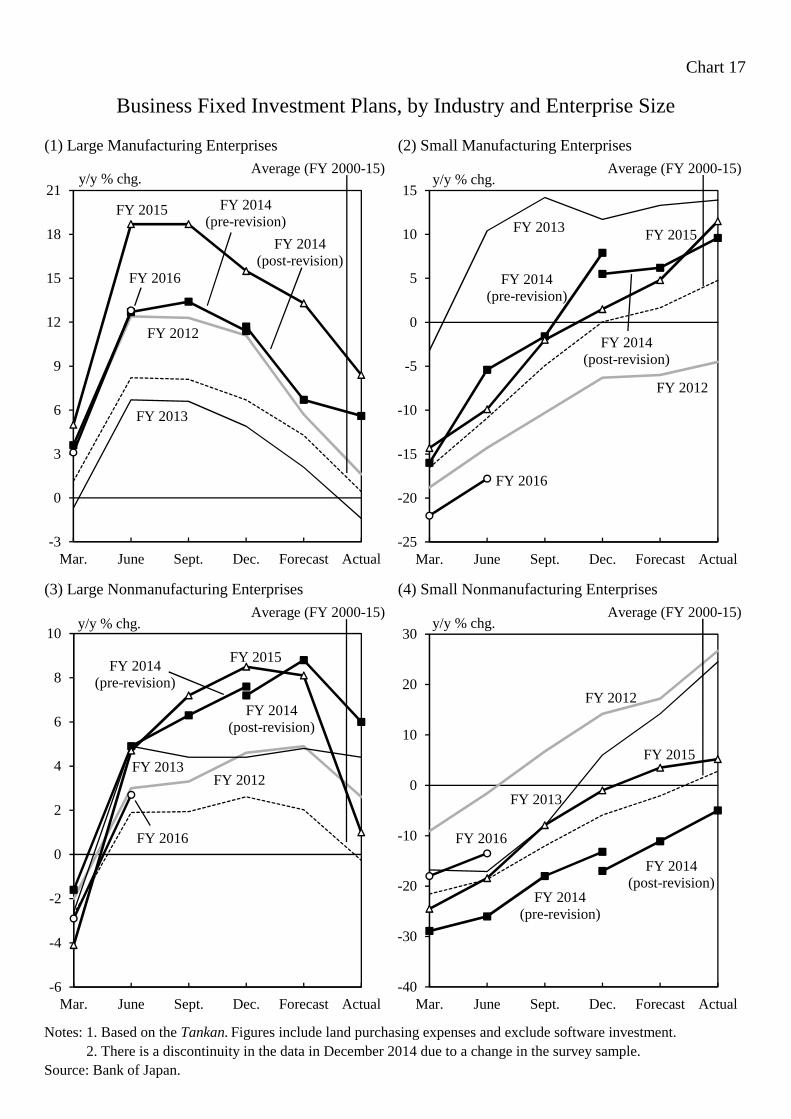
Chart 17
(1) Large Manufacturing Enterprises (2) Small Manufacturing Enterprises
(3) Large Nonmanufacturing Enterprises (4) Small Nonmanufacturing Enterprises
Notes: 1. Based on the Tankan. Figures include land purchasing expenses and exclude software investment.Notes: 2. There is a discontinuity in the data in December 2014 due to a change in the survey sample.Source: Bank of Japan.
Business Fixed Investment Plans, by Industry and Enterprise Size
-3
0
3
6
9
12
15
18
21
Mar. June Sept. Dec. Forecast Actual
y/y % chg.Average (FY 2000-15)
FY 2016
FY 2012
FY 2013
FY 2014(pre-revision)
FY 2014(post-revision)
FY 2015
-25
-20
-15
-10
-5
0
5
10
15
Mar. June Sept. Dec. Forecast Actual
y/y % chg.Average (FY 2000-15)
FY 2016
FY 2012
FY 2013
FY 2014(post-revision)
FY 2015
FY 2014(pre-revision)
-6
-4
-2
0
2
4
6
8
10
Mar. June Sept. Dec. Forecast Actual
y/y % chg.Average (FY 2000-15)
FY 2016
FY 2012FY 2013
FY 2014(pre-revision)
FY 2014(post-revision)
FY 2015
-40
-30
-20
-10
0
10
20
30
Mar. June Sept. Dec. Forecast Actual
y/y % chg.Average (FY 2000-15)
FY 2016
FY 2012
FY 2013
FY 2014(pre-revision)
FY 2014(post-revision)
FY 2015
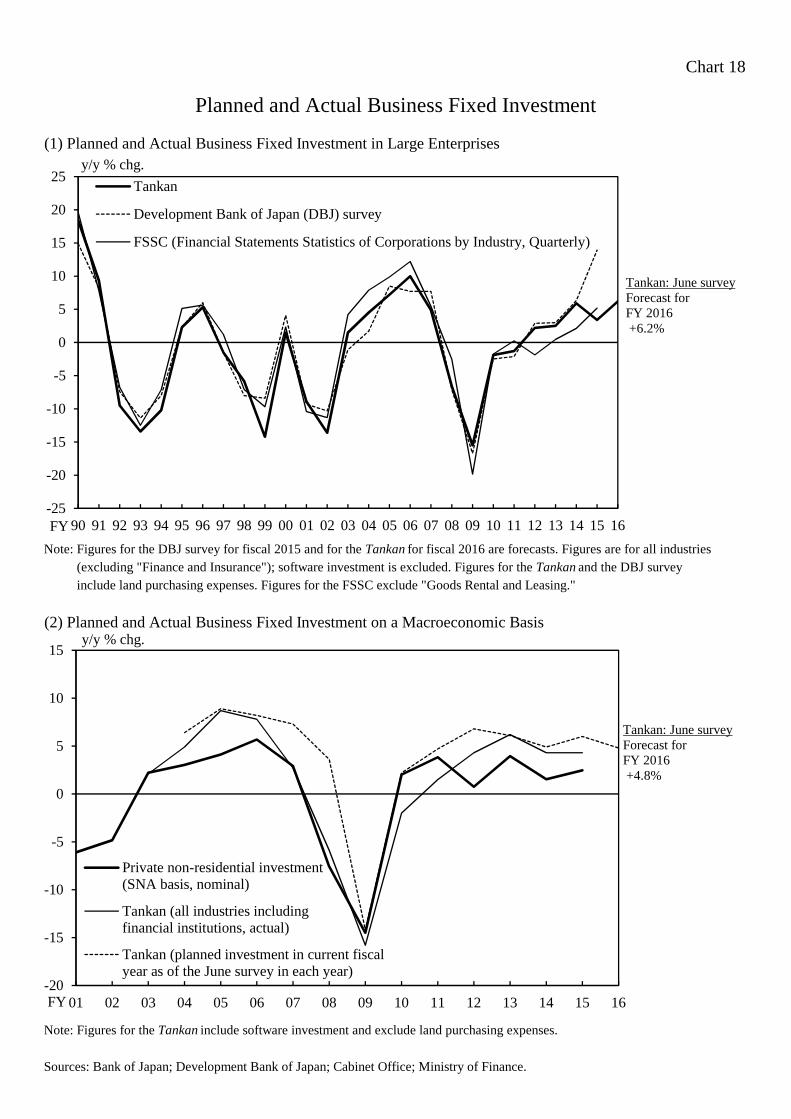
Chart 18
Planned and Actual Business Fixed Investment
(1) Planned and Actual Business Fixed Investment in Large Enterprises
Note: Figures for the DBJ survey for fiscal 2015 and for the Tankan for fiscal 2016 are forecasts. Figures are for all industriesNote: (excluding "Finance and Insurance"); software investment is excluded. Figures for the Tankan and the DBJ surveyNote: include land purchasing expenses. Figures for the FSSC exclude "Goods Rental and Leasing."
(2) Planned and Actual Business Fixed Investment on a Macroeconomic Basis
Note: Figures for the Tankan include software investment and exclude land purchasing expenses.
Sources: Bank of Japan; Development Bank of Japan; Cabinet Office; Ministry of Finance.
-25
-20
-15
-10
-5
0
5
10
15
20
25
90 91 92 93 94 95 96 97 98 99 00 01 02 03 04 05 06 07 08 09 10 11 12 13 14 15 16
Tankan
Development Bank of Japan (DBJ) survey
FSSC (Financial Statements Statistics of Corporations by Industry, Quarterly)
y/y % chg.
FY
-20
-15
-10
-5
0
5
10
15
01 02 03 04 05 06 07 08 09 10 11 12 13 14 15 16
Private non-residential investment(SNA basis, nominal)
Tankan (all industries includingfinancial institutions, actual)
Tankan (planned investment in current fiscalyear as of the June survey in each year)
y/y % chg.
FY
Tankan: June surveyForecast forFY 2016+6.2%
Tankan: June surveyForecast forFY 2016+4.8%
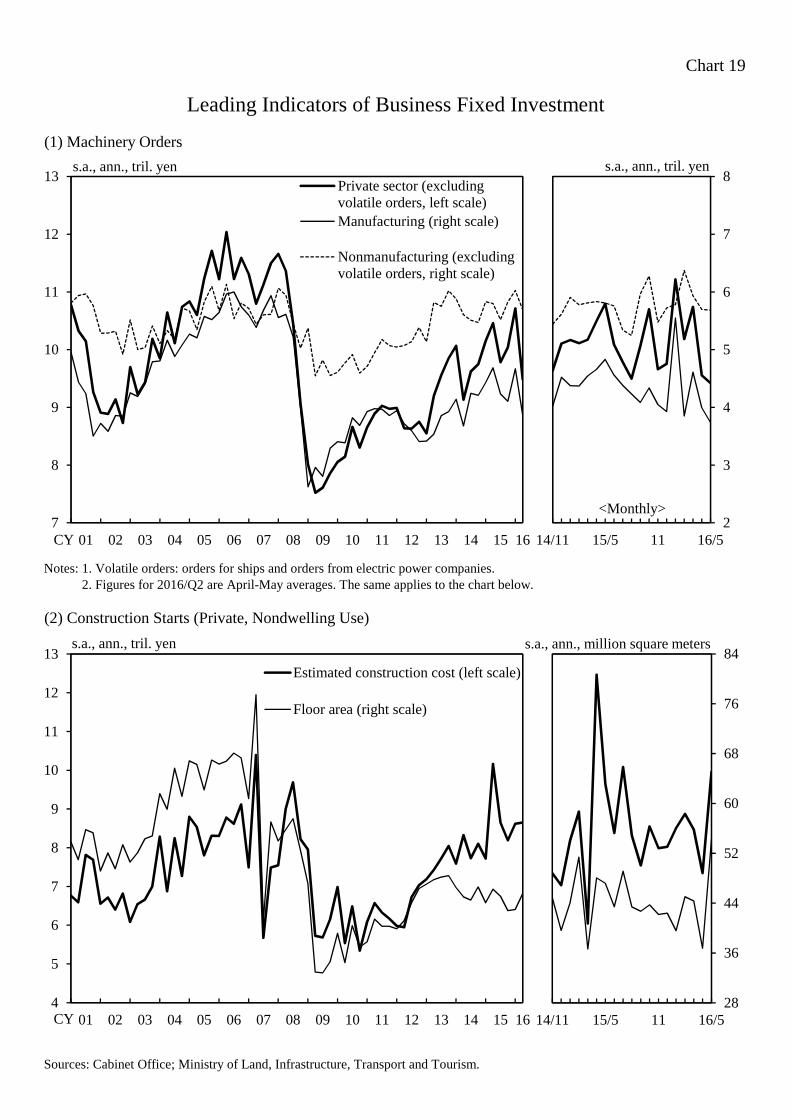
Chart 19
(1) Machinery Orders
Notes: 1. Volatile orders: orders for ships and orders from electric power companies.Notes: 2. Figures for 2016/Q2 are April-May averages. The same applies to the chart below.Notes: 2.(2) Construction Starts (Private, Nondwelling Use)
Sources: Cabinet Office; Ministry of Land, Infrastructure, Transport and Tourism.
Leading Indicators of Business Fixed Investment
7
8
9
10
11
12
13
01 02 03 04 05 06 07 08 09 10 11 12 13 14 15 16
Private sector (excludingvolatile orders, left scale)Manufacturing (right scale)
Nonmanufacturing (excludingvolatile orders, right scale)
s.a., ann., tril. yen
CY
4
5
6
7
8
9
10
11
12
13
01 02 03 04 05 06 07 08 09 10 11 12 13 14 15 16
Estimated construction cost (left scale)
Floor area (right scale)
s.a., ann., tril. yen
CY
2
3
4
5
6
7
8
14/11 15/5 11 16/5
s.a., ann., tril. yen
<Monthly>
28
36
44
52
60
68
76
84
14/11 15/5 11 16/5
s.a., ann., million square meters
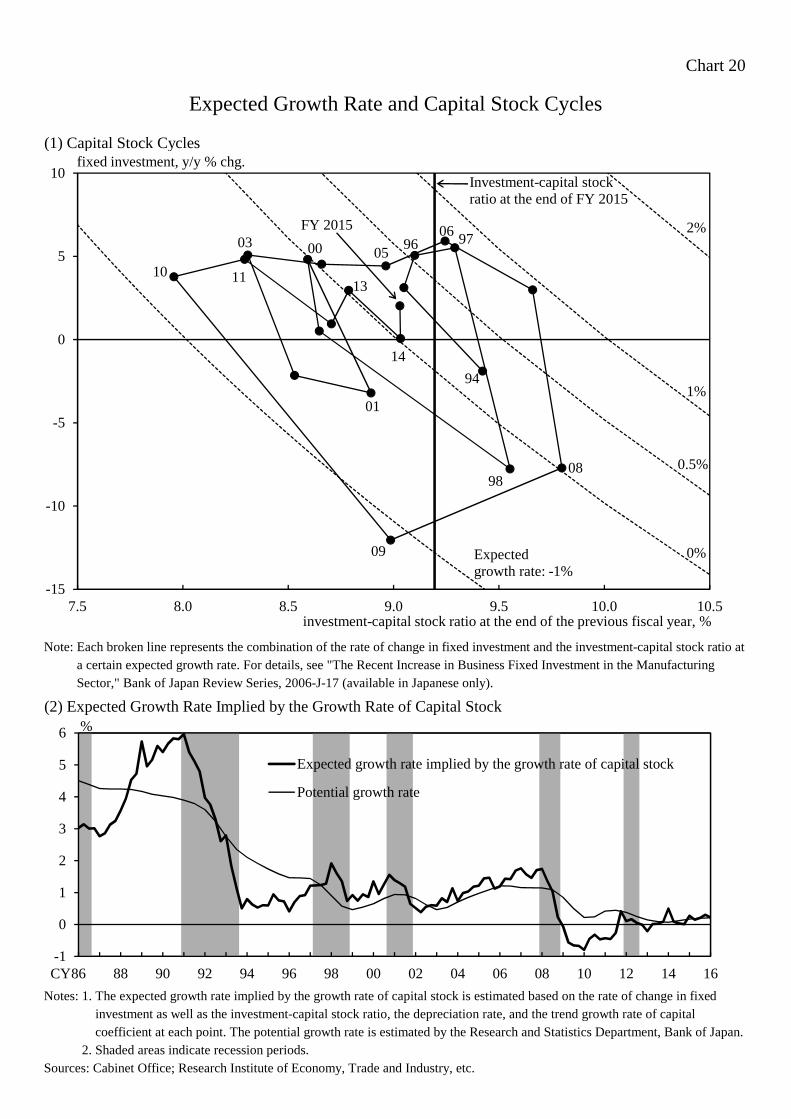
Chart 20
(1) Capital Stock Cycles
Note: Each broken line represents the combination of the rate of change in fixed investment and the investment-capital stock ratio atNote: a certain expected growth rate. For details, see "The Recent Increase in Business Fixed Investment in the ManufacturingNote: Sector," Bank of Japan Review Series, 2006-J-17 (available in Japanese only).
(2) Expected Growth Rate Implied by the Growth Rate of Capital Stock
Notes: 1. The expected growth rate implied by the growth rate of capital stock is estimated based on the rate of change in fixedNotes: 1. investment as well as the investment-capital stock ratio, the depreciation rate, and the trend growth rate of capitalNotes: 1. coefficient at each point. The potential growth rate is estimated by the Research and Statistics Department, Bank of Japan.Notes: 2. Shaded areas indicate recession periods.Sources: Cabinet Office; Research Institute of Economy, Trade and Industry, etc.
Expected Growth Rate and Capital Stock Cycles
94
-15
-10
-5
0
5
10
7.5 8.0 8.5 9.0 9.5 10.0 10.5
97
01
000306
96
Investment-capital stock ratio at the end of FY 2015
fixed investment, y/y % chg.
Expected growth rate: -1%
investment-capital stock ratio at the end of the previous fiscal year, %
08
1%
2%
0%
10 11
FY 2015
05
98
13
09
0.5%
14
-1
0
1
2
3
4
5
6
86 88 90 92 94 96 98 00 02 04 06 08 10 12 14 16
Expected growth rate implied by the growth rate of capital stock
Potential growth rate
%
CY
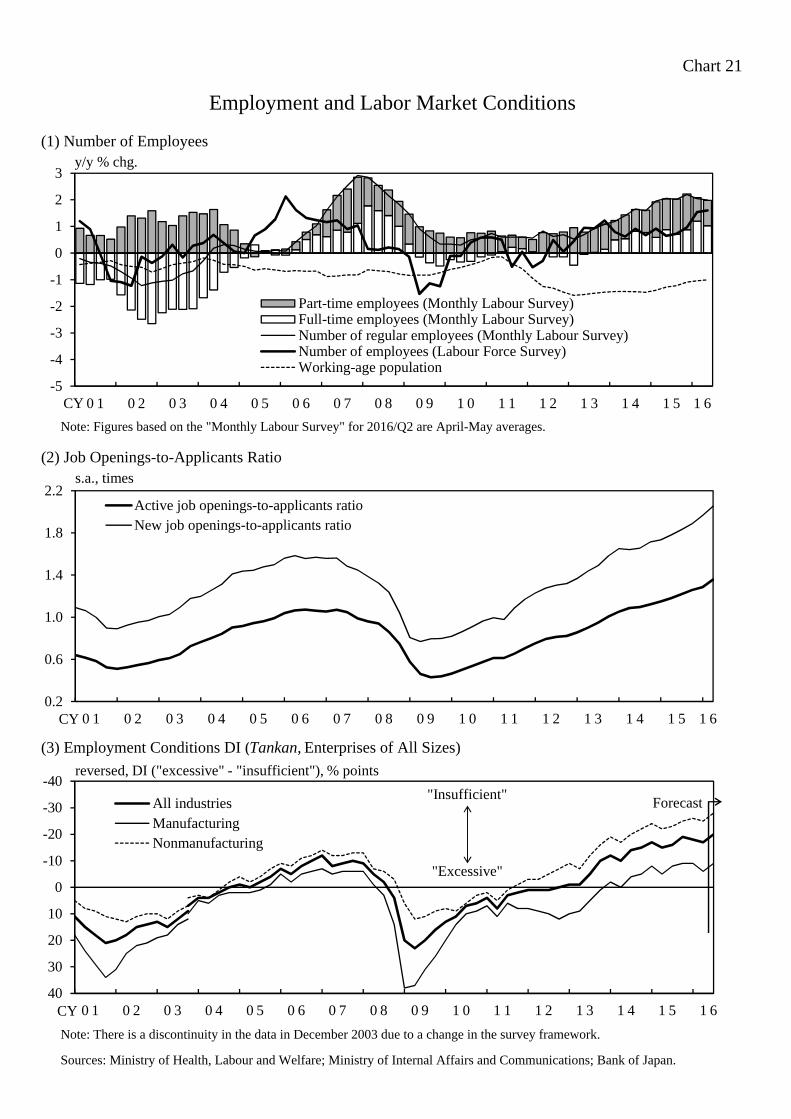
Chart 21
(1) Number of Employees
Note: Figures based on the "Monthly Labour Survey" for 2016/Q2 are April-May averages.
(2) Job Openings-to-Applicants Ratio
(3) Employment Conditions DI (Tankan, Enterprises of All Sizes)
Note: There is a discontinuity in the data in December 2003 due to a change in the survey framework.
Sources: Ministry of Health, Labour and Welfare; Ministry of Internal Affairs and Communications; Bank of Japan.
Employment and Labor Market Conditions
-40
-30
-20
-10
0
10
20
30
400 1 0 2 0 3 0 4 0 5 0 6 0 7 0 8 0 9 1 0 1 1 1 2 1 3 1 4 1 5 1 6
All industriesManufacturingNonmanufacturing
"Excessive"
"Insufficient"
reversed, DI ("excessive" - "insufficient"), % points
CY
Forecast
0.2
0.6
1.0
1.4
1.8
2.2
0 1 0 2 0 3 0 4 0 5 0 6 0 7 0 8 0 9 1 0 1 1 1 2 1 3 1 4 1 5 1 6
Active job openings-to-applicants ratioNew job openings-to-applicants ratio
s.a., times
CY
-5
-4
-3
-2
-1
0
1
2
3
0 1 0 2 0 3 0 4 0 5 0 6 0 7 0 8 0 9 1 0 1 1 1 2 1 3 1 4 1 5 1 6
Part-time employees (Monthly Labour Survey)Full-time employees (Monthly Labour Survey)Number of regular employees (Monthly Labour Survey)Number of employees (Labour Force Survey)Working-age population
y/y % chg.
CY
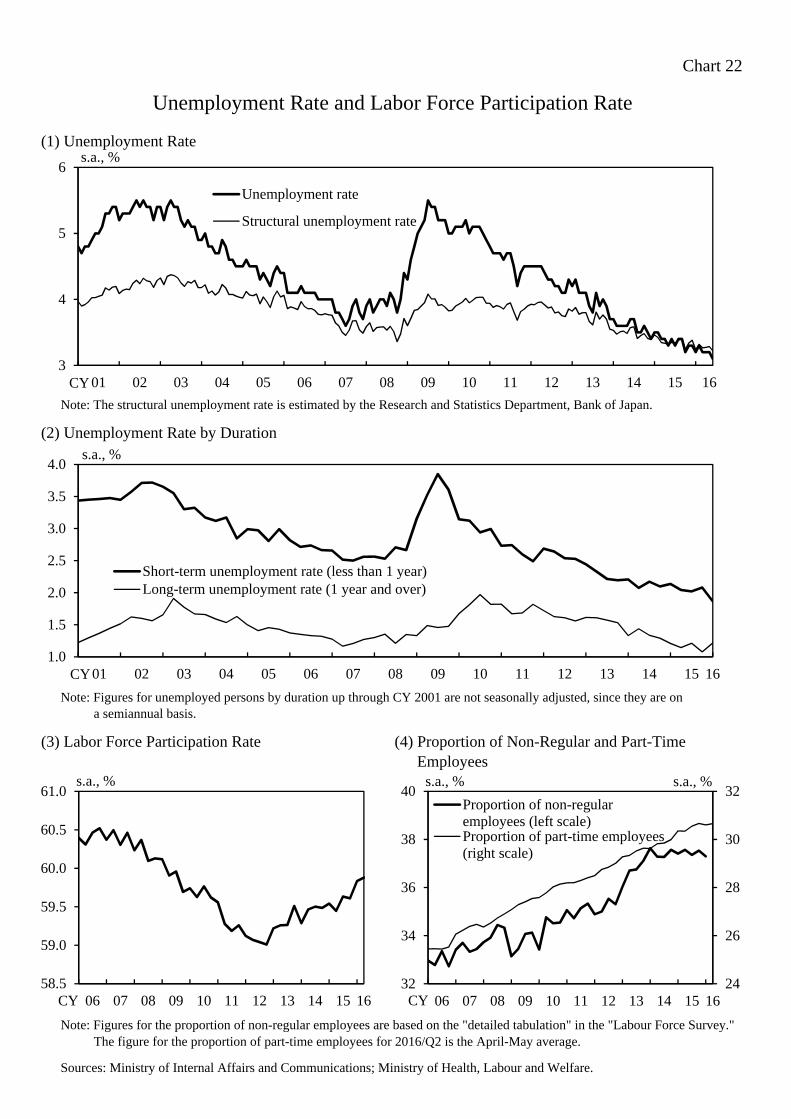
Chart 22
(1) Unemployment Rate
Note: The structural unemployment rate is estimated by the Research and Statistics Department, Bank of Japan.
(2) Unemployment Rate by Duration
Note: Figures for unemployed persons by duration up through CY 2001 are not seasonally adjusted, since they are on Note: a semiannual basis.
(3) Labor Force Participation Rate (4) Proportion of Non-Regular and Part-Time(4) Employees
Note: Figures for the proportion of non-regular employees are based on the "detailed tabulation" in the "Labour Force Survey." Note: The figure for the proportion of part-time employees for 2016/Q2 is the April-May average.
Sources: Ministry of Internal Affairs and Communications; Ministry of Health, Labour and Welfare.
Unemployment Rate and Labor Force Participation Rate
24
26
28
30
32
32
34
36
38
40
06 07 08 09 10 11 12 13 14 15 16
Proportion of non-regularemployees (left scale)Proportion of part-time employees(right scale)
s.a., %s.a., %
CY
1.0
1.5
2.0
2.5
3.0
3.5
4.0
01 02 03 04 05 06 07 08 09 10 11 12 13 14 15 16
Short-term unemployment rate (less than 1 year)Long-term unemployment rate (1 year and over)
s.a., %
CY
58.5
59.0
59.5
60.0
60.5
61.0
06 07 08 09 10 11 12 13 14 15 16
s.a., %
CY
3
4
5
6
01 02 03 04 05 06 07 08 09 10 11 12 13 14 15 16
Unemployment rate
Structural unemployment rate
s.a., %
CY
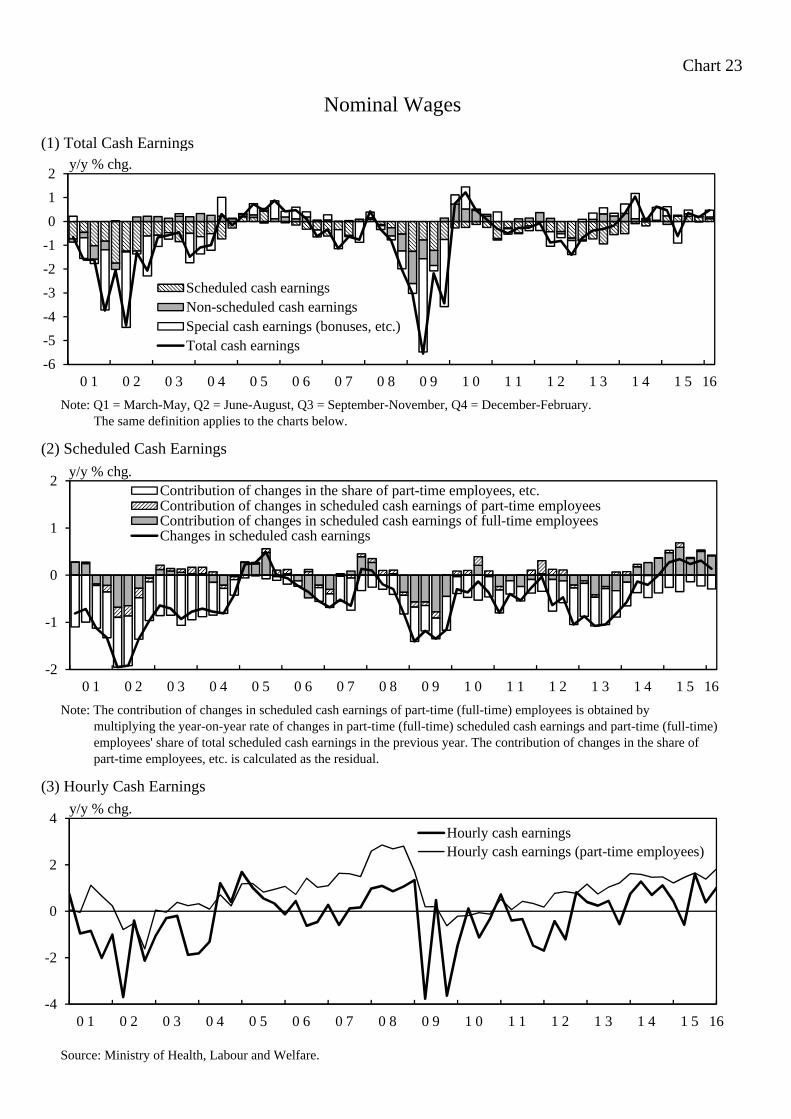
Chart 23
(1) Total Cash Earnings
Note: Q1 = March-May, Q2 = June-August, Q3 = September-November, Q4 = December-February. The same definition applies to the charts below.
(2) Scheduled Cash Earnings
Note: The contribution of changes in scheduled cash earnings of part-time (full-time) employees is obtained by multiplying the year-on-year rate of changes in part-time (full-time) scheduled cash earnings and part-time (full-time) employees' share of total scheduled cash earnings in the previous year. The contribution of changes in the share of part-time employees, etc. is calculated as the residual.
(3) Hourly Cash Earnings
Source: Ministry of Health, Labour and Welfare.
Nominal Wages
-2
-1
0
1
2
0 1 0 2 0 3 0 4 0 5 0 6 0 7 0 8 0 9 1 0 1 1 1 2 1 3 1 4 1 5 16
Contribution of changes in the share of part-time employees, etc.Contribution of changes in scheduled cash earnings of part-time employeesContribution of changes in scheduled cash earnings of full-time employeesChanges in scheduled cash earnings
y/y % chg.
-6
-5
-4
-3
-2
-1
0
1
2
0 1 0 2 0 3 0 4 0 5 0 6 0 7 0 8 0 9 1 0 1 1 1 2 1 3 1 4 1 5 16
Scheduled cash earningsNon-scheduled cash earningsSpecial cash earnings (bonuses, etc.)Total cash earnings
y/y % chg.
-4
-2
0
2
4
0 1 0 2 0 3 0 4 0 5 0 6 0 7 0 8 0 9 1 0 1 1 1 2 1 3 1 4 1 5 16
Hourly cash earningsHourly cash earnings (part-time employees)
y/y % chg.
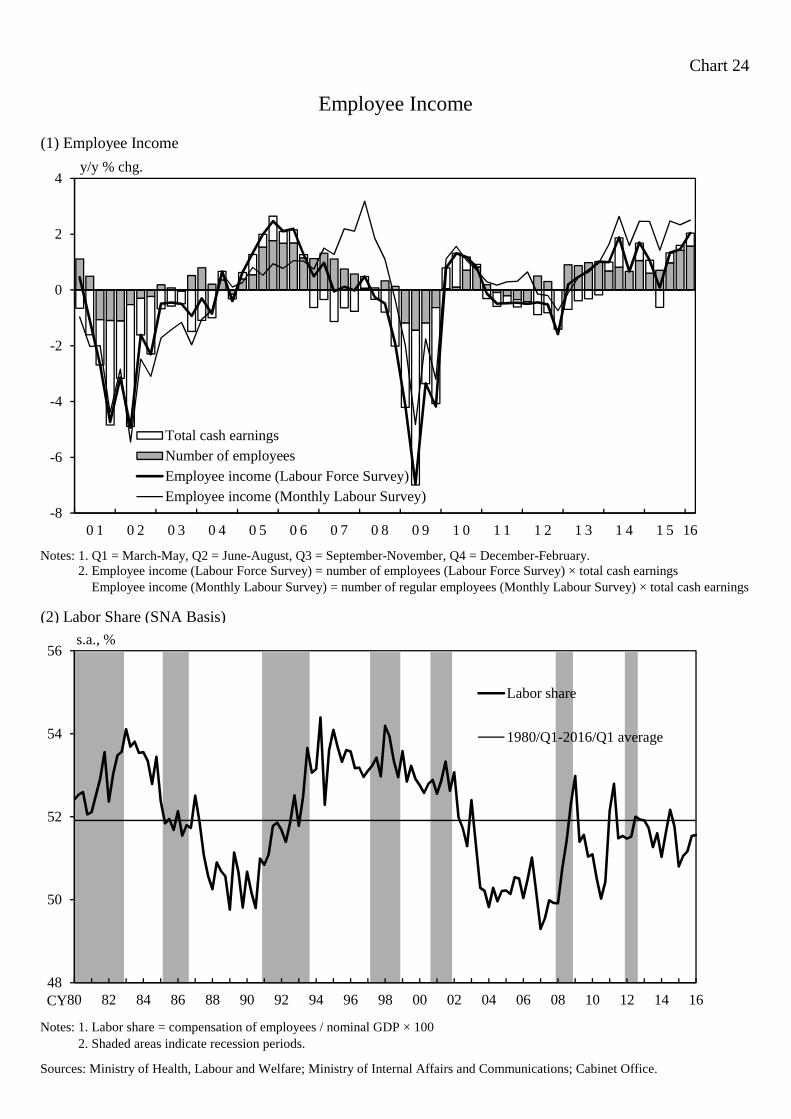
Chart 24
(1) Employee Income
Notes: 1. Q1 = March-May, Q2 = June-August, Q3 = September-November, Q4 = December-February. Notes: 2. Employee income (Labour Force Survey) = number of employees (Labour Force Survey) × total cash earningsNotes: 2. Employee income (Monthly Labour Survey) = number of regular employees (Monthly Labour Survey) × total cash earnings
(2) Labor Share (SNA Basis)
Notes: 1. Labor share = compensation of employees / nominal GDP × 100Notes: 2. Shaded areas indicate recession periods.
Sources: Ministry of Health, Labour and Welfare; Ministry of Internal Affairs and Communications; Cabinet Office.
Employee Income
-8
-6
-4
-2
0
2
4
0 1 0 2 0 3 0 4 0 5 0 6 0 7 0 8 0 9 1 0 1 1 1 2 1 3 1 4 1 5 16
Total cash earningsNumber of employees
Employee income (Labour Force Survey)Employee income (Monthly Labour Survey)
y/y % chg.
48
50
52
54
56
80 82 84 86 88 90 92 94 96 98 00 02 04 06 08 10 12 14 16
Labor share
1980/Q1-2016/Q1 average
s.a., %
CY
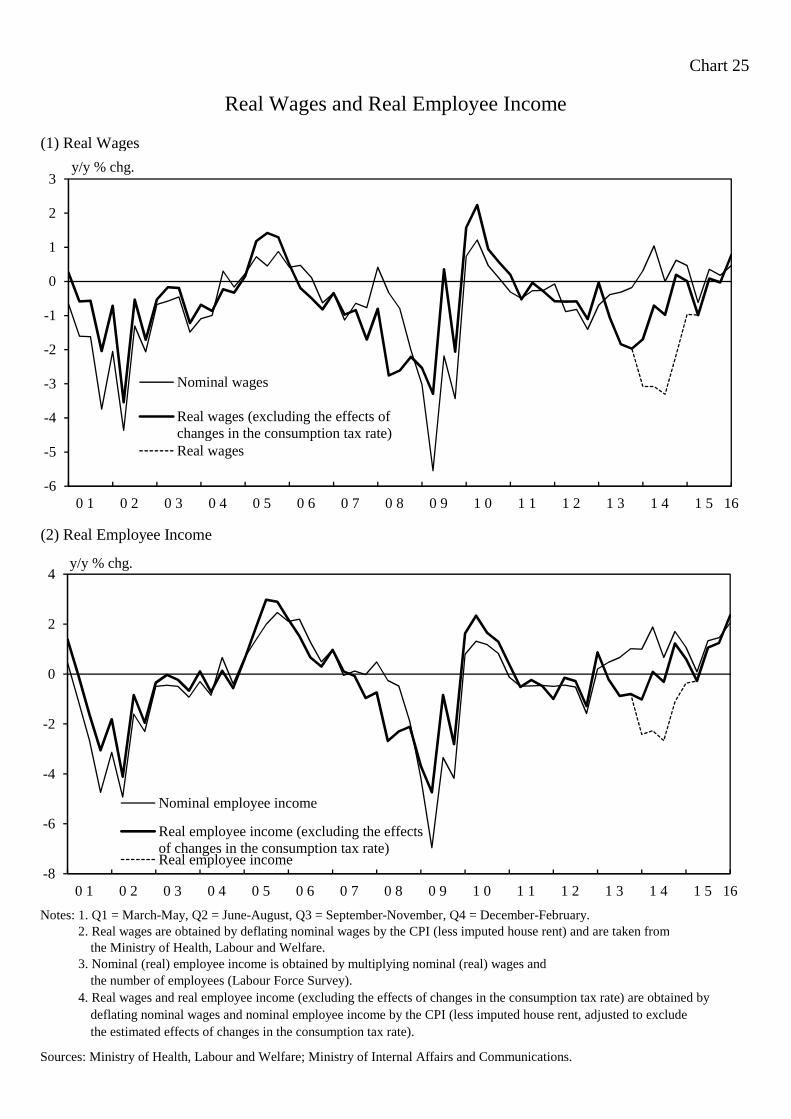
Chart 25
(1) Real Wages
(2) Real Employee Income
Notes: 1. Q1 = March-May, Q2 = June-August, Q3 = September-November, Q4 = December-February.Notes: 2. Real wages are obtained by deflating nominal wages by the CPI (less imputed house rent) and are taken from the Ministry of Health, Labour and Welfare.Notes: 3. Nominal (real) employee income is obtained by multiplying nominal (real) wages and the number of employees (Labour Force Survey).Notes: 4. Real wages and real employee income (excluding the effects of changes in the consumption tax rate) are obtained by deflating nominal wages and nominal employee income by the CPI (less imputed house rent, adjusted to exclude the estimated effects of changes in the consumption tax rate).
Sources: Ministry of Health, Labour and Welfare; Ministry of Internal Affairs and Communications.
Real Wages and Real Employee Income
-6
-5
-4
-3
-2
-1
0
1
2
3
0 1 0 2 0 3 0 4 0 5 0 6 0 7 0 8 0 9 1 0 1 1 1 2 1 3 1 4 1 5 16
Nominal wages
Real wages (excluding the effects ofchanges in the consumption tax rate)Real wages
y/y % chg.
-8
-6
-4
-2
0
2
4
0 1 0 2 0 3 0 4 0 5 0 6 0 7 0 8 0 9 1 0 1 1 1 2 1 3 1 4 1 5 16
Nominal employee income
Real employee income (excluding the effectsof changes in the consumption tax rate)Real employee income
y/y % chg.
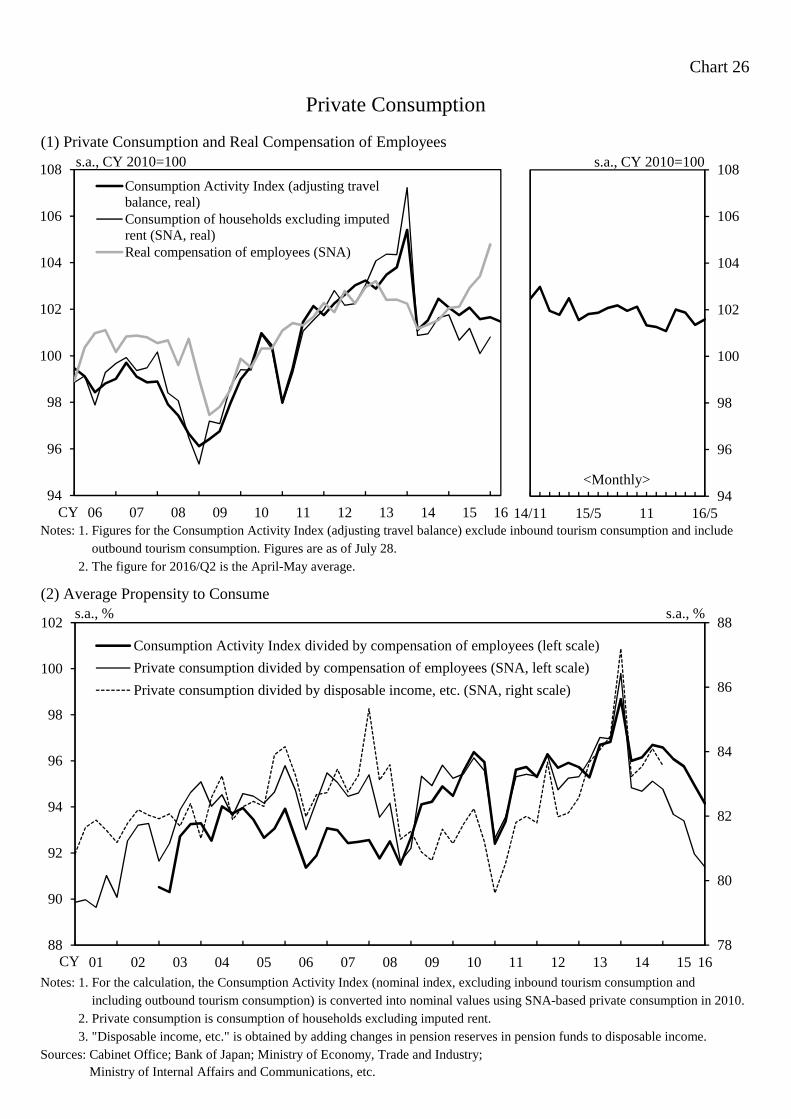
Chart 26
(1) Private Consumption and Real Compensation of Employees
Notes: 1. Figures for the Consumption Activity Index (adjusting travel balance) exclude inbound tourism consumption and includeNotes: 1. outbound tourism consumption. Figures are as of July 28.Notes: 2. The figure for 2016/Q2 is the April-May average.
(2) Average Propensity to Consume
Notes: 1. For the calculation, the Consumption Activity Index (nominal index, excluding inbound tourism consumption andNotes: 1. including outbound tourism consumption) is converted into nominal values using SNA-based private consumption in 2010.Notes: 2. Private consumption is consumption of households excluding imputed rent.Notes: 3. "Disposable income, etc." is obtained by adding changes in pension reserves in pension funds to disposable income.Sources: Cabinet Office; Bank of Japan; Ministry of Economy, Trade and Industry;Sources: Ministry of Internal Affairs and Communications, etc.
Private Consumption
94
96
98
100
102
104
106
108
06 07 08 09 10 11 12 13 14 15 16
Consumption Activity Index (adjusting travelbalance, real)Consumption of households excluding imputedrent (SNA, real)Real compensation of employees (SNA)
s.a., CY 2010=100
CY94
96
98
100
102
104
106
108
14/11 15/5 11 16/5
s.a., CY 2010=100
<Monthly>
78
80
82
84
86
88
88
90
92
94
96
98
100
102
01 02 03 04 05 06 07 08 09 10 11 12 13 14 15 16
Consumption Activity Index divided by compensation of employees (left scale)
Private consumption divided by compensation of employees (SNA, left scale)
Private consumption divided by disposable income, etc. (SNA, right scale)
s.a., % s.a., %
CY
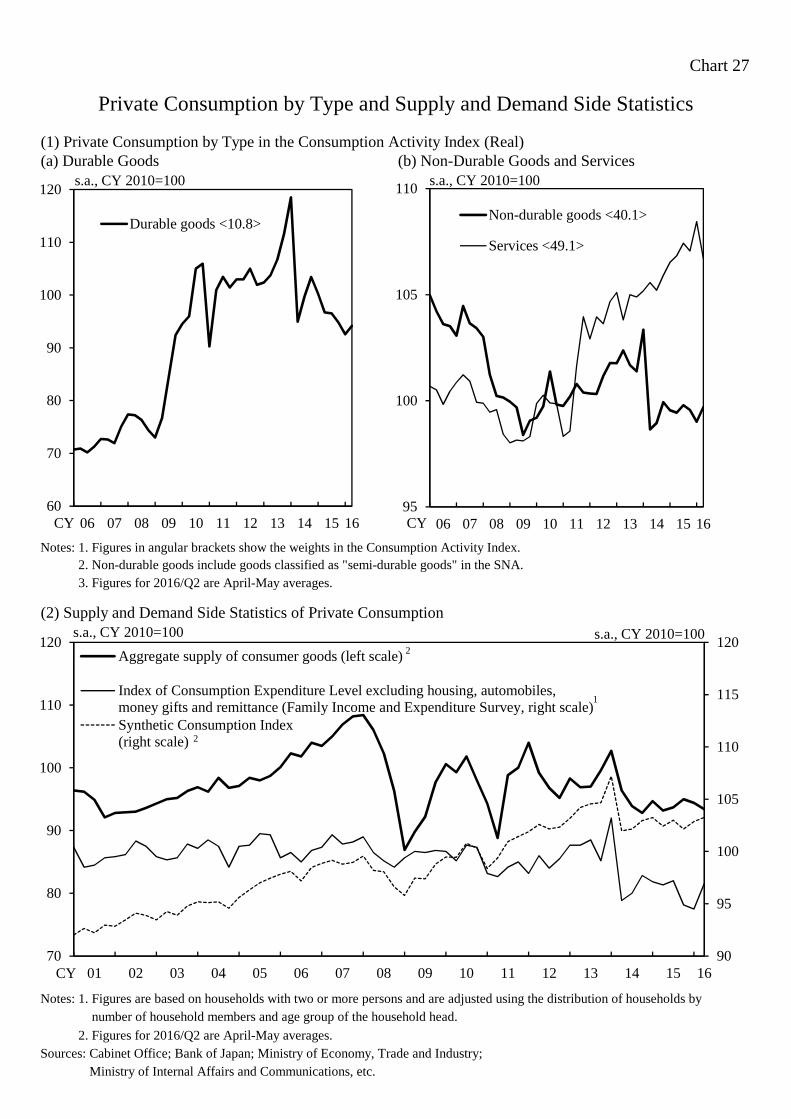
Chart 27
(1) Private Consumption by Type in the Consumption Activity Index (Real)(a) Durable Goods (b) Non-Durable Goods and Services
Notes: 1. Figures in angular brackets show the weights in the Consumption Activity Index.Notes: 2. Non-durable goods include goods classified as "semi-durable goods" in the SNA.Notes: 3. Figures for 2016/Q2 are April-May averages.
(2) Supply and Demand Side Statistics of Private Consumption
Notes: 1. Figures are based on households with two or more persons and are adjusted using the distribution of households byNotes: 1. number of household members and age group of the household head.
Notes: 2. Figures for 2016/Q2 are April-May averages.Sources: Cabinet Office; Bank of Japan; Ministry of Economy, Trade and Industry;Sources: Ministry of Internal Affairs and Communications, etc.
Private Consumption by Type and Supply and Demand Side Statistics
90
95
100
105
110
115
120
70
80
90
100
110
120
01 02 03 04 05 06 07 08 09 10 11 12 13 14 15 16
Aggregate supply of consumer goods (left scale)
Index of Consumption Expenditure Level excluding housing, automobiles,money gifts and remittance (Family Income and Expenditure Survey, right scale)Synthetic Consumption Index(right scale)
s.a., CY 2010=100 s.a., CY 2010=1002
1
CY
2
60
70
80
90
100
110
120
06 07 08 09 10 11 12 13 14 15 16
Durable goods <10.8>
CY
s.a., CY 2010=100
95
100
105
110
06 07 08 09 10 11 12 13 14 15 16
Non-durable goods <40.1>
Services <49.1>
CY
s.a., CY 2010=100
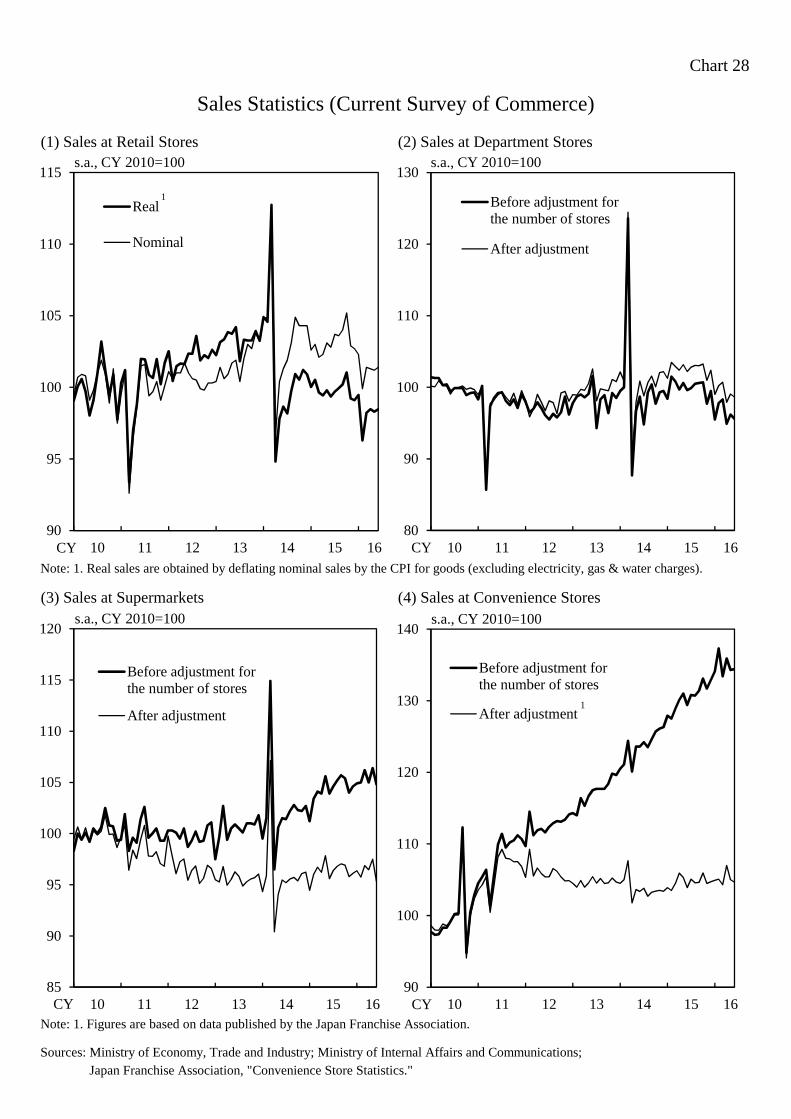
Chart 28
(1) Sales at Retail Stores (2) Sales at Department Stores
Note: 1. Real sales are obtained by deflating nominal sales by the CPI for goods (excluding electricity, gas & water charges).
(3) Sales at Supermarkets (4) Sales at Convenience Stores
Note: 1. Figures are based on data published by the Japan Franchise Association.
Sources: Ministry of Economy, Trade and Industry; Ministry of Internal Affairs and Communications;Sources: Japan Franchise Association, "Convenience Store Statistics."
Sales Statistics (Current Survey of Commerce)
80
90
100
110
120
130
10 11 12 13 14 15 16
Before adjustment forthe number of stores
After adjustment
s.a., CY 2010=100
CY90
95
100
105
110
115
10 11 12 13 14 15 16
Real
Nominal
s.a., CY 2010=100
CY
1
85
90
95
100
105
110
115
120
10 11 12 13 14 15 16
Before adjustment forthe number of stores
After adjustment
s.a., CY 2010=100
CY90
100
110
120
130
140
10 11 12 13 14 15 16
Before adjustment forthe number of stores
After adjustment
s.a., CY 2010=100
CY
1
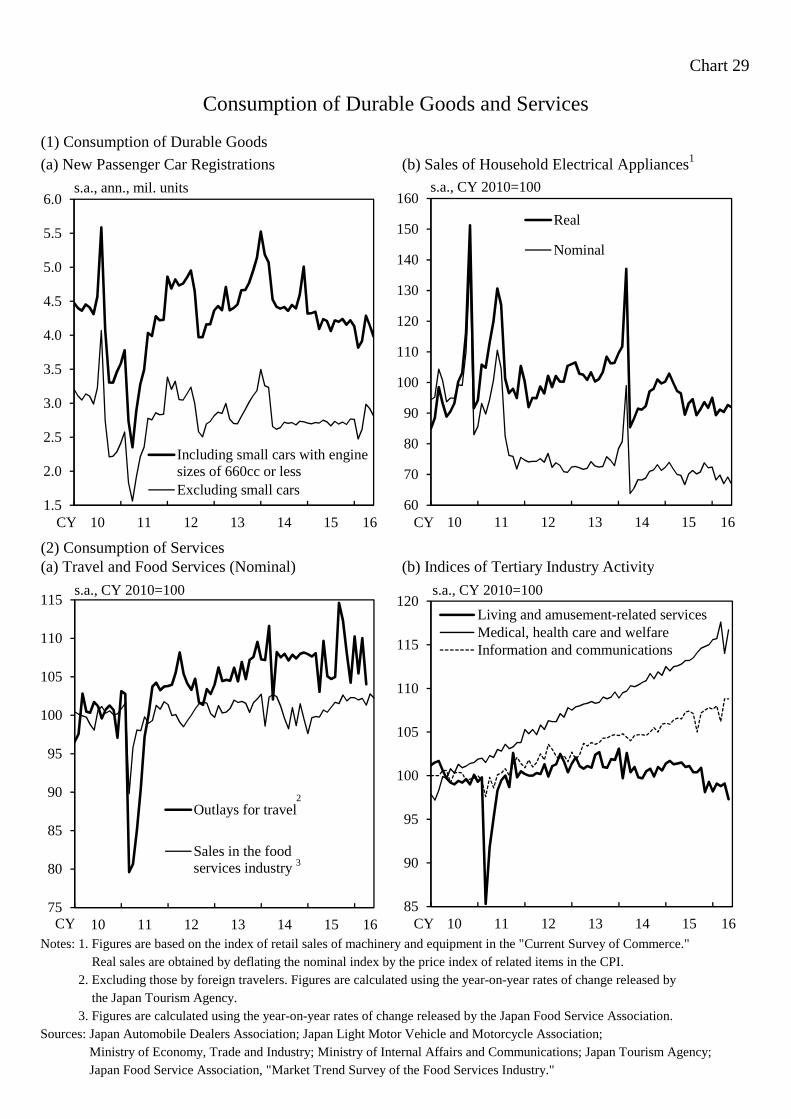
Chart 29
(1) Consumption of Durable Goods
(a) New Passenger Car Registrations (b) Sales of Household Electrical Appliances1
(2) Consumption of Services(a) Travel and Food Services (Nominal) (b) Indices of Tertiary Industry Activity
Notes: 1. Figures are based on the index of retail sales of machinery and equipment in the "Current Survey of Commerce."Notes: 1. Real sales are obtained by deflating the nominal index by the price index of related items in the CPI.Notes: 2. Excluding those by foreign travelers. Figures are calculated using the year-on-year rates of change released byNotes: 3. the Japan Tourism Agency.Notes: 3. Figures are calculated using the year-on-year rates of change released by the Japan Food Service Association.Sources: Japan Automobile Dealers Association; Japan Light Motor Vehicle and Motorcycle Association;Sources: Ministry of Economy, Trade and Industry; Ministry of Internal Affairs and Communications; Japan Tourism Agency;Sources: Japan Food Service Association, "Market Trend Survey of the Food Services Industry."
Consumption of Durable Goods and Services
75
80
85
90
95
100
105
110
115
10 11 12 13 14 15 16
Outlays for travel
Sales in the foodservices industry
s.a., CY 2010=100
CY
2
3
1.5
2.0
2.5
3.0
3.5
4.0
4.5
5.0
5.5
6.0
10 11 12 13 14 15 16
Including small cars with enginesizes of 660cc or lessExcluding small cars
s.a., ann., mil. units
CY
85
90
95
100
105
110
115
120
10 11 12 13 14 15 16
Living and amusement-related servicesMedical, health care and welfareInformation and communications
s.a., CY 2010=100
CY
60
70
80
90
100
110
120
130
140
150
160
10 11 12 13 14 15 16
Real
Nominal
s.a., CY 2010=100
CY
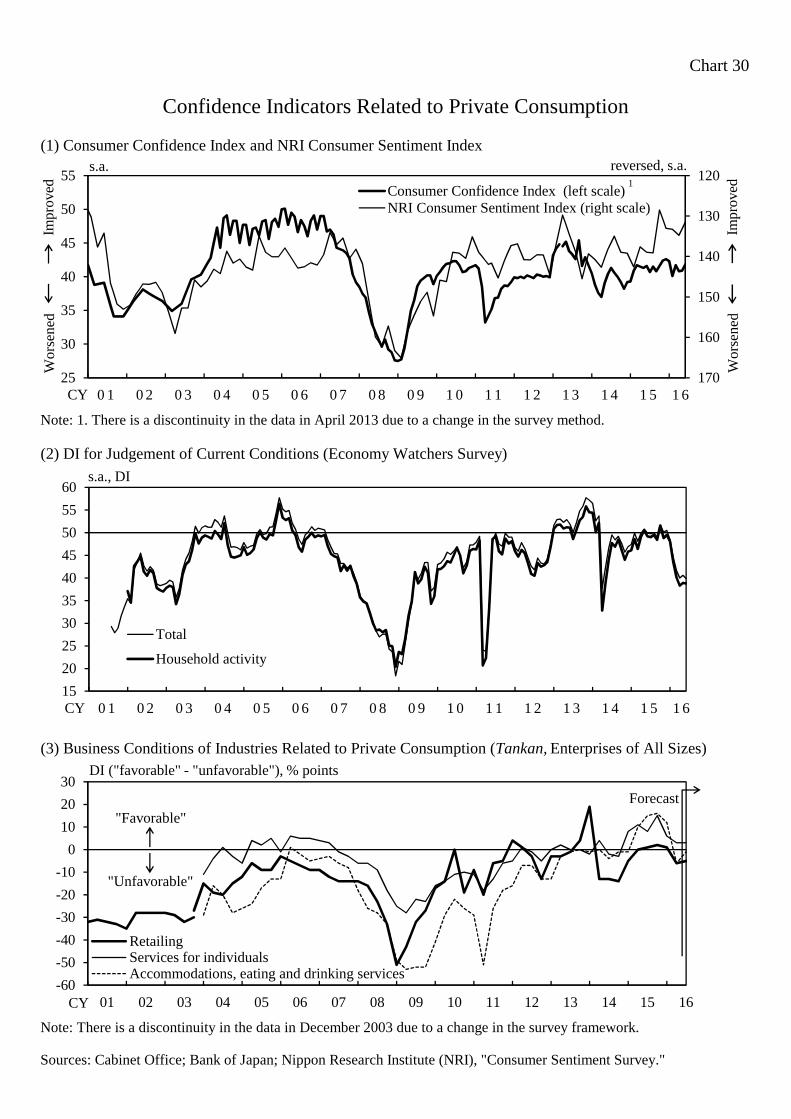
Chart 30
(1) Consumer Confidence Index and NRI Consumer Sentiment Index
Note: 1. There is a discontinuity in the data in April 2013 due to a change in the survey method.
(2) DI for Judgement of Current Conditions (Economy Watchers Survey)
(3) Business Conditions of Industries Related to Private Consumption (Tankan, Enterprises of All Sizes)
Note: There is a discontinuity in the data in December 2003 due to a change in the survey framework.
Sources: Cabinet Office; Bank of Japan; Nippon Research Institute (NRI), "Consumer Sentiment Survey."
Confidence Indicators Related to Private Consumption
120
130
140
150
160
17025
30
35
40
45
50
55
0 1 0 2 0 3 0 4 0 5 0 6 0 7 0 8 0 9 1 0 1 1 1 2 1 3 1 4 1 5 1 6
Consumer Confidence Index (left scale)NRI Consumer Sentiment Index (right scale)
s.a. reversed, s.a.1
CY
Impr
oved
Wor
sene
d
Impr
oved
Wor
sene
d
15
20
25
30
35
40
45
50
55
60
0 1 0 2 0 3 0 4 0 5 0 6 0 7 0 8 0 9 1 0 1 1 1 2 1 3 1 4 1 5 1 6
Total
Household activity
CY
s.a., DI
-60
-50
-40
-30
-20
-10
0
10
20
30
01 02 03 04 05 06 07 08 09 10 11 12 13 14 15 16
RetailingServices for individualsAccommodations, eating and drinking services
DI ("favorable" - "unfavorable"), % points
CY
"Favorable"
"Unfavorable"
Forecast
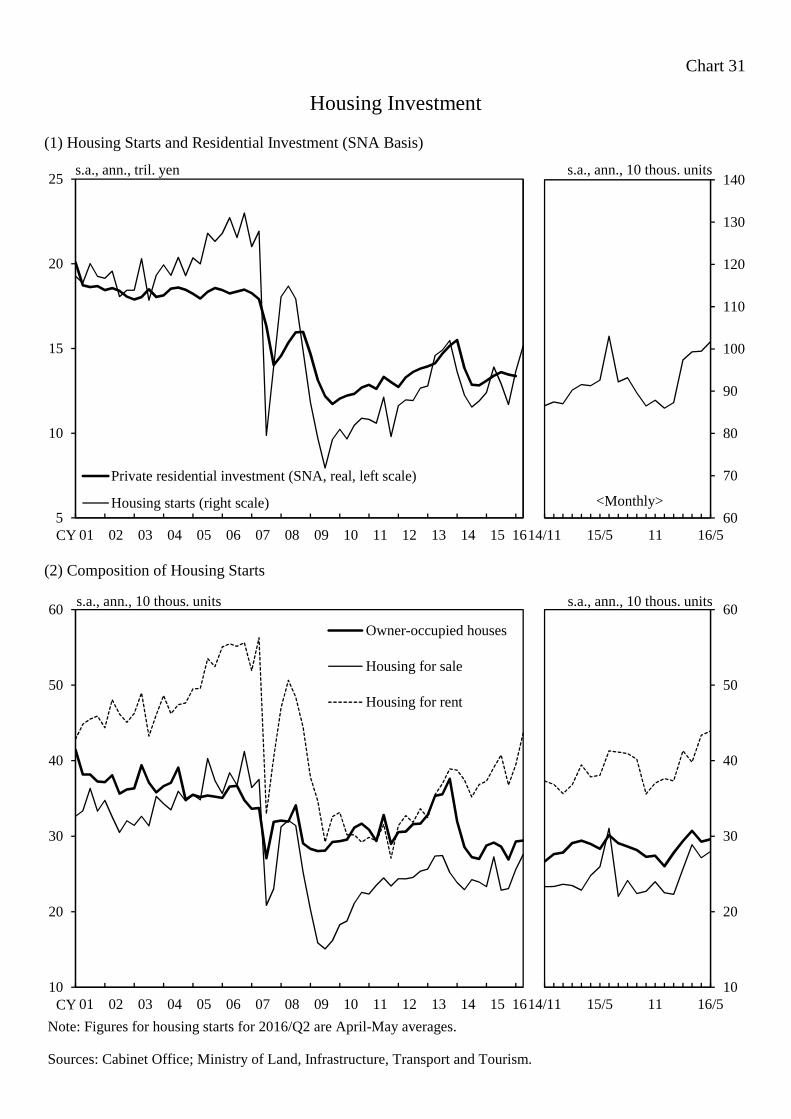
Chart 31
(1) Housing Starts and Residential Investment (SNA Basis)
(2) Composition of Housing Starts
Note: Figures for housing starts for 2016/Q2 are April-May averages.
Sources: Cabinet Office; Ministry of Land, Infrastructure, Transport and Tourism.
Housing Investment
10
20
30
40
50
60
01 02 03 04 05 06 07 08 09 10 11 12 13 14 15 16
Owner-occupied houses
Housing for sale
Housing for rent
s.a., ann., 10 thous. units
CY
5
10
15
20
25
01 02 03 04 05 06 07 08 09 10 11 12 13 14 15 16
Private residential investment (SNA, real, left scale)
Housing starts (right scale)
s.a., ann., tril. yen
CY60
70
80
90
100
110
120
130
140
14/11 15/5 11 16/5
s.a., ann., 10 thous. units
<Monthly>
10
20
30
40
50
60
14/11 15/5 11 16/5
s.a., ann., 10 thous. units
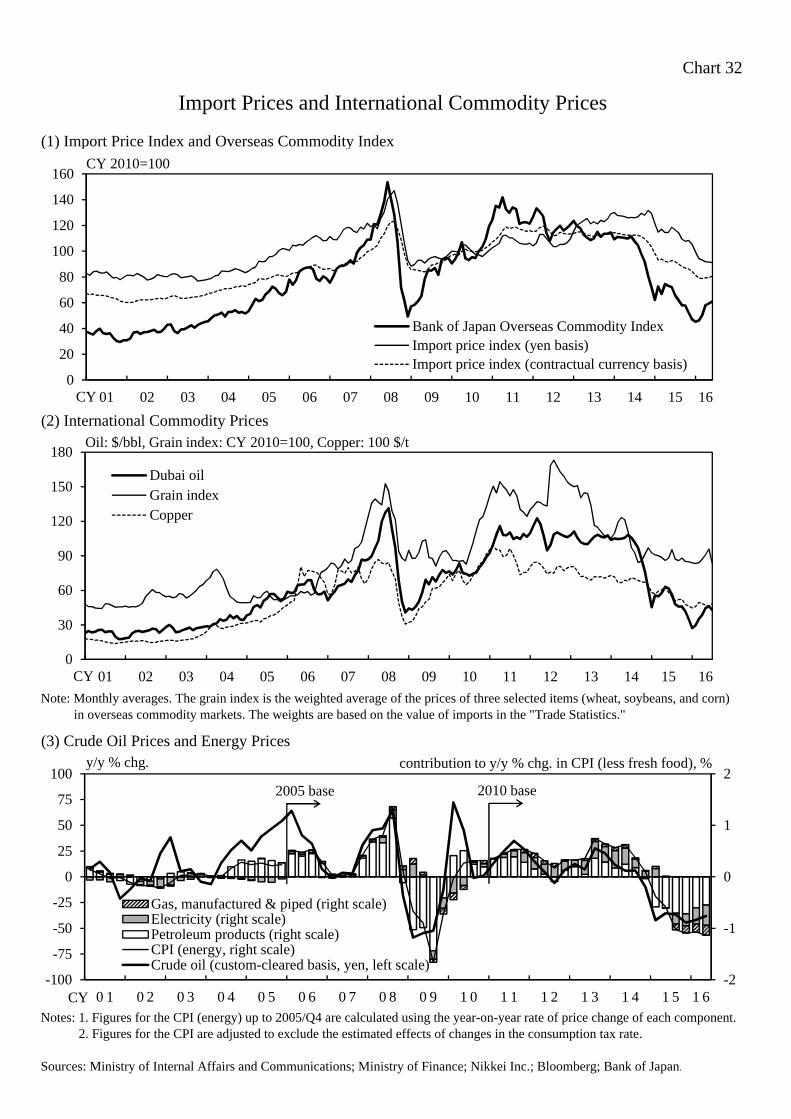
Chart 32
(1) Import Price Index and Overseas Commodity Index
(2) International Commodity Prices
Note: Monthly averages. The grain index is the weighted average of the prices of three selected items (wheat, soybeans, and corn) in overseas commodity markets. The weights are based on the value of imports in the "Trade Statistics."
(3) Crude Oil Prices and Energy Prices
Notes: 1. Figures for the CPI (energy) up to 2005/Q4 are calculated using the year-on-year rate of price change of each component.Notes: 2. Figures for the CPI are adjusted to exclude the estimated effects of changes in the consumption tax rate.
Sources: Ministry of Internal Affairs and Communications; Ministry of Finance; Nikkei Inc.; Bloomberg; Bank of Japan.
Import Prices and International Commodity Prices
0
30
60
90
120
150
180
01 02 03 04 05 06 07 08 09 10 11 12 13 14 15 16
Dubai oilGrain indexCopper
Oil: $/bbl, Grain index: CY 2010=100, Copper: 100 $/t
CY
0
20
40
60
80
100
120
140
160
01 02 03 04 05 06 07 08 09 10 11 12 13 14 15 16
Bank of Japan Overseas Commodity IndexImport price index (yen basis)Import price index (contractual currency basis)
CY 2010=100
CY
-2
-1
0
1
2
-100
-75
-50
-25
0
25
50
75
100
0 1 0 2 0 3 0 4 0 5 0 6 0 7 0 8 0 9 1 0 1 1 1 2 1 3 1 4 1 5 1 6
Gas, manufactured & piped (right scale)Electricity (right scale)Petroleum products (right scale)CPI (energy, right scale)Crude oil (custom-cleared basis, yen, left scale)
2005 base 2010 base
y/y % chg.
CY
contribution to y/y % chg. in CPI (less fresh food), %

Chart 33
(1) Producer Price Index
Notes: 1. Goods sensitive to exchange rates and overseas commodity prices: petroleum & coal products and nonferrous metals. Notes: 2. Iron & steel and construction goods: iron & steel, metal products, ceramic, stone & clay products, lumber & wood products, and scrap & waste.Notes: 3. Other materials: chemicals & related products, plastic products, textile products, and pulp, paper & related products.Notes: 4. Machinery: general purpose machinery, production machinery, business oriented machinery, electronic components & devices, electrical machinery & equipment, information & communications equipment, and transportation equipment. Notes: 5. Figures are adjusted to exclude the hike in electric power charges during the summer season from July to September.Notes: 6. Figures are adjusted to exclude the effects of changes in the consumption tax rate. The same applies to the charts below.
(2) Services Producer Price Index
Notes: 1. Selling, general and administrative expenses: information and communications (excluding newspapers and publishing), advertising services, other services (excluding plant engineering, and civil engineering and architectural services).Notes: 2. Domestic transportation: transportation and postal services (excluding international transportation and passenger transportation).Notes: 3. IT-related: leasing of computer and related equipment, and computer rental.Notes: 4. Fixed investment: leasing and rental (excluding IT-related), and civil engineering and architectural services.
Source: Bank of Japan.
Producer Price Index and Services Producer Price Index
-5
-4
-3
-2
-1
0
1
2
3
4
5
6
0 6 0 7 0 8 0 9 1 0 1 1 1 2 1 3 1 4 1 5 1 6
OthersElectric power, gas & waterGoods sensitive to exchange rates and overseasOther materialsIron & steel and construction goodsMachineryPPI (excluding extra charges for summer electricity)
q/q % chg.
2010 base
CY
commodity prices
-3
-2
-1
0
1
0 6 0 7 0 8 0 9 1 0 1 1 1 2 1 3 1 4 1 5 1 6
OthersReal estateIT-relatedFixed investmentDomestic transportationSelling, general and administrative expensesSPPI (excluding international transportation)
2010 base
y/y % chg.
CY
-2.5
-2.0
-1.5
-1.0
-0.5
0.0
0.5
1.0
15/6 9 12 16/3 6
3-month rate of change, %
<Monthly>
-0.5
0.0
0.5
1.0
15/6 9 12 16/3 6
y/y % chg.

Chart 34
(1) All Items (Less Fresh Food)
(2) Goods
(3) General Services
Notes: 1. Figures for goods exclude agricultural, aquatic & livestock products and electricity, manufactured & piped gas & water charges.Notes: 2. Figures for the CPI are adjusted to exclude the estimated effects of changes in the consumption tax rate.
Source: Ministry of Internal Affairs and Communications.
Consumer Price Index
-3
-2
-1
0
1
2
3
4
5
0 6 0 7 0 8 0 9 1 0 1 1 1 2 1 3 1 4 1 5 1 6
Public services and electricity, manufactured & piped gas & water chargesAgricultural, aquatic & livestock products (less fresh food)General servicesGoodsCPI (less fresh food)
y/y % chg.
CY
2010 base
-6
-4
-2
0
2
4
6
8
0 6 0 7 0 8 0 9 1 0 1 1 1 2 1 3 1 4 1 5 1 6
OthersFood productsClothes (including shirts, sweaters & underwear)Durable goodsPetroleum productsGoods
y/y % chg.
CY
2010 base
-0.8
-0.6
-0.4
-0.2
0.0
0.2
0.4
0.6
0.8
1.0
0 6 0 7 0 8 0 9 1 0 1 1 1 2 1 3 1 4 1 5 1 6
Meals outside the homeOther servicesHouse rent (private and imputed rent)General services
y/y % chg.
CY
2010 base
-1.0
-0.5
0.0
0.5
1.0
15/6 9 12 16/3 6
y/y % chg.
<Monthly>
-3
-2
-1
0
1
2
3
15/6 9 12 16/3 6
y/y % chg.
-0.4
-0.2
0.0
0.2
0.4
0.6
0.8
15/6 9 12 16/3 6
y/y % chg.
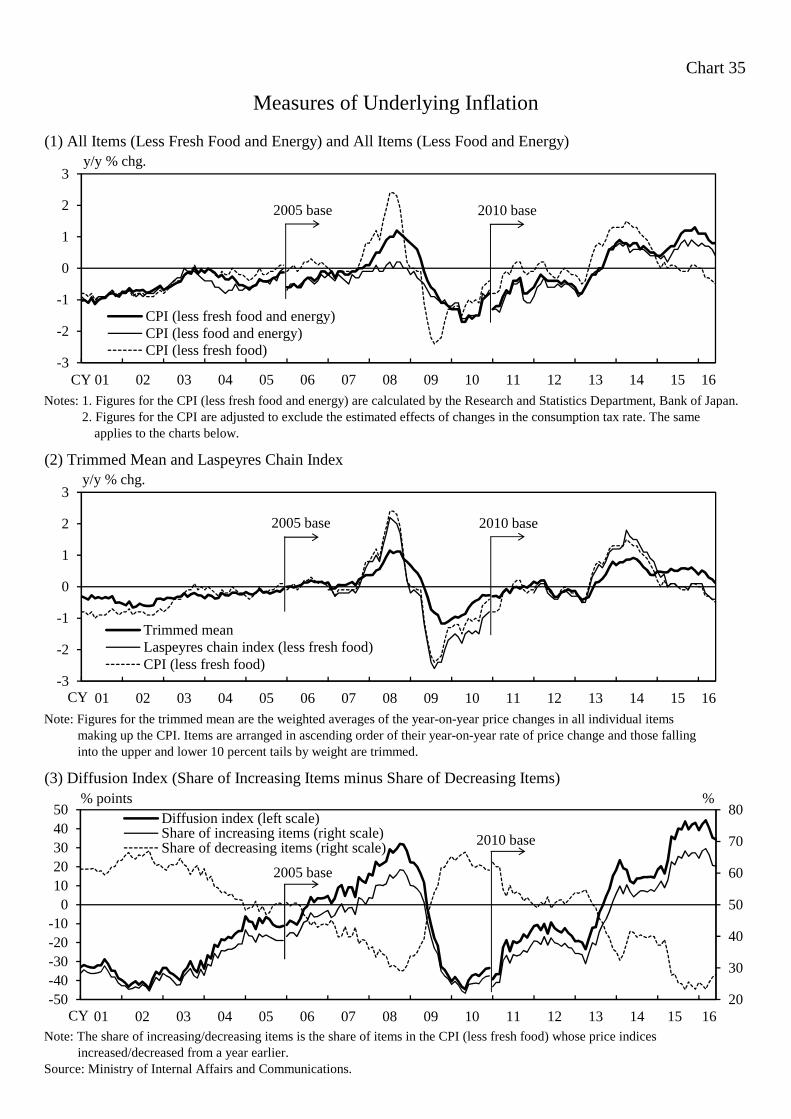
Chart 35
(1) All Items (Less Fresh Food and Energy) and All Items (Less Food and Energy)
Notes: 1. Figures for the CPI (less fresh food and energy) are calculated by the Research and Statistics Department, Bank of Japan.Notes: 2. Figures for the CPI are adjusted to exclude the estimated effects of changes in the consumption tax rate. The same applies to the charts below.
(2) Trimmed Mean and Laspeyres Chain Index
Note: Figures for the trimmed mean are the weighted averages of the year-on-year price changes in all individual items making up the CPI. Items are arranged in ascending order of their year-on-year rate of price change and those falling into the upper and lower 10 percent tails by weight are trimmed.
(3) Diffusion Index (Share of Increasing Items minus Share of Decreasing Items)
Note: The share of increasing/decreasing items is the share of items in the CPI (less fresh food) whose price indices increased/decreased from a year earlier.Source: Ministry of Internal Affairs and Communications.
Measures of Underlying Inflation
-3
-2
-1
0
1
2
3
01 02 03 04 05 06 07 08 09 10 11 12 13 14 15 16
Trimmed meanLaspeyres chain index (less fresh food)CPI (less fresh food)
2010 base
y/y % chg.
2005 base
CY
-3
-2
-1
0
1
2
3
01 02 03 04 05 06 07 08 09 10 11 12 13 14 15 16
CPI (less fresh food and energy)CPI (less food and energy)CPI (less fresh food)
2010 base
y/y % chg.
2005 base
CY
20
30
40
50
60
70
80
-50-40-30-20-10
01020304050
01 02 03 04 05 06 07 08 09 10 11 12 13 14 15 16
Diffusion index (left scale)Share of increasing items (right scale)Share of decreasing items (right scale) 2010 base
% points %
2005 base
CY
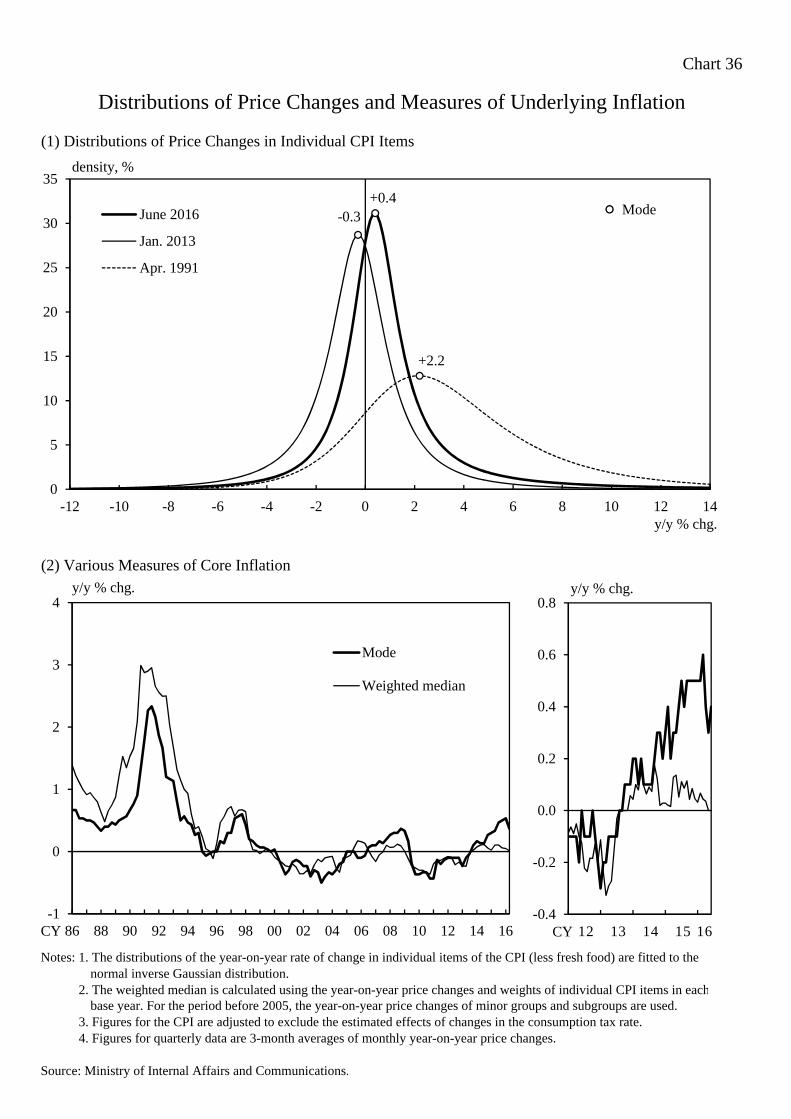
Chart 36
(1) Distributions of Price Changes in Individual CPI Items
(2) Various Measures of Core Inflation
Notes: 1. The distributions of the year-on-year rate of change in individual items of the CPI (less fresh food) are fitted to the normal inverse Gaussian distribution.Notes: 2. The weighted median is calculated using the year-on-year price changes and weights of individual CPI items in each base year. For the period before 2005, the year-on-year price changes of minor groups and subgroups are used.Notes: 3. Figures for the CPI are adjusted to exclude the estimated effects of changes in the consumption tax rate.Notes: 4. Figures for quarterly data are 3-month averages of monthly year-on-year price changes.
Source: Ministry of Internal Affairs and Communications.
Distributions of Price Changes and Measures of Underlying Inflation
-1
0
1
2
3
4
86 88 90 92 94 96 98 00 02 04 06 08 10 12 14 16
Mode
Weighted median
y/y % chg.
CY-0.4
-0.2
0.0
0.2
0.4
0.6
0.8
12 13 14 15 16
y/y % chg.
CY
0
5
10
15
20
25
30
35
-12 -10 -8 -6 -4 -2 0 2 4 6 8 10 12 14
June 2016
Jan. 2013
Apr. 1991
Mode
y/y % chg.
+0.4-0.3
+2.2
density, %
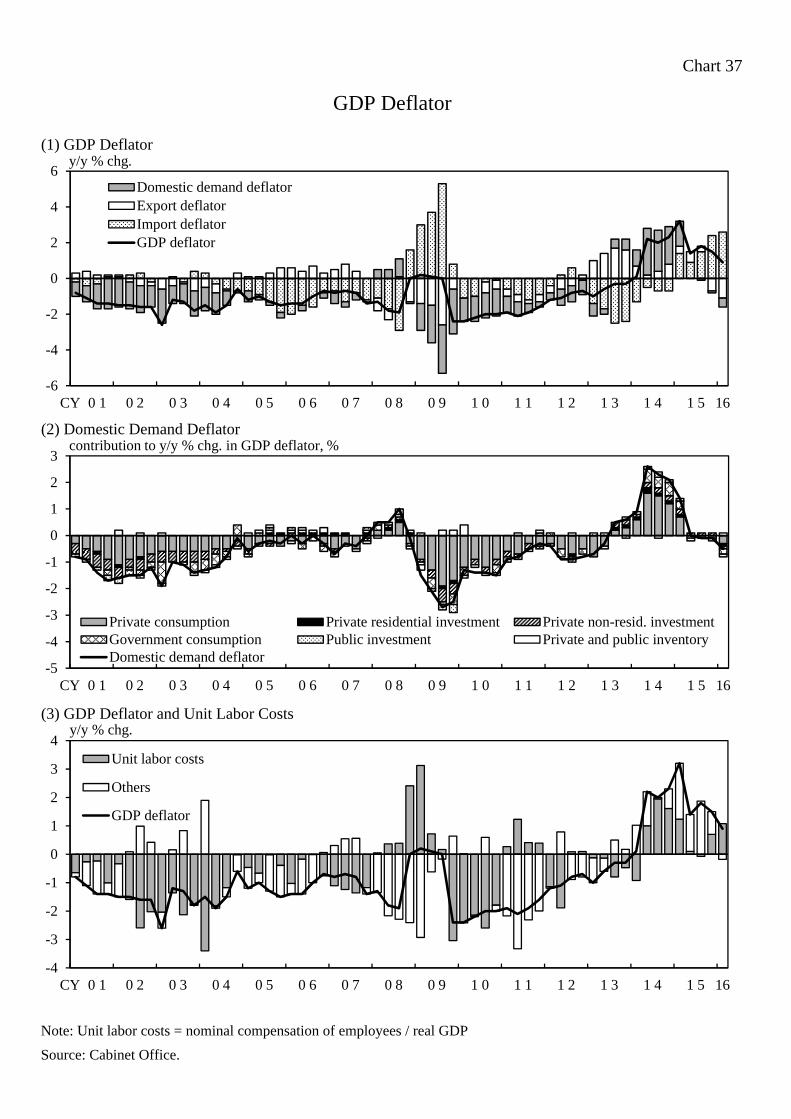
Chart 37
(1) GDP Deflator
(2) Domestic Demand Deflator
(3) GDP Deflator and Unit Labor Costs
Note: Unit labor costs = nominal compensation of employees / real GDP
Source: Cabinet Office.
GDP Deflator
-6
-4
-2
0
2
4
6
CY 0 1 0 2 0 3 0 4 0 5 0 6 0 7 0 8 0 9 1 0 1 1 1 2 1 3 1 4 1 5 16
Domestic demand deflatorExport deflatorImport deflatorGDP deflator
y/y % chg.
-5
-4
-3
-2
-1
0
1
2
3
CY 0 1 0 2 0 3 0 4 0 5 0 6 0 7 0 8 0 9 1 0 1 1 1 2 1 3 1 4 1 5 16
Private consumption Private residential investment Private non-resid. investmentGovernment consumption Public investment Private and public inventoryDomestic demand deflator
contribution to y/y % chg. in GDP deflator, %
-4
-3
-2
-1
0
1
2
3
4
CY 0 1 0 2 0 3 0 4 0 5 0 6 0 7 0 8 0 9 1 0 1 1 1 2 1 3 1 4 1 5 16
Unit labor costs
Others
GDP deflator
y/y % chg.
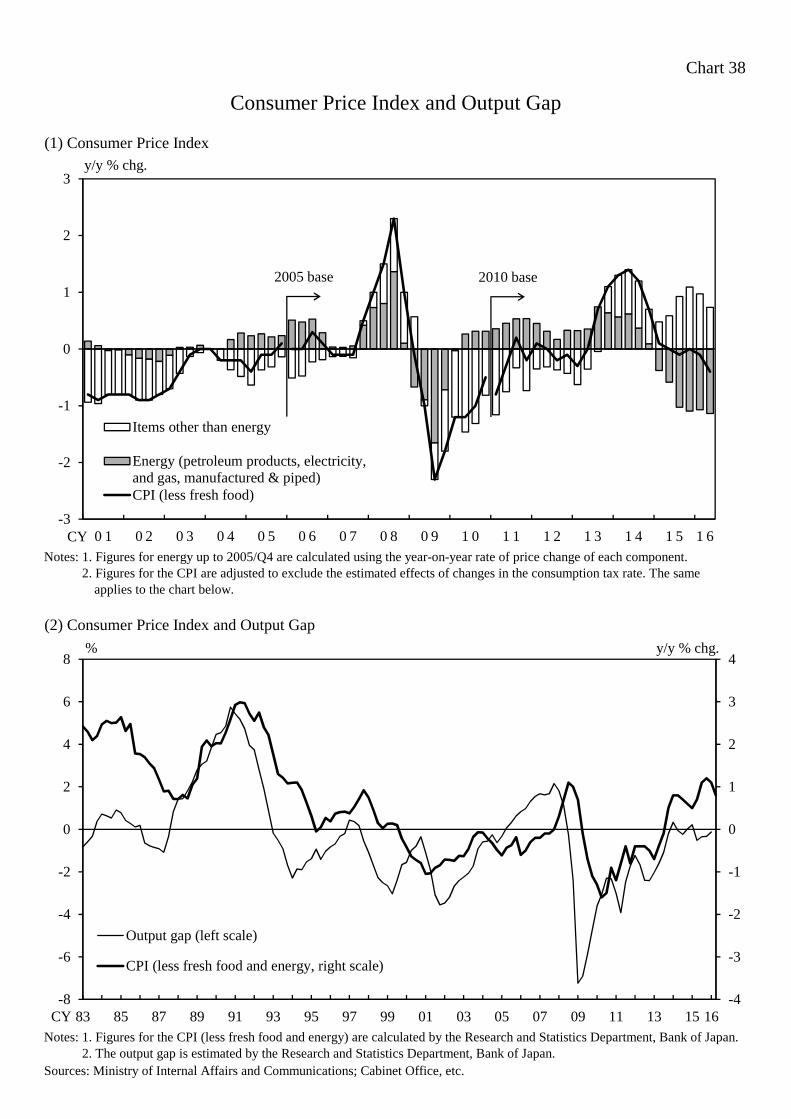
Chart 38
(1) Consumer Price Index
Notes: 1. Figures for energy up to 2005/Q4 are calculated using the year-on-year rate of price change of each component.Notes: 2. Figures for the CPI are adjusted to exclude the estimated effects of changes in the consumption tax rate. The same applies to the chart below.
(2) Consumer Price Index and Output Gap
Notes: 1. Figures for the CPI (less fresh food and energy) are calculated by the Research and Statistics Department, Bank of Japan.Notes: 2. The output gap is estimated by the Research and Statistics Department, Bank of Japan.Sources: Ministry of Internal Affairs and Communications; Cabinet Office, etc.
Consumer Price Index and Output Gap
-4
-3
-2
-1
0
1
2
3
4
-8
-6
-4
-2
0
2
4
6
8
83 85 87 89 91 93 95 97 99 01 03 05 07 09 11 13 15 16
Output gap (left scale)
CPI (less fresh food and energy, right scale)
y/y % chg.%
CY
-3
-2
-1
0
1
2
3
0 1 0 2 0 3 0 4 0 5 0 6 0 7 0 8 0 9 1 0 1 1 1 2 1 3 1 4 1 5 1 6
Items other than energy
Energy (petroleum products, electricity,and gas, manufactured & piped)CPI (less fresh food)
y/y % chg.
CY
2010 base2005 base
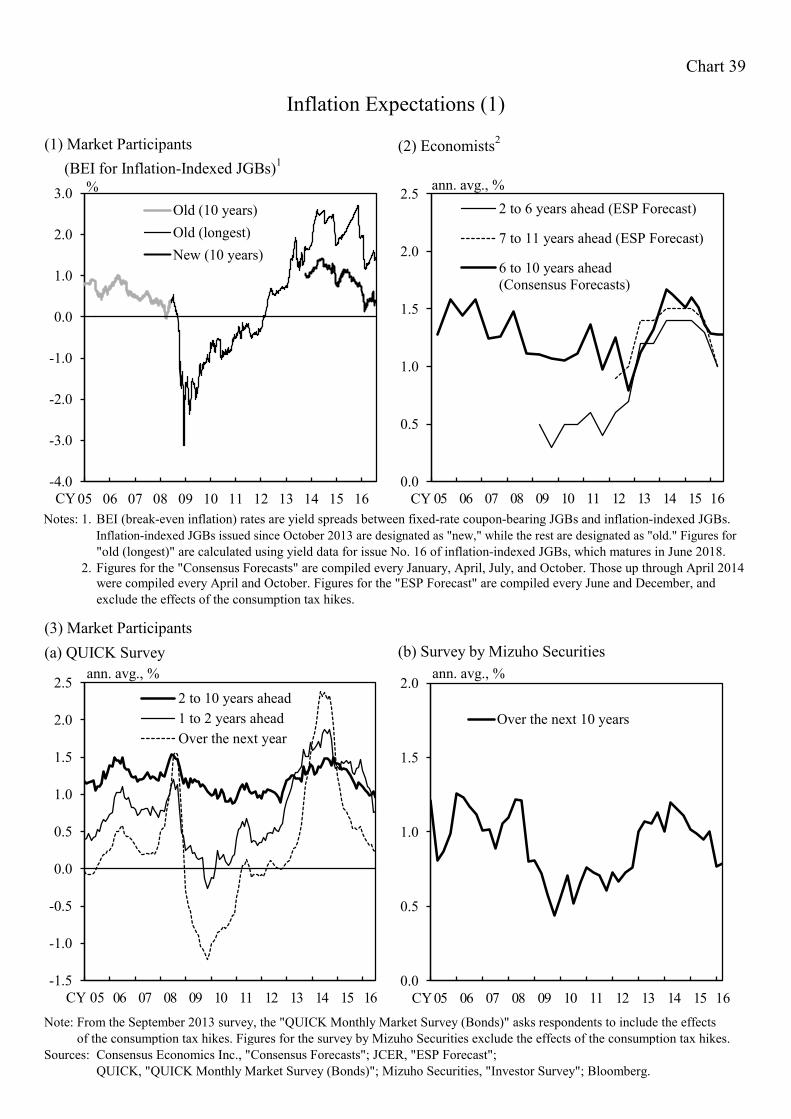
Chart 39
(1) Market Participants (2) Economists2
(BEI for Inflation-Indexed JGBs)1
Notes: 1. BEI (break-even inflation) rates are yield spreads between fixed-rate coupon-bearing JGBs and inflation-indexed JGBs.
2. Figures for the "Consensus Forecasts" are compiled every January, April, July, and October. Those up through April 2014 were compiled every April and October. Figures for the "ESP Forecast" are compiled every June and December, and exclude the effects of the consumption tax hikes.
(3) Market Participants(a) QUICK Survey (b) Survey by Mizuho Securities
Note: From the September 2013 survey, the "QUICK Monthly Market Survey (Bonds)" asks respondents to include the effects Note: of the consumption tax hikes. Figures for the survey by Mizuho Securities exclude the effects of the consumption tax hikes.Sources: Consensus Economics Inc., "Consensus Forecasts"; JCER, "ESP Forecast"; QUICK, "QUICK Monthly Market Survey (Bonds)"; Mizuho Securities, "Investor Survey"; Bloomberg.
Inflation Expectations (1)
Inflation-indexed JGBs issued since October 2013 are designated as "new," while the rest are designated as "old." Figures for"old (longest)" are calculated using yield data for issue No. 16 of inflation-indexed JGBs, which matures in June 2018.
-1.5
-1.0
-0.5
0.0
0.5
1.0
1.5
2.0
2.5
05 06 07 08 09 10 11 12 13 14 15 16
2 to 10 years ahead1 to 2 years aheadOver the next year
ann. avg., %
CY 05
0.0
0.5
1.0
1.5
2.0
2.5
05 06 07 08 09 10 11 12 13 14 15 16
2 to 6 years ahead (ESP Forecast)
7 to 11 years ahead (ESP Forecast)
6 to 10 years ahead(Consensus Forecasts)
ann. avg., %
CY
0.0
0.5
1.0
1.5
2.0
05 06 07 08 09 10 11 12 13 14 15 16
Over the next 10 years
ann. avg., %
CY
-4.0
-3.0
-2.0
-1.0
0.0
1.0
2.0
3.0
05 06 07 08 09 10 11 12 13 14 15 16
Old (10 years)Old (longest)New (10 years)
CY
%
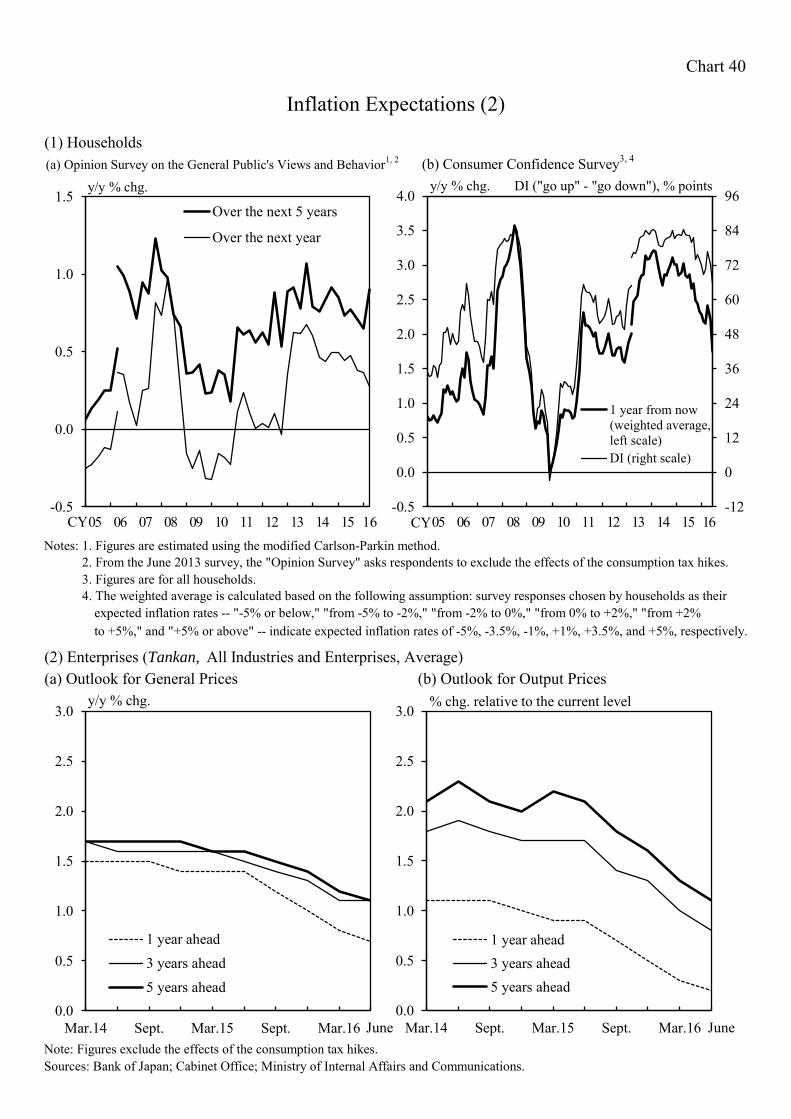
Chart 40
(1) Households (a) Opinion Survey on the General Public's Views and Behavior1, 2 (b) Consumer Confidence Survey3, 4
Notes: 1. Figures are estimated using the modified Carlson-Parkin method.
(2) Enterprises (Tankan, All Industries and Enterprises, Average)(a) Outlook for General Prices (b) Outlook for Output Prices
Sources: Bank of Japan; Cabinet Office; Ministry of Internal Affairs and Communications.
Inflation Expectations (2)
Notes: 2. From the June 2013 survey, the "Opinion Survey" asks respondents to exclude the effects of the consumption tax hikes.Notes: 3. Figures are for all households.Notes: 4. The weighted average is calculated based on the following assumption: survey responses chosen by households as their expected inflation rates -- "-5% or below," "from -5% to -2%," "from -2% to 0%," "from 0% to +2%," "from +2% to +5%," and "+5% or above" -- indicate expected inflation rates of -5%, -3.5%, -1%, +1%, +3.5%, and +5%, respectively.
Note: Figures exclude the effects of the consumption tax hikes.
-0.5
0.0
0.5
1.0
1.5
05 06 07 08 09 10 11 12 13 14 15 16
Over the next 5 years
Over the next year
y/y % chg.
CY -12
0
12
24
36
48
60
72
84
96
-0.5
0.0
0.5
1.0
1.5
2.0
2.5
3.0
3.5
4.0
05 06 07 08 09 10 11 12 13 14 15 16
1 year from now(weighted average,left scale)DI (right scale)
y/y % chg. DI ("go up" - "go down"), % points
CY
0.0
0.5
1.0
1.5
2.0
2.5
3.0
Mar.14 Sept. Mar.15 Sept. Mar.16
1 year ahead3 years ahead5 years ahead
y/y % chg.
0.0
0.5
1.0
1.5
2.0
2.5
3.0
Mar.14 Sept. Mar.15 Sept. Mar.16
1 year ahead3 years ahead5 years ahead
% chg. relative to the current level
June June
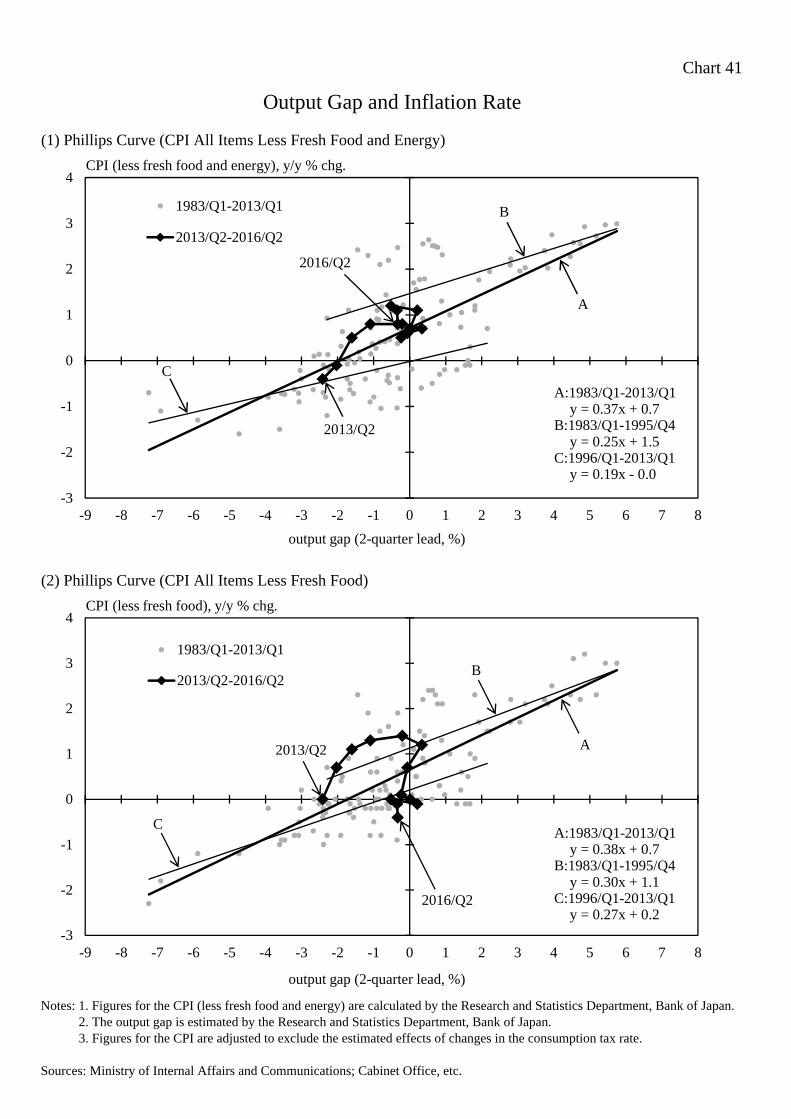
Chart 41
(1) Phillips Curve (CPI All Items Less Fresh Food and Energy)
(2) Phillips Curve (CPI All Items Less Fresh Food)
Notes: 1. Figures for the CPI (less fresh food and energy) are calculated by the Research and Statistics Department, Bank of Japan.Notes: 2. The output gap is estimated by the Research and Statistics Department, Bank of Japan.Notes: 3. Figures for the CPI are adjusted to exclude the estimated effects of changes in the consumption tax rate.
Sources: Ministry of Internal Affairs and Communications; Cabinet Office, etc.
Output Gap and Inflation Rate
-3
-2
-1
0
1
2
3
4
-9 -8 -7 -6 -5 -4 -3 -2 -1 0 1 2 3 4 5 6 7 8
1983/Q1-2013/Q1
2013/Q2-2016/Q2
2016/Q2
C
B
A2013/Q2
CPI (less fresh food), y/y % chg.
output gap (2-quarter lead, %)
-3
-2
-1
0
1
2
3
4
-9 -8 -7 -6 -5 -4 -3 -2 -1 0 1 2 3 4 5 6 7 8
1983/Q1-2013/Q1
2013/Q2-2016/Q2
2016/Q2
A
B
C
2013/Q2
CPI (less fresh food and energy), y/y % chg.
output gap (2-quarter lead, %)
A:1983/Q1-2013/Q1y = 0.37x + 0.7
B:1983/Q1-1995/Q4y = 0.25x + 1.5
C:1996/Q1-2013/Q1y = 0.19x - 0.0
A:1983/Q1-2013/Q1y = 0.38x + 0.7
B:1983/Q1-1995/Q4y = 0.30x + 1.1
C:1996/Q1-2013/Q1y = 0.27x + 0.2
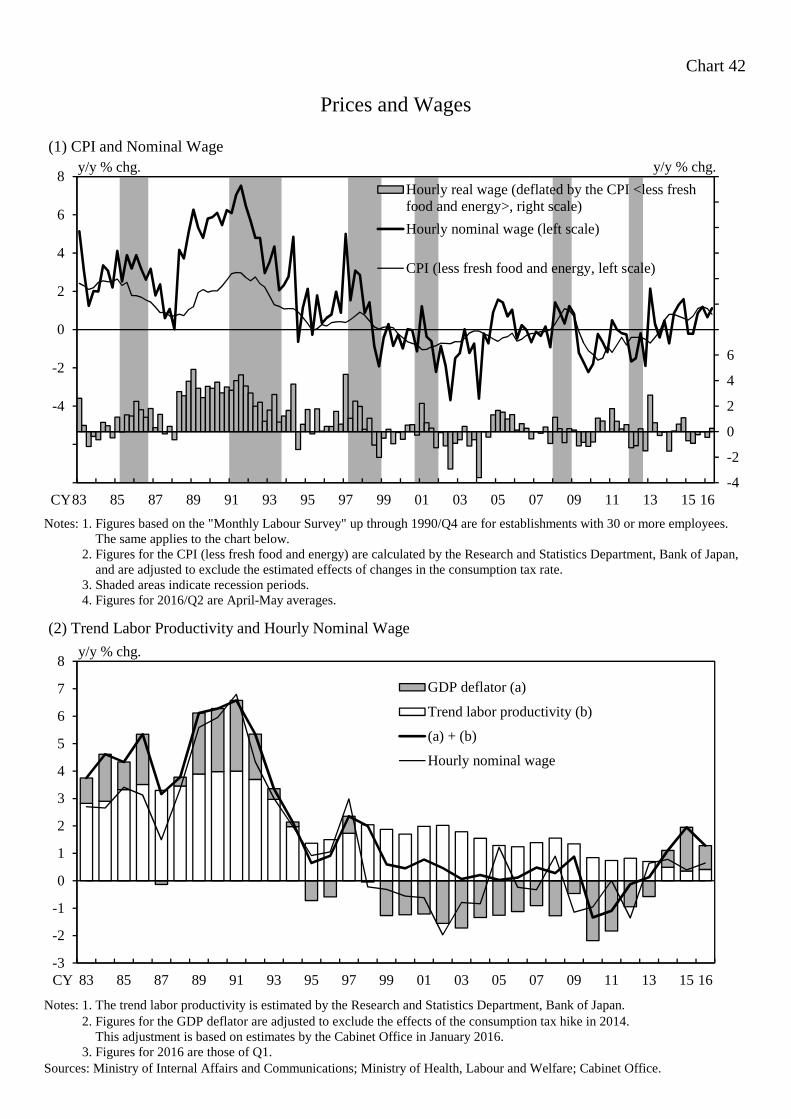
Chart 42
(1) CPI and Nominal Wage
Notes: 1. Figures based on the "Monthly Labour Survey" up through 1990/Q4 are for establishments with 30 or more employees.Notes: 1. The same applies to the chart below.Notes: 2. Figures for the CPI (less fresh food and energy) are calculated by the Research and Statistics Department, Bank of Japan,Notes: 2. and are adjusted to exclude the estimated effects of changes in the consumption tax rate.Notes: 3. Shaded areas indicate recession periods.Notes: 4. Figures for 2016/Q2 are April-May averages.
(2) Trend Labor Productivity and Hourly Nominal Wage
Notes: 1. The trend labor productivity is estimated by the Research and Statistics Department, Bank of Japan.Notes: 2. Figures for the GDP deflator are adjusted to exclude the effects of the consumption tax hike in 2014.Notes: 2. This adjustment is based on estimates by the Cabinet Office in January 2016.Notes: 3. Figures for 2016 are those of Q1.Sources: Ministry of Internal Affairs and Communications; Ministry of Health, Labour and Welfare; Cabinet Office.
Prices and Wages
-4
-2
0
2
4
6
-4
-2
0
2
4
6
8
83 85 87 89 91 93 95 97 99 01 03 05 07 09 11 13 15 16
Hourly real wage (deflated by the CPI <less freshfood and energy>, right scale)
Hourly nominal wage (left scale)
CPI (less fresh food and energy, left scale)
y/y % chg. y/y % chg.
CY
-3
-2
-1
0
1
2
3
4
5
6
7
8
83 85 87 89 91 93 95 97 99 01 03 05 07 09 11 13 15 16
GDP deflator (a)
Trend labor productivity (b)
(a) + (b)
Hourly nominal wage
CY
y/y % chg.
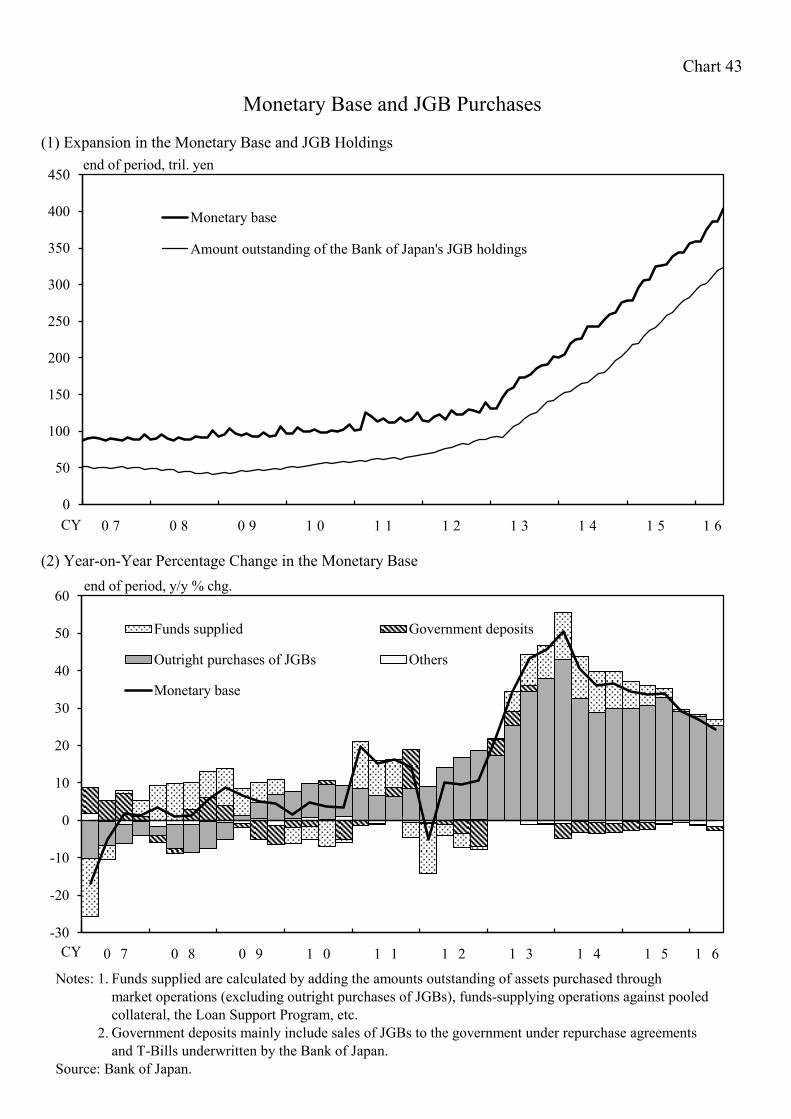
Chart 43
(1) Expansion in the Monetary Base and JGB Holdings
(2) Year-on-Year Percentage Change in the Monetary Base
Notes: 1. Funds supplied are calculated by adding the amounts outstanding of assets purchased through market operations (excluding outright purchases of JGBs), funds-supplying operations against pooled collateral, the Loan Support Program, etc.
Notes: 2. Government deposits mainly include sales of JGBs to the government under repurchase agreements and T-Bills underwritten by the Bank of Japan.
Source: Bank of Japan.
Monetary Base and JGB Purchases
-30
-20
-10
0
10
20
30
40
50
60
0 7 0 8 0 9 1 0 1 1 1 2 1 3 1 4 1 5 1 6
Funds supplied Government deposits
Outright purchases of JGBs Others
Monetary base
end of period, y/y % chg.
CY
0 7 0 8 0 9 1 0 1 1 1 2 1 3 1 4 1 5 1 60
50
100
150
200
250
300
350
400
450
Monetary base
Amount outstanding of the Bank of Japan's JGB holdings
end of period, tril. yen
CY
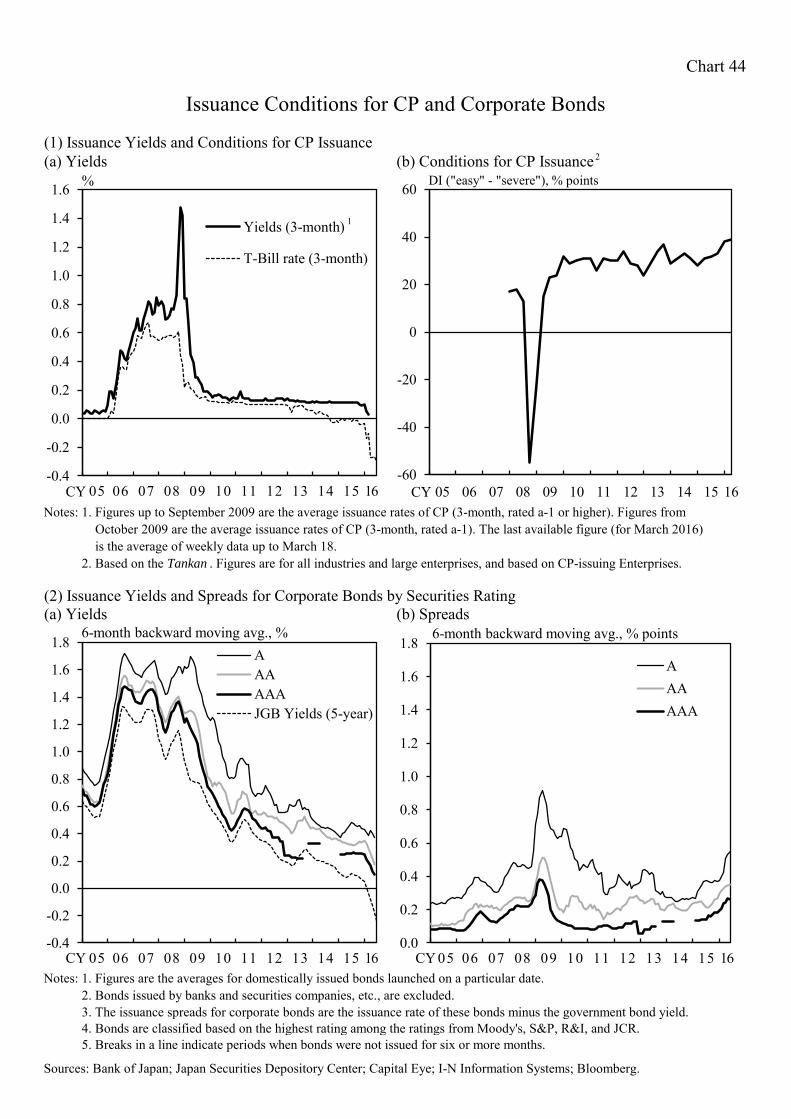
Chart 44
(1) Issuance Yields and Conditions for CP Issuance(a) Yields (b) Conditions for CP Issuance
Notes: 1. Figures up to September 2009 are the average issuance rates of CP (3-month, rated a-1 or higher). Figures from Notes: 1. October 2009 are the average issuance rates of CP (3-month, rated a-1). The last available figure (for March 2016)Notes: 1 is the average of weekly data up to March 18.Notes: 2. Based on the Tankan . Figures are for all industries and large enterprises, and based on CP-issuing Enterprises.
(2) Issuance Yields and Spreads for Corporate Bonds by Securities Rating(a) Yields (b) Spreads
Notes: 1. Figures are the averages for domestically issued bonds launched on a particular date. Notes: 2. Bonds issued by banks and securities companies, etc., are excluded.Notes: 3. The issuance spreads for corporate bonds are the issuance rate of these bonds minus the government bond yield.Notes: 4. Bonds are classified based on the highest rating among the ratings from Moody's, S&P, R&I, and JCR.Notes: 5. Breaks in a line indicate periods when bonds were not issued for six or more months.
Sources: Bank of Japan; Japan Securities Depository Center; Capital Eye; I-N Information Systems; Bloomberg.
Issuance Conditions for CP and Corporate Bonds
0.0
0.2
0.4
0.6
0.8
1.0
1.2
1.4
1.6
1.8
05 06 07 08 09 10 11 12 13 14 15 16
AAAAAA
6-month backward moving avg., % points
CY -0.4
-0.2
0.0
0.2
0.4
0.6
0.8
1.0
1.2
1.4
1.6
1.8
05 06 07 08 09 10 11 12 13 14 15 16
AAAAAAJGB Yields (5-year)
6-month backward moving avg., %
CY
-0.4
-0.2
0.0
0.2
0.4
0.6
0.8
1.0
1.2
1.4
1.6
05 06 07 08 09 10 11 12 13 14 15 16
Yields (3-month)
T-Bill rate (3-month)
%
CY
1
-60
-40
-20
0
20
40
60
05 06 07 08 09 10 11 12 13 14 15 16
DI ("easy" - "severe"), % points
CY
2

Chart 45
(1) Average Contract Interest Rates on New Loans and Discounts
(2) ROA and Interest Rate
Notes: 1. Figures are taken from the "Financial Statements Statistics of Corporations by Industry, Quarterly," and are thetotal for enterprises of all sizes and in all industries. The finance and insurance industry is excluded.
2. Interest-bearing debt is the sum of long- and short-term borrowings, corporate bonds, and bills receivable discounted outstanding.
Sources: Bank of Japan; Ministry of Finance.
Bank Lending Rates
0.6
0.8
1.0
1.2
1.4
1.6
1.8
2.0
0 5 0 6 0 7 0 8 0 9 1 0 1 1 1 2 1 3 1 4 1 5 1 6
Short-term
Long-term
6-month backward moving avg., %
CY
0
1
2
3
4
5
6
7
8
85 87 89 91 93 95 97 99 01 03 05 07 09 11 13 15 16
ROA (operating profits / total assets)
Interest rate (interest expense / interest-bearing debt)
s.a., ann., %
CY
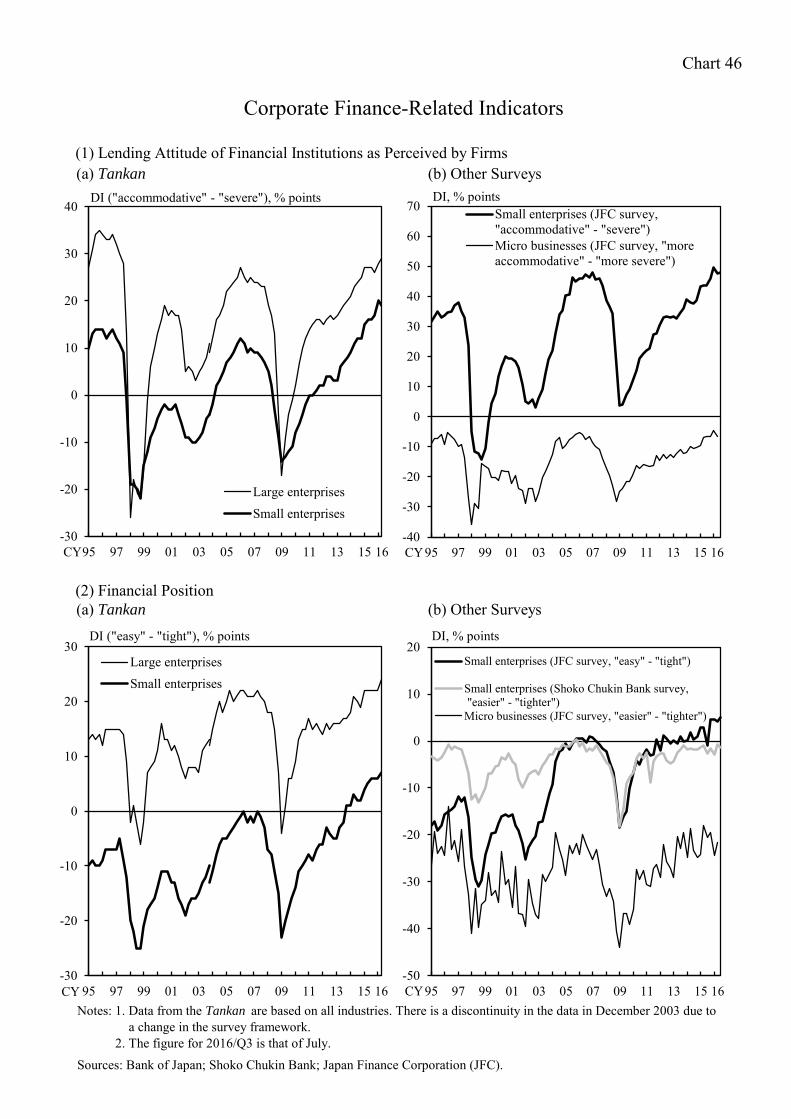
Chart 46
(1) Lending Attitude of Financial Institutions as Perceived by Firms (a) Tankan (b) Other Surveys
(2) Financial Position (a) Tankan (b) Other Surveys
Notes: 1. Data from the "Tankan" are based on all industries. There is a discontinuity in the data for the December 2003 survey due to a change in the survey framework. 2. Figures for 2016/Q1 are those of January.
Notes: 1. Data from the Tankan are based on all industries. There is a discontinuity in the data in December 2003 due to Notes: 1. a change in the survey framework. Notes: 2. The figure for 2016/Q3 is that of July. Sources: Bank of Japan; Shoko Chukin Bank; Japan Finance Corporation (JFC).
Corporate Finance-Related Indicators
-40
-30
-20
-10
0
10
20
30
40
50
60
70
95 97 99 01 03 05 07 09 11 13 15 16
Small enterprises (JFC survey,"accommodative" - "severe")Micro businesses (JFC survey, "moreaccommodative" - "more severe")
DI, % points
-50
-40
-30
-20
-10
0
10
20
95 97 99 01 03 05 07 09 11 13 15 16
Small enterprises (JFC survey, "easy" - "tight")
Small enterprises (Shoko Chukin Bank survey, "easier" - "tighter")Micro businesses (JFC survey, "easier" - "tighter")
DI, % points
-30
-20
-10
0
10
20
30
95 97 99 01 03 05 07 09 11 13 15 16
Large enterprisesSmall enterprises
DI ("easy" - "tight"), % points
-30
-20
-10
0
10
20
30
40
95 97 99 01 03 05 07 09 11 13 15 16
Large enterprisesSmall enterprises
DI ("accommodative" - "severe"), % points
CY CY
CY CY
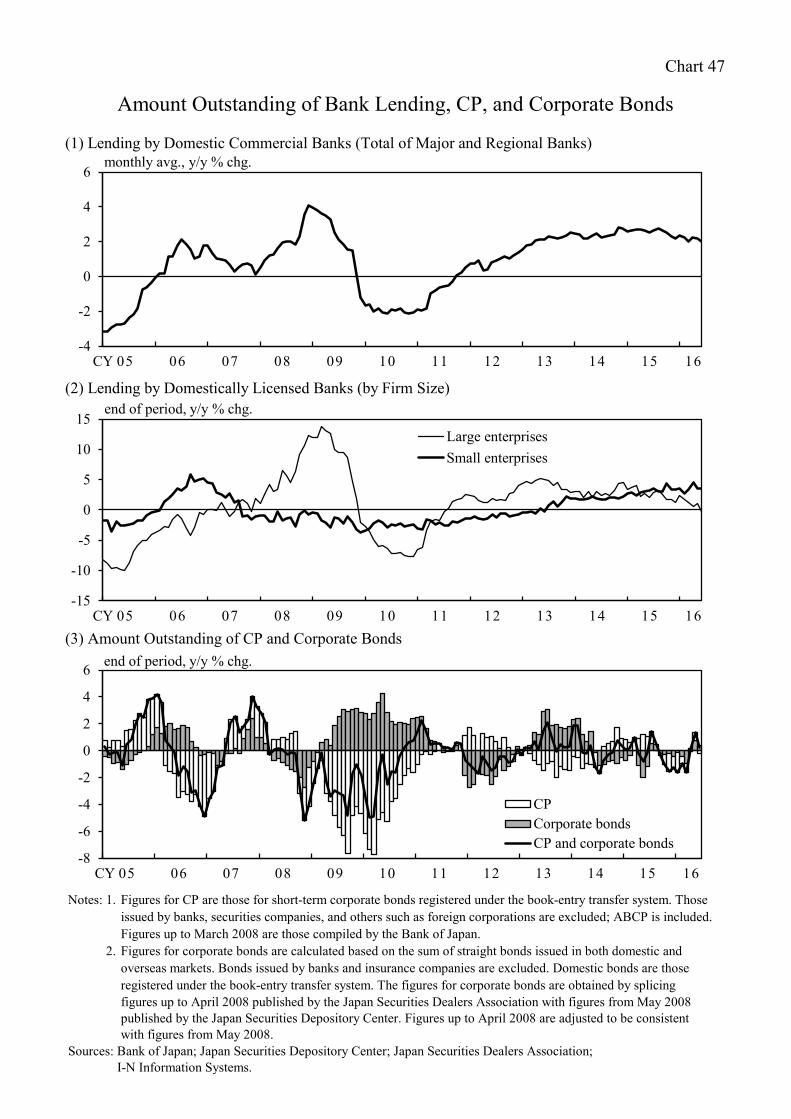
Chart 47
(1) Lending by Domestic Commercial Banks (Total of Major and Regional Banks)
(2) Lending by Domestically Licensed Banks (by Firm Size)
(3) Amount Outstanding of CP and Corporate Bonds
Notes: 1. Figures for CP are those for short-term corporate bonds registered under the book-entry transfer system. Those issued by banks, securities companies, and others such as foreign corporations are excluded; ABCP is included. Figures up to March 2008 are those compiled by the Bank of Japan.
2. Figures for corporate bonds are calculated based on the sum of straight bonds issued in both domestic and overseas markets. Bonds issued by banks and insurance companies are excluded. Domestic bonds are those registered under the book-entry transfer system. The figures for corporate bonds are obtained by splicing figures up to April 2008 published by the Japan Securities Dealers Association with figures from May 2008 published by the Japan Securities Depository Center. Figures up to April 2008 are adjusted to be consistentwith figures from May 2008.
Sources: Bank of Japan; Japan Securities Depository Center; Japan Securities Dealers Association; Sources: I-N Information Systems.
Amount Outstanding of Bank Lending, CP, and Corporate Bonds
-4
-2
0
2
4
6
CY 05 06 07 08 09 10 11 12 13 14 15 16
monthly avg., y/y % chg.
-8
-6
-4
-2
0
2
4
6
CY 05 06 07 08 09 10 11 12 13 14 15 16
CPCorporate bondsCP and corporate bonds
end of period, y/y % chg.
-15
-10
-5
0
5
10
15
CY 05 06 07 08 09 10 11 12 13 14 15 16
Large enterprisesSmall enterprises
end of period, y/y % chg.
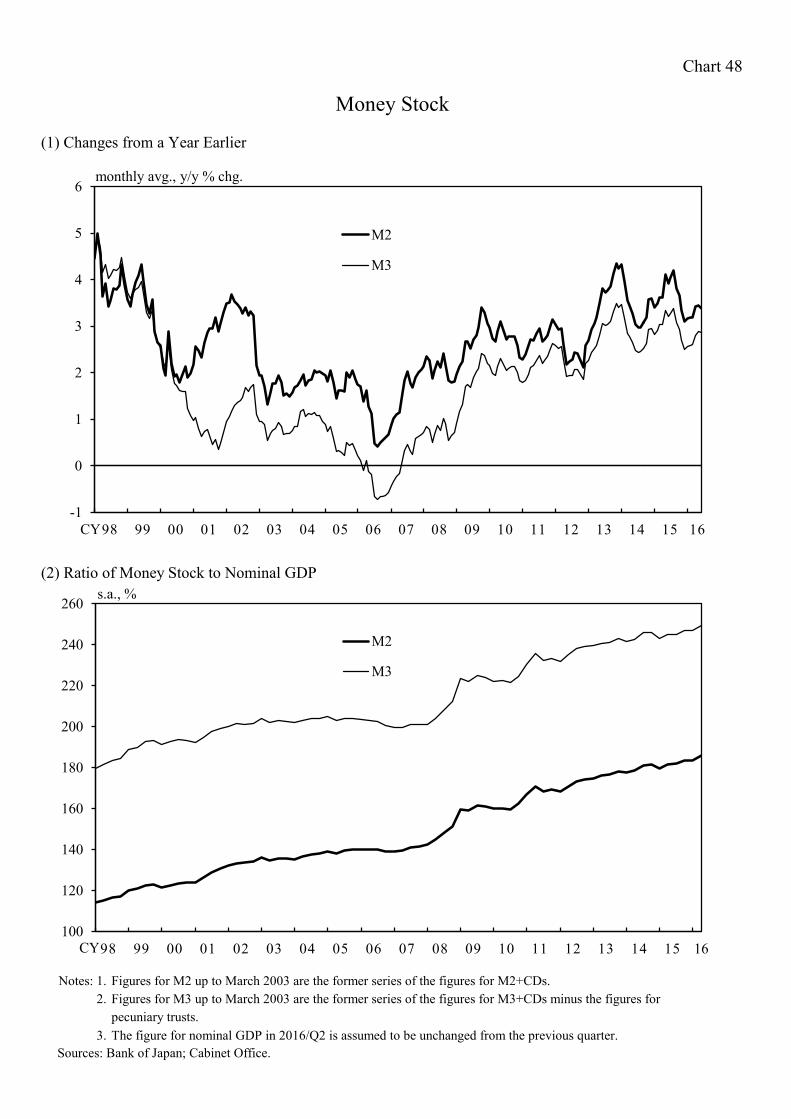
Chart 48
(1) Changes from a Year Earlier
(2) Ratio of Money Stock to Nominal GDP
Notes: 1. Figures for M2 up to March 2003 are the former series of the figures for M2+CDs.2. Figures for M3 up to March 2003 are the former series of the figures for M3+CDs minus the figures for
pecuniary trusts.3. The figure for nominal GDP in 2016/Q2 is assumed to be unchanged from the previous quarter.
Sources: Bank of Japan; Cabinet Office.
Money Stock
-1
0
1
2
3
4
5
6
98 99 00 01 02 03 04 05 06 07 08 09 10 11 12 13 14 15 16
M2
M3
monthly avg., y/y % chg.
CY
100
120
140
160
180
200
220
240
260
98 99 00 01 02 03 04 05 06 07 08 09 10 11 12 13 14 15 16
M2
M3
s.a., %
CY
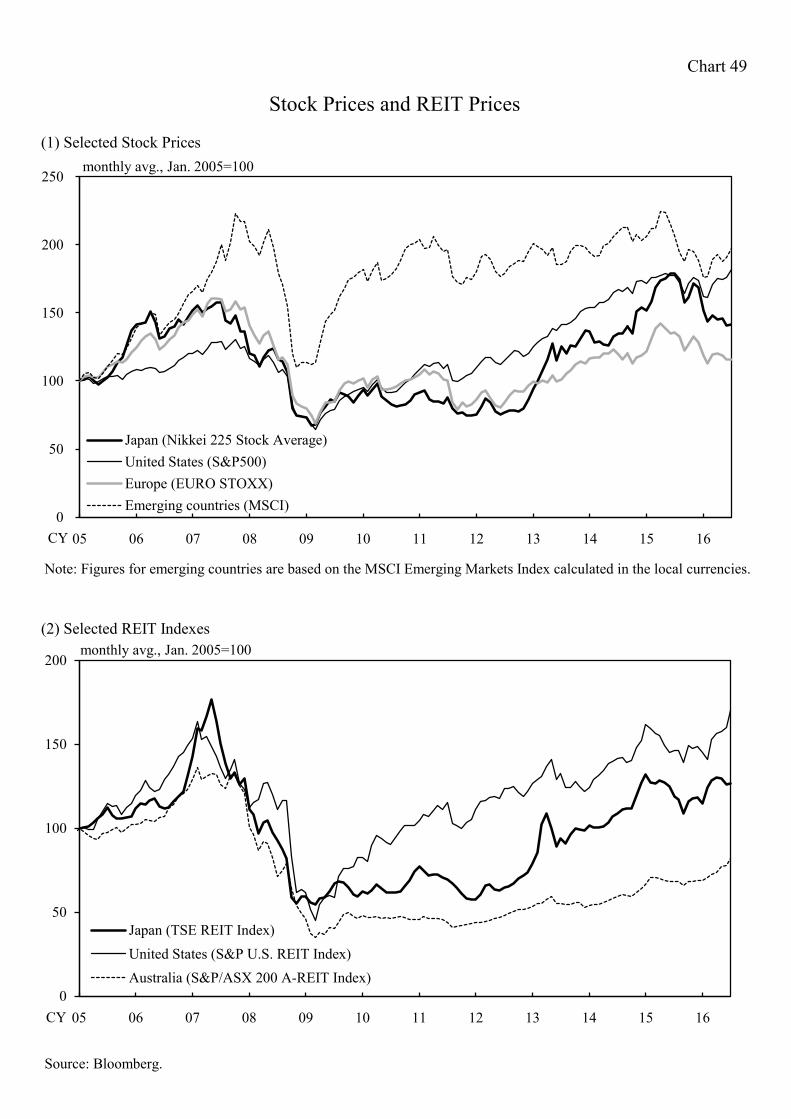
Chart 49
(1) Selected Stock Prices
Note: Figures for emerging countries are based on the MSCI Emerging Markets Index calculated in the local currencies.
(2) Selected REIT Indexes
Source: Bloomberg.
Stock Prices and REIT Prices
0
50
100
150
200
05 06 07 08 09 10 11 12 13 14 15 16
Japan (TSE REIT Index)United States (S&P U.S. REIT Index)Australia (S&P/ASX 200 A-REIT Index)
CY
monthly avg., Jan. 2005=100
0
50
100
150
200
250
05 06 07 08 09 10 11 12 13 14 15 16
Japan (Nikkei 225 Stock Average)United States (S&P500)Europe (EURO STOXX)Emerging countries (MSCI)
monthly avg., Jan. 2005=100
CY
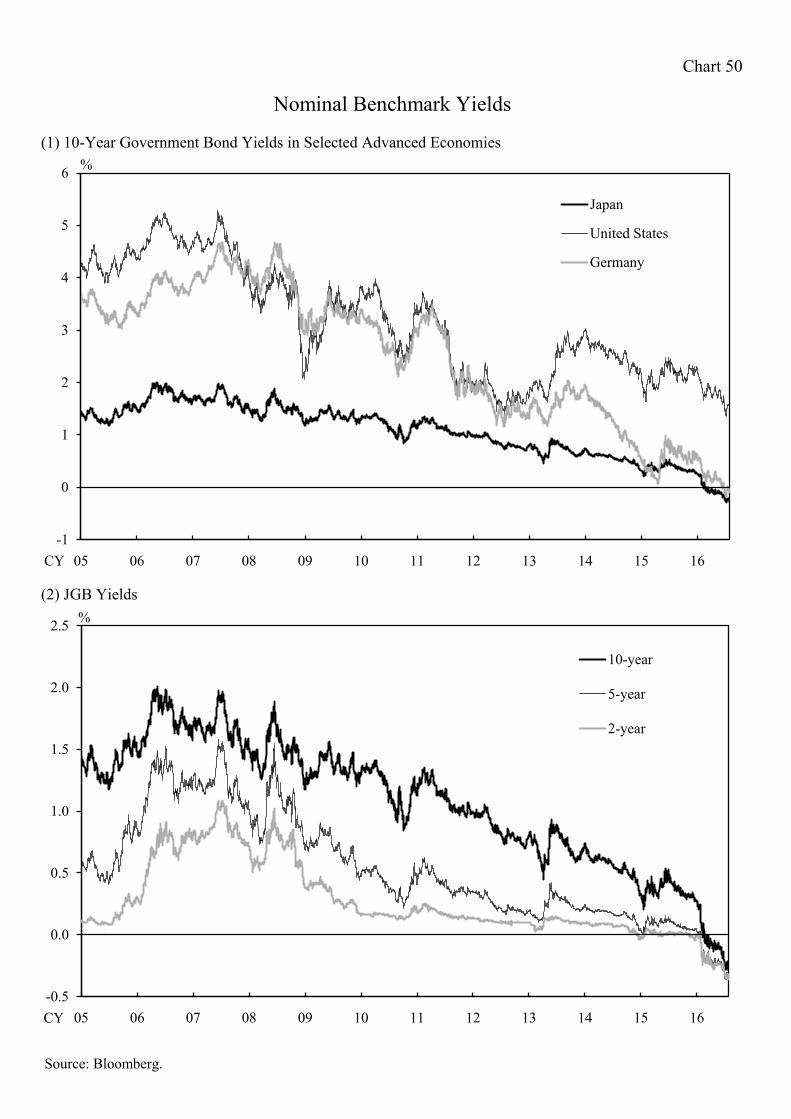
Chart 50
(1) 10-Year Government Bond Yields in Selected Advanced Economies
(2) JGB Yields
←7/28日まで
Source: Bloomberg.
Nominal Benchmark Yields
-1
0
1
2
3
4
5
6
05 06 07 08 09 10 11 12 13 14 15 16
Japan
United States
Germany
%
CY
-0.5
0.0
0.5
1.0
1.5
2.0
2.5
05 06 07 08 09 10 11 12 13 14 15 16
10-year
5-year
2-year
%
CY
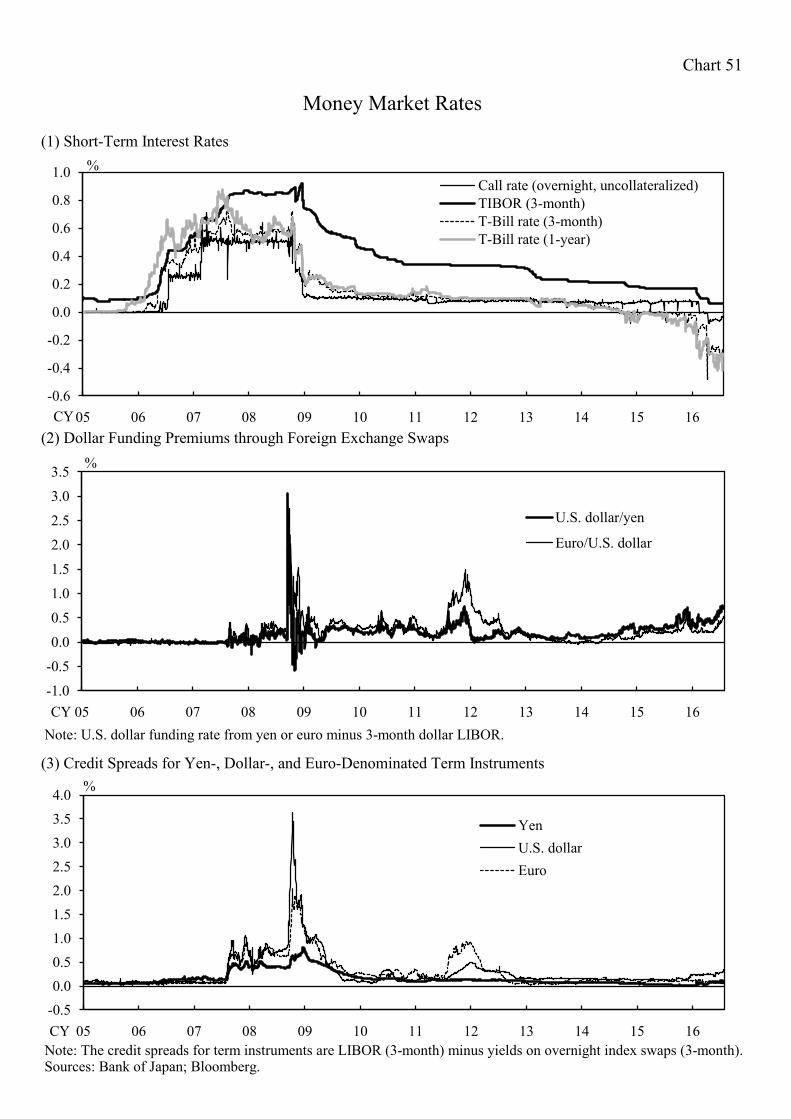
Chart 51
(1) Short-Term Interest Rates
(2) Dollar Funding Premiums through Foreign Exchange Swaps
Note: U.S. dollar funding rate from yen or euro minus 3-month dollar LIBOR.
(3) Credit Spreads for Yen-, Dollar-, and Euro-Denominated Term Instruments
Note: The credit spreads for term instruments are LIBOR (3-month) minus yields on overnight index swaps (3-month). Sources: Bank of Japan; Bloomberg.
Money Market Rates
-0.6
-0.4
-0.2
0.0
0.2
0.4
0.6
0.8
1.0
05 06 07 08 09 10 11 12 13 14 15 16
Call rate (overnight, uncollateralized)TIBOR (3-month)T-Bill rate (3-month)T-Bill rate (1-year)
CY
%
-0.50.00.51.01.52.02.53.03.54.0
05 06 07 08 09 10 11 12 13 14 15 16
YenU.S. dollarEuro
%
CY
-1.0
-0.5
0.0
0.5
1.0
1.5
2.0
2.5
3.0
3.5
05 06 07 08 09 10 11 12 13 14 15 16
U.S. dollar/yen
Euro/U.S. dollar
CY
%
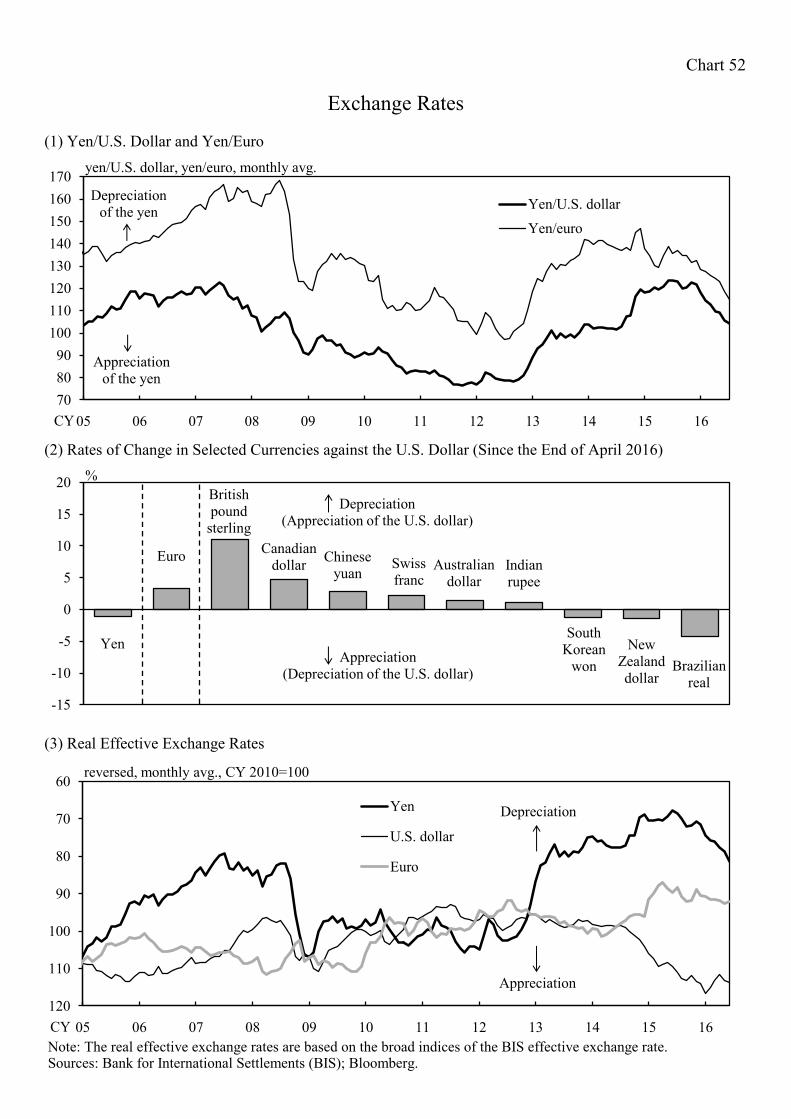
Chart 52
(1) Yen/U.S. Dollar and Yen/Euro
(2) Rates of Change in Selected Currencies against the U.S. Dollar (Since the End of April 2016)
(3) Real Effective Exchange Rates
Note: The real effective exchange rates are based on the broad indices of the BIS effective exchange rate. Sources: Bank for International Settlements (BIS); Bloomberg.
Exchange Rates
60
70
80
90
100
110
12005 06 07 08 09 10 11 12 13 14 15 16
Yen
U.S. dollar
Euro
CY
reversed, monthly avg., CY 2010=100
Depreciation
Appreciation
708090
100110120130140150160170
05 06 07 08 09 10 11 12 13 14 15 16
Yen/U.S. dollar
Yen/euro
Depreciation of the yen
Appreciation of the yen
CY
yen/U.S. dollar, yen/euro, monthly avg.
Yen
Euro
British pound
sterling Canadian
dollar Chinese yuan
Swiss franc
Australian dollar
Indian rupee
South Korean
won New
Zealand dollar
Brazilian real
-15
-10
-5
0
5
10
15
20 %
Depreciation (Appreciation of the U.S. dollar)
Appreciation (Depreciation of the U.S. dollar)
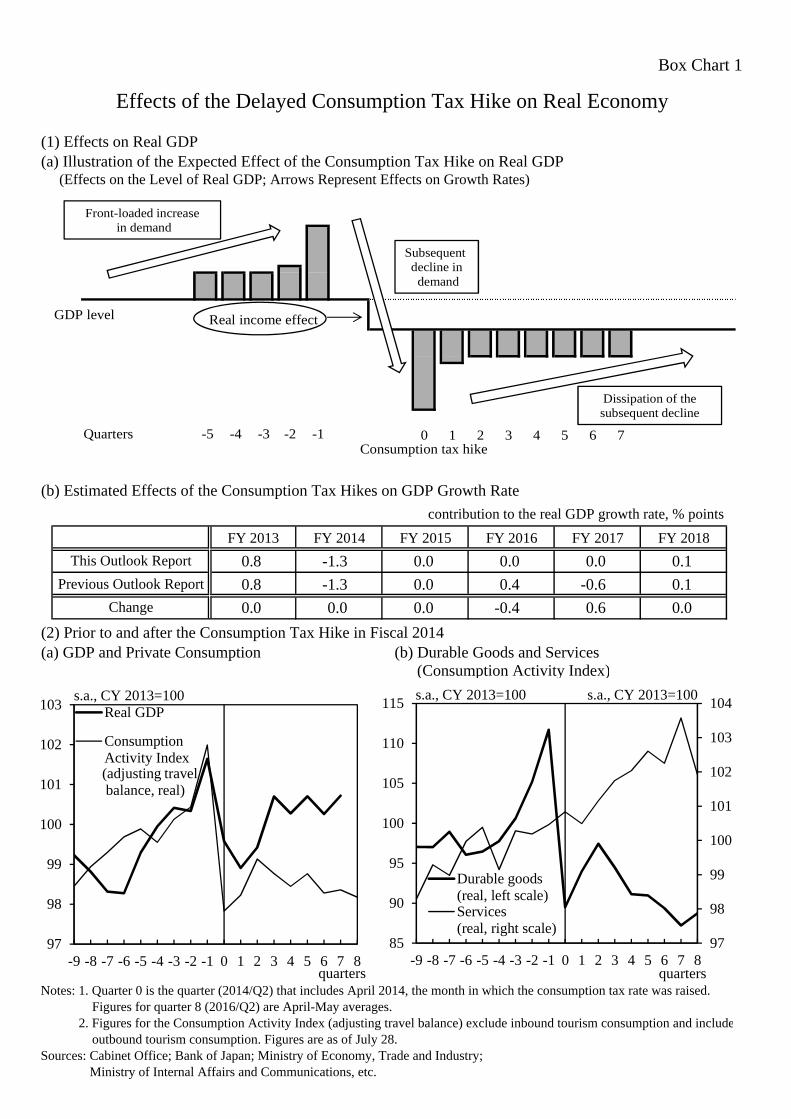
Box Chart 1
(1) Effects on Real GDP(a) Illustration of the Expected Effect of the Consumption Tax Hike on Real GDP (Effects on the Level of Real GDP; Arrows Represent Effects on Growth Rates)
(b) Estimated Effects of the Consumption Tax Hikes on GDP Growth Rate
(2) Prior to and after the Consumption Tax Hike in Fiscal 2014(a) GDP and Private Consumption (b) Durable Goods and Services
(b) (Consumption Activity Index)
Notes: 1. Quarter 0 is the quarter (2014/Q2) that includes April 2014, the month in which the consumption tax rate was raised.Notes: 1. Figures for quarter 8 (2016/Q2) are April-May averages.Notes: 2. Figures for the Consumption Activity Index (adjusting travel balance) exclude inbound tourism consumption and includeNotes: 2. outbound tourism consumption. Figures are as of July 28.Sources: Cabinet Office; Bank of Japan; Ministry of Economy, Trade and Industry;Sources: Ministry of Internal Affairs and Communications, etc.
Effects of the Delayed Consumption Tax Hike on Real Economy
Quarters -5 -4 -3 -2 -1 0 1 2 3 4 5 6 7Consumption tax hike
Real income effectGDP level
Front-loaded increasein demand
Subsequent decline indemand
Dissipation of the subsequent decline
97
98
99
100
101
102
103
-9 -8 -7 -6 -5 -4 -3 -2 -1 0 1 2 3 4 5 6 7 8
Real GDP
ConsumptionActivity Index
quarters
(adjusting travel balance, real)
s.a., CY 2013=100
97
98
99
100
101
102
103
104
85
90
95
100
105
110
115
-9 -8 -7 -6 -5 -4 -3 -2 -1 0 1 2 3 4 5 6 7 8
Durable goods(real, left scale)Services(real, right scale)
quarters
s.a., CY 2013=100 s.a., CY 2013=100
contribution to the real GDP growth rate, % points
FY 2013 FY 2014 FY 2015 FY 2016 FY 2017 FY 2018
0.8 -1.3 0.0 0.0 0.0 0.1
0.8 -1.3 0.0 0.4 -0.6 0.1
0.0 0.0 0.0 -0.4 0.6 0.0 Change
This Outlook Report
Previous Outlook Report
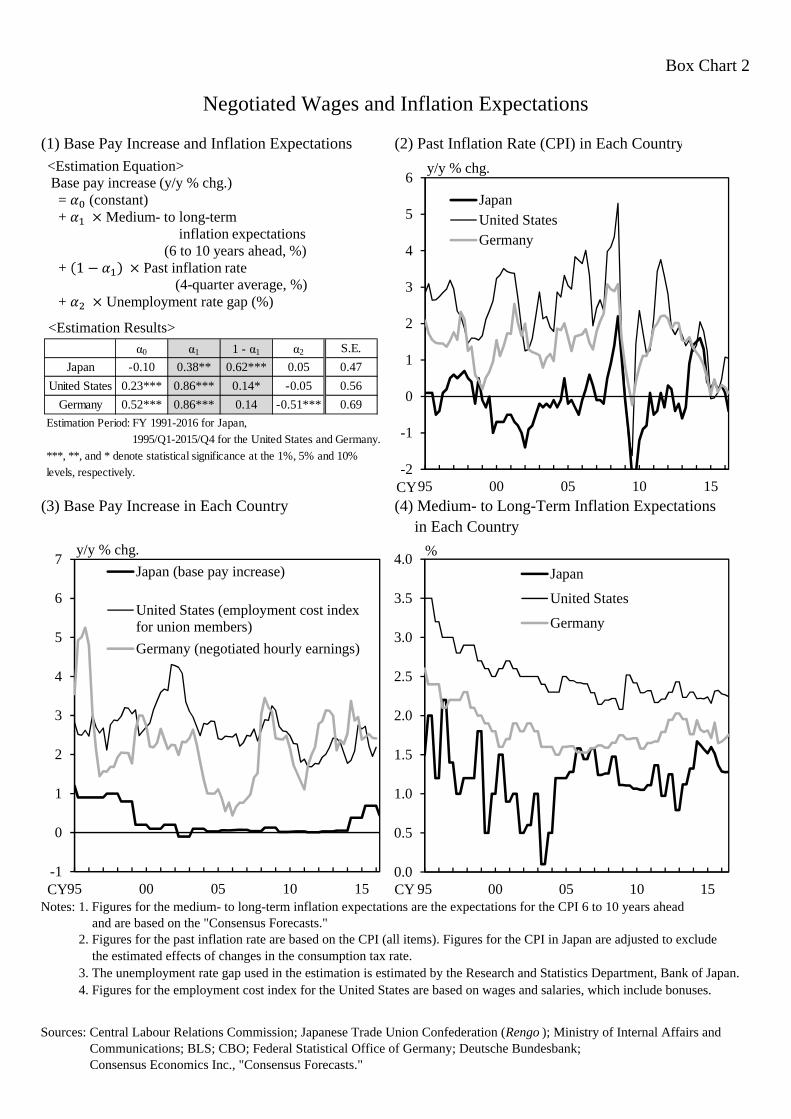
Box Chart 2
(1) Base Pay Increase and Inflation Expectations (2) Past Inflation Rate (CPI) in Each Country
<Estimation Results>
(3) Base Pay Increase in Each Country (4) Medium- to Long-Term Inflation Expectations in Each Country
Notes: 1. Figures for the medium- to long-term inflation expectations are the expectations for the CPI 6 to 10 years aheadNotes: and are based on the "Consensus Forecasts."Notes: 2. Figures for the past inflation rate are based on the CPI (all items). Figures for the CPI in Japan are adjusted to excludeNotes: the estimated effects of changes in the consumption tax rate.Notes: 3. The unemployment rate gap used in the estimation is estimated by the Research and Statistics Department, Bank of Japan.Notes: 4. Figures for the employment cost index for the United States are based on wages and salaries, which include bonuses.
Sources: Central Labour Relations Commission; Japanese Trade Union Confederation (Rengo ); Ministry of Internal Affairs andSources: Communications; BLS; CBO; Federal Statistical Office of Germany; Deutsche Bundesbank;Sources: Consensus Economics Inc., "Consensus Forecasts."
Negotiated Wages and Inflation Expectations
α0 α1 1 - α1 α2 S.E.
Japan -0.10 0.38** 0.62*** 0.05 0.47
United States 0.23*** 0.86*** 0.14* -0.05 0.56
Germany 0.52*** 0.86*** 0.14 -0.51*** 0.69
Estimation Period: FY 1991-2016 for Japan,
Estimation Period: 1995/Q1-2015/Q4 for the United States and Germany.
***, **, and * denote statistical significance at the 1%, 5% and 10%
levels, respectively.
<Estimation Equation>Base pay increase (y/y % chg.)
= (constant)+ Medium- to long-term
inflation expectations(6 to 10 years ahead, %)
+ 1 Past inflation rate(4-quarter average, %)
+ Unemployment rate gap (%)
-2
-1
0
1
2
3
4
5
6
95 00 05 10 15
JapanUnited StatesGermany
y/y % chg.
CY
-1
0
1
2
3
4
5
6
7
95 00 05 10 15
Japan (base pay increase)
United States (employment cost indexfor union members)
Germany (negotiated hourly earnings)
y/y % chg.
CY0.0
0.5
1.0
1.5
2.0
2.5
3.0
3.5
4.0
95 00 05 10 15
Japan
United States
Germany
%
CY
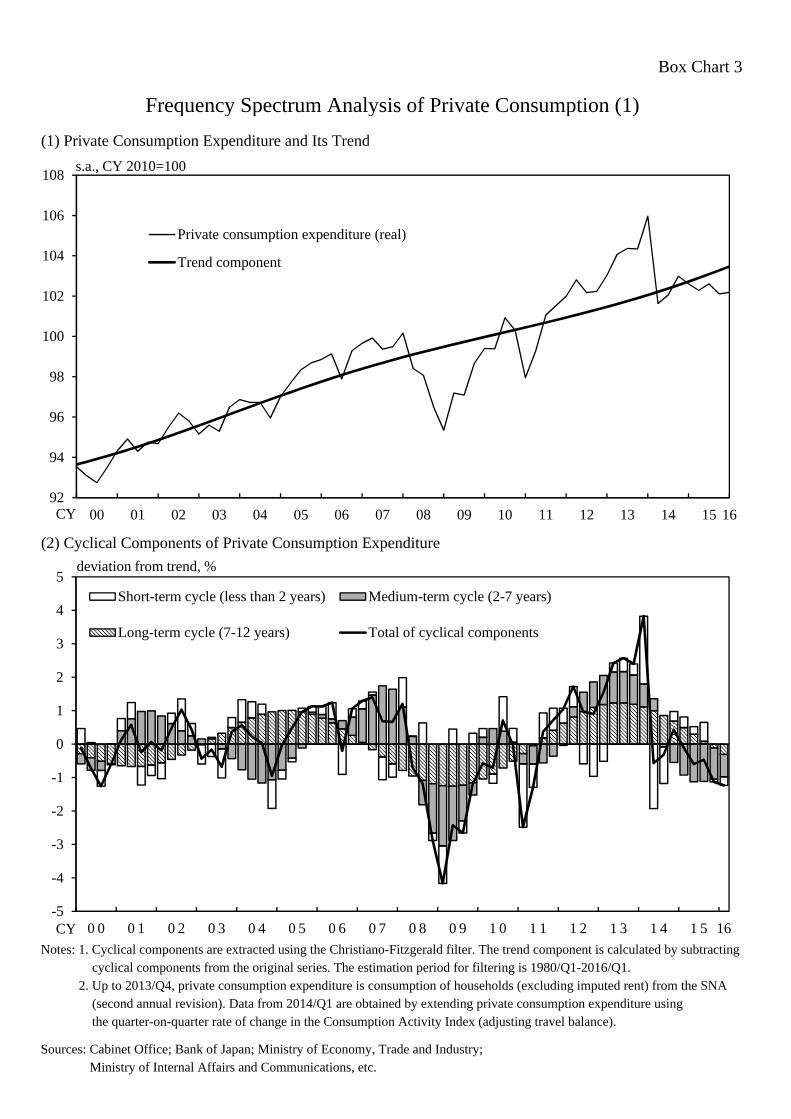
Box Chart 3
Frequency Spectrum Analysis of Private Consumption (1)
(1) Private Consumption Expenditure and Its Trend
(2) Cyclical Components of Private Consumption Expenditure
Notes: 1. Cyclical components are extracted using the Christiano-Fitzgerald filter. The trend component is calculated by subtractingNotes: 1. cyclical components from the original series. The estimation period for filtering is 1980/Q1-2016/Q1.Notes: 2. Up to 2013/Q4, private consumption expenditure is consumption of households (excluding imputed rent) from the SNANotes: 2. (second annual revision). Data from 2014/Q1 are obtained by extending private consumption expenditure usingNotes: 2. the quarter-on-quarter rate of change in the Consumption Activity Index (adjusting travel balance).
Sources: Cabinet Office; Bank of Japan; Ministry of Economy, Trade and Industry;Sources: Ministry of Internal Affairs and Communications, etc.
92
94
96
98
100
102
104
106
108
00 01 02 03 04 05 06 07 08 09 10 11 12 13 14 15 16
Private consumption expenditure (real)
Trend component
s.a., CY 2010=100
CY
-5
-4
-3
-2
-1
0
1
2
3
4
5
0 0 0 1 0 2 0 3 0 4 0 5 0 6 0 7 0 8 0 9 1 0 1 1 1 2 1 3 1 4 1 5 16
Short-term cycle (less than 2 years) Medium-term cycle (2-7 years)
Long-term cycle (7-12 years) Total of cyclical components
deviation from trend, %
CY
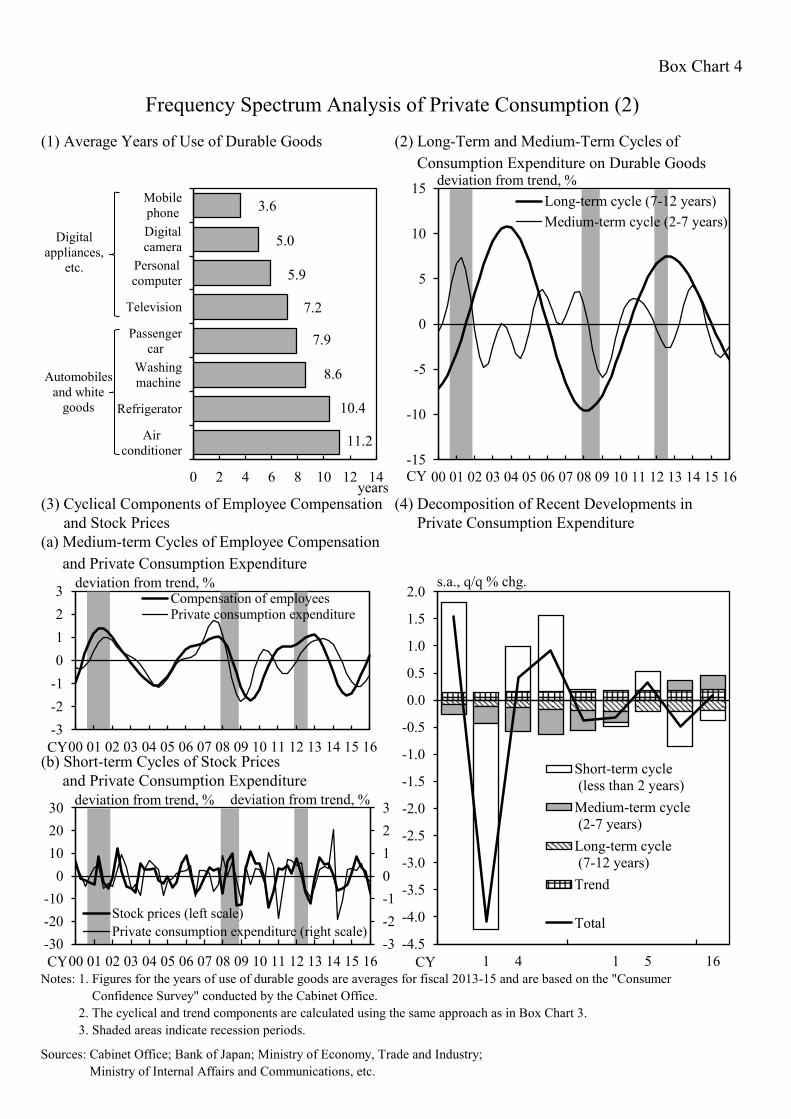
Box Chart 4
Frequency Spectrum Analysis of Private Consumption (2)
(1) Average Years of Use of Durable Goods (2) Long-Term and Medium-Term Cycles of(2) Consumption Expenditure on Durable Goods
(3) Cyclical Components of Employee Compensation (4) Decomposition of Recent Developments in(3) and Stock Prices (4) Private Consumption Expenditure(a) Medium-term Cycles of Employee Compensation(a) and Private Consumption Expenditure
(b) Short-term Cycles of Stock Prices(a) and Private Consumption Expenditure
Notes: 1. Figures for the years of use of durable goods are averages for fiscal 2013-15 and are based on the "ConsumerNotes: 1. Confidence Survey" conducted by the Cabinet Office.Notes: 2. The cyclical and trend components are calculated using the same approach as in Box Chart 3.Notes: 3. Shaded areas indicate recession periods.
Sources: Cabinet Office; Bank of Japan; Ministry of Economy, Trade and Industry;Sources: Ministry of Internal Affairs and Communications, etc.
0 2 4 6 8 10 12 14
Airconditioner
Refrigerator
Washingmachine
Passengercar
Television
Personalcomputer
Digitalcamera
Mobilephone
years
11.2
10.4
7.9
7.2
5.9
3.6
8.6
5.0
Automobiles and white
goods
Digital appliances,
etc.
-4.5
-4.0
-3.5
-3.0
-2.5
-2.0
-1.5
-1.0
-0.5
0.0
0.5
1.0
1.5
2.0
1 4 1 5 16
Short-term cycle (less than 2 years)Medium-term cycle (2-7 years)Long-term cycle (7-12 years)Trend
Total
CY
s.a., q/q % chg.
-15
-10
-5
0
5
10
15
00 01 02 03 04 05 06 07 08 09 10 11 12 13 14 15 16
Long-term cycle (7-12 years)Medium-term cycle (2-7 years)
CY
deviation from trend, %
-3-2-10123
00 01 02 03 04 05 06 07 08 09 10 11 12 13 14 15 16
Compensation of employeesPrivate consumption expenditure
CY
deviation from trend, %
-3-2-10123
-30-20-10
0102030
00 01 02 03 04 05 06 07 08 09 10 11 12 13 14 15 16
Stock prices (left scale)Private consumption expenditure (right scale)
CY
deviation from trend, % deviation from trend, %
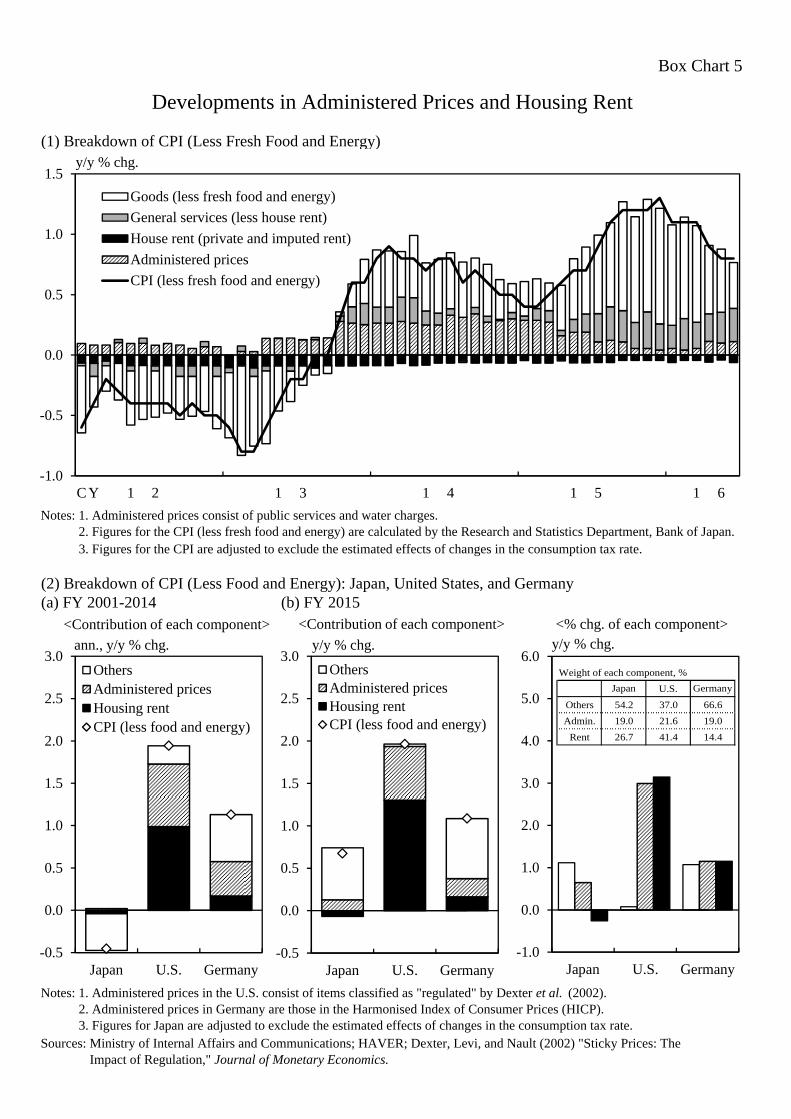
Box Chart 5
(1) Breakdown of CPI (Less Fresh Food and Energy)
Notes: 1. Administered prices consist of public services and water charges.Notes: 2. Figures for the CPI (less fresh food and energy) are calculated by the Research and Statistics Department, Bank of Japan.Notes: 3. Figures for the CPI are adjusted to exclude the estimated effects of changes in the consumption tax rate.
(2) Breakdown of CPI (Less Food and Energy): Japan, United States, and Germany(a) FY 2001-2014 (b) FY 2015
Notes: 1. Administered prices in the U.S. consist of items classified as "regulated" by Dexter et al. (2002).Notes: 2. Administered prices in Germany are those in the Harmonised Index of Consumer Prices (HICP).Notes: 3. Figures for Japan are adjusted to exclude the estimated effects of changes in the consumption tax rate.Sources: Ministry of Internal Affairs and Communications; HAVER; Dexter, Levi, and Nault (2002) "Sticky Prices: The Sources: Impact of Regulation," Journal of Monetary Economics.
Developments in Administered Prices and Housing Rent
Japan U.S. Germany-1.0
0.0
1.0
2.0
3.0
4.0
5.0
6.0y/y % chg.
-1.0
-0.5
0.0
0.5
1.0
1.5
C Y 1 2 1 3 1 4 1 5 1 6
Goods (less fresh food and energy)
General services (less house rent)
House rent (private and imputed rent)
Administered prices
CPI (less fresh food and energy)
y/y % chg.
<Contribution of each component>
-0.5
0.0
0.5
1.0
1.5
2.0
2.5
3.0
Japan U.S. Germany
OthersAdministered pricesHousing rentCPI (less food and energy)
y/y % chg.
-0.5
0.0
0.5
1.0
1.5
2.0
2.5
3.0
Japan U.S. Germany
OthersAdministered pricesHousing rentCPI (less food and energy)
ann., y/y % chg.
<Contribution of each component> <% chg. of each component>
Weight of each component, %
U.S.
Others 54.2 37.0 66.6
Admin. 19.0 21.6 19.0
Rent 26.7 41.4 14.4
GermanyJapan
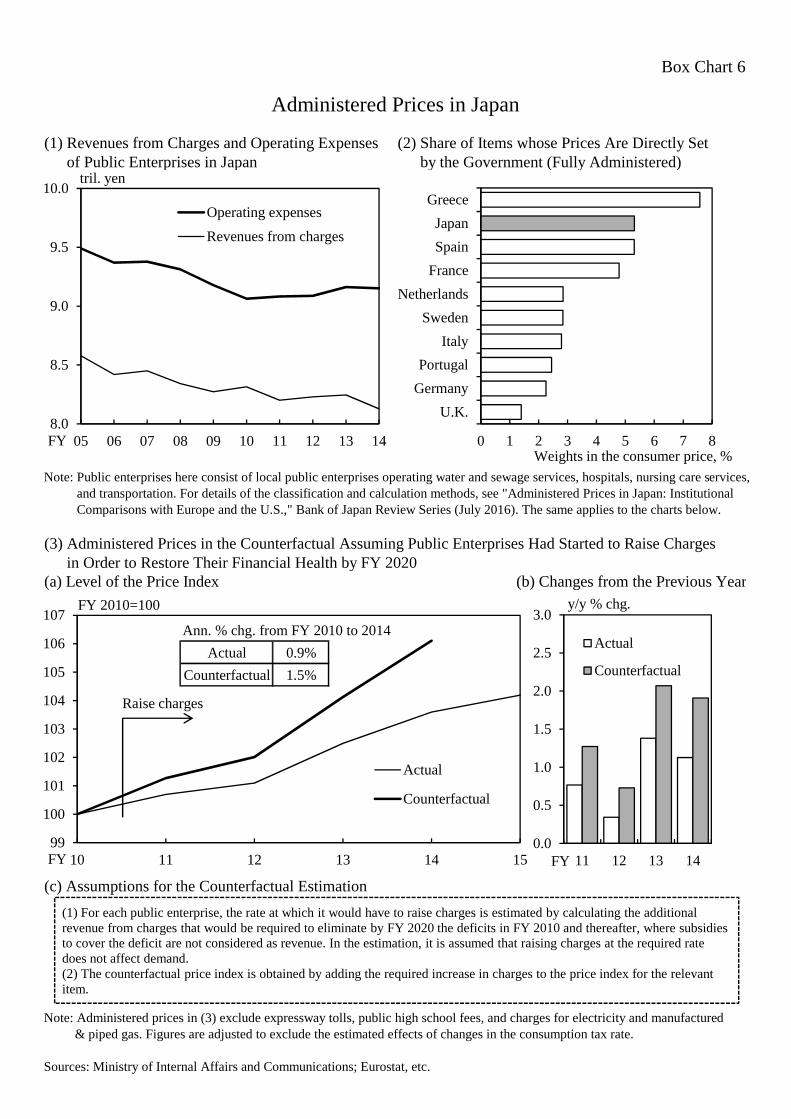
Box Chart 6
(1) Revenues from Charges and Operating Expenses (2) Share of Items whose Prices Are Directly Set(1) of Public Enterprises in Japan (2) by the Government (Fully Administered)
Note: Public enterprises here consist of local public enterprises operating water and sewage services, hospitals, nursing care services,Note: and transportation. For details of the classification and calculation methods, see "Administered Prices in Japan: InstitutionalNote: Comparisons with Europe and the U.S.," Bank of Japan Review Series (July 2016). The same applies to the charts below.
(3) Administered Prices in the Counterfactual Assuming Public Enterprises Had Started to Raise Charges(2) in Order to Restore Their Financial Health by FY 2020(a) Level of the Price Index (b) Changes from the Previous Year
(c) Assumptions for the Counterfactual Estimation
Note: Administered prices in (3) exclude expressway tolls, public high school fees, and charges for electricity and manufacturedNotes& piped gas. Figures are adjusted to exclude the estimated effects of changes in the consumption tax rate.
Sources: Ministry of Internal Affairs and Communications; Eurostat, etc.
Administered Prices in Japan
0.0
0.5
1.0
1.5
2.0
2.5
3.0
11 12 13 14
Actual
Counterfactual
y/y % chg.
FY
0 1 2 3 4 5 6 7 8
U.K.
Germany
Portugal
Italy
Sweden
Netherlands
France
Spain
Japan
Greece
Weights in the consumer price, %
8.0
8.5
9.0
9.5
10.0
05 06 07 08 09 10 11 12 13 14
Operating expenses
Revenues from charges
FY
tril. yen
99
100
101
102
103
104
105
106
107
10 11 12 13 14 15
Actual
Counterfactual
FY 2010=100
Raise charges
FY
(1) For each public enterprise, the rate at which it would have to raise charges is estimated by calculating the additional revenue from charges that would be required to eliminate by FY 2020 the deficits in FY 2010 and thereafter, where subsidies to cover the deficit are not considered as revenue. In the estimation, it is assumed that raising charges at the required rate does not affect demand.(2) The counterfactual price index is obtained by adding the required increase in charges to the price index for the relevantitem.
Ann. % chg. from FY 2010 to 2014
Actual 0.9%
Counterfactual 1.5%
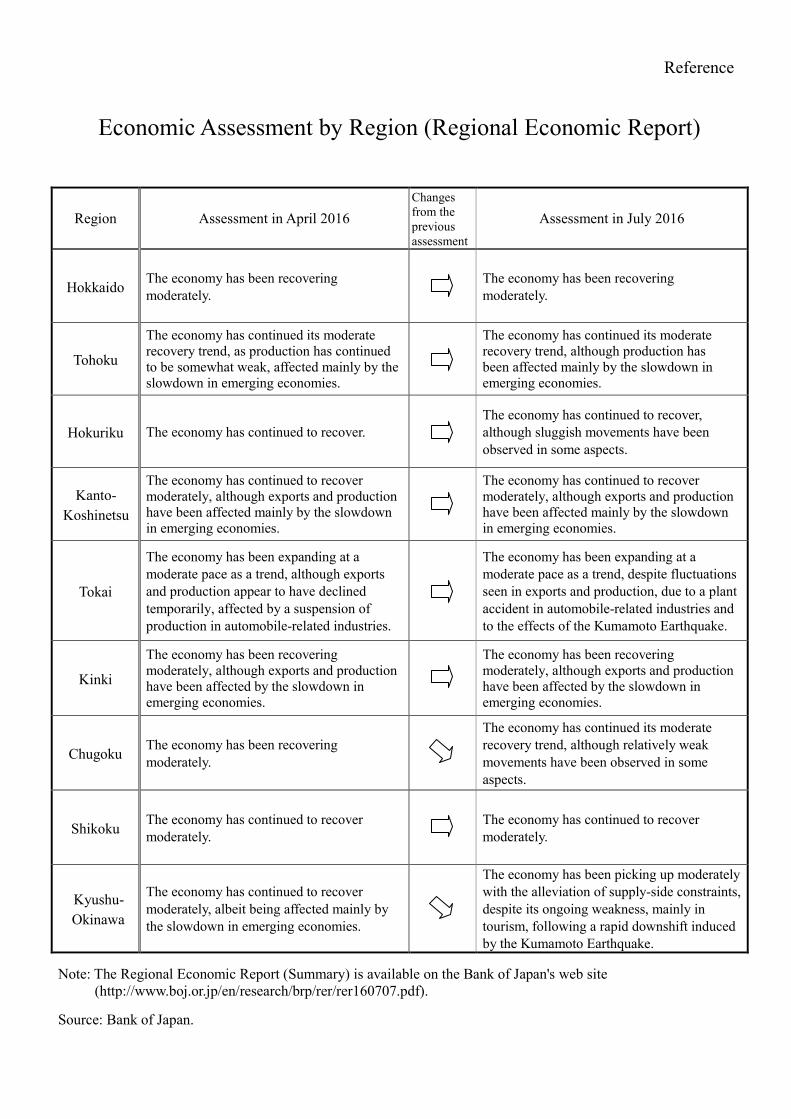
Reference
Economic Assessment by Region (Regional Economic Report)
Region Assessment in April 2016 Changes from the previous assessment
Assessment in July 2016
Hokkaido The economy has been recovering moderately.
The economy has been recovering moderately.
Tohoku
The economy has continued its moderate recovery trend, as production has continued to be somewhat weak, affected mainly by the slowdown in emerging economies.
The economy has continued its moderate recovery trend, although production has been affected mainly by the slowdown in emerging economies.
Hokuriku The economy has continued to recover.
The economy has continued to recover, although sluggish movements have been observed in some aspects.
Kanto- Koshinetsu
The economy has continued to recover moderately, although exports and production have been affected mainly by the slowdown in emerging economies.
The economy has continued to recover moderately, although exports and production have been affected mainly by the slowdown in emerging economies.
Tokai
The economy has been expanding at a moderate pace as a trend, although exports and production appear to have declined temporarily, affected by a suspension of production in automobile-related industries.
The economy has been expanding at a moderate pace as a trend, despite fluctuations seen in exports and production, due to a plant accident in automobile-related industries and to the effects of the Kumamoto Earthquake.
Kinki
The economy has been recovering moderately, although exports and production have been affected by the slowdown in emerging economies.
The economy has been recovering moderately, although exports and production have been affected by the slowdown in emerging economies.
Chugoku The economy has been recovering moderately.
The economy has continued its moderate recovery trend, although relatively weak movements have been observed in some aspects.
Shikoku The economy has continued to recover moderately.
The economy has continued to recover moderately.
Kyushu- Okinawa
The economy has continued to recover moderately, albeit being affected mainly by the slowdown in emerging economies.
The economy has been picking up moderately with the alleviation of supply-side constraints, despite its ongoing weakness, mainly in tourism, following a rapid downshift induced by the Kumamoto Earthquake.
Note: The Regional Economic Report (Summary) is available on the Bank of Japan's web site (http://www.boj.or.jp/en/research/brp/rer/rer160707.pdf).
Source: Bank of Japan.