Embed Size (px)
DESCRIPTION
Outlook for the World Economy: Latin America. Ernesto Talvi CERES – Uruguay. October 25 th , 2004. Prepared for presentation at the XX Meeting of the Latin American Network of Central Banks and Finance Ministries IADB, Washington D.C. OUTLINE. Back to the Future...? - PowerPoint PPT Presentation
Citation preview

Outlook for the World Economy:Outlook for the World Economy:
Latin AmericaLatin AmericaOutlook for the World Economy:Outlook for the World Economy:
Latin AmericaLatin America
Ernesto TalviErnesto TalviCERES – Uruguay CERES – Uruguay
Prepared for presentation at the XX Meeting of the Latin Prepared for presentation at the XX Meeting of the Latin American Network of Central Banks and Finance Ministries American Network of Central Banks and Finance Ministries
IADB, Washington D.C.IADB, Washington D.C.
October 25October 25thth, 2004, 2004
I.I. Back to the Future...?Back to the Future...?
II.II. Brazil: Riding on LeverageBrazil: Riding on Leverage
III.III. Argentina: Riding on the “V”Argentina: Riding on the “V”
OUTLINE

I.I. Back to the Future...?Back to the Future...?
II.II. Brazil: Riding on LeverageBrazil: Riding on Leverage
III.III. Argentina: Riding on the “V”Argentina: Riding on the “V”
OUTLINE

Russian Crisis
Argentine Crisis
Collapse in Capital Flows to LAC-7 (in millions of US dollars, last four quarters)
-4000
16000
36000
56000
76000
96000
Mar
-90
dec-
90
Sep
-91
Jun-
92
Mar
-93
dec-
93
Sep
-94
Jun-
95
Mar
-96
dec-
96
Sep
-97
Jun-
98
Mar
-99
dec-
99
Sep
-00
Jun-
01
Mar
-02
* LAC-7 includes the seven major Latin American countries, namely, Argentina, Brazil, Chile, Colombia, Mexico, Peru and Venezuela
dec-
02
Mexican Crisis
Asian Crisis
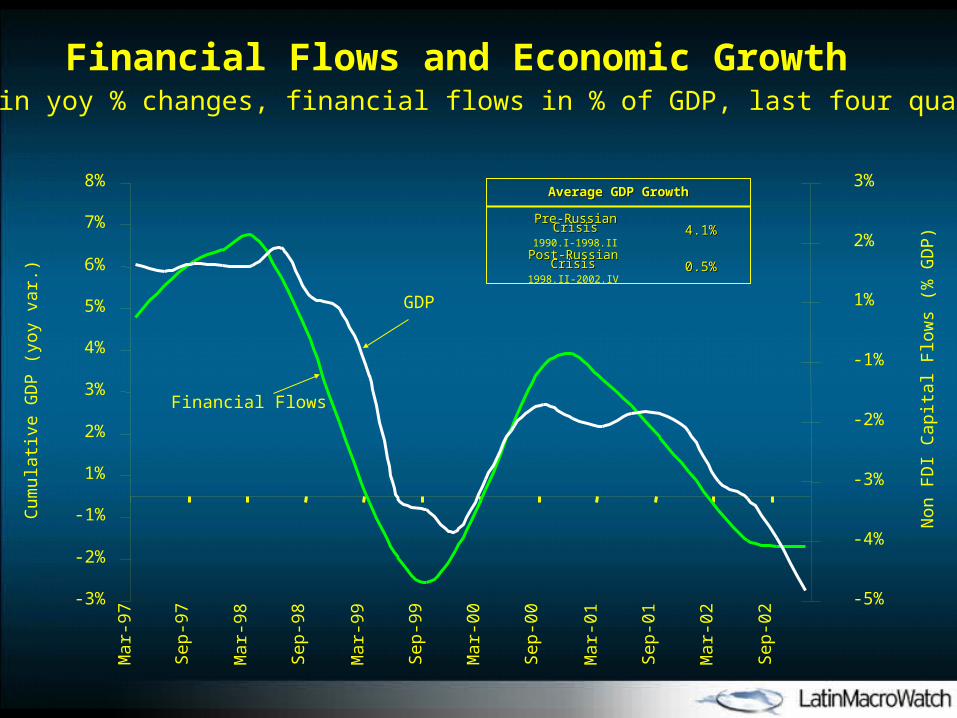
Financial Flows and Economic Growth(GDP in yoy % changes, financial flows in % of GDP, last four quarters)
Cum
ulat
ive
GD
P (
yoy
var.
)
Non
FD
I Cap
ital F
low
s (%
GD
P)
-3%
-2%
-1%
1%
2%
3%
4%
5%
6%
7%
8%
Mar
-97
Sep
-97
Mar
-98
Sep
-98
Mar
-99
Sep
-99
Mar
-00
Sep
-00
Mar
-01
Sep
-01
Mar
-02
Sep
-02
-5%
-4%
-3%
-2%
-1%
1%
2%
3%
GDP
Financial Flows
0.5%0.5%
4.1%4.1%
Post-Russian CrisisPost-Russian Crisis1998.II-2002.IV
Pre-Russian CrisisPre-Russian Crisis1990.I-1998.II
Average GDP GrowthAverage GDP Growth
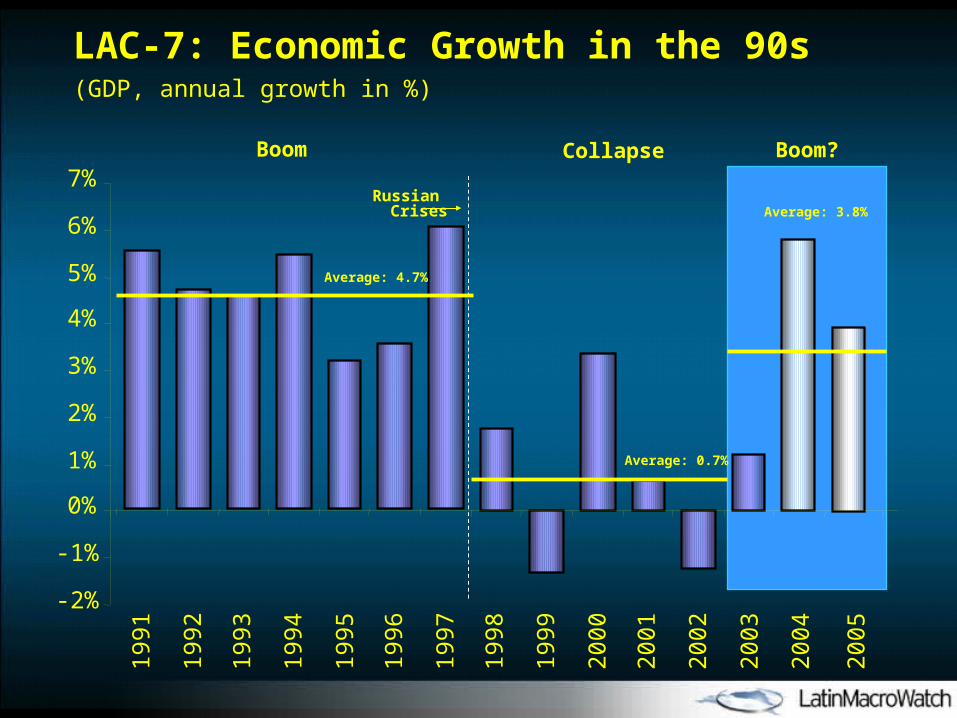
LAC-7: Economic Growth in the 90s(GDP, annual growth in %)
-2%
-1%
0%
1%
2%
3%
4%
5%
6%
7%
1991
1992
1993
1994
1995
1996
1997
1998
1999
2000
2001
2002
2003
2004
Collapse
Russian Crises
Average: 0.7%
Boom
Average: 4.7%
2005
Boom?
Average: 3.8%
2 2,5 3 3,5 4 4,5 5 5,5 6 6,5 7 7,5
Mexico
Colombia
Peru
Brazil
Chile
Argentina
Venezuela
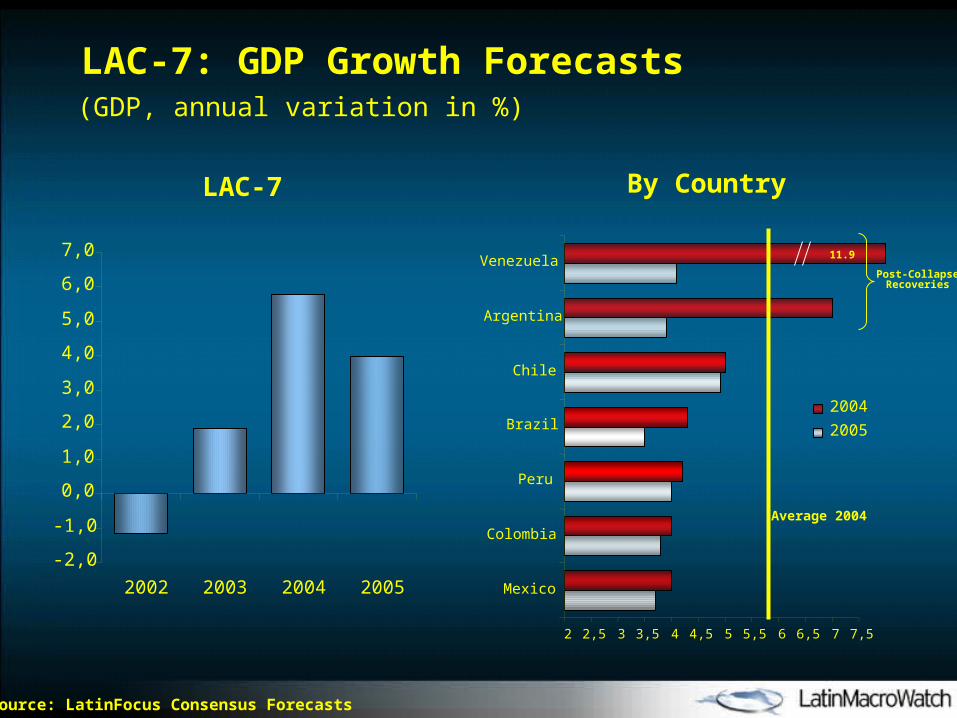
LAC-7 By Country
(GDP, annual variation in %)
LAC-7: GDP Growth Forecasts
Post-Collapse Recoveries
Source: LatinFocus Consensus Forecasts
-2,0
-1,0
0,0
1,0
2,0
3,0
4,0
5,0
6,0
7,0
2002 2003 2004 2005
11.9
2004
2005
Average 2004
Source: LatinFocus Consensus Forecasts
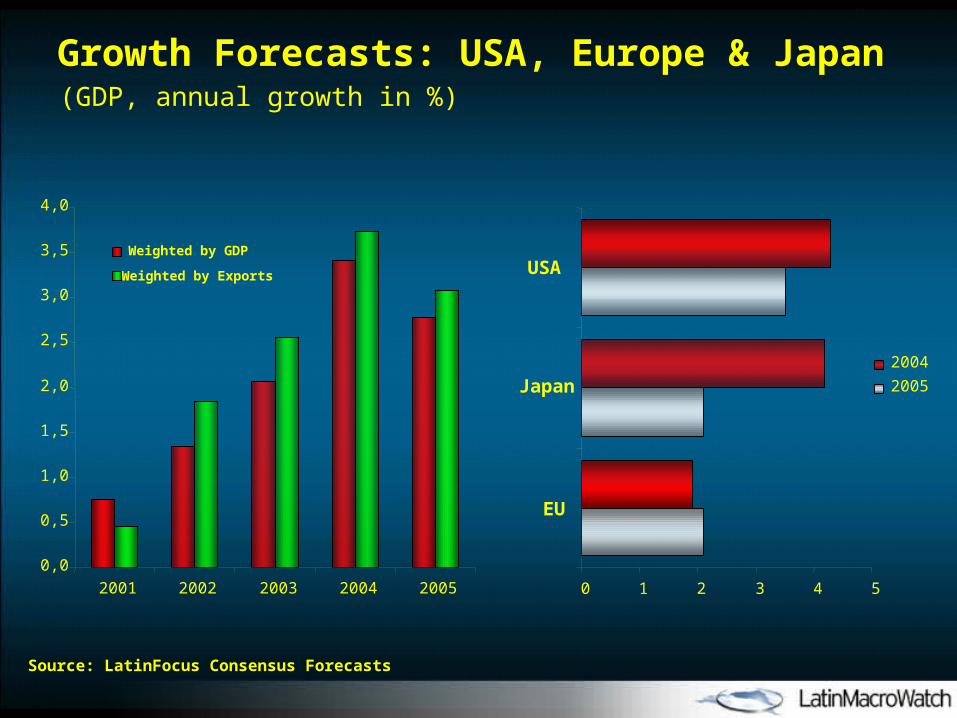
(GDP, annual growth in %)
Growth Forecasts: USA, Europe & Japan
0 1 2 3 4 5
EU
Japan
USA
2004
2005
0,0
0,5
1,0
1,5
2,0
2,5
3,0
3,5
4,0
2001 2002 2003 2004 2005
Weighted by GDP
Weighted by Exports

Invasion of Iraq
OPEC oil embargo
Iraq – Iran war starts
Saudi production increase
OPEC production restraint
Invasion of Kwait
-1.7%
-11.5%
-5.6%
-8.7%
-3.3%
-3.3%
Dec 69 – Nov 70
Nov 73 – Mar 75
Jan 80 – Jul 80
Jul 81 – Nov 82
Jul 90 – Mar 91
Mar 01 – Nov 01
Ind. Production variations* (from peak to trough)
* NBER recession dates.
0
10
20
30
40
50
60
70
80
90
100
abr-
70
abr-
72
abr-
74
abr-
76
abr-
78
abr-
80
abr-
82
abr-
84
abr-
86
abr-
88
abr-
90
abr-
92
abr-
94
abr-
96
abr-
98
abr-
00
abr-
02
abr-
04
Oil Prices and Industrial Production in the US (USD per barrel in 2004 prices, saar in %)
Oil
Pri
ce
-28%
-23%
-18%
-13%
-8%
-3%
2%
7%
12%
17%
Ind
ust
rial
Pro
du
ctio
n
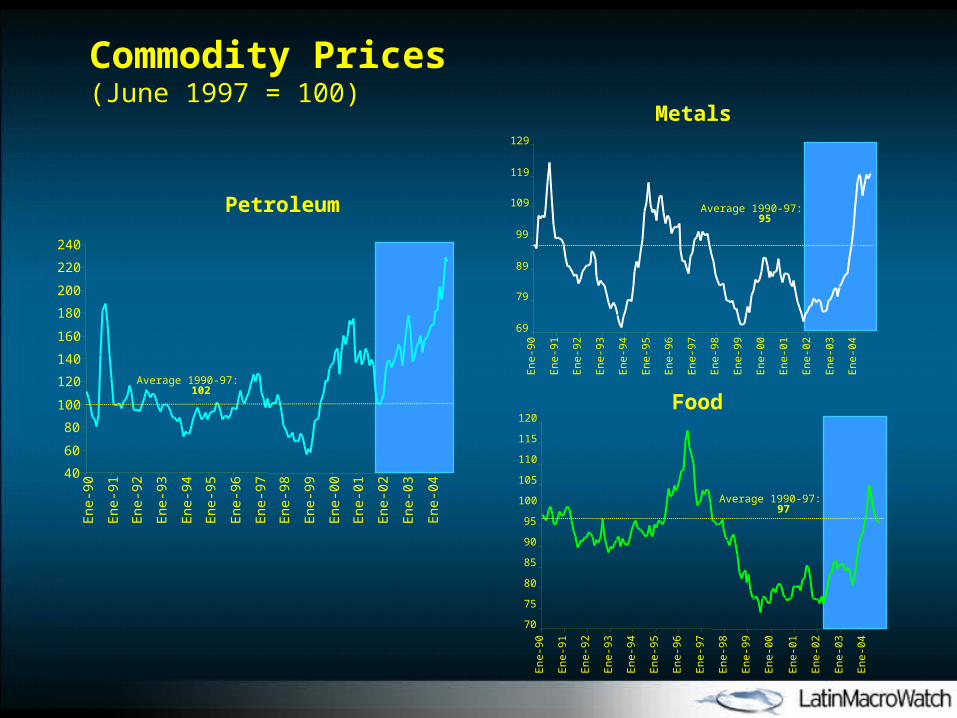
Commodity Prices(June 1997 = 100)
Petroleum
Metals
Food
69
79
89
99
109
119
129
Ene
-90
Ene
-91
Ene
-92
Ene
-93
Ene
-94
Ene
-95
Ene
-96
Ene
-97
Ene
-98
Ene
-99
Ene
-00
Ene
-01
Ene
-02
Ene
-03
Ene
-04
Average 1990-97: 95
70
75
80
85
90
95
100
105
110
115
120
Ene
-90
Ene
-91
Ene
-92
Ene
-93
Ene
-94
Ene
-95
Ene
-96
Ene
-97
Ene
-98
Ene
-99
Ene
-00
Ene
-01
Ene
-02
Ene
-03
Ene
-04
Average 1990-97: 97
40
60
80
100
120
140
160
180
200
220
240
Ene
-90
Ene
-91
Ene
-92
Ene
-93
Ene
-94
Ene
-95
Ene
-96
Ene
-97
Ene
-98
Ene
-99
Ene
-00
Ene
-01
Ene
-02
Ene
-03
Ene
-04
Average 1990-97: 102
250
350
450
550
650
750
850
950
1050
ene
-02
mar
-02
may
-02
jul-0
2
sep-
02
nov-
02
ene
-03
mar
-03
may
-03
jul-0
3
sep-
03
nov-
03
ene
-04
mar
-04
may
-04
jul-0
4
sep-
04
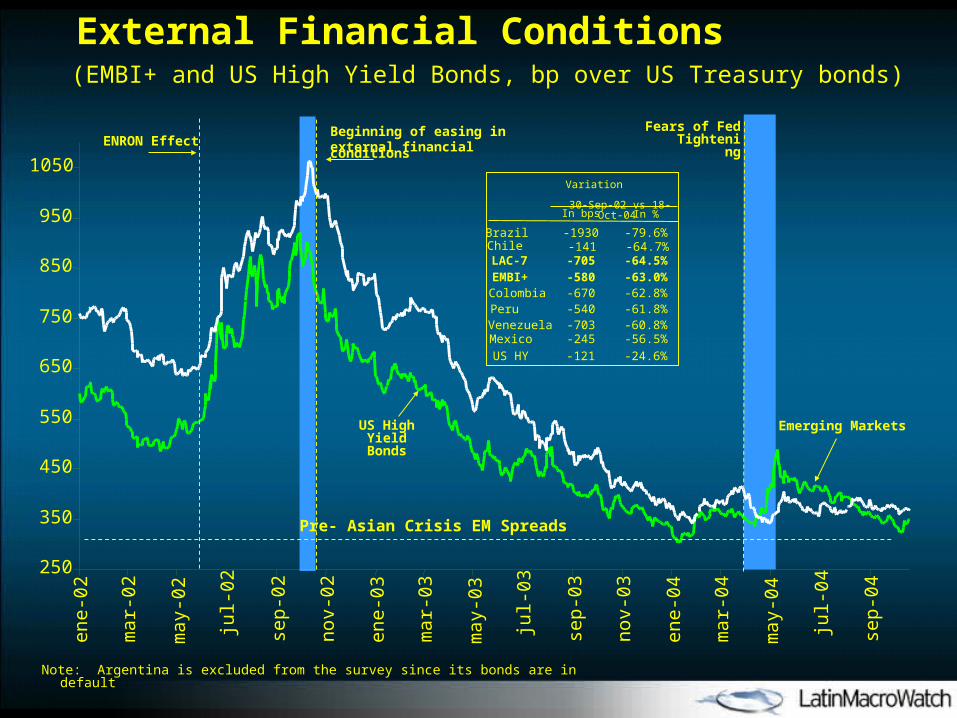
(EMBI+ and US High Yield Bonds, bp over US Treasury bonds)
External Financial Conditions
Emerging MarketsUS High Yield Bonds
Pre- Asian Crisis EM Spreads
ENRON EffectFears of Fed
Tightening
Note: Argentina is excluded from the survey since its bonds are in default
Beginning of easing in external financial conditions
Variation 30-Sep-02 vs 18-Oct-04
In bps
Mexico -245 -56.5%
Brazil -1930 -79.6%
Venezuela -703 -60.8%
Chile -141 -64.7%
Peru -540 -61.8%Colombia -670 -62.8%
LAC-7 -64.5%-705EMBI+ -63.0%-580
In %
US HY -121 -24.6%
01
-en
e-0
4
15
-en
e-0
4
29
-en
e-0
4
12
-fe
b-0
4
26
-fe
b-0
4
11
-ma
r-0
4
25
-ma
r-0
4
08
-ab
r-0
4
22
-ab
r-0
4
06
-ma
y-0
4
20
-ma
y-0
4
03
-ju
n-0
4
17
-ju
n-0
4
01
-ju
l-0
4
15
-ju
l-0
4
29
-ju
l-0
4
12
-ag
o-0
4
26
-ag
o-0
4
09
-se
p-0
4
23
-se
p-0
4
07
-oct
-04
300
350
400
450
500
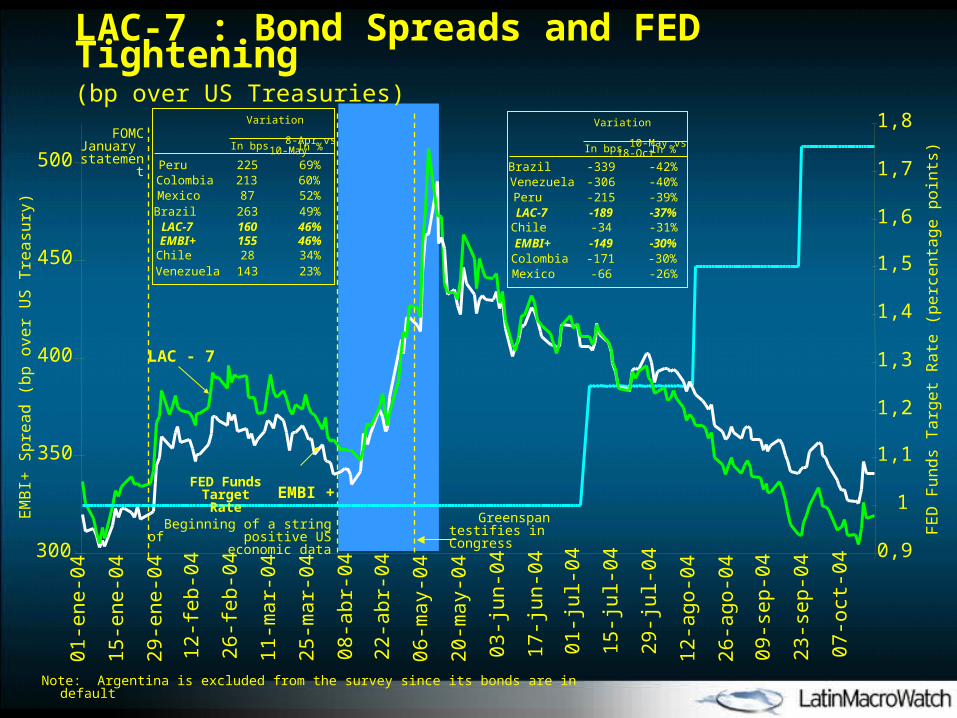
LAC-7 : Bond Spreads and FED Tightening(bp over US Treasuries)
FOMC January
statement
Beginning of a string of positive US economic data
Greenspan testifies in Congress
LAC - 7
EMBI +
Note: Argentina is excluded from the survey since its bonds are in default
EM
BI+
Sp
rea
d (
bp
ove
r U
S T
rea
sury
)
Variation 8-Apr vs 10-May
In bps
Mexico 87 52%Brazil 263 49%
Venezuela 143 23%Chile 28 34%
Peru 225 69%Colombia 213 60%
LAC-7 46%160EMBI+ 46%155
In %
0,9
1
1,1
1,2
1,3
1,4
1,5
1,6
1,7
1,8
FE
D F
un
ds
Ta
rge
t R
ate
(p
erc
en
tag
e p
oin
ts)
FED Funds Target Rate
Variation 10-May vs 18-Oct
In bps
Mexico -66 -26%
Brazil -339 -42%Venezuela -306 -40%
Chile -34 -31%
Peru -215 -39%
Colombia -171 -30%
LAC-7 -37%-189
EMBI+ -30%-149
In %

FED Tightening Expectations
0,90
1,10
1,30
1,50
1,70
1,90
2,10
2,30
2,50
01
/15
/04
02
/15
/04
03
/15
/04
04
/15
/04
05
/15
/04
06
/15
/04
07
/15
/04
08
/15
/04
09
/15
/04
FED Funds Target Rate
FED Funds 12-month Rate
3,6
3,8
4
4,2
4,4
4,6
4,8
En
e-0
4
Fe
b-0
4
Ma
r-0
4
Ab
r-0
4
Ma
y-0
4
Jun
-04
Jul-0
4
Ag
o-0
4
Se
p-0
4
Oct
-04
10 Years Treasury N/B
FOMC January statement
Beginning of a stream of positive US economic data
Greenspan testifies in Congress
Target & 12- month FED Funds Rate

97
102
107
112
117
122
127
132
137
142
147
152E
ne-0
2
Mar
-02
May
-02
Jul-0
2
Sep
-02
Nov
-02
Ene
-03
Mar
-03
May
-03
Jul-0
3
Sep
-03
Nov
-03
Ene
-04
Mar
-04
May
-04
Jul-0
4
Sep
-04
90
110
130
150
170
190
210
230
250
270
290
310
Bond Index
Stock Prices in US$
LAC-7: Assets Prices (Stocks & Bonds; Oct-02=100)
Sto
ck
s
Bo
nd
s
Fears of Fed Tightening
Oct-02 – Oct-04, %
Mexico 17.8
Brazil 87.0
Venezuela 28.6
Chile 7.5
Peru 39.0
Colombia 42.3
LAC-7 36.7*
70.3
257.1
209.5
130.4
238.1
218.9
200.6
Bonds Stocks
Beginning of easing in external financial conditions
Argentina 279.8
*excluding Argentina
130000
140000
150000
160000
170000
180000
190000
Ene
-97
Jul-9
7
Ene
-98
Jul-9
8
Ene
-99
Jul-9
9
Ene
-00
Jul-0
0
Ene
-01
Jul-0
1
Ene
-02
Jul-0
2
Ene
-03
Jul-0
3
Ene
-04
Jul-0
4
55
60
65
70
75
80
85
90
95
100
105
En
e-9
7
Jul-9
7
En
e-9
8
Jul-9
8
En
e-9
9
Jul-9
9
En
e-0
0
Jul-0
0
En
e-0
1
Jul-0
1
En
e-0
2
Jul-0
2
En
e-0
3
Jul-0
3
En
e-0
4
Jul-0
4
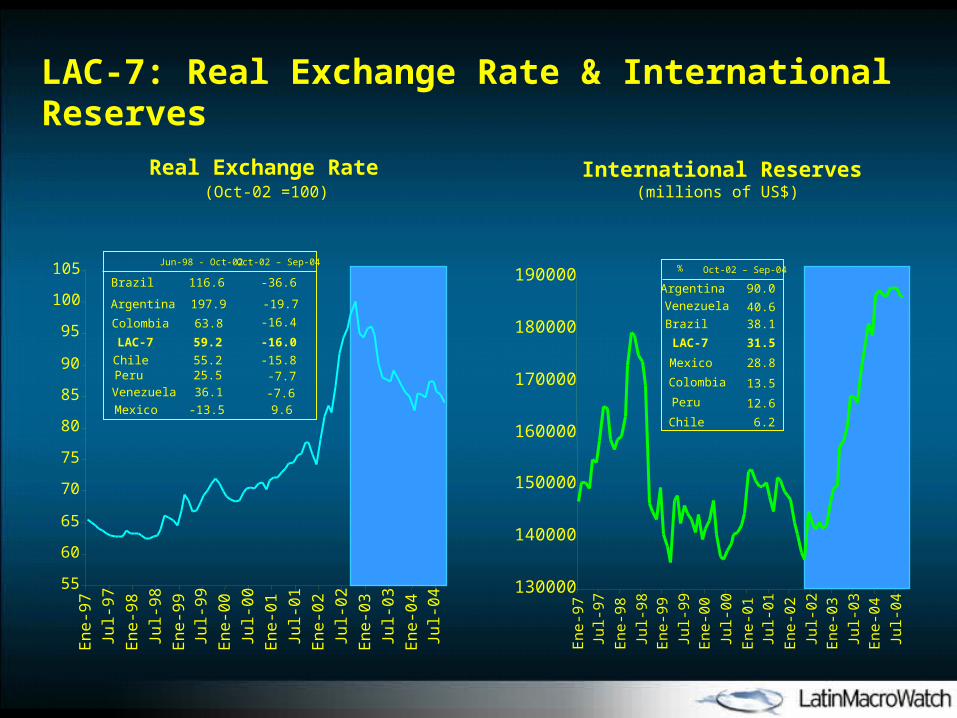
LAC-7: Real Exchange Rate & International Reserves
Real Exchange Rate(millions of US$)
International Reserves(Oct-02 =100)
Jun-98 - Oct-02 Oct-02 – Sep-04
Mexico -13.5 9.6
Brazil 116.6 -36.6
Venezuela 36.1 -7.6
Chile 55.2 -15.8Peru 25.5 -7.7
Colombia 63.8 -16.4
LAC-7 -16.059.2
Oct-02 – Sep-04
Mexico 28.8
Brazil 38.1
Venezuela 40.6
Chile 6.2
Peru 12.6
Colombia 13.5
LAC-7 31.5
Argentina 197.9 -19.7Argentina 90.0
%
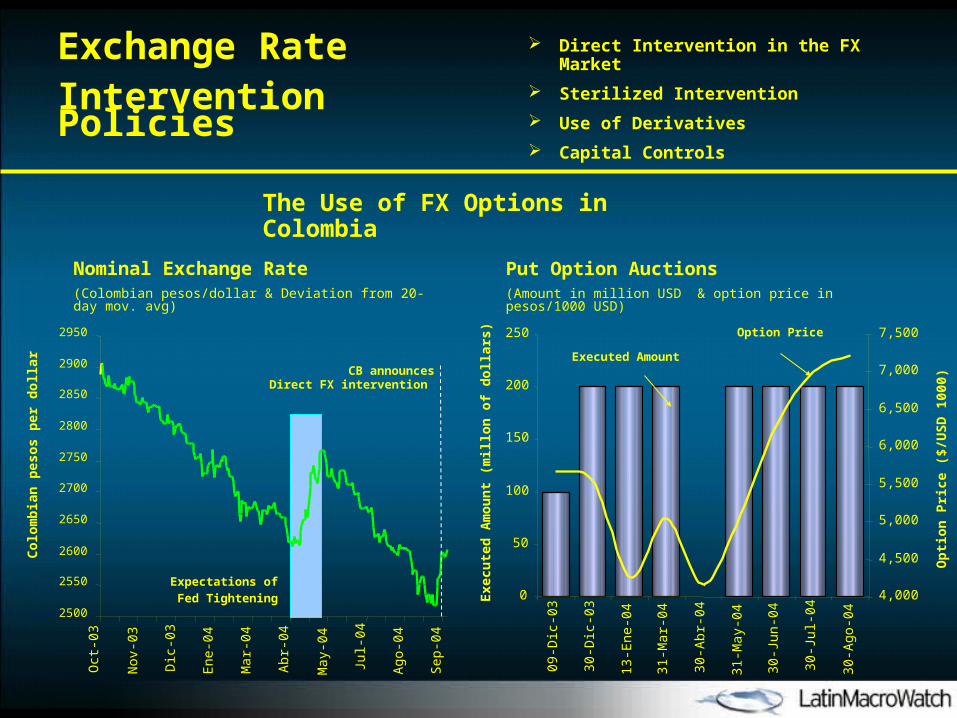
Nominal Exchange Rate(Colombian pesos/dollar & Deviation from 20-day mov. avg)
Put Option Auctions(Amount in million USD & option price in pesos/1000 USD)
Op
tio
n P
rice
($/
US
D 1
000)
Exe
cute
d A
mo
un
t (m
illo
n o
f d
olla
rs)
50
100
150
200
250
09-D
ic-0
3
30-D
ic-0
3
13-E
ne-0
4
31-M
ar-0
4
30-A
br-0
4
31-M
ay-0
4
30-J
un-0
4
30-J
ul-0
4
30-A
go-0
4
0 4,000
4,500
5,000
5,500
6,000
6,500
7,000
7,500Option Price
Executed Amount
Co
lom
bia
n p
eso
s p
er d
olla
r
2500
2550
2600
2650
2700
2750
2800
2850
2900
2950
Oct
-03
Nov
-03
Dic
-03
Ene
-04
Mar
-04
Abr
-04
May
-04
Jul-0
4
Ago
-04
Sep
-04
CB announcesDirect FX intervention
Expectations of
Fed Tightening
Exchange RateIntervention Policies
Direct Intervention in the FX Market
Sterilized Intervention
Use of Derivatives
Capital Controls
The Use of FX Options in Colombia

90
100
110
120
130
140
150
160
170
180
190
1990
.I
1990
.IV
1991
.III
1992
.II
1993
.I
1993
.IV
1994
.III
1995
.II
1996
.I
1996
.IV
1997
.III
1998
.II
1999
.I
1999
.IV
2000
.III
2001
.II
2002
.I
2002
.IV
2003
.III
2004
.II
LAC-7: Investment(s.a. 1990.I=100)
Russian Crisis
Annualized rate
1990.I-1998.II: 7.2%
Annualized rate 1998.II-2002.IV: -3.8%
Annualized rate 2002.IV-2004.II: 8.0%
95
105
115
125
135
145
155
19
90
.I
19
91
.I
19
92
.I
19
93
.I
19
94
.I
19
95
.I
19
96
.I
19
97
.I
19
98
.I
19
99
.I
20
00
.I
20
01
. I
20
02
.I
20
03
.I
20
04
.I
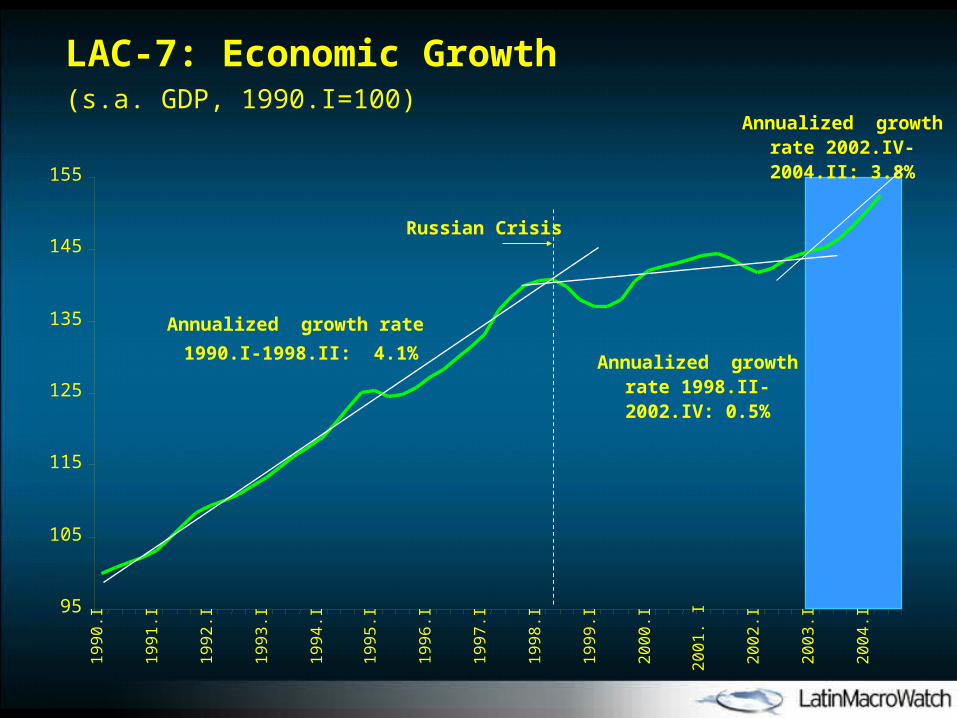
Russian Crisis
LAC-7: Economic Growth(s.a. GDP, 1990.I=100)
Annualized growth rate
1990.I-1998.II: 4.1% Annualized growth rate 1998.II-2002.IV: 0.5%
Annualized growth rate 2002.IV-2004.II: 3.8%
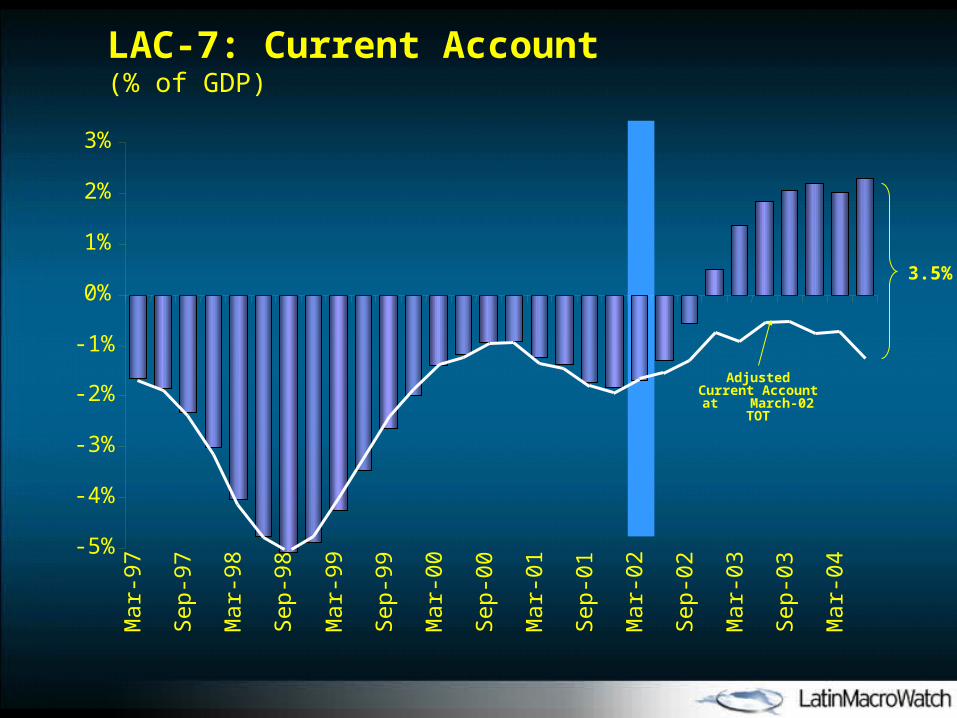
LAC-7: Current Account(% of GDP)
-5%
-4%
-3%
-2%
-1%
0%
1%
2%
3%M
ar-9
7
Se
p-97
Mar
-98
Se
p-98
Mar
-99
Se
p-99
Mar
-00
Se
p-00
Mar
-01
Se
p-01
Mar
-02
Se
p-02
Mar
-03
Se
p-03
Mar
-04
Adjusted Current Account at
March-02 TOT
3.5%
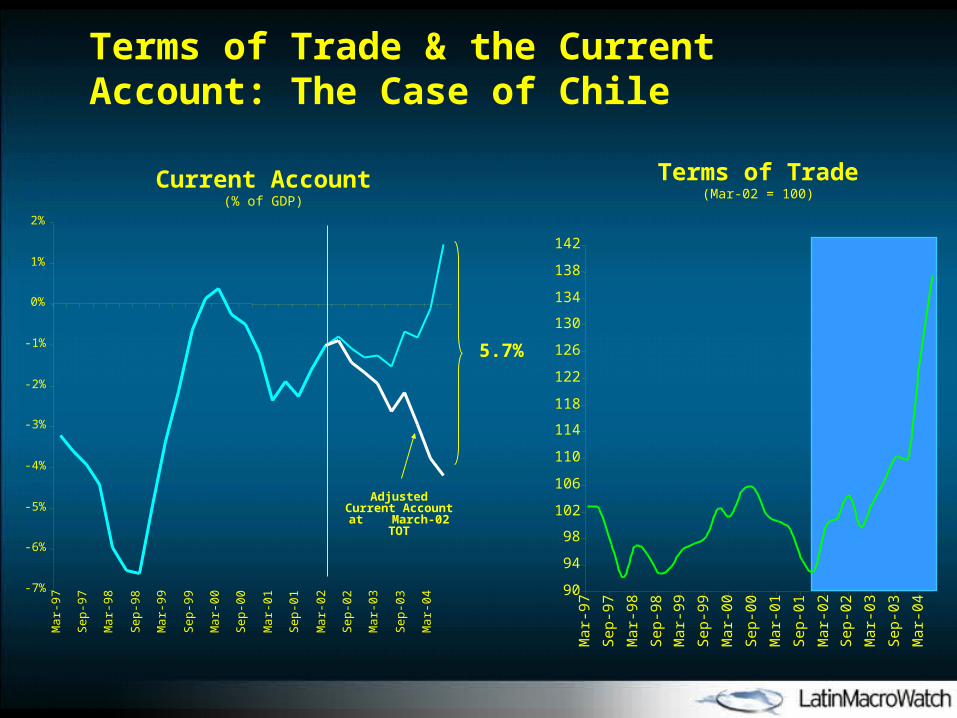
Terms of Trade & the Current Account: The Case of Chile
-7%
-6%
-5%
-4%
-3%
-2%
-1%
0%
1%
2%
Ma
r-9
7
Sep
-97
Ma
r-9
8
Sep
-98
Ma
r-9
9
Sep
-99
Ma
r-0
0
Sep
-00
Ma
r-0
1
Sep
-01
Ma
r-0
2
Sep
-02
Ma
r-0
3
Sep
-03
Ma
r-0
4
Adjusted Current Account at
March-02 TOT
Current Account(% of GDP)
Terms of Trade(Mar-02 = 100)
90
94
98
102
106
110
114
118
122
126
130
134
138
142
Mar
-97
Sep
-97
Mar
-98
Sep
-98
Mar
-99
Sep
-99
Mar
-00
Sep
-00
Mar
-01
Sep
-01
Mar
-02
Sep
-02
Mar
-03
Sep
-03
Mar
-04
5.7%
-4,5%
-4,0%
-3,5%
-3,0%
-2,5%
-2,0%
-1,5%
-1,0%
-0,5%
0,0%
0,5%
1990
1991
1992
1993
1994
1995
1996
1997
1998
1999
2000
2001
2002
2003
2004
2005
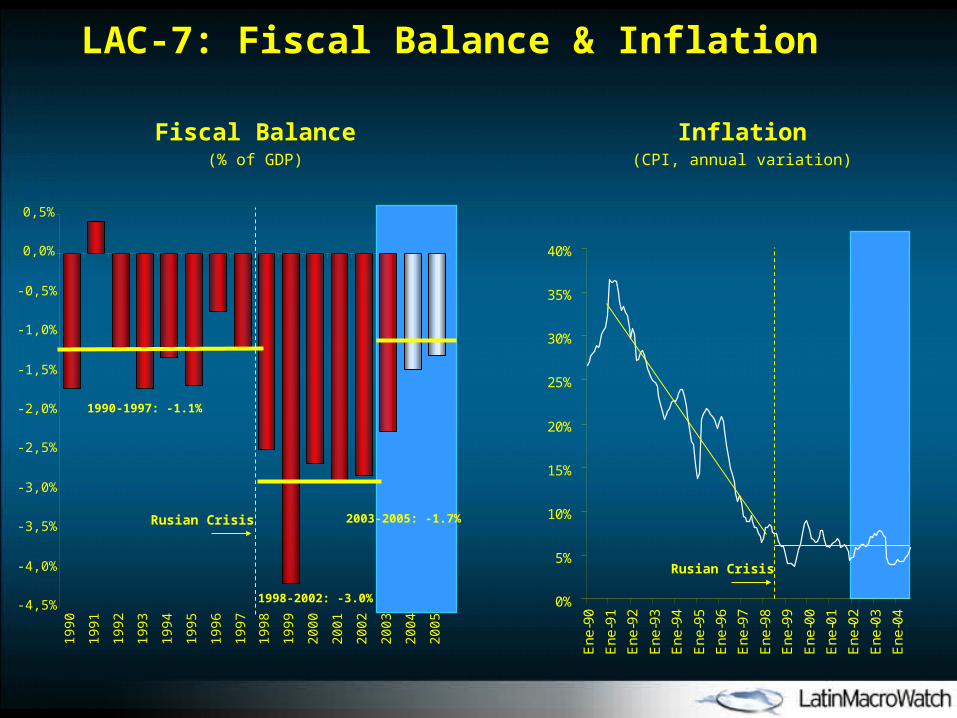
LAC-7: Fiscal Balance & Inflation
1990-1997: -1.1%
1998-2002: -3.0%
Rusian Crisis 2003-2005: -1.7%
Fiscal Balance(% of GDP)
Inflation(CPI, annual variation)
0%
5%
10%
15%
20%
25%
30%
35%
40%
En
e-9
0
En
e-9
1
En
e-9
2
En
e-9
3
En
e-9
4
En
e-9
5
En
e-9
6
En
e-9
7
En
e-9
8
En
e-9
9
En
e-0
0
En
e-0
1
En
e-0
2
En
e-0
3
En
e-0
4
Rusian Crisis

20%
25%
30%
35%
40%
45%
50%
55%19
90
1991
1992
1993
1994
1995
1996
1997
1998
1999
2000
2001
2002
2003
2004
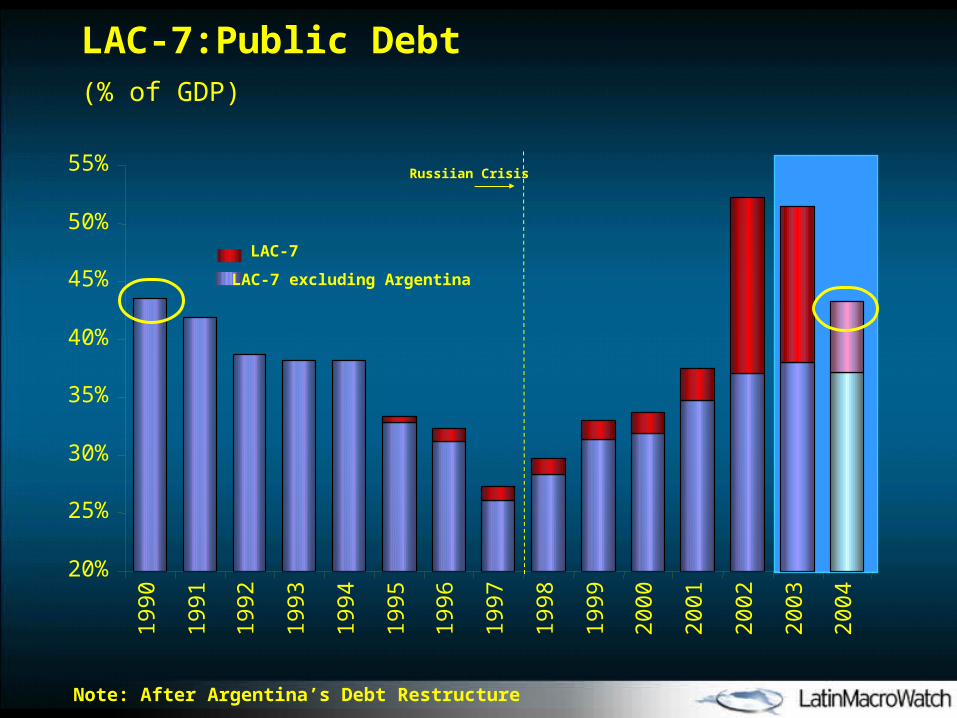
LAC-7:Public Debt(% of GDP)
Russiian Crisis
LAC-7 excluding Argentina
LAC-7
20%
25%
30%
35%
40%
45%
50%
55%19
90
1991
1992
1993
1994
1995
1996
1997
1998
1999
2000
2001
2002
2003
2004
LAC-7:Public Debt(% of GDP)
Russiian Crisis
LAC-7 excluding Argentina
LAC-7
Note: After Argentina’s Debt Restructure

I.I. Back to the Future...?Back to the Future...?
II.II. Brazil: Riding on LeverageBrazil: Riding on Leverage
III.III. Argentina: Riding on the “V”Argentina: Riding on the “V”
OUTLINE

(EMBI+, US High Yield Bonds and EMBI+ Brazil, bp over US Treasury bonds)External Financial Conditions
300
400
500
600
700
800
900
1000
1100
ene
-02
mar
-02
may
-02
jul-0
2
sep-
02
nov-
02
ene
-03
mar
-03
may
-03
jul-0
3
sep-
03
nov-
03
ene
-04
mar
-04
may
-04
jul-0
4
sep-
04
200
700
1200
1700
2200
2700
Emerging Markets
US High Yield Bonds
Enron Effect + Political Uncertainty
BrazilBeginning of easing in external financial conditions
US
Hig
h Y
ial B
onds
& E
MB
I +
EM
BI B
razi
l
CurrentCurrent Var. in %Var. in %30-Sep-0230-Sep-02
Brazil EMBI+Brazil EMBI+
US HY BondsUS HY Bonds
23962396
994994 372372
-80%-80%466466
-62%-62%
EMBI+EMBI+ 921921 341341 -63%-63%

External Financial Conditions and Domestic Interest Rates(C-Bond Spread in bp, Selic rate and domestic 360-day interest rate in %)
300
800
1300
1800
2300
en
e-0
2
ma
r-0
2
ma
y-0
2
jul-
02
sep
-02
no
v-0
2
en
e-0
3
ma
r-0
3
ma
y-0
3
jul-
03
sep
-03
no
v-0
3
en
e-0
4
ma
r-0
4
ma
y-0
4
jul-
04
sep
-04
13
18
23
28
33
38
Selic rate
Domestic interest rate
C-Bond Spread
Enron Effect + Political Uncertainty
End of Enron Effect + Political Uncertainty
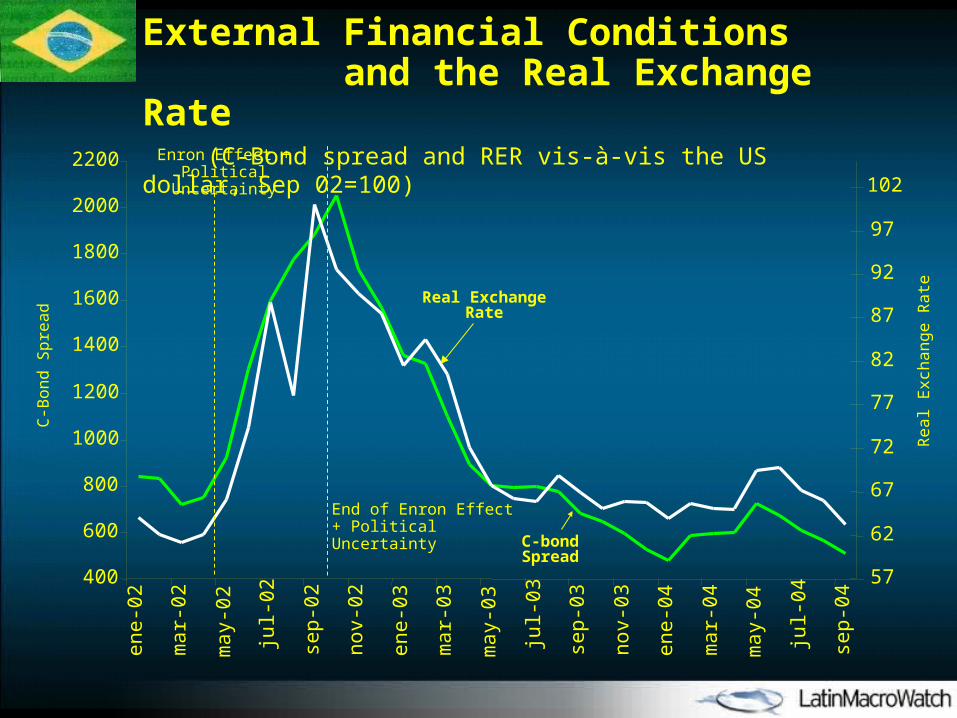
External Financial Conditions and the Real Exchange Rate (C-Bond spread and RER vis-à-vis the US dollar, Sep 02=100)
400
600
800
1000
1200
1400
1600
1800
2000
2200e
ne
-02
ma
r-0
2
ma
y-0
2
jul-
02
sep
-02
no
v-0
2
en
e-0
3
ma
r-0
3
ma
y-0
3
jul-
03
sep
-03
no
v-0
3
en
e-0
4
ma
r-0
4
ma
y-0
4
jul-
04
sep
-04
57
62
67
72
77
82
87
92
97
102
Real Exchange Rate
C-bond Spread
Enron Effect + Political Uncertainty
End of Enron Effect + Political Uncertainty
Re
al E
xch
an
ge
Ra
te
C-B
on
d S
pre
ad
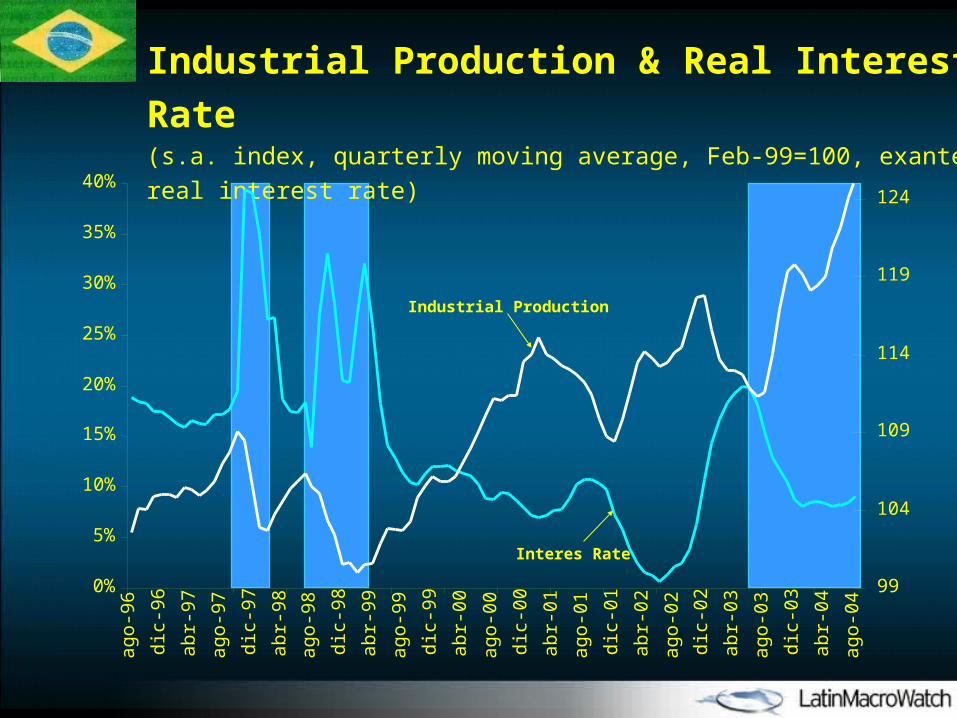
Industrial Production & Real Interest Rate
(s.a. index, quarterly moving average, Feb-99=100, exante
real interest rate)
0%
5%
10%
15%
20%
25%
30%
35%
40%
ago
-96
dic-
96
abr-
97
ago
-97
dic-
97
abr-
98
ago
-98
dic-
98
abr-
99
ago
-99
dic-
99
abr-
00
ago
-00
dic-
00
abr-
01
ago
-01
dic-
01
abr-
02
ago
-02
dic-
02
abr-
03
ago
-03
dic-
03
abr-
04
ago
-04
99
104
109
114
119
124
Industrial Production
Interes Rate
75
80
85
90
95
100
105
110
115
I-1
99
1
I-1
99
2
I-1
99
3
I-1
99
4
I-1
99
5
I-1
99
6
I-1
99
7
I-1
99
8
I-1
99
9
I-2
00
0
I-2
00
1
I-2
00
2
I-2
00
3
I-2
00
4
Russian Crisis
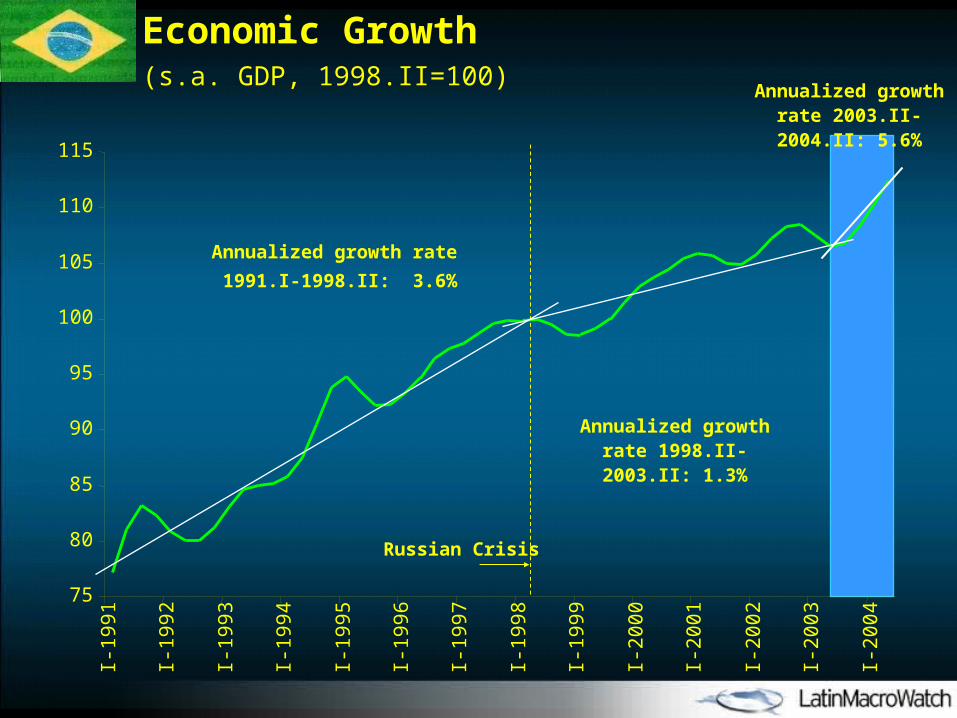
Economic Growth(s.a. GDP, 1998.II=100)
Annualized growth rate
1991.I-1998.II: 3.6%
Annualized growth rate 1998.II-2003.II: 1.3%
Annualized growth rate 2003.II-2004.II: 5.6%
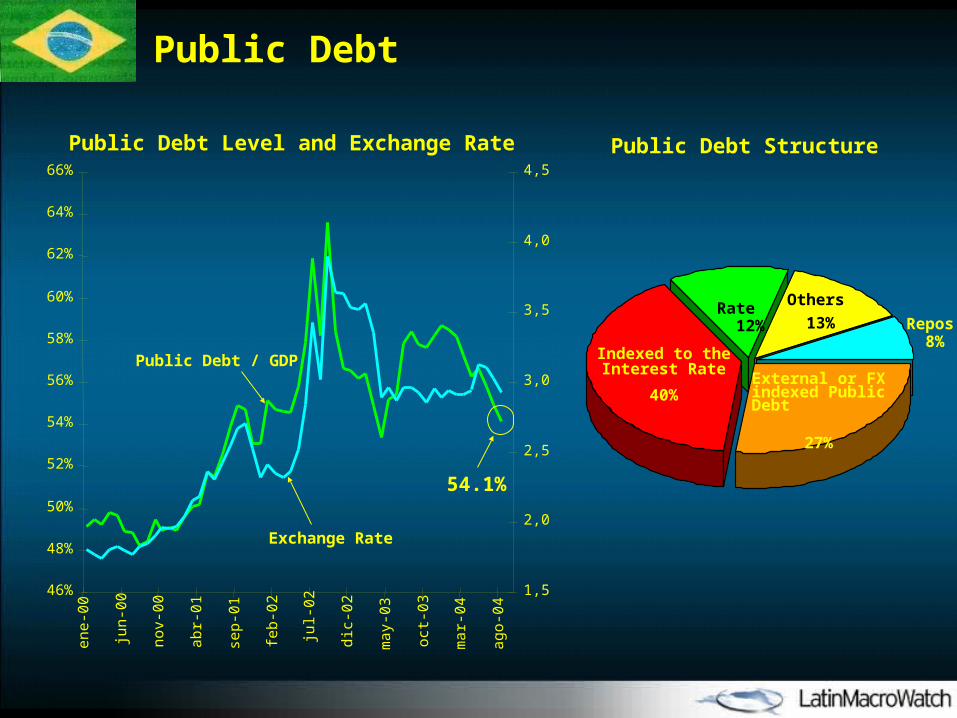
Public Debt
46%
48%
50%
52%
54%
56%
58%
60%
62%
64%
66%
ene-
00
jun-
00
nov-
00
abr-
01
sep-
01
feb-
02
jul-0
2
dic-
02
may
-03
oct-
03
mar
-04
ago-
04
1,5
2,0
2,5
3,0
3,5
4,0
4,5
Public Debt / GDP
Exchange Rate
54.1%
Fixed
Rate 12%
Others
13%
External or FX indexed Public Debt
27%
Indexed to the Interest Rate
40%
Public Debt Structure
Repos 8%
Public Debt Level and Exchange Rate
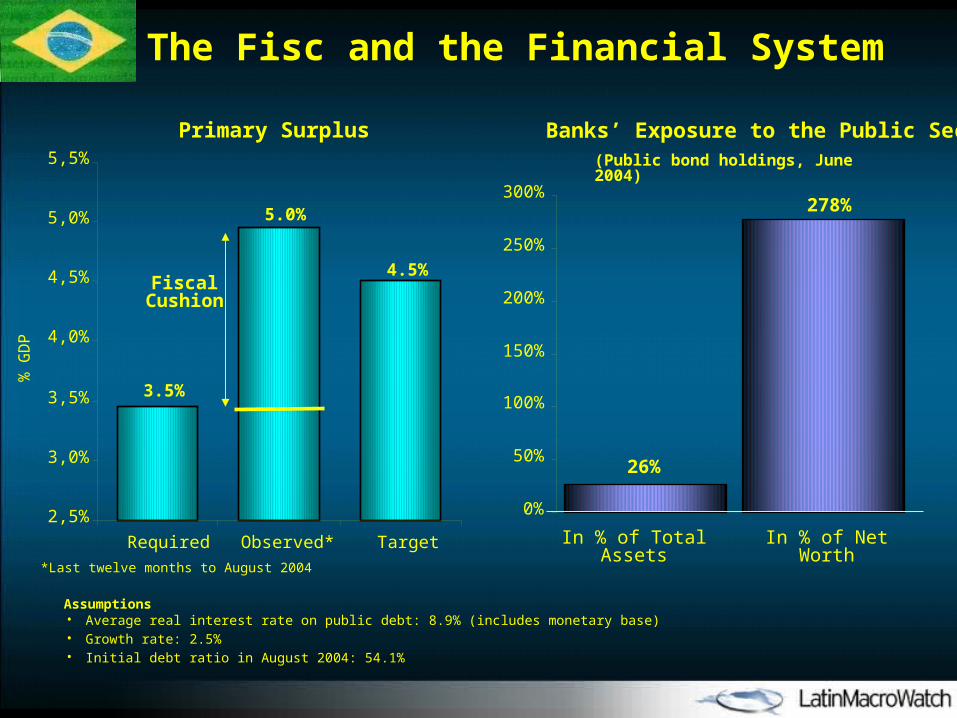
Primary Surplus
The Fisc and the Financial System
2,5%
3,0%
3,5%
4,0%
4,5%
5,0%
5,5%
Required Observed* Target
Fiscal Cushion
% G
DP
*Last twelve months to August 2004
3.5%
5.0%
4.5%
0%
50%
100%
150%
200%
250%
300%
In % of Total Assets
278%
26%
In % of Net Worth
(Public bond holdings, June 2004)
Banks’ Exposure to the Public Sector
• Average real interest rate on public debt: 8.9% (includes monetary base)• Growth rate: 2.5%• Initial debt ratio in August 2004: 54.1%
Assumptions
14
16
18
20
22
24
26
28
ene
-02
abr-
02
jul-0
2
oct-
02
dic-
02
mar
-03
jun-
03
sep-
03
dic-
03
mar
-04
jun-
04
sep-
04
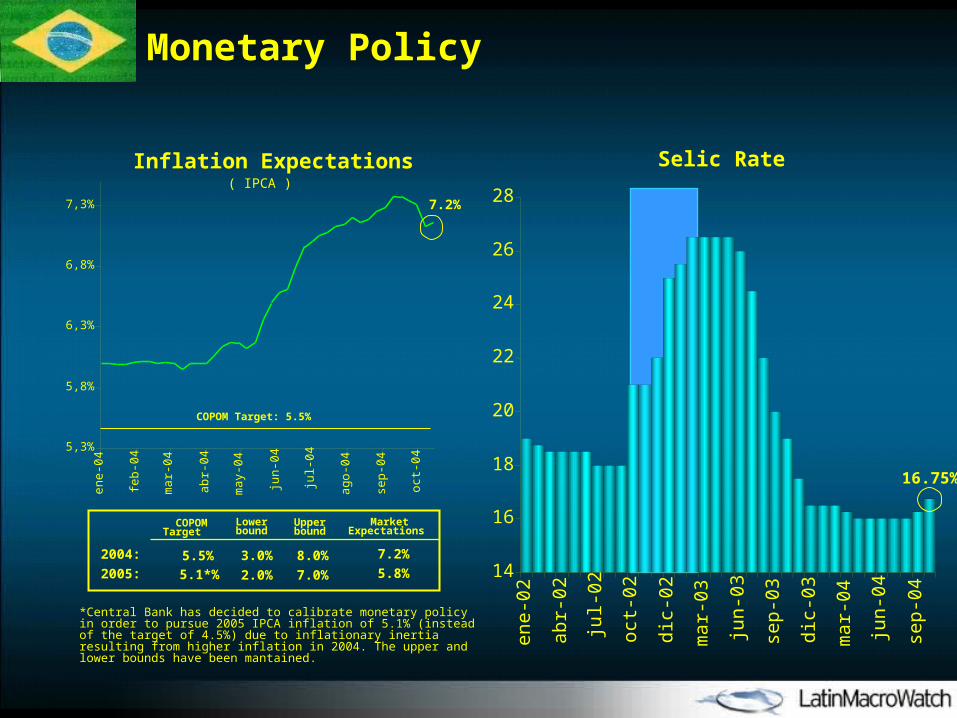
Selic Rate
16.75%
5,3%
5,8%
6,3%
6,8%
7,3%
en
e-0
4
feb
-04
ma
r-0
4
ab
r-0
4
ma
y-0
4
jun
-04
jul-
04
ag
o-0
4
sep-
04
oct
-04
Inflation Expectations( IPCA )
*Central Bank has decided to calibrate monetary policy in order to pursue 2005 IPCA inflation of 5.1% (instead of the target of 4.5%) due to inflationary inertia resulting from higher inflation in 2004. The upper and lower bounds have been mantained.
5.5% 7.2%
5.8%
2004:
2005:
COPOM Target
Market Expectations
Lower bound
Upper bound
5.1*%
3.0%
2.0%
8.0%
7.0%
COPOM Target: 5.5%
Monetary Policy
7.2%

4,5
6,5
8,5
10,5
12,5
14,5
16,5
18,5
nov-
00
abr-
01
sep-
01
feb-
02
jul-0
2
dic-
02
may
-03
oct-
03
feb-
04
jul-0
4
0,5
1,5
2,5
3,5
4,5
5,5
6,5
7,5
Mexico
US Fed Funds rate
Fe
d F
un
ds
Ra
te
Me
xico
In
terb
an
k R
ate
Mexico
2,0
3,0
4,0
5,0
6,0
7,0
8,0
9,0
10,0
Ene
-01
May
-01
Sep
-01
Ene
-02
May
-02
Sep
-02
Ene
-03
May
-03
Sep
-03
Ene
-04
May
-04
Sep
-04
Peru
1%
2%
3%
4%
5%
6%
7%
Ago
-01
Nov
-01
Feb
-02
May
-02
Ago
-02
Nov
-02
Feb
-03
May
-03
Ago
-03
Nov
-03
Feb
-04
May
-04
Ago
-04
Chile
Monetary Policy Tightening in LAC-7

I.I. Back to the Future...?Back to the Future...?
II.II. Brazil: Riding on LeverageBrazil: Riding on Leverage
III.III. Argentina: Riding on the “V”Argentina: Riding on the “V”
OUTLINE
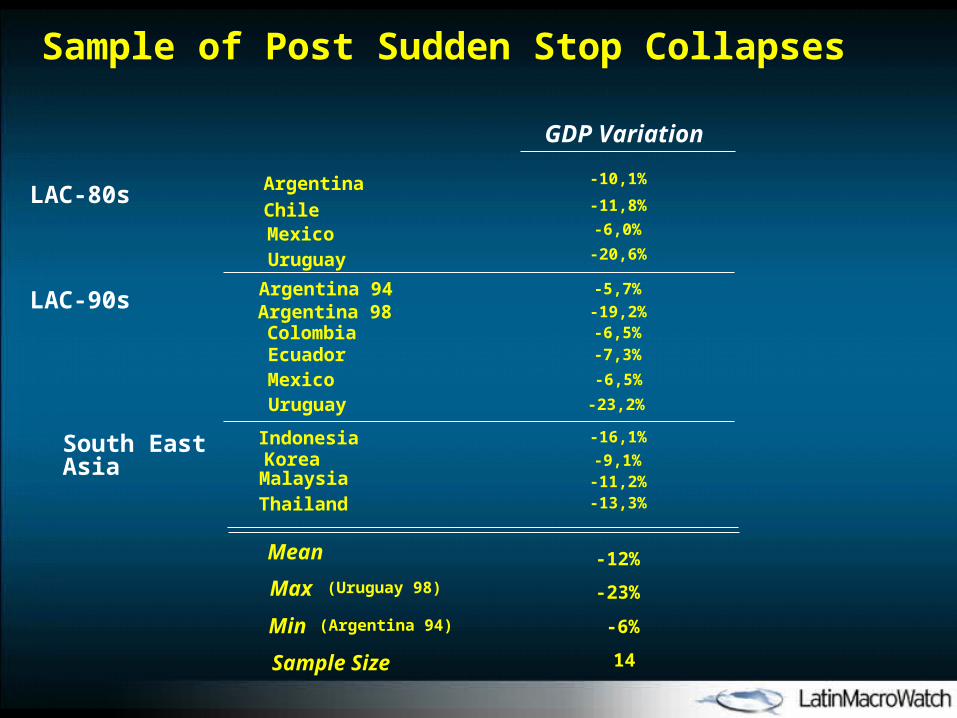
Sample of Post Sudden Stop Collapses
GDP Variation
LAC-80s Argentina -10,1%
Chile -11,8%
Mexico -6,0%
Uruguay -20,6%
LAC-90s Argentina 94 -5,7%
Argentina 98 -19,2%Colombia -6,5%
Ecuador -7,3%
Mexico -6,5%
Uruguay -23,2%
South East Asia
Indonesia -16,1%
Korea -9,1%Malaysia -11,2%
Thailand -13,3%
Max -23%(Uruguay 98)
Min -6%(Argentina 94)
Mean -12%
Sample Size 14
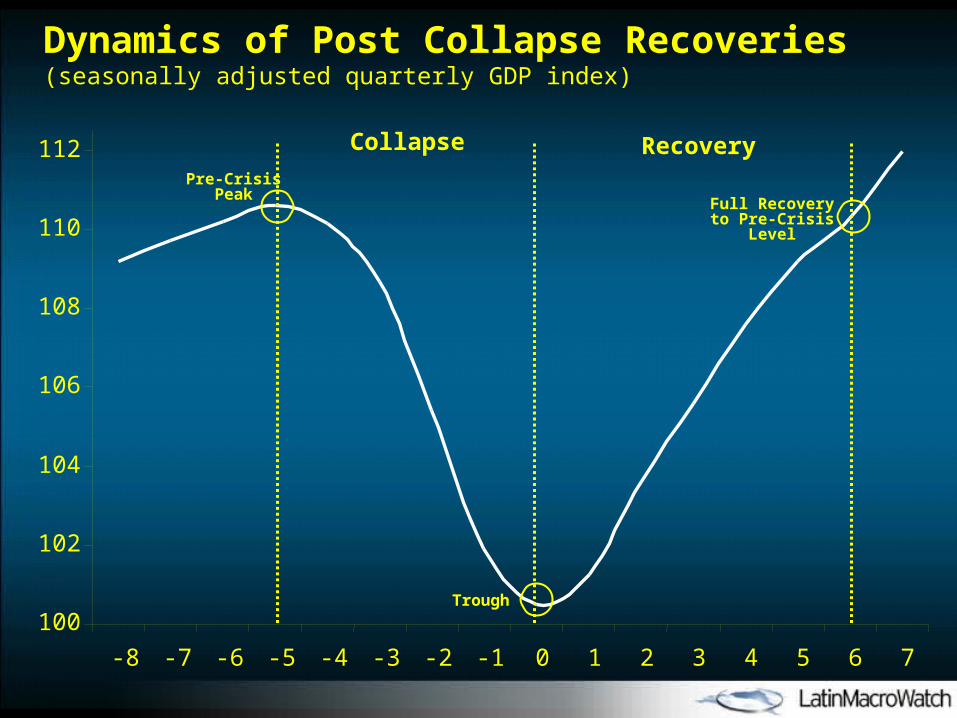
100
102
104
106
108
110
112
-8 -7 -6 -5 -4 -3 -2 -1 0 1 2 3 4 5 6 7
Dynamics of Post Collapse Recoveries(seasonally adjusted quarterly GDP index)
Collapse RecoveryPre-Crisis
Peak
Trough
Full Recovery to Pre-Crisis Level
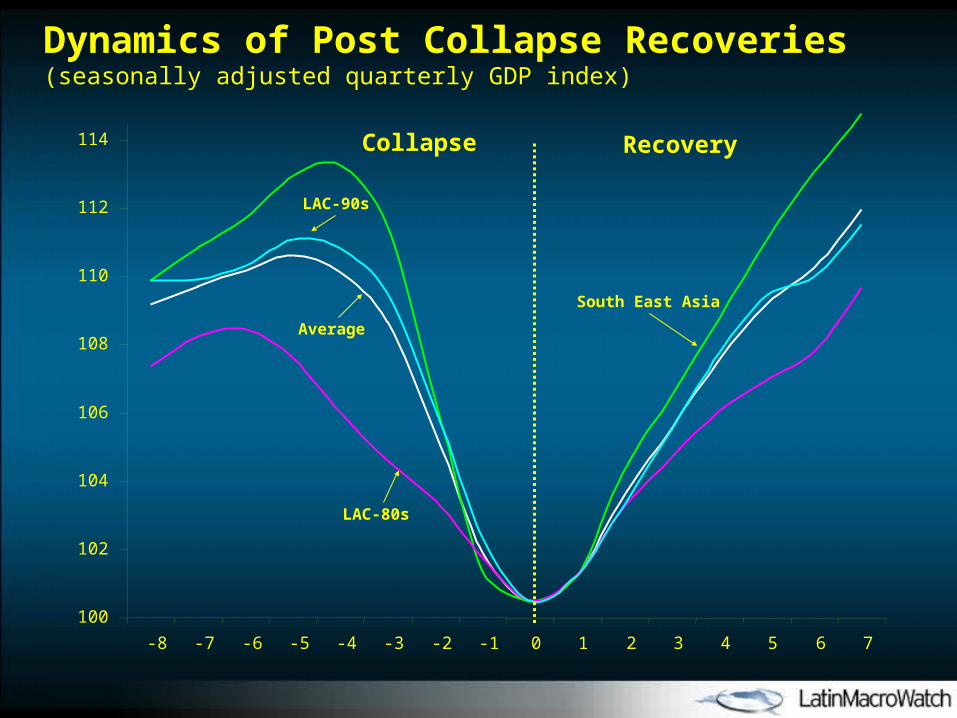
100
102
104
106
108
110
112
114
-8 -7 -6 -5 -4 -3 -2 -1 0 1 2 3 4 5 6 7
Collapse Recovery
Average
South East Asia
LAC-80s
LAC-90s
Dynamics of Post Collapse Recoveries(seasonally adjusted quarterly GDP index)

99
102
105
108
111
114
117
120
123
126
-15 -13 -11 -9 -7 -5 -3 -1 1 3 5 7
100
102
104
106
108
110
112
114
Arg
entin
a 98
Ave
rage
Argentina’s Recovery in Perspective (seasonally adjusted quarterly GDP index)
Average
Argentina
Collapse RecoveryPre-Collapse
IQ 01
IIIQ 98
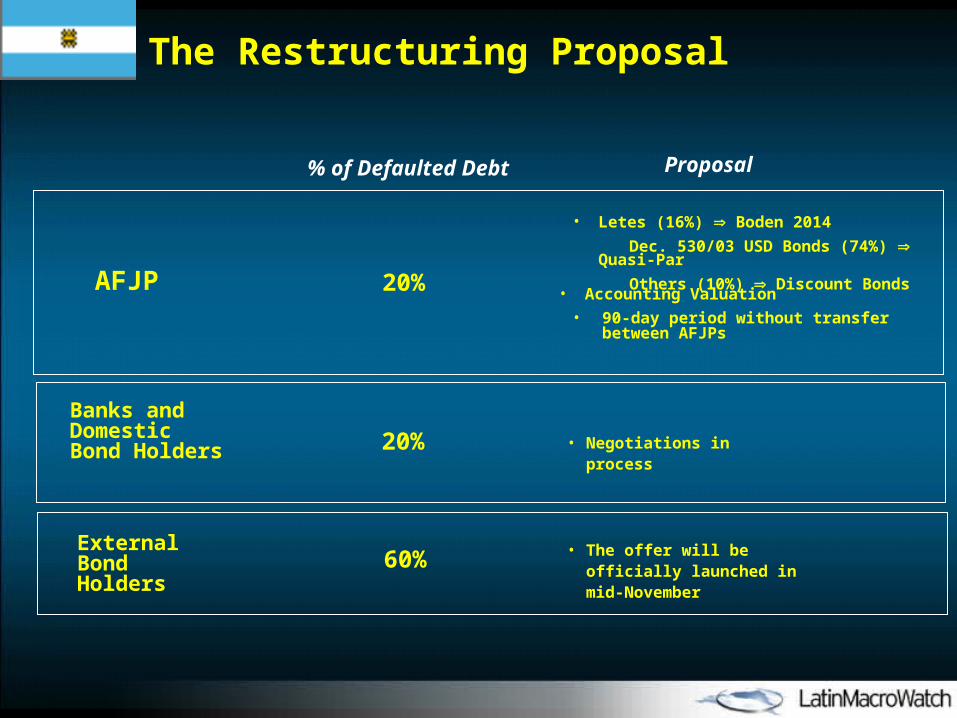
Proposal
AFJP
Banks and Domestic Bond Holders • Negotiations in process
External Bond Holders
The Restructuring Proposal
% of Defaulted Debt
20%
20%
60%
• Letes (16%) Boden 2014
Dec. 530/03 USD Bonds (74%) Quasi-Par
Others (10%) Discount Bonds
• Accounting Valuation
• 90-day period without transfer between AFJPs
• The offer will be officially launched in mid-November
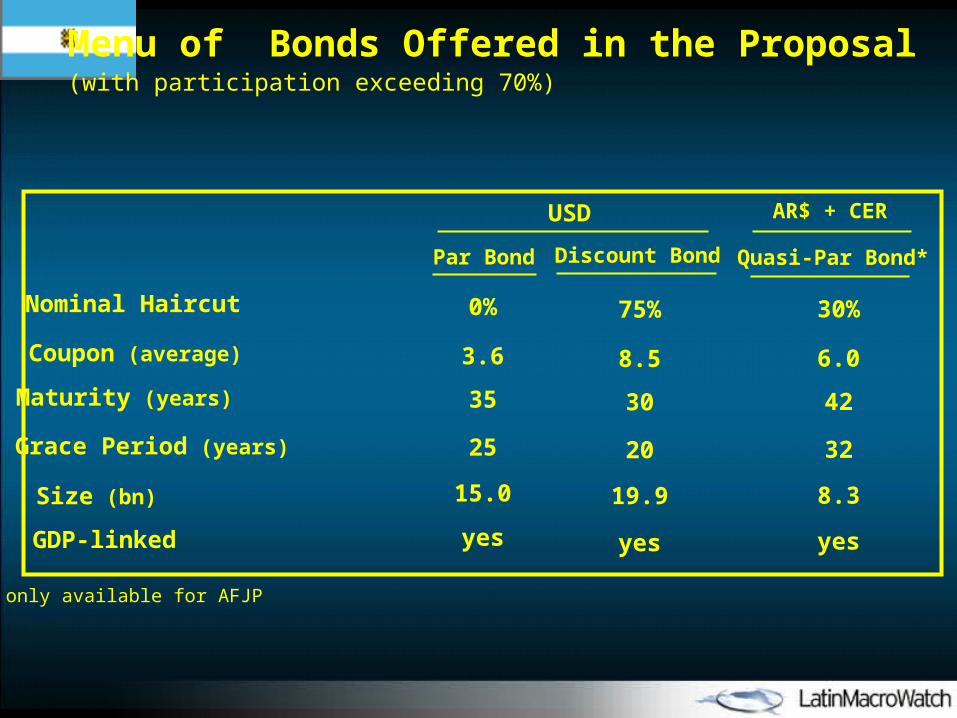
Par Bond Discount Bond Quasi-Par Bond*
Coupon (average) 3.6 8.5 6.0
Maturity (years) 35 30 42
Grace Period (years) 25 20 32
Size (bn) 15.0 19.9 8.3
Menu of Bonds Offered in the Proposal(with participation exceeding 70%)
GDP-linked yes yesyes
USD AR$ + CER
Nominal Haircut 0% 75% 30%
* only available for AFJP
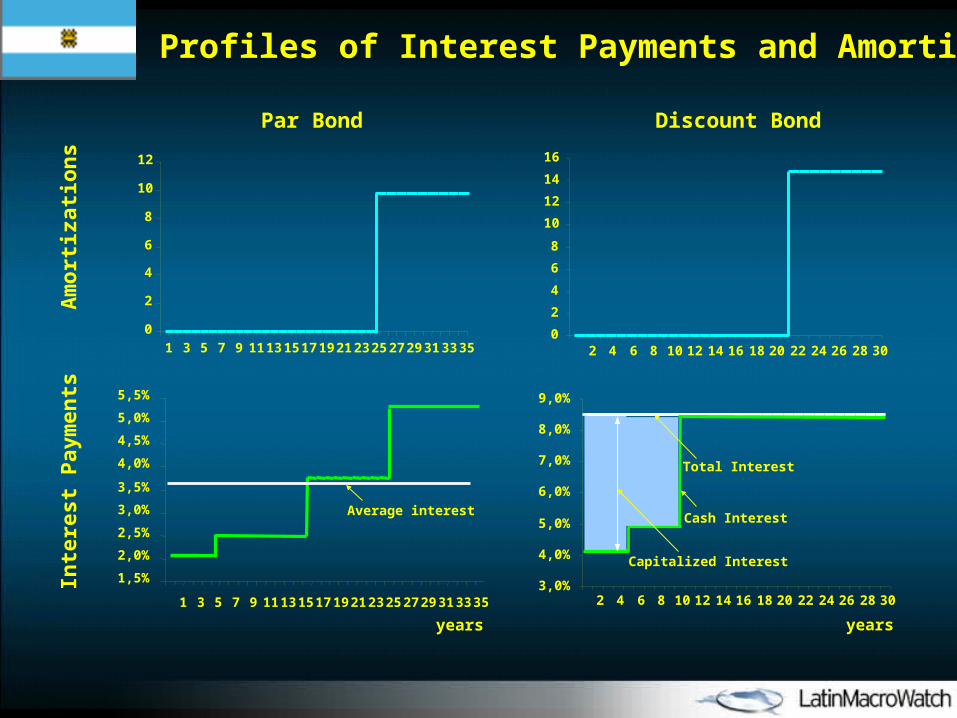
Profiles of Interest Payments and Amortizations
1,5%
2,0%
2,5%
3,0%
3,5%
4,0%
4,5%
5,0%
5,5%
Par Bond Discount Bond
Am
ort
izat
ion
sIn
tere
st P
aym
ents
0
2
4
6
8
10
12
14
16
2 4 6 8 10 12 14 16 18 20 22 24 26 28 30
0
2
4
6
8
10
12
1 3 5 7 9 11 13 15 17 19 21 23 25 27 29 31 33 35
3,0%
4,0%
5,0%
6,0%
7,0%
8,0%
9,0%
2 4 6 8 10 12 14 16 18 20 22 24 26 28 30
Total Interest
Cash Interest
Capitalized Interest
1 3 5 7 9 11 13 15 17 19 21 23 25 27 29 31 33 35
Average interest
years years

Implied NPV Haircut of Argentina’s Proposal* (Discount Bond)
86865858Boden 2012Boden 2012
85856161Ecuador EMBI+Ecuador EMBI+
80808282Uruguay EMBIGUruguay EMBIG
79798686Brazil EMBI+Brazil EMBI+
7474102102EMBI+ EMBI+ (Adj for Arg(Adj for Argentinaentina))
Effective Effective Haircut**Haircut**
Bond Price Bond Price Post RestructuringPost Restructuring
Nominal Nominal HaicutHaicut
7575
7575
7575
7575
7575
** The GDP-linked unit contributes to improve NPV. Estimates range from 1.5% to 4.0% depending on ** The GDP-linked unit contributes to improve NPV. Estimates range from 1.5% to 4.0% depending on assumptions on the discount rate and the volatility of the GDP. assumptions on the discount rate and the volatility of the GDP.
(% of Face Value)(% of Face Value)
* Underlying assumptions: More than 70% acceptance and full recognition of PDI.* Underlying assumptions: More than 70% acceptance and full recognition of PDI.
13,313,3
12,912,9
10,210,2
9,89,8
8,48,4
Discount RateDiscount Rate
(%)(%)
839839
800800
532532
488488
352352
SpreadSpread
(bp)(bp) (%)(%) (%)(%)

Yield Curve of Expected Losses on Defaulted Bonds
(October 2004)
70%
71%72%
73%
74%75%
76%77%
78%
79%80%
81%
2010 2027
Global Bonds
Exp
ecte
d L
oss
74.0%
80.1%
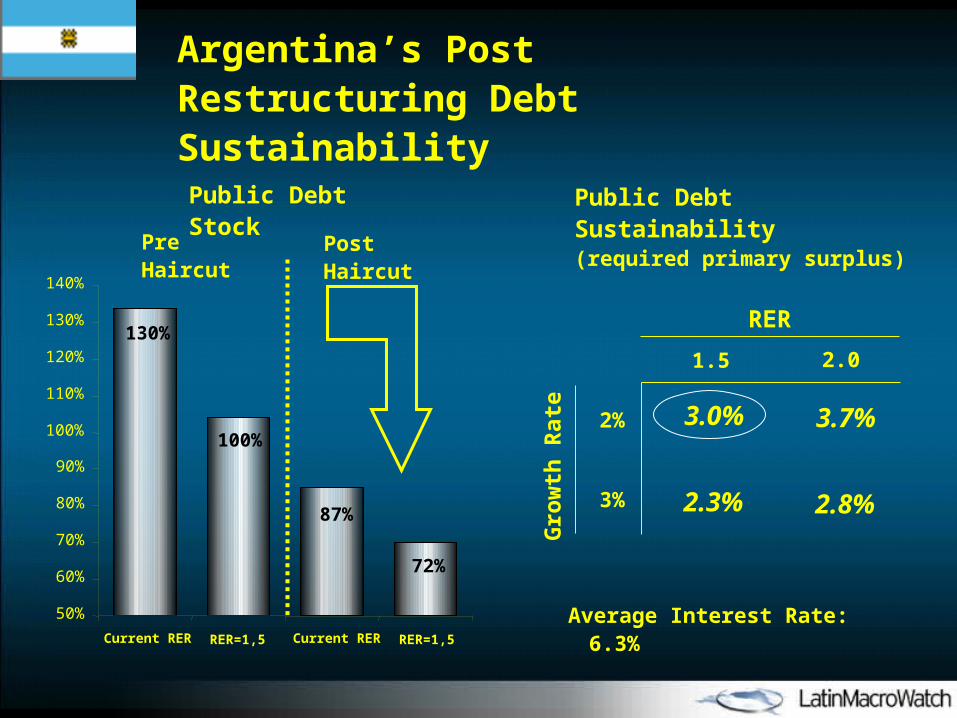
Average Interest Rate: 6.3%50%
60%
70%
80%
90%
100%
110%
120%
130%
140%
130%
100%
87%
72%
Pre Haircut Post Haircut
Current RER RER=1,5 Current RER RER=1,5
Argentina’s Post Restructuring Debt Sustainability
2.0
RER
3.7%3.0%
2.8%2.3%
1.5
Gro
wth
Rat
e
3%
2%
Public Debt Stock Public Debt Sustainability(required primary surplus)

Argentina’s Proposal in the Eyes of Marzano
Outlook for the World Economy:Outlook for the World Economy:
Latin AmericaLatin AmericaOutlook for the World Economy:Outlook for the World Economy:
Latin AmericaLatin America
Ernesto TalviErnesto TalviCERES – Uruguay CERES – Uruguay
Prepared for presentation at the XX Meeting of the Latin Prepared for presentation at the XX Meeting of the Latin American Network of Central Banks and Finance Ministries American Network of Central Banks and Finance Ministries
IADB, Washington D.C.IADB, Washington D.C.
October 25October 25thth, 2004, 2004


![Global Economy Outlook [Axa]](https://img.pdfslide.net/doc/110x75/577ce0661a28ab9e78b33bef/global-economy-outlook-axa.jpg)