Embed Size (px)
Citation preview

Output-based Contracting for Health Service Delivery in
Uganda
PublicPublic--Private Partnership Office, Uganda Ministry of HealthPrivate Partnership Office, Uganda Ministry of HealthInstitute of Public Health, Institute of Public Health, MakerereMakerere UniversityUniversity
CIDA / USAID (CIDA / USAID (PHRplusPHRplus) / World Bank) / World Bank
Mattias Lundberg, HDNVPMattias Lundberg, HDNVPMay 2007May 2007

1
Outline of presentation
BackgroundBackgroundContracting in health careContracting in health careAgency and informationAgency and informationExperimental design, method and sampleExperimental design, method and sampleResultsResultsConclusionsConclusionsNext stepsNext steps

2
1.1. Ministry of Health’s problem
Government of Uganda has public health Government of Uganda has public health goals, but a limited budget.goals, but a limited budget.
WhatWhat’’s the best way to spend public s the best way to spend public resources, to achieve the greatest coverage resources, to achieve the greatest coverage of the right services to the right population?of the right services to the right population?
More money may be necessary, but it is not More money may be necessary, but it is not sufficient, to reach goals.sufficient, to reach goals.

3
More money is not enoughHealth spending and health outcomes
30
35
40
45
50
50 60 70 80
Health spending per capita (US$, lagged)
Und
er-5
mor
talit
y pe
r th
ousa
nd Mexico
Jordan
Source: adapted from WDR 2004

4
More money is not enough
Source: WDR 2004

5
1.2. Health status in Uganda
High infant and maternal mortality High infant and maternal mortality
Success with HIV/AIDS prevalence Success with HIV/AIDS prevalence
But TB and Malaria increasing; low cure rate, But TB and Malaria increasing; low cure rate, drug resistance drug resistance
Widespread antenatal care, but few attended Widespread antenatal care, but few attended birthsbirths
Inequalities among regions and income classInequalities among regions and income class

6
1.3. Health care provision
Private notPrivate not--forfor--profit (PNFP) sector are 1/3 of profit (PNFP) sector are 1/3 of facilities, provide half of curative care.facilities, provide half of curative care.
Decentralization Decentralization –– budget transfer from central budget transfer from central government; increased autonomy for districts.government; increased autonomy for districts.
Private financing 60 percent of total.Private financing 60 percent of total.
User fees eliminated in public facilities:User fees eliminated in public facilities:consumption of public consumption of public andand pnfppnfp health services has health services has increased;increased;oopoop expenditures decreased among poor, increased expenditures decreased among poor, increased among wealthy.among wealthy.

7
1.4. Contracting in Uganda
Three main Medical Three main Medical BureauxBureaux provide primary provide primary services under a services under a ““Memorandum of Memorandum of UnderstandingUnderstanding”” with with MoHMoH
PNFPsPNFPs provide better quality services, targeted to provide better quality services, targeted to poor, more efficiently than public (poor, more efficiently than public (ReinikkaReinikka and and SvenssonSvensson 2002)2002)
Majority of PNFP revenue from Majority of PNFP revenue from MoHMoH base grant, base grant, also private donations, user fees.also private donations, user fees.
PHC grant restrictedPHC grant restricted

8
2.1. Experience with supply-side contracting for health services
Extensive experience of contracting nonExtensive experience of contracting non--clinical services (see clinical services (see egeg BroombergBroomberg and and Mills 1998).Mills 1998).
Less (though increasing) experience with Less (though increasing) experience with clinical services (see clinical services (see egeg Liu et al. 2004).Liu et al. 2004).
Little rigorous evaluationLittle rigorous evaluation
9
2.2. Selected evaluations
Contracting outContracting outBefore & after comparison: Before & after comparison: Guatemala (Nieves and Guatemala (Nieves and La La ForgiaForgia 2000); India (2000); India (LoevinsohnLoevinsohn and Harding 2004); and Harding 2004); Madagascar (Madagascar (MarekMarek et al. 1999)et al. 1999)
With / without comparison: With / without comparison: Bangladesh (Bangladesh (LoevinsohnLoevinsohn2002); Bolivia (2002); Bolivia (LavadenzLavadenz et al. 2001)et al. 2001)
Performance payPerformance payBefore & after comparison: Before & after comparison: Haiti (Eichler et al. Haiti (Eichler et al. 2002)2002)
With / without comparison: With / without comparison: Cambodia (Cambodia (LoevinsohnLoevinsohnet al. 2001) et al. 2001)

10
3.1. Agency and information
Providers, patients, and governments all have Providers, patients, and governments all have different information and different goals.different information and different goals.
PrincipalPrincipal--agent model:agent model:PrincipalsPrincipals –– ieie, those for whom services are produced, those for whom services are produced
Government and clientsGovernment and clients
AgentsAgents –– ieie, those who produce the services, those who produce the services
Physicians, nurses, other providersPhysicians, nurses, other providers

11
3.2. Agency and information
How can principals influence agents?How can principals influence agents?
GovernmentGovernmentRewardsRewardsSanctionsSanctionsSupervisionSupervision
ClientsClientsExitExitVoiceVoice

12
4.1. Experimental design
Addendum to the Addendum to the MoUMoU
Six performance targets, of which the facility can Six performance targets, of which the facility can choose three:choose three:
Increase Increase opdopd by 10%by 10%Increase attended births by 5%Increase attended births by 5%Increase number of children immunized by 10%Increase number of children immunized by 10%Increase modern family planning use by 5%Increase modern family planning use by 5%Increase number of antenatal visits by 10%Increase number of antenatal visits by 10%Increase treatment of malaria among children by 10%Increase treatment of malaria among children by 10%

13
4.2. Experimental design
Addendum to the Addendum to the MoUMoU
Performance bonus payments:Performance bonus payments:1% of base grant for each target met in each 61% of base grant for each target met in each 6--month month periodperiod1% of base grant for each target met by end of year1% of base grant for each target met by end of year1% if two targets are met by end of year1% if two targets are met by end of year1% if three targets are met by end of year1% if three targets are met by end of year
Total possible bonus payments for the year =Total possible bonus payments for the year =
11% (3+3+3+1+1)11% (3+3+3+1+1)

14
4.3. Experimental design
Random assignment of facilities to cellsRandom assignment of facilities to cells
Sample of facilities
Group C (control):no changes
Group B:freedom to spend
resources as it desires
Group A:performance-related
bonuses

15
4.4. Sample
Five districts in first wave of Five districts in first wave of decentralizationdecentralization
Stratified by region and administrative Stratified by region and administrative capacitycapacity
High: High: JinjaJinjaModerate: Moderate: AruaArua, , BushenyiBushenyi, , KyenjojoKyenjojoLow: Low: MukonoMukono
TwiceTwice--yearly surveys (yearly surveys (Facility, Staff, Exit poll, HH)Facility, Staff, Exit poll, HH)

16
Mukono
JinjaKyenjojo
Bushenyi
Arua
17
4.5. Sample
Random assignment of facilities:Random assignment of facilities:22 PNFP facilities in group A (performance bonus)22 PNFP facilities in group A (performance bonus)
23 PNFP facilities in group B (freedom to allocate)23 PNFP facilities in group B (freedom to allocate)
23 PNFP facilities in group C (control group)23 PNFP facilities in group C (control group)
26 Private for26 Private for--profit facilities (in control group)profit facilities (in control group)
26 Public facilities (in control group)26 Public facilities (in control group)

18
4.5. Sample
Three rounds, including retrospective data Three rounds, including retrospective data from facilitiesfrom facilities
Panels:Panels:118 facility surveys (two dropped)118 facility surveys (two dropped)~1200 household surveys from ~1200 household surveys from hhhh in in catchmentcatchmentareasareas
Repeated crossRepeated cross--sections:sections:~1400 exit interviews~1400 exit interviews~1000 staff interviews~1000 staff interviews

19
4.6. Performance criteria
0
20
40
60
80
100
OPD Immunisations Malaria ANC Deliveries Family Planning
Indicator
Perc
ent o
f par
ticip
atin
g fa
cilit
ies

20
5.1. Results: targets reached
0
20
40
60
80
100
OPD IMM MAL ANC DEL FAM
Perc
ent o
f fac
ilitie
s ac
hiev
ing
targ
et
Wave 1
Wave 2

21
5.2. Results: average bonus paid
0
100
200
300
400
500
600
700
Wave 1 bonus Wave 2 bonus Annual bonus + extras
Thou
sand
Shi
lling
s
1.0
1.1
1.2
1.3
1.4
1.5
1.6
1.7
Perc
ent o
f bas
e gr
ant

22
5.3.1. D-in-D tests, group ADifference-in-difference regressions, year-on-year changes, group A facilities choosing targets
(1) -0.197 -0.304 -0.274 -0.334 -0.327(0.388) (0.363) (0.348) (0.350) (0.290)
(2) 0.150 0.207 0.188 0.245 0.210(0.367) (0.381) (0.419) (0.382) (0.467)
(3) -0.181 -0.191 -0.057 -0.280 -0.081(0.368) (0.372) (0.342) (0.377) (0.296)
(4) 0.250 0.309 0.652 0.001 0.706(0.500) (0.557) (0.563) (0.665) (0.876)
(5) 0.466 0.364 0.548 0.094 0.198(0.633) (0.763) (0.850) (0.739) (0.975)
(6) -0.256 -0.195 -0.342 -0.197 -0.641(0.734) (0.776) (0.845) (0.822) (1.061)
(7) -0.914 -0.765 -0.713 -0.833 -0.736(0.512)+ -0.566 -0.622 -0.546 -0.642
Women receiving antenatal care
Outpatient consultations
Immunizations for children under one
Malaria treatment for children under five
Consultations for family planning
Supervised deliveries
Visits for antenatal care
PNFP freedom-to-allocate
Bonus group facilities w/o
targetAll other facilities All other PNFPs
PNFP control group

23
5.3.2. D-in-D tests, group ASummary: difference-in-difference regressions, year-on-year changes, all group A facilities
(1) 0.069 -0.049 0.027 -0.128(0.191) (0.193) (0.205) (0.214)
(2) -0.020 0.049 0.071 0.080(0.202) (0.222) (0.270) (0.253)
(3) -0.110 -0.178 0.018 -0.398(0.183) (0.199) (0.202) (0.229)+
(4) -0.164 -0.113 0.154 -0.457(0.339) (0.414) (0.467) (0.550)
(5) 0.379 0.297 0.576 -0.064(0.313) (0.400) (0.482) (0.439)
(6) 0.162 0.404 0.268 0.500(0.382) (0.433) (0.543) (0.503)
(7) -0.409 -0.247 -0.159 -0.310(0.242)+ (0.288) (0.358) (0.314)
Visits for antenatal care
Women receiving antenatal care
Immunizations for children under oneMalaria treatment for children under fiveConsultations for family planningSupervised deliveries
PNFP freedom-to-allocate
Outpatient consultations
All other facilities All other PNFPs
PNFP control group

24
5.3.3. D-in-D tests, group BSummary: difference-in-difference regressions, year-on-year changes
(1) 0.226 0.143 0.149(0.197) (0.196) (0.241)
(2) -0.116 -0.052 -0.035(0.199) (0.220) (0.236)
(3) 0.384 0.408 0.413(0.181)* (0.197)* (0.240)+
(4) 0.434 0.620 0.782(0.351) (0.420) (0.424)+
(5) 0.499 0.440 0.654(0.275)+ (0.362) (0.367)+
(6) -0.453 -0.364 -0.226(0.352) (0.411) (0.437)
(7) -0.030 0.232 0.167(0.220) (0.269) (0.297)
PNFP control group
Immunizations for children under one
Outpatient consultations
All other facilities
Malaria treatment for children under fiveConsultations for family planningSupervised deliveries
Visits for antenatal care
Women receiving antenatal care
All other PNFPs

25
5.4. A learning curve?0
1020
30
2 4 6 8 10 12quarter
Deliveries pnfp target v all others

26
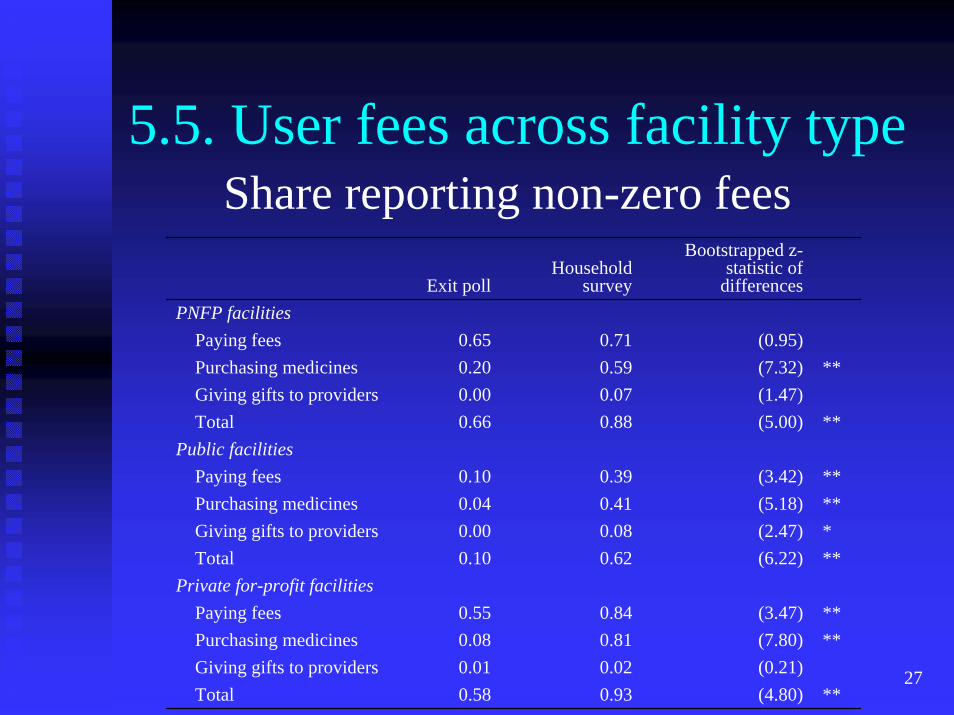
5.5. User fees across facility type
How much did you pay today?Item
Facility type Fees Gifts Medicines
PNFP 2611.11 6.27 376.79
Public 300.68 5.33 59.95
Private 3315.00 99.02 330.71
Total 1949.12 13.89 274.22
27
5.5. User fees across facility type
Exit pollHousehold
survey
Bootstrapped z-statistic of
differencesPNFP facilities
Paying fees 0.65 0.71 (0.95)Purchasing medicines 0.20 0.59 (7.32) **Giving gifts to providers 0.00 0.07 (1.47)Total 0.66 0.88 (5.00) **
Public facilitiesPaying fees 0.10 0.39 (3.42) **Purchasing medicines 0.04 0.41 (5.18) **Giving gifts to providers 0.00 0.08 (2.47) *Total 0.10 0.62 (6.22) **
Private for-profit facilitiesPaying fees 0.55 0.84 (3.47) **Purchasing medicines 0.08 0.81 (7.80) **Giving gifts to providers 0.01 0.02 (0.21)Total 0.58 0.93 (4.80) **
Share reporting non-zero fees

28
5.6. Other results from exit polls
PerformancePerformance--bonus PNFP facilities treating bonus PNFP facilities treating wealthier clients.wealthier clients.Waiting time reduced among freedomWaiting time reduced among freedom--toto--allocate PNFP facilities.allocate PNFP facilities.
Shorter perceived (but not actual) waiting Shorter perceived (but not actual) waiting time among time among ““yellow staryellow star”” facilities.facilities.Prices higher among yellow star facilities.Prices higher among yellow star facilities.

29
6. Conclusions
This performance bonus didnThis performance bonus didn’’t work.t work.Amounts not large enough?Amounts not large enough?Not enough time?Not enough time?
Money may not be the constraint.Money may not be the constraint.
Facilities potentially allocate budgets more Facilities potentially allocate budgets more effectively than the Ministry of Health.effectively than the Ministry of Health.
Remove restrictions on base grant.Remove restrictions on base grant.

30
7. Next steps
Increase the bonus payment?Increase the bonus payment?
Provide assistance with recordProvide assistance with record--keeping?keeping?
Include the public sector in the experiment?Include the public sector in the experiment?
Dynamic impact evaluation?Dynamic impact evaluation?


![UGANDA · Quarterly Report April 1 - June 30, 2014 Ending Period: November 2017 Contract AID-617-C-13-00002 Prepared for [REDACTED], Contracting Officer's Representative (COR) USAID/U](https://img.pdfslide.net/doc/110x75/6148efea9241b00fbd673c5c/uganda-quarterly-report-april-1-june-30-2014-ending-period-november-2017-contract.jpg)