Embed Size (px)
Citation preview
1
OUTSOURCING TO CEE COUNTRIES AND SPANISH INDUSTRIAL EMPLOYMENT: THE SPANISH-TURKEY TRADE RELATIONSHIP IN
1993-2003
Mª Ángeles Cadarso Vecina, Nuria Gómez Sanz, Luis Antonio López Santiago, María Ángeles Tobarra Gómez1
Abstract
The aim of this paper is to investigate the effect of foreign outsourcing, focusing on CEE countries and especially on Turkey, on the level of employment for Spain. The rising economic integration has increased not only trade in final goods but also the flows of intermediate goods, as a result of the fragmentation of production by multinational firms and/or the search for new and cheaper providers. While some see this phenomenon as a threat to domestic employment, it also represents a chance to reduce costs, increase flexibility and open new markets, all of which can raise sales and employment. We study empirically this impact for Spain, a country that joined the EEC in 1986, becoming a low-cost location for many firms, and after twenty-years of development it is now experiencing a strong increase of outsourcing to Central and Eastern European countries with a specific analysis of the case of Turkey.
The trade relationship between Turkey and Spain has been reinforced significantly in the last years and has concentrated in a few sectors, with important relative increase in imports from particular sectors as Agriculture, Textile, Leather goods, Manufacture of footwear, Manufacture of cork and wood, Manufacture of articles of paper and cardboard, Manufacture of rubber and plastic products, Manufacture of electronic components, Manufacture of motor vehicles, Building and repairing of ships and boats, Manufacture of furniture. These are medium-low technology sectors where Spain was relatively-specialized only a few years ago, however production in these sectors is moving away as a result of more intensive trade relationships and globalization.
Following recent literature on the topic, like Feenstra and Hanson (1999), Strauss-Kahn (2003) and Hijzen et al. (2005), outsourcing is measured by intra-industrial imports of inputs, using domestic and import – use matrices of input-output tables, for 92 Spanish manufacturing industries for the period 1993 to 2003. As we are interested in outsourcing to particular countries and groups of countries, we use a similar methodology to Egger and Egger (2003, 2005), Falk and Wolfmayr (2005), and Geishecker (2005), and calculate outsourcing to those countries using our measure of outsourcing and data on imports from the National Customs Agency.
These measures are included in a labour demand function estimated using annual data from the Industrial Survey (Spanish Statistics Institute) on worked hours, added value (net sales minus intermediate purchases) and labour cost. The most appropriate method of estimation, for this panel data with a lagged dependent variable and endogenous and predetermined variables among the regressors, appears to be the GMM system technique (SYS-GMM). Our aim now is to do the same estimation with Turkish data.
We find that the effect of outsourcing differs with industry characteristics, being negative and significant for medium-high-tech industries and not significant for low-tech sectors. Comparing the effect for EU new members and candidates and Turkey our results show a greater negative impact from outsourcing to CEE countries, especially Turkey, on Spanish industrial employment.
We also calculate different measures of vertical specialization, extending the original concept of Hummels et al. (2001), using the domestic and import use matrices and data on Spanish exports. Different Vertical specialization measures have then been included in a labour demand function using 1 Facultad de Ciencias Económicas y Empresariales de Albacete, Universidad de Castilla – La Mancha, Plaza de la Universidad nº 1, 02071, Albacete (Spain). [email protected].

2
data for 72 sectors from the use matrices of the input-output tables in 1995-2000. Furthermore, we also distinguish vertical specialization measures by country of origin, with particular attention to Turkey and discuss the evolution of these measures. Finally, we also estimate a labour demand function for 22 manufacturing Turkish sectors in 1997-2001, including a measure of exports as a proportion of production that seems to have a positive effect on employment.
1. Introduction
In a context of growing international trade, the EU enlargement in 2004 and the forthcoming one have provoked intense commercial relationships between Central and Eastern European countries and the EU-15. As a consequence, the productive structure of the involved countries is changing with effects on production and employment for all sectors, within a general tendency to sectoral specialization. This process mirrors that of Spain back in 1986, when its entry in the EEC (European Economic Community) greatly contributed to growth and structural change in the country, due to the intense trade, multinational enterprises’ activity and increasing specialization in some manufacturing activities, particularly the production of motor vehicles. It also implied changes in the rest of the EEC, as relocation of some activities and trade diversion took place, allowing cost reductions for European firms and re-structuring some activities, particularly labour-intensive ones.
The increase in the exchange of intermediate inputs is one of the effects of this greater international integration, involving a substitution between domestic and foreign purchases. In a previous paper (Cadarso et al. 2006) we found that for the Spanish economy: a) inter-industry domestic input purchases over production have decreased by 24% over the period 1995-2000, while their foreign counterpart increased by 32%; b) intra-industrial domestic input purchases increased by 10% between 1995 and 2000, while intra-industrial imports grew by 41%; and c) another striking aspect of “new trade” is reflected in the important growth of the requirements of total inputs bought to other countries for Spanish production and export or Spanish vertical specialization, that has increased from 0.298 to 0.348 between 1995 and 2000. In this paper we will focus on the importance of these phenomena, outsourcing and vertical specialization, on the Spanish economy, with special attention to the role of Central and Eastern European (CEE) countries, and Turkey, on this process.
We can be more specific and point out that there is a substitution not only between domestic and foreign purchases but also in terms of countries of origin for those imports. Although more than half of all Spanish imports are still bought from EU-15 countries, there is now an increasing role for new members and candidates in this trade. While their weight in total Spanish imports is still low, imports from CEE countries rose by 82% in 1999-2003. Among these countries, the evolution of imports from Turkey is remarkable: although from a very low starting point, Spanish imports from Turkey have grown during the 1995-2003 period at an annual rate above 49%, well over the total of Spanish imports, which only grow at an annual rate of 11.6%.
The sectoral distribution of outsourcing is key to understand this process. As explained by Feenstra and Hanson (1996), outsourcing requires two conditions to occur, first, the production process can be separated into self-contained stages, and, secondly, production stages vary considerably in the relative intensity with which they use labour of different skill types. These conditions are especially easy to meet in industrial production, where outsourcing is a natural development of subcontracting, since production stages are, firstly fragmented and, when possible, moved abroad. Differences in wage levels have been recognized as the main reason behind outsourcing in most of the literature, but some other factors can be also at work (different types of skilled labour, economies of scale of specialised providers, uncertainty in some product characteristics, etc.), reinforcing the importance of different origin for inputs.
In our study two main groups of sectors can be distinguished (for a total of 92 manufacturing sectors): low-technology sectors and medium–high technology sectors. Low-technology sectors include food related sectors, textiles and related industries, wood products, paper, publishing, furniture and various other industries (from 151 to 223 and 361 to 233 NACE) while medium-high technology sectors include chemical, materials, metallic products, electrical and electronic products, vehicles and related products, and so on (from 241 to 355 NACE). Outsourcing (imported intermediate purchases from the same sector) has grown by 52% for medium-high-tech sectors while the increase for low-tech sectors is much lower, only 19%. Spanish specialisation in traditional industries partly explains that
3
result, as these sectors tend to use domestically produced inputs rather than imported ones. Spanish low-tech sectors are the only ones that manage to keep a trade balance close to equilibrium, and their location advantages justifies the fact that they have attracted more FDI between 1993 and 2001 and have suffered disinvestments processes to a lesser extent during the same period (Myro & Fernández-Otheo, 2004).
Firms outsource part of their production as a tool to compete in an increasingly globalised world. In this fashion, sometimes they locate part of their production in countries where they find advantages; sometimes they simply import from external providers located in those countries. This fragmentation of production makes those firms more competitive, particularly in terms of prices, allowing them to increasing their share in foreign markets by means of exports. The term “vertical specialization”, proposed by Hummels et al. (2001), relates simultaneously the fragmentation of production and exports by sector of activity, as it calculates the direct and indirect imported inputs that are included in a country’s exports. Using this measure, we account for the fact that in the making of a product there are at least two countries interacting sequentially, and that the final destination of that product is a country other than the one where the last production stage takes place. This is why we have also calculated the vertical specialization by countries, so we can see not only the sectors but also the countries that are part of the production chain together with Spain.
Besides describing the evolution of Spanish imports, vertical specialization and outsourcing to EU candidates, this paper also investigates the effect of this outsourcing on the level of employment. Our empirical analysis is therefore characterised by: 1) using data from the import use matrices of input-output tables, rather than being indirectly estimated through weighting trade data; 2) estimating a labour demand function at sector level, studying the effects of employment instead of focusing on skills or wages like most of the literature2; 3) using dynamic panel data techniques (GMM); 4) differentiating the effect of outsourcing depending on sectoral characteristics (low-tech vs. medium-high-tech); 5) distinguishing between different geographical locations, and focusing on new members and candidates.
Our results indicate that there is a negative effect of outsourcing on employment for medium-high-tech sectors while there is not clear effect for low-tech sectors. This result appears for both the whole of the imported inputs and for inputs bought from CEE countries, although it is only significant for the latter. Comparing the effect for EU new members and candidates our results show a greater negative impact from outsourcing to EU candidates, especially Turkey, on Spanish industrial employment.
Our paper is structured as follows. In section 2 we review the relevant literature on labour market and outsourcing. In section 3 we outline the basic model used and the calculation of outsourcing and vertical specialization measures. Section 4 comments on the data and the evolution of those measures. Section 5 contains the main empirical results for the relationship between outsourcing to different countries and employment in Spain and comments on a number of important econometric issues. Section 6 shows some preliminary results for the relationship between vertical specialization and employment in the Spanish economy, and for the estimation of a labour demand function in Turkey including their proportion of exports on production, and section 7 concludes.
2. Outsourcing and employment in recent literature
The literature analysing the impact of outsourcing on the labour market takes its lead from the
papers by Feenstra & Hanson (1996, 1999), that focused on sector wage inequality by skills. The work of these authors has been followed and redeveloped through time and recently, it has been enhanced to account for a geographical element by focusing on the effect of outsourcing to specific groups of countries.
Feenstra & Hanson (1996) analyse the way trade affects the relative demand for skilled labour by estimating a relative labour cost equation (see Berman et al. 1994) augmented by an outsourcing measure built by combining import data from U.S. manufacturing industries with input purchases. Here outsourcing is considered as “an index of the extent to which U.S. firms contract non-skill-
2 We are only aware of one study by Görg and Hanley (2005) that studies the effect of outsourcing on employment at firm-level and using surveys rather than input-output data.
4
intensive production activities to foreigners.”3 They work with data for 435 industrial sectors and find that during the period 1979-1990 outsourcing has contributed substantially to the increase in relative non-production wage share, as a proxy for high-skilled wages share. However, results for the period 1972-1979 are non-significant.
In a later paper, Feenstra & Hanson (1999), the authors develop a similar model enhanced by including technological variables, since these two factors, trade and technical change, are expected to alter wage inequality. Another novelty of this paper is the differentiation between three types of outsourcing, depending on whether the purchases come from the same sectors, narrow outsourcing, or from other sectors, difference outsourcing; or the sum of the two, broad outsourcing. This distinction allows the authors to show that the effects of intermediate inputs purchases changes depending on their origin. Narrow outsourcing has a greater effect than difference outsourcing.
A number of authors have followed Feenstra & Hanson’s work and, in most cases, have found a positive effect of outsourcing on skilled labour, pointing to firms contracting out production phases that are intensive in low-skilled labour. Among the papers we focus on are Hijzen et al. (2005), Strauss-Kahn (2003) and Görg & Hanley (2005).
Hijzen et al. (2005) extend Feenstra & Hanson’s framework by estimating a system of four variable factor demand functions, including relative demand for skilled workers, for 50 U.K. industrial sectors for the period 1982-1996. The relative demand function is augmented by an inter-industrial outsourcing measure and shows that international outsourcing has had a strong negative effect on the demand for unskilled labour.
A similar result is found by Strauss-Kahn (2003), who analyses 50 French industries for the period 1977-1993 but focuses on relative unskilled demand. The author finds that outsourcing has a negative effect on unskilled labour. However, this is not the only element affecting labour, as skilled-biased technological progress seems more important than outsourcing in explaining the reduction in unskilled labour demand.
Görg & Hanley (2005) propose a microeconomic focus and analyse the absolute effect on total labour. They estimate dynamic labour demand for 652 plant level data for the Irish electronic sector during the period 1990-1995, and find that, in the short run, outsourcing is linked to a reduction in labour demand. Nonetheless different kinds of outsourcing affect employment in different way, so greater negative effects appear from the outsourcing of materials than from the outsourcing of services.
Recent redevelopment take into account a geographical component of outsourcing and focusing on the effects of outsourcing to specific groups of countries, e.g. Egger & Egger (2003, 2005), Geishecker (2005) and Falk & Wolfmayr (2005). Literature on this topic is still limited and very recent.
Egger & Egger are among the first authors to consider a geographical element in analysis. Egger & Egger (2005) use a dataset for 20 Austrian manufacturing industries between 1990 and 1998 to analyse Austrian outsourcing to Central and Eastern European economies. They combine an outsourcing measure with a spillover effect and show that inter-sectoral relationships affect notably the effect of outsourcing on labour. Also a previous work, Egger & Egger (2003), find out that outsourcing to CEE economies accounts for about one quarter of the change in relative employment in favour of high-skilled labour. Both papers support that an increase in outsourcing to CEE countries induces a shift in relative skilled employment in favour of high-skilled labour and consider that the result is likely to become even more pronounced when the Eastern economies join the European Union.
The analysis of the effect of CEE outsourcing is becoming of increasing interest among European economists, both in terms of skill structure and level of employment. Following Egger & Egger we can also find Geishecker (2005) or Falk & Wolfmayr (2005). Geishecker analysed the effect of outsourcing to CEE countries on Austrian and German labour skill structure. He finds out that outsourcing towards CEE countries is an important explanatory factor for the decline in relative demand for manual workers in German manufacturing.
Falk & Wolfmayr (2005) work with sectoral data from 7 EU countries for the period 1995-2000. The innovative element in this paper is to distinguish a differentiated effect on higher and lower- 3 Feenstra and Hanson (1996), pp. 244.
5
skill sectors. The authors conclude that imports from low-wage countries, which include CEE and the NICs and other East Asian countries, have a negative effect on employment, especially in less-skilled industries.
In all the aforementioned literature, except Görg & Hanley (2005) and Falk & Wolfmayr (2005), the analysis focuses on the effect of outsourcing on relative labour demand. We follow Görg & Hanley and Falk & Wolfmayr in focusing on the total labour demand effect. Another common element in most articles is that the analysis does not account for the time element: all papers, with the exception of Görg & Hanley, consider a static relationship. In our empirical application we follow Görg & Hanley and consider that labour does not react automatically to changes in any of the variables considered, so that a dynamic analysis is more appropriate.
Although the analysis of CEE countries-rest of Europe trade has received attention from economist in the close period, to the best of our knowledge there are not studies analysing the importance of outsourcing to Turkey for either labour or productivity in the outsourcer country.
Finally, Hummels et al. (2001) develop the concept of vertical specialization, as we mentioned above. This term refers to the direct and indirect (total) imports of inputs required to produce the goods that are exported by a country. These authors concluded that this specialization deepened for 10 OECD countries in 1970-1990. For the Spanish economy, Minondo & Rubert (2002) show that between 1970 and 1994 this country reached similar values to the vertical specialisation of medium-sized OECD countries. This concept includes that of broad outsourcing, and extents it, as it considers not only direct, but also indirect, inputs.
3. Labour demand equations and calculation of outsourcing and vertical specialization
measures
Our paper differs from previous literature since we study the link between outsourcing and employment at the sector level. This involves estimating a dynamic labour demand function from a CES production function. We extend this framework to include outsourcing.
The labour demand equation development starts from a CES production function, from this function we follow the usual steps to find an augmented labour demand function fitted to panel data:
( )itiitititit ugoutsourcinwyn ++++= εααα 210 (1) where i = 1, ..., N firms or sectors and t = 1,..., T years or periods, where n is employment, y is
output, w is (real) labour cost (all in logarithms), and ε are firm–specific (time–invariant) effects and u is the usual error term.
When estimating the previous function, we would consider static or long-term equilibrium relationship. We would however neglect the potential dynamic links between these variables. To avoid this constrain, equation (1) can be transformed into a dynamic specification as follows:
( )itiititititit ugoutsourcinwynn +++++= − εαααα 32110 (2) where i = 1, ..., N sectors or firms and t = 1,..., T years or periods. It is possible to find the
value of the long-term coefficient for all the variables in expression (2) from the short-term estimated coefficients in the usual manner. Equation (2) must be understood as a first approach to the dynamic structure of the relation. More profound investigations will be performed by including further lags of all of these variables into the specification.
In our case, to calculate different measures of outsourcing we employ the use matrices of the Spanish input-output tables (commodity by sector), instead of the inter-industry symmetrical (commodity by commodity) matrices. The use matrix shows, in columns, the input structure for the different sectors (including secondary production), as it includes intermediate consumption and remuneration to primary inputs, adding up to the output value. Rows at the use matrix show distribution of commodities between intermediate demand and final demand4.
4 The main difference with respect to the symmetrical matrix is that the latter includes inter-sectoral flows, both in columns and in rows, in terms of “pure industries” or “commodities”. In this fashion, secondary production for each sector is relocated to its corresponding “pure industry”. Nevertheless, 90% of total production is main production.

6
Our decision is justified by data availability for the period 1993-2002, as we have at our disposal six use tables (1995-2000)5 for one symmetrical table. Using these six tables allows us to take into account changes in the use table coefficients for both domestic and imported inputs. In measuring international outsourcing directly from the use matrices we follow the same line of research as Hijzen et al. (2005). This is considered superior to other measures, for example Feenstra and Hanson (1996, 1999), Egger and Egger (2003, 2005) and Strauss-Kahn (2003) which need to combine input-output tables and trade data to proxy imported inputs by sector.
Our empirical application focuses on a narrow outsourcing measure (outsourcing from now onwards), more appropriate since it reflects intra-industrial links. This measure takes in two different geographical spheres, one related to global outsourcing for the Spanish economy and a second one to outsourcing to different country groups. The global outsourcing measure is calculated from the use matrices of coefficients by dividing each element of the use table by the effective output (q) for each column6. The typical element of the imported matrix, mij, indicates the amount of imported input i (Mij) required per euro of output in sector j.
Global outsourcing is obtained by restricting to inputs purchased from the same type of commodity:
jiInputs Imported
mgoutsourcinglobalWorldijt
iitit =∀⎟⎟⎠
⎞⎜⎜⎝
⎛== ,
Production jt (3) Outsourcing measures have been also calculated for inputs bought to different groups of
countries; as an example, the Turkey narrow outsourcing measure restricts the previously defined narrow outsourcing measure to imports from Turkey, as:
jiImports TotalImports TotalInputs Imported
goutsourcinnarrowTurkey Worldit
Turkeyit
Worldijt
jt =∀⎟⎟⎠
⎞⎜⎜⎝
⎛⋅⎟⎟⎠
⎞⎜⎜⎝
⎛= ,
Production jt
(9) To calculate this measure we weight our previous global narrow outsourcing measure by a
new term. This term is the ratio of imports from Turkey of commodity i relative to total imports of commodity i7. An equivalent measure has been calculated for different CEE countries (see Appendix II).
The calculation of outsourcing allows us to take into account the content of imports for any domestic product, or equivalently, the foreign added value included in domestic production. The term vertical specialization relates simultaneously the fragmentation of production and exports by sector, as it calculates the total (direct and indirect) imported inputs included in exports. In this way we can describe how countries are increasingly involved in sequential fashion to produce8.
The calculation of vertical specialization that we use in this paper is slightly different from Hummels et al. (2001). We use the following formula:
Where M is the matrix of imports coefficients, D is the matrix of domestic coefficients, and X is diagonalised vector of exports. This diagonalisation in the last term is the main difference with
5 It is possible to observe a very important change in the coefficients from 1995 to 2000. This is why to fill the gaps we estimate the data for 1993 and 1994 by extrapolating the growth rates of 1995-1998, and for 2001 and 2002 we apply the growth rates of 1998-2000. 6 We divide by effective production, as in Egger & Egger (2003) and Strauss-Kahn (2003), while Hijzen et al. (2004) divide by added value, Görg & Hanley divide by total wages, and Feenstra & Hanson (1996) divide by total non-energy purchases. 7 This implies that we suppose the same distribution of intermediates inputs by country that total imports (intermediates plus final). Ideally we should only include intermediate inputs. 8 The vertical specialization shows up to a point the lack in the production of different intermediate goods, as it describes the inputs that our country needs to import in order to produce and export. However, once the good is exported, the available data cannot tell whether the production of that good has been completed, as it does not distinguish between exports of final and intermediate goods.
><−= − XDIMVS 1)(
7
Hummels et al., and the advantage of this formulation is that we can then obtain two types of information:
- On the one hand, the sum by columns of the resulting matrix tells us the intermediate imports of all products that are directly or indirectly required to obtain the exports of a sector
- On the other hand, the sum by rows allows us to calculate the total content of intermediate imports of a particular input for the whole of the exports of a country. This is the information used in Hummels et al., and Minondo & Rubert (2002) for the Spanish economy until 1995, and it results from the expression above without diagonalising the vector of exports.
It is important to note that vertical specialization represents the content of total (direct and indirect) intermediate imports included in Spanish exports, while the outsourcing measures only consider direct inputs. Moreover, having vertical specialization in matrix form, allows us to distinguish narrow vertical specialization (NVS) and difference vertical specialization (DVS) in the usual manner: main diagonal elements show the total import content of exports where the imported input is produced by the exporting sector; whereas off-diagonal elements in the same column show total imported inputs (other than the exported good) required for exports.
Finally, we propose a new concept: vertical specialization by country of origin. By combining input-output tables and foreign country trade data it is possible to find the countries that conform the Spanish production chain. The formula used is:
><−= − XDIMPVSC 1)(' Where P is an mxn matrix that shows the imports percentage participation per country for each
good, being m the countries (see table Appendix II) and n the goods, M is an nxn imports coefficient matrix, D is an nxn matrix of domestic coefficients and X is the diagonalized nxn vector of exports. Each element in this matrix, VSC, provides us the intermediate imports of country m required to obtain the exports of sector j. In other words, this matrix tells us how each country contributes to vertical specialization, total and by sector. Results for 10 groups of countries are shown in the next section. Moreover, we can calculate the contribution of one input imported from an specific country required to export, by replacing P’ in the previous formula by a diagonal matrix with the appropriate row of P’. This calculation has been performed for Turkey. 4. Outsourcing, vertical specialization and trade pattern in Spanish manufactures: countries
and sectors 4.1 Spanish imports and their distribution by type of product and origin
Spanish foreign trade increased during the period under analysis, the rate of openness was
28% at the beginning of the nineties and 43% in 2003. This growth is shared by exports and imports and both have shown higher nominal growth rates than GDP. Nevertheless, Spanish imports have grown over and above exports and the propensity to import has risen by nearly 50% over the last ten years. A wide range of countries provide Spain with commodities but, as expected, the European Union (EU-15) is our primary supplier with more than 60% of Spanish imports.
For the period 1995-2003, a group of countries has increased its market share in Spain, showing the highest rates of cumulative growth. These are EU-15, all the new members of the EU-25, the new candidates and the Asian group (India, Thailand, China and South Korea). On the other hand, the rest of Asia, Africa, Oceania and America have reduced its position as Spanish providers in global terms. However, this behaviour camouflages a different performance at commodity level, mainly with the EU-159, as we can observe in Figure 1.
9 It is noteworthy that the market share of America has decreased for all types of commodities analysed, except one.

8
-20,0 -15,0 -10,0 -5,0 0,0 5,0
UE-15
Poland, CzechR., Hungary
Rest of newmembers
Turkey
Rest ofcandidates
Textile Clothes and fur Electrical machineryElectronic products Motor vehicles
Figure 1: Market share variation for EU-15 and CEE countries (1995-2003)10
The case for Turkey is similar to the whole of the CEE countries, Turkish imports have increased by 155% during the 1995-2003 period, continuing a general pattern that started around the 80s. Among the reasons explaining the Spanish-Turkish trade strengthening are: the Turkish foreign trade regime reform that took place during the 1980s, the Spanish entrance in the EU, Turkish Customs Union with the European Union in 1996 and subsequent negotiation as a candidate, and, more generally, the actual tendency to the increase in global trade due to international integration. Within this framework, Spanish-Turkish trade is moving towards the modern trade trend of growing intra-industrial-trade, that has increased from 16.8% of total trade in 1989 to 37.6% in 2002 (see Narin 2005). Since, according to Narin, vertical outsourcing (intra-industrial trade of different qualities products) accounts for about 82.3% of outsourcing, costs differences are the main argument behind Spanish-Turkish intra-industrial trade.
0
5
10
15
20
25
30
Ext
ract
ive
indu
strie
s
Food
and
beve
rage
s
Text
ile
Clo
thes
and
fur
Non
-m
etal
licm
iner
al
Bas
icm
etal
Ele
ctro
nic
equi
pmen
t
Mot
orve
hicl
es
19952003
Figure 2: Spanish imports from Turkey (Percentage distribution)11
10 Source: Own elaboration. Data from the Cámara de Comercio and INE databases. 11 Source: Own elaboration. Data from the Cámara de Comercio and INE databases.
9
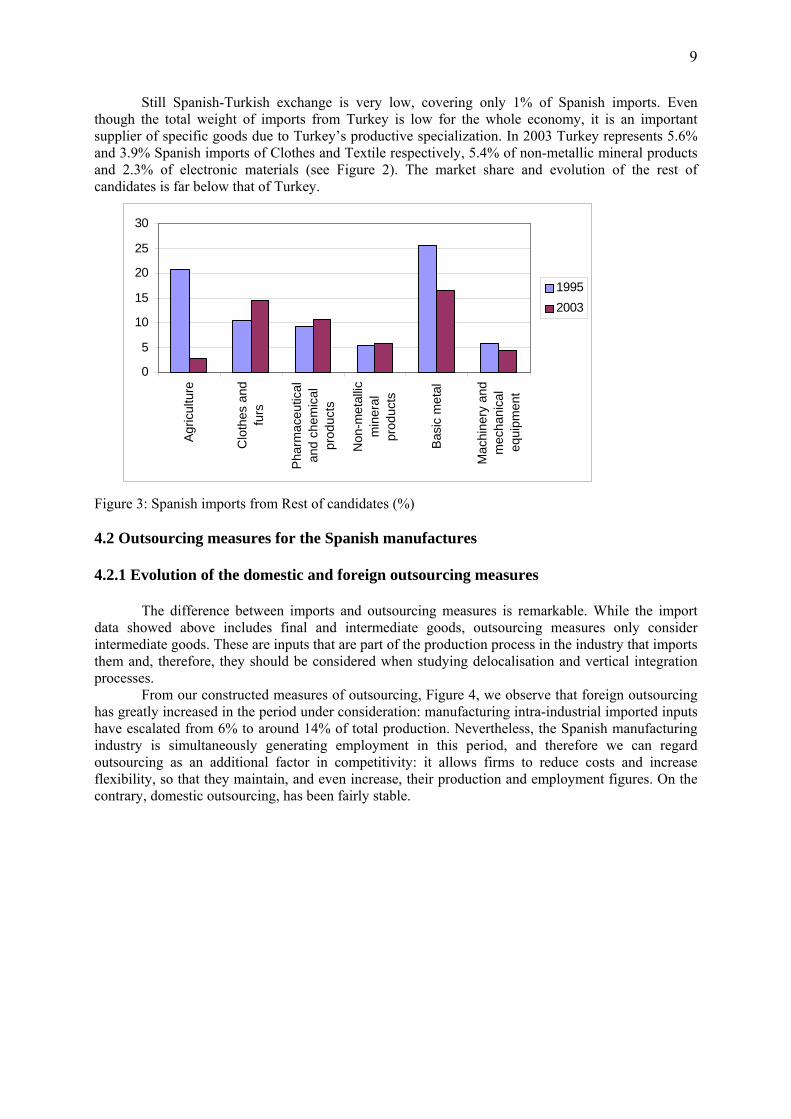
Still Spanish-Turkish exchange is very low, covering only 1% of Spanish imports. Even though the total weight of imports from Turkey is low for the whole economy, it is an important supplier of specific goods due to Turkey’s productive specialization. In 2003 Turkey represents 5.6% and 3.9% Spanish imports of Clothes and Textile respectively, 5.4% of non-metallic mineral products and 2.3% of electronic materials (see Figure 2). The market share and evolution of the rest of candidates is far below that of Turkey.
Figure 3: Spanish imports from Rest of candidates (%) 4.2 Outsourcing measures for the Spanish manufactures 4.2.1 Evolution of the domestic and foreign outsourcing measures
The difference between imports and outsourcing measures is remarkable. While the import data showed above includes final and intermediate goods, outsourcing measures only consider intermediate goods. These are inputs that are part of the production process in the industry that imports them and, therefore, they should be considered when studying delocalisation and vertical integration processes.
From our constructed measures of outsourcing, Figure 4, we observe that foreign outsourcing has greatly increased in the period under consideration: manufacturing intra-industrial imported inputs have escalated from 6% to around 14% of total production. Nevertheless, the Spanish manufacturing industry is simultaneously generating employment in this period, and therefore we can regard outsourcing as an additional factor in competitivity: it allows firms to reduce costs and increase flexibility, so that they maintain, and even increase, their production and employment figures. On the contrary, domestic outsourcing, has been fairly stable.
0
5
10
15
20
25
30
Agr
icul
ture
Clo
thes
and
furs
Pha
rmac
eutic
alan
d ch
emic
alpr
oduc
ts
Non
-met
allic
min
eral
prod
ucts
Bas
ic m
etal
Mac
hine
ry a
ndm
echa
nica
leq
uipm
ent
19952003

10
Figure 4: Outsourcing measures12 Also the difference measures, not in the graph, show a degree of substitution between
domestic and imported inputs, with different international outsourcing growing and the domestic one falling for 1993-2002. However, the domestic measure is higher than the international one for the whole of the period.
4.2.1 Evolution of the outsourcing measure by country
We calculate different narrow outsourcing measures by countries. Our data show that high-
wages countries in the EU-15 concentrate most of the outsourcing, almost 70% of intra-industrial imports. However, recent evolution of these imports is far more favourable to low-wage countries, in a similar way to the results obtained by Falk & Wolfmayr (2005) for EU-7 countries. While Spanish trade with EU-15 increases by 6.5%, trade with new members rises by 26.85%, and 17.8% with new candidates (in fact, it only increases for Turkey). Most of the substitution is then between domestic and imported inputs from CEE countries, so that the impact on domestic labour demand is expected to be stronger for imports from CEE countries than for inputs imported from other countries.
12 Source: Data from the Use matrices in the Input –Output Tables (INE), calculated as explained above.
0
100
200
300
400
500
1993
1994
1995
1996
1997
1998
1999
2000
2001
2002
2003
UE-15 New Members and Candidates
11
Figure 5: Medium-high-tech Sectors Outsourcing to CEE and EU-1513 Outsourcing to new EU members and candidates has not been equally distributed among
sectors, being of greater significance for medium-high-tech ones shown in Figure 3. While EU-15 outsourcing hardly grew between 1993 and 2003 in these sectors, outsourcing to new members and candidates grew by more than 360%. The pattern is the same for low-tech sectors outsourcing, 209% to new members and candidates, compared to 28% for EU-15. As far as the different rates of growth are concerned, impact on labour demand is expected to be greater for medium-high-tech sectors and for CEE countries.
Figure 5 also shows that outsourcing intensifies acutely in 1997-1998, dates when accession negotiations with Cyprus, Hungary, Poland, Estonia, the Czech Republic and Slovenia (the so-called "Luxembourg Group") started. A new impulse in the outsourcing to EU new members and candidates takes place in 1999, when the decision to open negotiations with Romania, Slovakia, Latvia, Lithuania, Bulgaria and Malta (the "Helsinki Group") was taken. The prospect of an open market reduced uncertainty for investors and stimulated FDI increasing outsourcing. 4.3 Vertical specialization in Spanish manufactures 4.3.1 Evolution of vertical specialization
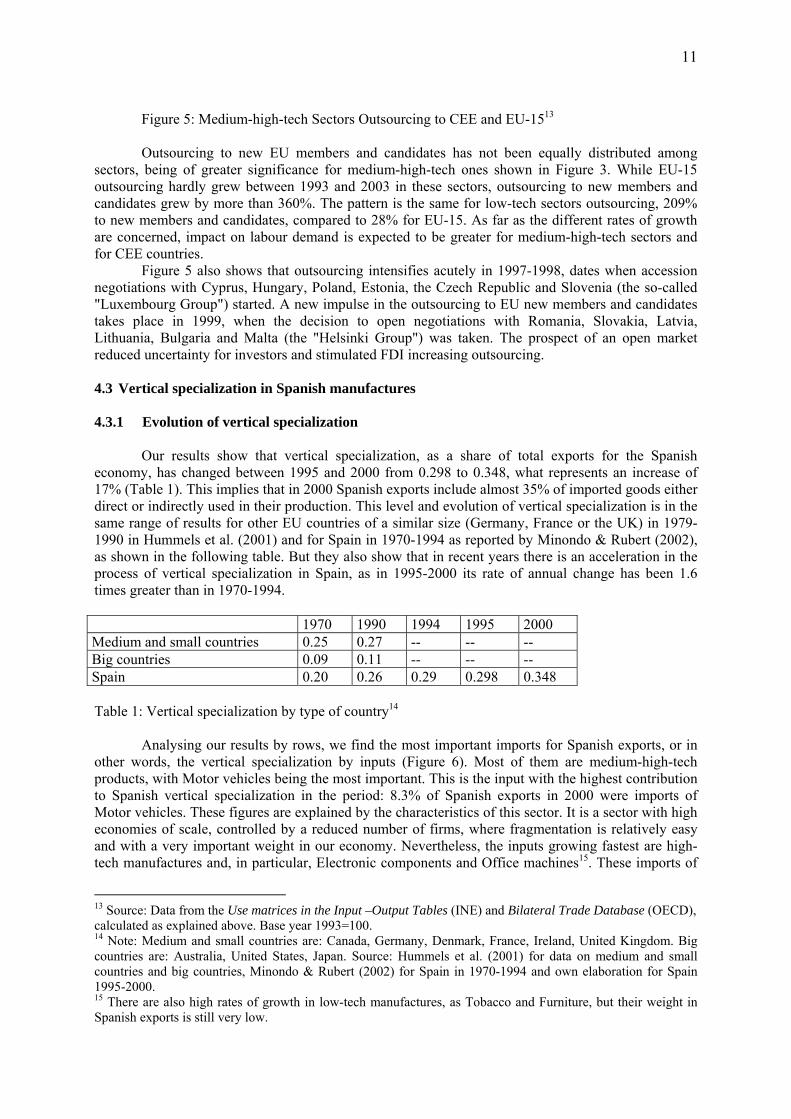
Our results show that vertical specialization, as a share of total exports for the Spanish economy, has changed between 1995 and 2000 from 0.298 to 0.348, what represents an increase of 17% (Table 1). This implies that in 2000 Spanish exports include almost 35% of imported goods either direct or indirectly used in their production. This level and evolution of vertical specialization is in the same range of results for other EU countries of a similar size (Germany, France or the UK) in 1979-1990 in Hummels et al. (2001) and for Spain in 1970-1994 as reported by Minondo & Rubert (2002), as shown in the following table. But they also show that in recent years there is an acceleration in the process of vertical specialization in Spain, as in 1995-2000 its rate of annual change has been 1.6 times greater than in 1970-1994. 1970 1990 1994 1995 2000 Medium and small countries 0.25 0.27 -- -- -- Big countries 0.09 0.11 -- -- -- Spain 0.20 0.26 0.29 0.298 0.348 Table 1: Vertical specialization by type of country14
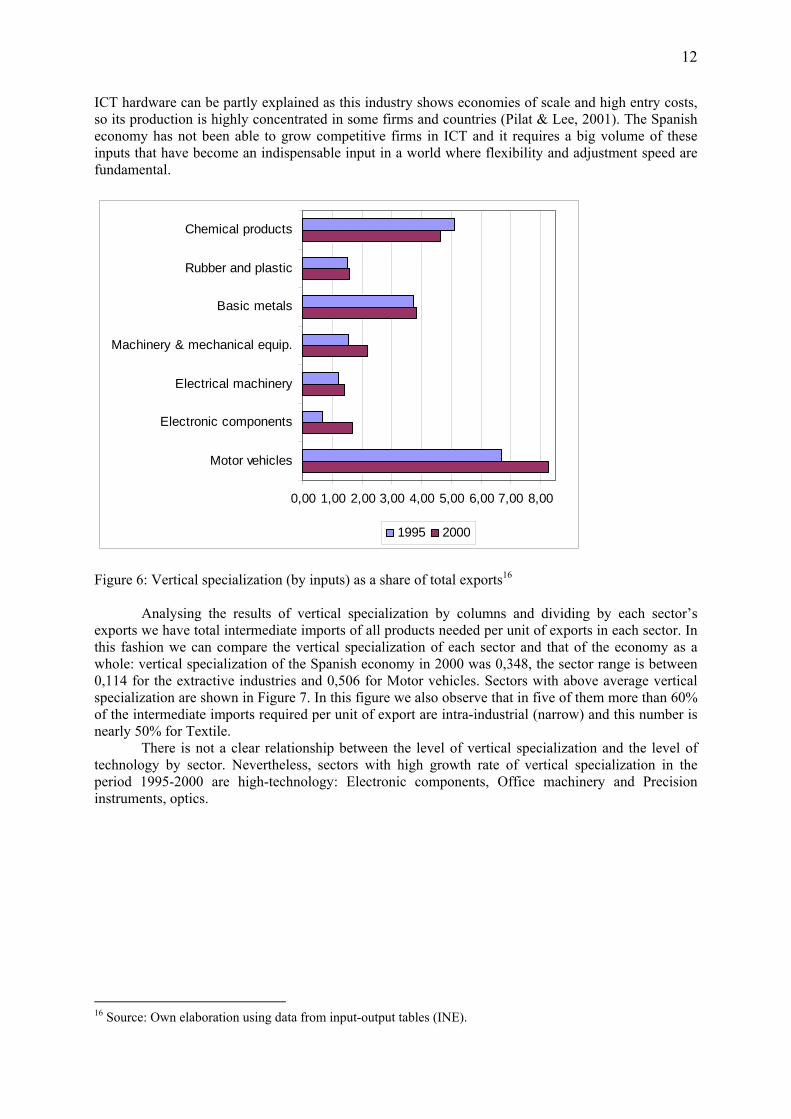
Analysing our results by rows, we find the most important imports for Spanish exports, or in other words, the vertical specialization by inputs (Figure 6). Most of them are medium-high-tech products, with Motor vehicles being the most important. This is the input with the highest contribution to Spanish vertical specialization in the period: 8.3% of Spanish exports in 2000 were imports of Motor vehicles. These figures are explained by the characteristics of this sector. It is a sector with high economies of scale, controlled by a reduced number of firms, where fragmentation is relatively easy and with a very important weight in our economy. Nevertheless, the inputs growing fastest are high-tech manufactures and, in particular, Electronic components and Office machines15. These imports of
13 Source: Data from the Use matrices in the Input –Output Tables (INE) and Bilateral Trade Database (OECD), calculated as explained above. Base year 1993=100. 14 Note: Medium and small countries are: Canada, Germany, Denmark, France, Ireland, United Kingdom. Big countries are: Australia, United States, Japan. Source: Hummels et al. (2001) for data on medium and small countries and big countries, Minondo & Rubert (2002) for Spain in 1970-1994 and own elaboration for Spain 1995-2000. 15 There are also high rates of growth in low-tech manufactures, as Tobacco and Furniture, but their weight in Spanish exports is still very low.
12
ICT hardware can be partly explained as this industry shows economies of scale and high entry costs, so its production is highly concentrated in some firms and countries (Pilat & Lee, 2001). The Spanish economy has not been able to grow competitive firms in ICT and it requires a big volume of these inputs that have become an indispensable input in a world where flexibility and adjustment speed are fundamental.
0,00 1,00 2,00 3,00 4,00 5,00 6,00 7,00 8,00
Chemical products
Rubber and plastic
Basic metals
Machinery & mechanical equip.
Electrical machinery
Electronic components
Motor vehicles
1995 2000
Figure 6: Vertical specialization (by inputs) as a share of total exports16
Analysing the results of vertical specialization by columns and dividing by each sector’s exports we have total intermediate imports of all products needed per unit of exports in each sector. In this fashion we can compare the vertical specialization of each sector and that of the economy as a whole: vertical specialization of the Spanish economy in 2000 was 0,348, the sector range is between 0,114 for the extractive industries and 0,506 for Motor vehicles. Sectors with above average vertical specialization are shown in Figure 7. In this figure we also observe that in five of them more than 60% of the intermediate imports required per unit of export are intra-industrial (narrow) and this number is nearly 50% for Textile. There is not a clear relationship between the level of vertical specialization and the level of technology by sector. Nevertheless, sectors with high growth rate of vertical specialization in the period 1995-2000 are high-technology: Electronic components, Office machinery and Precision instruments, optics.
16 Source: Own elaboration using data from input-output tables (INE).

13
0,00 10,00 20,00 30,00 40,00 50,00 60,00
Textile
Paper & cardboard
Chemical products
Rubber & plastic
Office machinery
Electronic components
Precision Instruments, óptics
Motor Vehicles
Other means of transport
Narrow Difference
Figure 7: Vertical specialization (by sector) as a share of sector’s exports in 2000. 4.3.2 Vertical specialization by country
As mentioned in the previous section, Spanish vertical specialization has increased by a 17% from 1995 to 2000. Table 1 shows that Spanish production fragmentation takes place mainly with EU-15, since over 70% of total imports requirements per production and export unit come from this group. However this trend is growing positively but below the mean for the whole of the countries, reducing its percentage participation.
1995 2000 Variation rate
Percentage participation difference
UE – 15 0.2158 0.2470 14.46 -1.60 Poland, Czech R., Hungary 0.0022 0.0039 78.47 0.38 Other new members17 0.0009 0.0015 77.62 0.15 Turkey 0.0009 0.0018 105.32 0.22 Other candidates 0.0011 0.0009 -21.08 -0.12 Rest of Europe 0.0145 0.0171 18.00 0.04 America 0.0227 0.0218 -4.18 -1.38 India, Thailand, China, South Korea 0.0068 0.0130 90.05 1.43 Rest of Asia 0.0172 0.0218 27.00 0.49 Africa and Oceania 0.0155 0.0195 25.84 0.39 Total 0.2975 0.3482 17.05 0.00
Table 2: Vertical specialization by countries.
Spanish vertical specialization with Turkey has grown at an impressive rate during the period, and it is expected to keep this trend in the future supported by EU-Turkey integration negotiations. Moreover, this growth is shared by all Spanish sectors as shown in Figure 818.
17 Cyprus, Slovenia, Slovak, Malta, Estonia, Lithuania, y Latvia. 18 This figure only includes as an example sectors with greater vertical specialization with Turkey.

14
0,000 0,001 0,002 0,003 0,004 0,005 0,006
Textile
Clothes and fur
Chemical products
Rubber & plastic
Metallurgy
Metalic manufactures
Machinery & mechanical equipment
Electric machinery
Electronic equipment
Instrumentos, óptica y relojería
Motor vehicles
Other means of trnaport
Furniture & other manufactures
20001995
Figure 8: Spanish vertical specialization with Turkey by sector.
Behind Turkey there are other countries where the vertical specialisation rate with Spain is
growing remarkably: India, Thailand, China, South Korea, Poland, Czech R., Hungary and other new members.
Data show departure of trade with Other candidates and, in a lower proportion, America, with negative variations from both groups. Trade relationships with these two groups have been negatively influenced by the integration of new members in the EU.
Spanish vertical specialization changes for different groups of countries and also within each group it changes with sectors. This is the case with EU-15. Vertical specialization is more intense for Motor vehicles, Rubber and plastics, Pulp, paper and cardboard, Textile and Electronic components. However there is a trend towards medium-high tech sectors concentration where vertical specialization is growing strongly during the period.
The concentration of vertical specialization in medium-high tech sectors is also taking place for new members and Asia. For Poland, Czech R., and Hungary vertical specialization was already very strong at the begin of the period, while for new members it grows at the end, what has lead to a change in the Spanish vertical integration profile. At the beginning of the period vertical integration was very strong for Electric machinery and Pulp, paper and cardboard, however since 2000 changes in patterns have lead to a higher rate of vertical specialization for Electronic components and Precision instruments
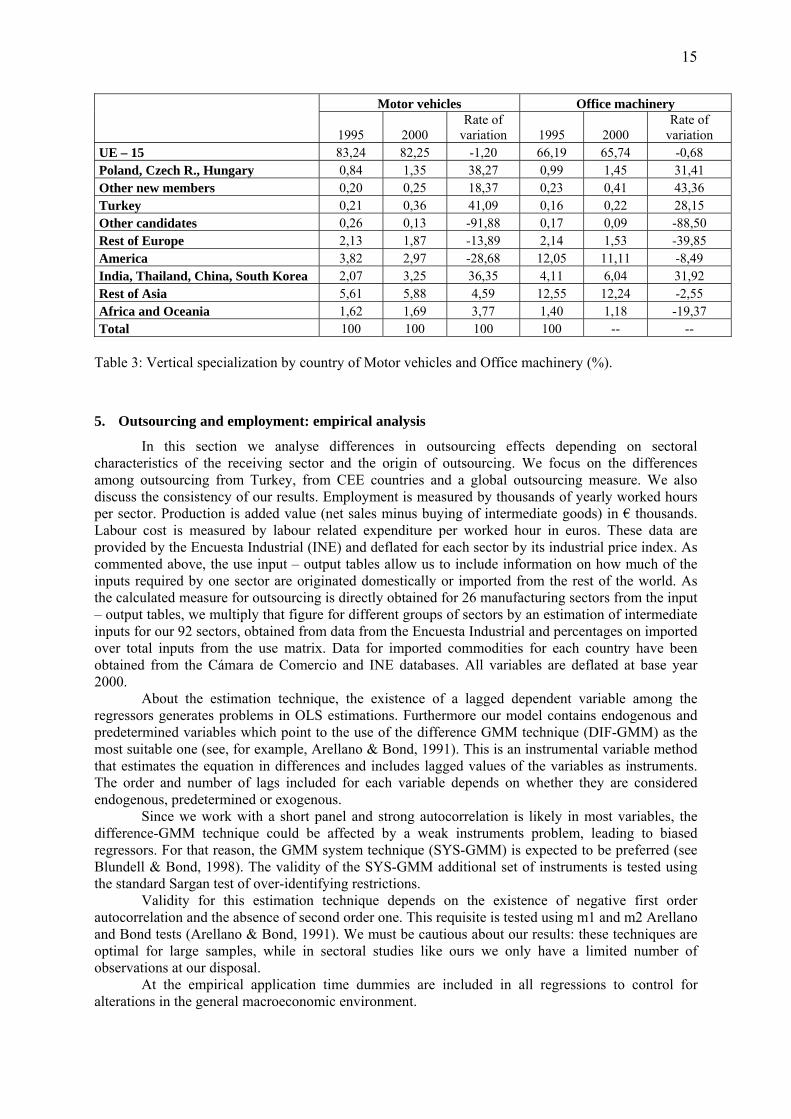
Vertical specialization with Turkey and India, China, Thailand, South Korea and the rest of Asia show a dual character for trade with these countries. On the one hand it is important for low-tech sectors: Textile, Clothes, furs and shoes (shoes for all groups but Turkey) and, on the other hand, it is also important for medium-high-tech sectors: Electronic components, Precision instruments, Motor vehicles (mainly for Turkey and the rest of Asia) and Office Machinery (the whole of Asia). We can see these changes for Motor vehicles and Office machinery in the next table.
15
Motor vehicles Office machinery
1995 2000 Rate of
variation 1995 2000 Rate of
variation UE – 15 83,24 82,25 -1,20 66,19 65,74 -0,68 Poland, Czech R., Hungary 0,84 1,35 38,27 0,99 1,45 31,41 Other new members 0,20 0,25 18,37 0,23 0,41 43,36 Turkey 0,21 0,36 41,09 0,16 0,22 28,15 Other candidates 0,26 0,13 -91,88 0,17 0,09 -88,50 Rest of Europe 2,13 1,87 -13,89 2,14 1,53 -39,85 America 3,82 2,97 -28,68 12,05 11,11 -8,49 India, Thailand, China, South Korea 2,07 3,25 36,35 4,11 6,04 31,92 Rest of Asia 5,61 5,88 4,59 12,55 12,24 -2,55 Africa and Oceania 1,62 1,69 3,77 1,40 1,18 -19,37 Total 100 100 100 100 -- --
Table 3: Vertical specialization by country of Motor vehicles and Office machinery (%).
5. Outsourcing and employment: empirical analysis
In this section we analyse differences in outsourcing effects depending on sectoral characteristics of the receiving sector and the origin of outsourcing. We focus on the differences among outsourcing from Turkey, from CEE countries and a global outsourcing measure. We also discuss the consistency of our results. Employment is measured by thousands of yearly worked hours per sector. Production is added value (net sales minus buying of intermediate goods) in € thousands. Labour cost is measured by labour related expenditure per worked hour in euros. These data are provided by the Encuesta Industrial (INE) and deflated for each sector by its industrial price index. As commented above, the use input – output tables allow us to include information on how much of the inputs required by one sector are originated domestically or imported from the rest of the world. As the calculated measure for outsourcing is directly obtained for 26 manufacturing sectors from the input – output tables, we multiply that figure for different groups of sectors by an estimation of intermediate inputs for our 92 sectors, obtained from data from the Encuesta Industrial and percentages on imported over total inputs from the use matrix. Data for imported commodities for each country have been obtained from the Cámara de Comercio and INE databases. All variables are deflated at base year 2000.
About the estimation technique, the existence of a lagged dependent variable among the regressors generates problems in OLS estimations. Furthermore our model contains endogenous and predetermined variables which point to the use of the difference GMM technique (DIF-GMM) as the most suitable one (see, for example, Arellano & Bond, 1991). This is an instrumental variable method that estimates the equation in differences and includes lagged values of the variables as instruments. The order and number of lags included for each variable depends on whether they are considered endogenous, predetermined or exogenous.
Since we work with a short panel and strong autocorrelation is likely in most variables, the difference-GMM technique could be affected by a weak instruments problem, leading to biased regressors. For that reason, the GMM system technique (SYS-GMM) is expected to be preferred (see Blundell & Bond, 1998). The validity of the SYS-GMM additional set of instruments is tested using the standard Sargan test of over-identifying restrictions.
Validity for this estimation technique depends on the existence of negative first order autocorrelation and the absence of second order one. This requisite is tested using m1 and m2 Arellano and Bond tests (Arellano & Bond, 1991). We must be cautious about our results: these techniques are optimal for large samples, while in sectoral studies like ours we only have a limited number of observations at our disposal.
At the empirical application time dummies are included in all regressions to control for alterations in the general macroeconomic environment.

16
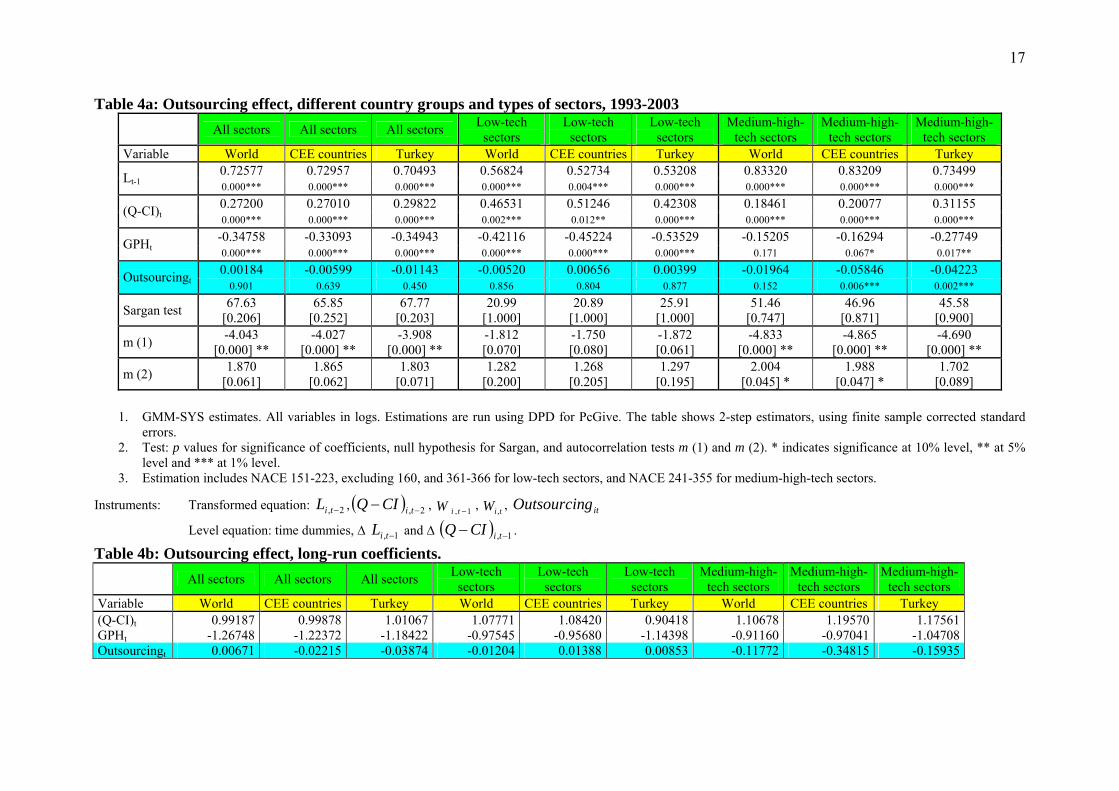
Table 4 comprises the analysis of the effect of outsourcing on Spanish industrial employment distinguishing for the origin of goods and the characteristics of the buying industry. We first discuss the coefficients for the standard labour demand equation regressors and then move to the discussion of our interest variable, outsourcing. Results show consistent coefficients for added value, wages and lag of labour. All three coefficients are always statistically significant but for one case and remain approximately constant in all regressions - with values close to those found by previous empirical studies - but the ones in columns (4), (5) and (6) where there number of sectors is reduced, as explained below, affecting the consistency of results.
For all cases, the choice of instruments in this regression is according to the assumptions on the variables made by the model, based on economic theory and supported by results. The model assumptions are endogeneity for value added and labour, predetermination for wages and exogeneity for outsourcing. Different assumptions on the variables were tried but not supported by results.
17
Table 4a: Outsourcing effect, different country groups and types of sectors, 1993-2003 All sectors All sectors All sectors Low-tech
sectors Low-tech
sectors Low-tech
sectors Medium-high-
tech sectors Medium-high-
tech sectors Medium-high-
tech sectors Variable World CEE countries Turkey World CEE countries Turkey World CEE countries Turkey
0.72577 0.72957 0.70493 0.56824 0.52734 0.53208 0.83320 0.83209 0.73499 Lt-1 0.000*** 0.000*** 0.000*** 0.000*** 0.004*** 0.000*** 0.000*** 0.000*** 0.000***
0.27200 0.27010 0.29822 0.46531 0.51246 0.42308 0.18461 0.20077 0.31155 (Q-CI)t 0.000*** 0.000*** 0.000*** 0.002*** 0.012** 0.000*** 0.000*** 0.000*** 0.000***
-0.34758 -0.33093 -0.34943 -0.42116 -0.45224 -0.53529 -0.15205 -0.16294 -0.27749 GPHt 0.000*** 0.000*** 0.000*** 0.000*** 0.000*** 0.000*** 0.171 0.067* 0.017**
0.00184 -0.00599 -0.01143 -0.00520 0.00656 0.00399 -0.01964 -0.05846 -0.04223 Outsourcingt 0.901 0.639 0.450 0.856 0.804 0.877 0.152 0.006*** 0.002***
Sargan test 67.63 [0.206]
65.85 [0.252]
67.77 [0.203]
20.99 [1.000]
20.89 [1.000]
25.91 [1.000]
51.46 [0.747]
46.96 [0.871]
45.58 [0.900]
m (1) -4.043 [0.000] **
-4.027 [0.000] **
-3.908 [0.000] **
-1.812 [0.070]
-1.750 [0.080]
-1.872 [0.061]
-4.833 [0.000] **
-4.865 [0.000] **
-4.690 [0.000] **
m (2) 1.870 [0.061]
1.865 [0.062]
1.803 [0.071]
1.282 [0.200]
1.268 [0.205]
1.297 [0.195]
2.004 [0.045] *
1.988 [0.047] *
1.702 [0.089]
1. GMM-SYS estimates. All variables in logs. Estimations are run using DPD for PcGive. The table shows 2-step estimators, using finite sample corrected standard
errors. 2. Test: p values for significance of coefficients, null hypothesis for Sargan, and autocorrelation tests m (1) and m (2). * indicates significance at 10% level, ** at 5%
level and *** at 1% level. 3. Estimation includes NACE 151-223, excluding 160, and 361-366 for low-tech sectors, and NACE 241-355 for medium-high-tech sectors.
Instruments: Transformed equation: 2, −tiL , ( ) 2, −− tiCIQ , 1, −tiW , tiW , , itgOutsourcin
Level equation: time dummies, ∆ 1, −tiL and ∆ ( ) 1, −− tiCIQ .
Table 4b: Outsourcing effect, long-run coefficients. All sectors All sectors All sectors Low-tech
sectors Low-tech
sectors Low-tech
sectors Medium-high-
tech sectors Medium-high-
tech sectors Medium-high-
tech sectors Variable World CEE countries Turkey World CEE countries Turkey World CEE countries Turkey (Q-CI)t 0.99187 0.99878 1.01067 1.07771 1.08420 0.90418 1.10678 1.19570 1.17561GPHt -1.26748 -1.22372 -1.18422 -0.97545 -0.95680 -1.14398 -0.91160 -0.97041 -1.04708Outsourcingt 0.00671 -0.02215 -0.03874 -0.01204 0.01388 0.00853 -0.11772 -0.34815 -0.15935
18
Columns (1), (2) and (3) show results for all industrial sectors. The outsourcing measure, even though it increases its value the more precise the its geographical definition, is non-significant independently of the origin of goods. Since we expect changes in the outsourcing effects depending on sectoral characteristics we reestimate our regressions for two types of sectors: low-tech and medium-high-tech. Columns (4) to (6) reduces the original sample to 38 low-tech sectors, so a problem of small dataset appears (see, for example, the Sargan coefficient), leading to differences in the value of coefficients. Low-tech sectors include those in which Spain has been historically specialised: textile, shoes, food industries, etc., and still we observe that the outsourcing coefficient is non-significant.
Columns (7) to (9) consider 54 medium-high-tech sectors like machinery, equipment, chemical, metallic products, etc. In columns (7) to (9) we find that the outsourcing coefficient keeps its negative sign and becomes significant for goods brought from CEE countries and Turkey, results show a negative effect from outsourcing to Turkey and CEE on Spanish employment. Outsourcing is basically oriented towards low-wage countries, so that growing intra-industrial imports have a negative effect on the outsourcer employment. Firms move to low-wage countries the production stages intense in non-qualified work, so that they reduce their costs improving competitiveness. To explain the non-significance of the global outsourcing measure we attend to the strategic nature of the outsourcing. Outsourcing can be considered as a strategic variable for firms, they change at short notice the origin of their imported intermediate inputs in response to market conditions, what leads to changes in the value of outsourcing to different countries19. This holds true for specific geographical outsourcing, as the one in columns (8) and (9), but changes in outsourcing origin cannot be collected by a general measure such as World outsourcing, in column (7).
We therefore conclude that the increasing medium and high intra-industrial imports have a negative effect for Spanish employment. The use of ICT and the reduction of trade barriers have allowed firms to restructure their production organization within a global framework. This generates a substitution of domestic intra-industrial inputs by foreign ones Outsourcing for medium-high technology sectors has increased dramatically for Turkey and CEE countries during the analysed period. In the case of outsourcing to CEE countries for medium-high-tech sectors it has increased spectacularly in 1993-2003 (by more than 300%). In relation to intermediate inputs imported from Turkey there has been an increase together with a change in its composition. In previous periods mineral goods and textile add up to the majority of Spanish imports from Turkey, however medium-high tech products have been the ones that have increased the most their weight. As a result in 2003 Motor vehicles and components and Electronic goods explained the 15% and 10% of Spanish imports from Turkey respectively (2% and 5% in 1995). This change is the result of a deep transformation in Turkish production structure analysed in previous literature as in Akgüngör & Falcioglu (2005) “…specialization trend is towards middle level technology industries and ICT (information and communication technology) industries and away from labour and resource based low and middle tech industries” (pp. 14).
For CEE outsourcing similar results were found in the previous literature (Görg & Hanley 2005; Falk & Wolfmayr 2005). The different result in Falk & Wolfmayr splitted sample regression is explained by the dissimilar country specialization. While Spain is more competitive in low-tech sectors, the countries in Falk & Wolfmayr sample are more competitive in medium-high-tech ones (Austria, Denmark, Finland, Germany, Italy, the Netherlands and Sweden). Also Egger et al. (2003) finds that outsourcing and imports negatively affect employment in sectors with a comparative disadvantage, like medium-high-tech sectors in Spain. To the best or our knowledge there are no studies on the effect of Turkish imports on employment or productivity for any country.
The different effect found in our results for low and medium-high-tech sectors can be easily explained attending to three factors. Firstly, Spain is more competitive internationally in low-tech sectors so outsourcing and its potential negative impact on employment is lower. Gandoy & González (2004) show that for the period 1986-2001, and especially between 1995 and 2001, Spanish low-tech industry value added and labour grow well over the EU-11 rate. Between 1995 and 2001, value added grew annually 3.4%, more than four times the EU rate. Spanish low-tech sectors exports have also
19 Grossman & Helpman (2002, 2005) are good examples of theoretical models for these strategic decisions within a firm.

19
been growing, together with R&D expenditure that is growing in low-tech sectors faster than in medium-high tech ones. These reasons lead us to the conclusion that location advantages compensate the increase in labour cost, with a positive effect on foreign investment. Also, although Myro & Fernández-Otheo (2004) find that the percentage of non-residents’ social capital is substantially reduced in high tech sectors for 1997-2002, a similar disinvestment does not take place in low tech sectors.
Secondly, the presence of foreign multinational enterprises in medium-high-tech sectors is far higher, and it is this type of firms that leads the way in the outsourcing process in search of cost reductions. Torrent & Gual (2005) show that the share of multinationals sales in low-tech consumption goods sectors is lower than the average for the whole of the industry. For example, the multinationals’ share of total sales in Foods and beverages, Textile, leather and shoes and Manufacturing industries are 35.1%, 17.8% and 14.7% respectively compared to 50.3% for the whole of the industry. Also the tendency of multinationals to import is lower for these sectors, 7.4%, 27.5% and 18%, respectively compared to 38.1% for the whole of the industry. The authors conclude that the chances of investment delocalisation due to the European enlargement are low for Spanish low-tech sectors, while they are substantially higher for Transport equipment, Electronic products or Rubber and plastic. Also medium-high tech sectors favour the outsourcing process by focusing on product differentiation, introducing information and communication technologies to a greater extent and allowing a greater vertical fragmentation.
Thirdly, imports from low-tech sectors are basically allocated to final consumption (55%), rather than to intermediate inputs or capital goods, in contrast to imports from medium-high-tech sectors, mainly directed to those last two categories (60% are intermediate inputs and 24% are capital goods). The negative effect of final imports on labour demand should be controlled by a final imports measure better rather outsourcing.
As for the validity of the instruments for table 1 columns (8) and (9), this is not rejected according to the Sargan test of overidentifying restrictions. The result of the second order serial correlation tests, negative correlation in m1 and no correlation in m2, are marginally consistent with the assumption of no serial correlation in the residuals.
Deeper investigation has been performed on the consistency of the regressions and the adequacy of the estimation technique. We proceed to comment on the results (not shown but available on request). OLS, within group and GMM differences regressions were estimated, previous literature
demonstrates that, relative to GMM, OLS biases 0α̂ (the estimated coefficient for the lagged
employment) upwards while within group biases 0α̂ downwards20, these expected results were confirmed, with a very high coefficient for lagged labour in the OLS regression, 0.99, and a low coefficient in the within regression, 0.74. First-differenced GMM, that estimates an equation in differences using instruments in levels, shows an estimator for lagged employment below than the within one, so that a problem of weak instrument exists. The problem is partially overcome by using System GMM, the validity of the extra information in the system GMM is not rejected by the Sargan test. As stated before, results for the second order serial correlation tests are consistent with the assumption of no serial correlation in the residuals at the 5% level. The similarity between the SYS-GMM estimators and the within group one shows that there is short panel problem.
6. Future lines of research.
Results in the previous sections provide some light on the importance of deeper international integration on employment analysed through the narrow outsourcing measure. Some other relevant international trade and production measures have been defined and analysed in section 4. In this section, and as a very preliminary approach, these measures have been introduced in labour demand equations that have been estimated. The result of these estimations provide an interesting insight on the behaviour of labour although data availability have allow us only a limited possibilities. Our aim is
20 See Arellano and Bond, 1998.

20
to improve our data and re-estimate the equations presented in this section in an improved version of the present paper. We show now some preliminary results.
6.1. Vertical specialization and employment in the Spanish economy.
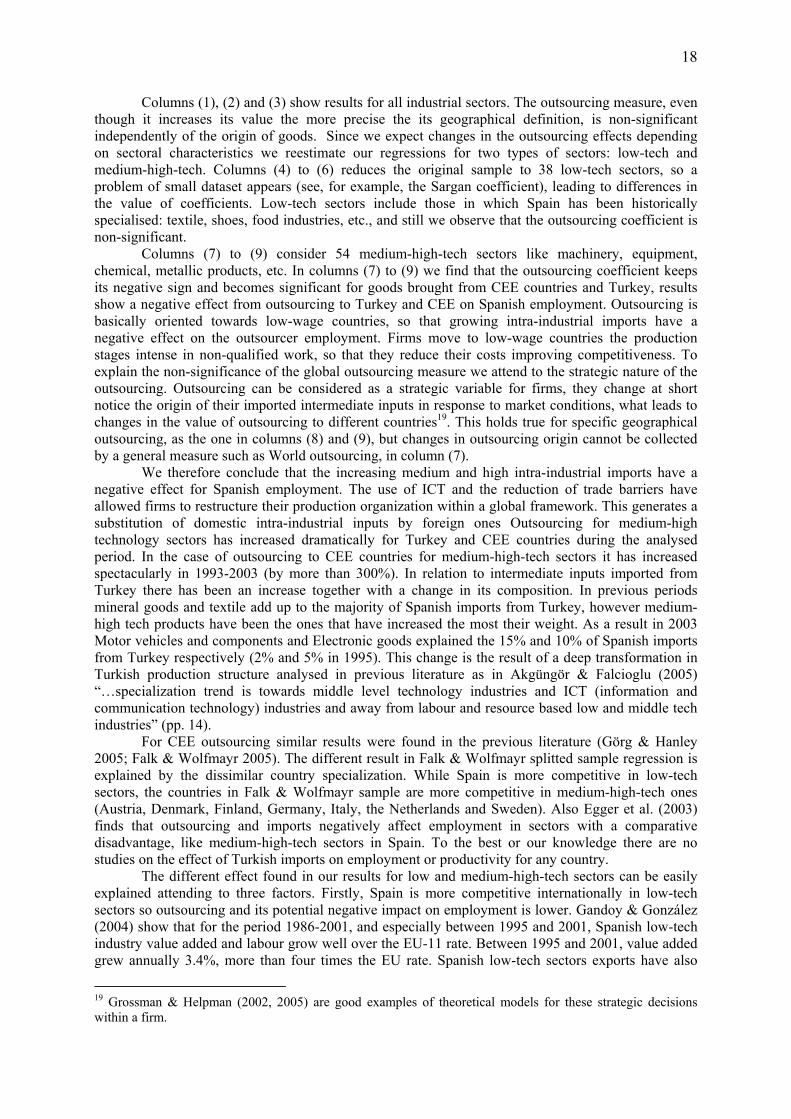
Section 4 describes vertical specialization and defines different measures for this concept. Some of the suggested measures have been included in a labour demand function similar to equation 2 in section 3, and data for Spanish economy, considering 72 sectors for the whole economy for the period 1995-2000. Results are shown in table 4, lack of data have lead to the use of a static labour demand function. The estimation technique used is instrumental variables techniques due to the endogeneity of some of the variables.
Table 5 shows these estimations. The effect of the different measures on employment varies according to their calculation by columns (sectors in the input-output tables) or rows (products). The measures by columns, denoted as narrow measures either for outsourcing or vertical specialization, are the ones that show a negative and significant effect on sectoral employment. The main narrow outsourcing measure analyzed in table 4 is also considered in table 5 column 8. It comprises intra-sectoral imported inputs: i.e. imported motor vehicles parts and components appear to reduce employment in that sector. The rest of the variables considered in table 5 that include narrow imported outsourcing also show a negative effect. These are: Global narrow outsourcing (domestic and imported inputs); Total narrow outsourcing (direct and indirect imported inputs); and Narrow vertical specialization (direct imported inputs required for sectoral exports). To the best of our knowledge this is the first paper to find a negative significant effect of the last two variables on the level of employment, while the difference measures by columns do not show a clear effect on sectoral employment since only EV rows difference is marginally significant. Rubber or oil imports (inter-industrial) do not necessarily reduce employment in motor vehicles sector.
Another interesting question is the effect of vertical specialization measures by rows on sectoral employment (this measure was defined by Hummels et al., 2001). For example it studies the effect of imported inputs of Electronic components by all sectors on employment in the domestic Electronic components sector. Results show that imported electronic components by Spanish sectors, such as Office Machinery or Health services and social services, reduce employment in the Spanish Electronic components sector. This result is supported by three different measures in our regressions: Vertical specialization rows difference (VSRD), that includes imported inputs of a specific good (say computers) required to produce the whole of national exports; VSRD/Output that weights the previous measure by sectoral production (computers); Lastly VSR is also negatively significant since it comprises both VSRD and VS narrow. However a proper examination of the results have to be done on a regression that controls for sector characteristics, what has not be possible on the available dataset.
We can conclude by saying that the effects from both outsourcing and VS measures on employment are similar in the sense that both tend to reduce sectoral employment (in agriculture, manufacturing and services). However, the processes of higher integration and new trade and production patterns have walked parallel to an important net growth in employment. This pointing to increasing delocalization and VS as a channel for Spanish firms to improve competitiveness in a globalized world and grow and generate employment.
21
Table 5: Vertical Specialization and employment in Spain, 1995-2000
Variable 1 2 3 4 5 7 8 9 10 11 1.00023 1.00013 1.00012 0.999809 0.999773 0.998901 0.999769 0.99981 1.00027 0.999711 VA
(0.000) (0.000) (0.000) (0.000) (0.000) (0.000) (0.000) (0.000) (0.000) (0.000) -0.99217 -0.992968 -0.991945 -0.997967 -0.996294 -0.994148 -1.00316 -1.00282 -0.990588 -0.994534 W
(0.000) (0.000) (0.000) (0.000) (0.000) (0.000) (0.000) (0.000) (0.000) (0.000) VS -0.00067 (0.077) VS Narrow -0.00031 (0.053) VS Difference -0.00058 (0.121) VS Rows -0.00072 (0.056) VS Rows Difference -0.00079 (0.062) VSRD/Output -0.00093 (0.068) Narrow Imports -0.04179 (0.038) Narrow Total (dir+ind) -0.03855 (0.030) Narrow Global (imp+dom) -0.02348 (0.020)Specification test: Chi^2(1) 1.1371 1.7389 0.46842 2.0237 0.92414 0.9719 6.4464 6.9361 0.66627 0.011847 [0.2863] [0.1873] [0.4937] [0.1549] [0.3364] [0.3242] [0.0111]* [0.0084]** [0.4144] [0.9133]Testing beta = 0: Chi^2(8) 2.74e+006 2.84e+006 2.71e+006 2.92e+006 2.89e+006 2.82e+006 2.91e+006 2.91e+006 2.65e+006 2.71e+006 [0.0000]** [0.0000]** [0.0000]** [0.0000]** [0.0000]** [0.0000]** [0.0000]** [0.0000]** [0.0000]** [0.0000]**
1. 2SLS estimates. Labour, Value added and wages. Instruments used: Exports, Benefits and Production (in logs). Estimations are run using PcGive. 2. Test: p values for significance of coefficients. 3. Estimation includes 72 sector for the whole economy, 1995 to 2000.
22
6.2. Labour demand function and exports in Turkish manufacturing 1997-2001.
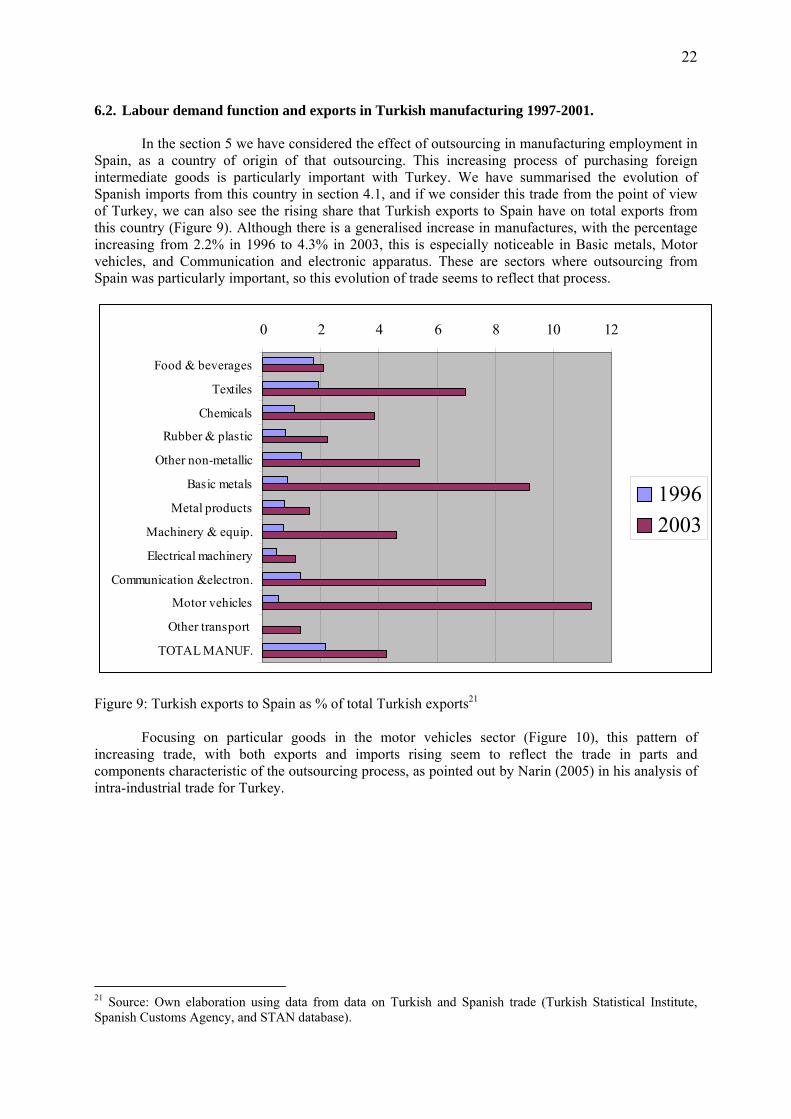
In the section 5 we have considered the effect of outsourcing in manufacturing employment in Spain, as a country of origin of that outsourcing. This increasing process of purchasing foreign intermediate goods is particularly important with Turkey. We have summarised the evolution of Spanish imports from this country in section 4.1, and if we consider this trade from the point of view of Turkey, we can also see the rising share that Turkish exports to Spain have on total exports from this country (Figure 9). Although there is a generalised increase in manufactures, with the percentage increasing from 2.2% in 1996 to 4.3% in 2003, this is especially noticeable in Basic metals, Motor vehicles, and Communication and electronic apparatus. These are sectors where outsourcing from Spain was particularly important, so this evolution of trade seems to reflect that process.
Figure 9: Turkish exports to Spain as % of total Turkish exports21
Focusing on particular goods in the motor vehicles sector (Figure 10), this pattern of
increasing trade, with both exports and imports rising seem to reflect the trade in parts and components characteristic of the outsourcing process, as pointed out by Narin (2005) in his analysis of intra-industrial trade for Turkey.
21 Source: Own elaboration using data from data on Turkish and Spanish trade (Turkish Statistical Institute, Spanish Customs Agency, and STAN database).
0 2 4 6 8 10 12
Food & beverages
Textiles
Chemicals
Rubber & plastic
Other non-metallic
Basic metals
Metal products
Machinery & equip.
Electrical machinery
Communication &electron.
Motor vehicles
Other transport
TOTAL MANUF.
19962003

23
Figure 10: Turkish imports/exports from/to Spain as % of total Turkish imports/exports, selected goods22
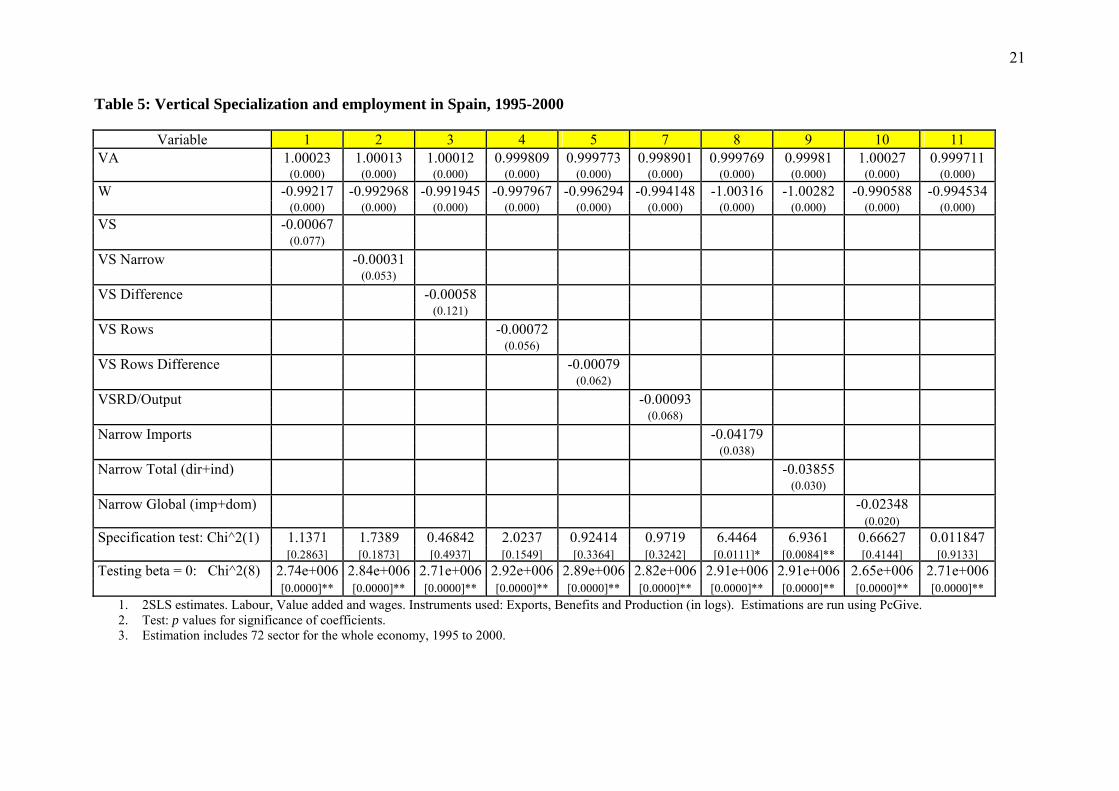
The Turkish Statistical Institute provides data on average number of employees, annual
payment to employees, output, input and exports for 22 manufacturing sectors in 1997-2001. We estimate a labour demand function with average number of employees depending on annual payment per employee, output and the percentage of exports on production. As there are only 110 observations available, GMM techniques are not appropriate, but we present some results using different panel data methods. Although we can not extract definitive conclusions from these estimations, there seems to be some support for the hypothesis of a positive effect of the share of exports to product on employment. These exports include both intermediate and final goods, but given the important increase in trade in Turkish inputs we can regard this variable as a proxy that includes the evolution of outsourcing in other countries to Turkey.
For these available data we have not found significant effects of imports/product and exports to Spain / total exports on employment (note that trade with Spain has increased importantly since 2001).
22 Source: Own elaboration using data from data on Turkish and Spanish trade (Turkish Statistical Institute).
0
2
4
6
8
10
12
Mot
or v
ehic
les f
or th
etra
nspo
rt of
goo
ds, n
.e.s.
Oth
er p
arts
& a
cces
sorie
s of
bodi
es (i
nclu
ding
cab
s)
Bra
kes &
serv
o-br
akes
&pa
rts th
ereo
f
Gea
rbox
es
Driv
e-ax
les w
ith d
iffer
entia
l
Non
-driv
ing
axle
s, &
par
tsth
ereo
f
Oth
er p
arts
& a
cces
sorie
s
Side
-car
s
Parts
& a
cces
sorie
s of
mot
orcy
cles
Veh
icle
s, no
t mec
hani
cally
-pr
opel
led,
n.e
.s.
Imports 2000 Imports 2005 Exports 2000 Exports 2005

24
Table 6: Exports and employment in Turkish manufacturing 1995-2001
Variable OLS
OLS-diff OLS OLS-diff IV
Q 0.9399 (0.000)
0.2908 (0.000)
VA 0.9097 (0.000)
0.1992 (0.026)
0.6142 (0.000)
W/L -1.1741 (0.000)
-0.2008 (0.007)
W/L -1.3260 (0.000)
-0.1608 (0.094)
-0.6851 (0.000)
X/Q 0.8965 (0.001)
0.0774 (0.082)
X/Q 0.7591 (0.001)
0.0583 (0.122)
0.2117 (0.041)
R2 0.8333 0.5044 R2 0.8511 0.4448 AR (1) 2.038
(0.042) 0.3398 (0.734)
AR (1) 1.595 (0.111)
1.094 (0.274)
AR (2) 1.976 (0.048)
0.9732 (0.330)
AR (2) 1.625 (0.104)
1.353 (0.176)
Heterocedasticity 1.6672 (0.0535)
Notes: 1. Dependent variable is L (average number of employees). 2. L, Q and W/L are in logs. 3. X is exports. 4. All regressions include time dummies. IV (2SLS) includes also sector dummies and uses Inputs as an
instrument for VA. 5. Estimation includes 22 sectors and 5 years (1997-2001), and therefore 110 observations. 6. In parentheses, p values for significance of coefficients and null hypothesis for tests.
7. Concluding remarks
Spanish manufacturing industries are involved in a delocalisation process at worldwide scale, by which firms located in developed countries import an increasing share of their intermediate inputs mainly from low-wages countries. They do so either by locating part of their production in those countries or by choosing the best provider in the world. Studying this process by countries and sectors is essential to understand it. By countries, our results show that, although imported inputs in Spain are growing for almost all countries of origin, they are increasing much faster for low-wage countries (Asia, CEE, Turkey, etc.). Furthermore, this phenomenon spills the whole of the manufacturing industries, as narrow outsourcing and vertical specialization measures for low-wage countries evolve
In this paper we have estimated the effects of outsourcing on Spanish employment for 92 manufacturing sectors distinguishing between different geographical locations, and focusing on EU-15, new members and candidates. Our results indicate that there is not clear effect for low-tech sectors while there is a negative effect for outsourcing on employment for medium-high-tech ones. This result appears for both inputs imported from CEE countries and new members and total imported inputs, although it is only significant in the former case.

25
Our results show a significant negative impact of outsourcing to Turkey and CEE countries on employment in medium-high-tech sectors, that can be explained by looking at characteristics of the Spanish manufacturing sector. Firstly, Spain has a comparative disadvantage in medium-high-tech sectors so this type of intermediate goods can not be provided by the domestic industry but has to be imported. A second factor is the dominance of foreign capital, mainly through multinationals location, in high technology firms due to their location strategies in the past. These multinationals only locate part of the production process in Spain and therefore they need to import a great amount of intermediate inputs. Thirdly, these sectors favour the outsourcing process by focusing on product differentiation, introducing information and communication technologies to a greater extent and allowing a greater vertical fragmentation. The aforementioned arguments also explain the lack of significance in the low-tech outsourcing measure. We also estimate a labour demand function for 22 manufacturing Turkish sectors in 1997-2001, including a measure of exports as a proportion of production that seems to have a positive effect on employment.
We also calculate different measures of vertical specialization, extending the original concept of
Hummels et al. (2001) in two ways. First, we obtain the results in matrix form which allows us to have information by rows (vertical specialization by input) and by columns (vertical specialization by sector) and, also, we are able to distinguish between narrow and difference VS. Second, we calculate vertical specialization by country of origin of imports, with particular attention to Turkey and discuss the evolution of these measures. Different VS measures have then been included in a labour demand function using data for 72 sectors from the use matrices of the input-output tables in 1995-2000.Our results show that some of the VS measures have a negative and significant effect on Spanish employment, particularly, VSRD. This measure includes the total content of intermediate inter-industry imports of a particular input for the whole of the exports of a country.

26
8. References Akgüngör, Sedef - Falcioglu, Pinar (2005) European integration and regional specialization patterns in Turkey’s manufacturing industry. Discussion Paper No. 01/05, Dokuz Eylül University, Faculty of Business, Department of Economics, İzmir, TURKEY. Arellano, Manuel - Bond, Stephen R. (1991) Some tests of specification for panel data: Monte Carlo evidence and an application to employment equations. Review of Economics Studies, Vol. 58, pp. 277-297. Blundell, Richard - Bond, Stephen R. (1998) Initial conditions and moment restrictions in dynamic panel data models. Journal of Econometrics, Vol. 87, pp. 115-143. Egger, Hartmut - Egger, Peter (2003) Outsourcing and skill-specific employment in a small economy: Austria and the fall of the Iron Curtain. Oxford Economic Papers, Vol. 55, pp. 625-643. Egger, Hartmut - Egger, Peter (2005) Labour market effects of outsourcing under industrial interdependence. International Review of Economics and Finance, Vol. 14, No. 3, pp. 349-363. Egger, Peter - Pfaffermayr, Michael - Weber, Andrea (2003) Sectoral adjustment of employment: The impact of outsourcing and trade at the micro level. IZA Discussion paper No. 921. Falk, Martin - Wolfmayr, Yvonne (2005) The Impact of International Outsourcing on Employment: Empirical Evidence from EU Countries. Paper presented at the Workshop on Re-location of production and jobs to CEE countries- who gains and who loses organized by Hamburg Institute of International Economics and Vienna University of Economics and Business Administration. Feenstra, Robert C. - Hanson, Gordon H. (1996) Globalization, Outsourcing, and Wage Inequality. American Economic Review, Vol. 86, pp. 240-245. Feenstra, Robert C. - Hanson, Gordon H. (1999) The impact of outsourcing and high-technology capital on wages: Estimates for the United States, 1979-1990. Quarterly Journal of Economics, Vol. 114, pp. 907-940. Gandoy Juste, Rosario - González Díaz, Belén (2004) El comportamiento de la industria tradicional: Crecimiento y competitividad. Economía Industrial, Vol. 335/336, pp. 25-36. Görg, Holger - Hanley, Aoife (2005) Labour Demand Effects of International Outsourcing: Evidence from Plant-level Data. International Review of Economics and Finance, Vol. 14, No. 3, pp. 365-376. Geishecker, Ingo (2005) Does Outsourcing to Central and Eastern Europe really threaten manual workers’ jobs in Germany?. Paper presented at the Workshop on Re-location of production and jobs to CEE countries- who gains and who loses organized by Hamburg Institute of International Economics and Vienna University of Economics and Business Administration. Grossman, Gene M. - Helpman, Elhanan (2002) Integration versus Outsourcing in Industry Equilibrium. Quarterly Journal of Economics, Vol. 117, pp. 85-120. Grossman, Gene M. - Helpman, Elhanan (2005) Outsourcing in a Global Economy. Review of Economic Studies, Vol. 72, pp. 135-159. Hijzen, Alexander - Görg, Holger - Hine, Robert C. (2005) International Outsourcing and the Skill Structure of Labour Demand in the United Kingdom. Economic Journal, Vol. 15, No. 506, pp. 860-878. Hummels, David - Ishii, Jun - Yi, Kei-Mu (2001) The nature and growth of vertical specialization in world trade. Journal of International Economics, Vol. 54, No. 1, pp. 75-96. Minando, Asier - Rubert, Gloria (2002) La especialización vertical en el comercio internacional de España. Revista de Economía ICE, No. 802, pp. 117-128. Myro Sánchez, Rafael - Fernández-Otheo, Carlos M. (2004) La deslocalización de empresas en España. La atracción de la Europa central y oriental. Información Comercial Española, No. 818, pp. 185-201. Narin Emirhan, Pinar (2005) Determinants of vertical intra-industry trade of Turkey: Panel data approach. Discussion Paper No. 05/05, Dokuz Eylül University, Faculty of Business, Department of Economics, İzmir, TURKEY. Pilat, Dirk - Lee, Frank C. (2001) Productivity Growth in Ict-Producing and Ict-Using Industries: A Source of Growth Differentials in the OECD? STI Working Papers 2001/4. Strauss-Kahn, Vanessa (2003) The role of globalization in the within-industry shift away from unskilled workers in France. NBER Working Paper, No. 9716. Torrent, Lluis - Gual, Jordi (2005) El riesgo de deslocalización industrial en España ante la ampliación de la Unión Europea. Papeles de economía española, No. 103, pp. 173-186.
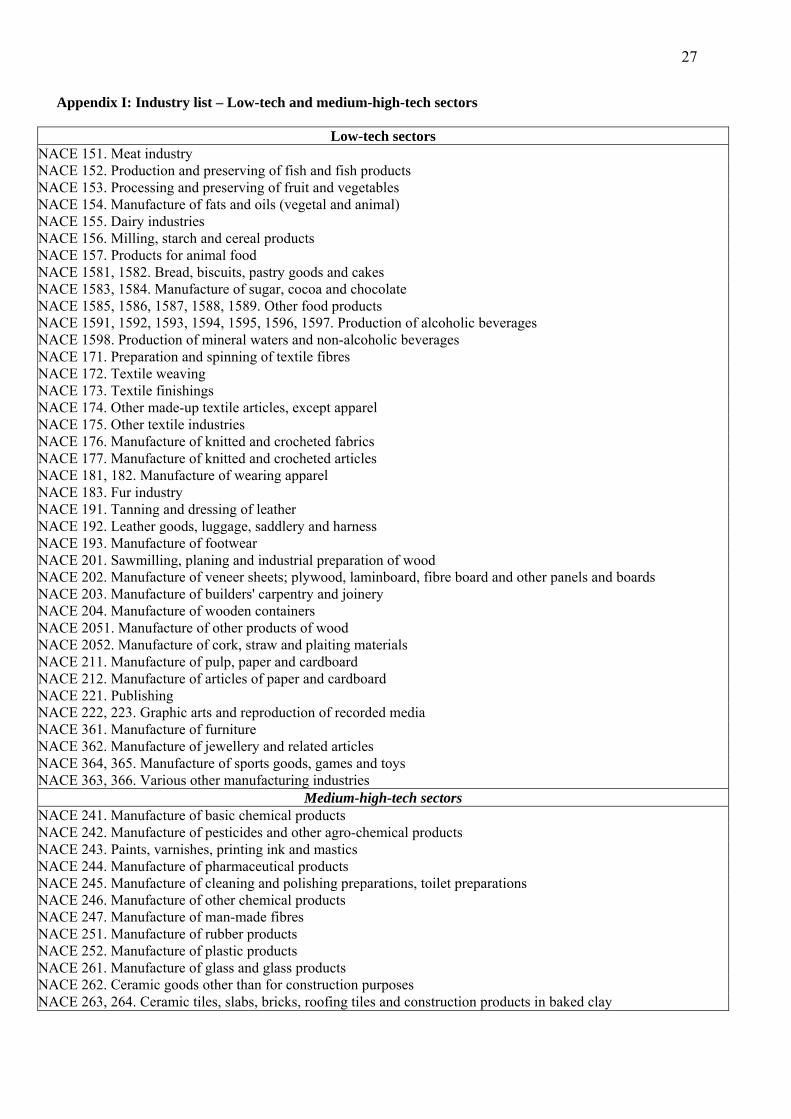
27
Appendix I: Industry list – Low-tech and medium-high-tech sectors
Low-tech sectors NACE 151. Meat industry NACE 152. Production and preserving of fish and fish products NACE 153. Processing and preserving of fruit and vegetables NACE 154. Manufacture of fats and oils (vegetal and animal) NACE 155. Dairy industries NACE 156. Milling, starch and cereal products NACE 157. Products for animal food NACE 1581, 1582. Bread, biscuits, pastry goods and cakes NACE 1583, 1584. Manufacture of sugar, cocoa and chocolate NACE 1585, 1586, 1587, 1588, 1589. Other food products NACE 1591, 1592, 1593, 1594, 1595, 1596, 1597. Production of alcoholic beverages NACE 1598. Production of mineral waters and non-alcoholic beverages NACE 171. Preparation and spinning of textile fibres NACE 172. Textile weaving NACE 173. Textile finishings NACE 174. Other made-up textile articles, except apparel NACE 175. Other textile industries NACE 176. Manufacture of knitted and crocheted fabrics NACE 177. Manufacture of knitted and crocheted articles NACE 181, 182. Manufacture of wearing apparel NACE 183. Fur industry NACE 191. Tanning and dressing of leather NACE 192. Leather goods, luggage, saddlery and harness NACE 193. Manufacture of footwear NACE 201. Sawmilling, planing and industrial preparation of wood NACE 202. Manufacture of veneer sheets; plywood, laminboard, fibre board and other panels and boards NACE 203. Manufacture of builders' carpentry and joinery NACE 204. Manufacture of wooden containers NACE 2051. Manufacture of other products of wood NACE 2052. Manufacture of cork, straw and plaiting materials NACE 211. Manufacture of pulp, paper and cardboard NACE 212. Manufacture of articles of paper and cardboard NACE 221. Publishing NACE 222, 223. Graphic arts and reproduction of recorded media NACE 361. Manufacture of furniture NACE 362. Manufacture of jewellery and related articles NACE 364, 365. Manufacture of sports goods, games and toys NACE 363, 366. Various other manufacturing industries
Medium-high-tech sectors NACE 241. Manufacture of basic chemical products NACE 242. Manufacture of pesticides and other agro-chemical products NACE 243. Paints, varnishes, printing ink and mastics NACE 244. Manufacture of pharmaceutical products NACE 245. Manufacture of cleaning and polishing preparations, toilet preparations NACE 246. Manufacture of other chemical products NACE 247. Manufacture of man-made fibres NACE 251. Manufacture of rubber products NACE 252. Manufacture of plastic products NACE 261. Manufacture of glass and glass products NACE 262. Ceramic goods other than for construction purposes NACE 263, 264. Ceramic tiles, slabs, bricks, roofing tiles and construction products in baked clay
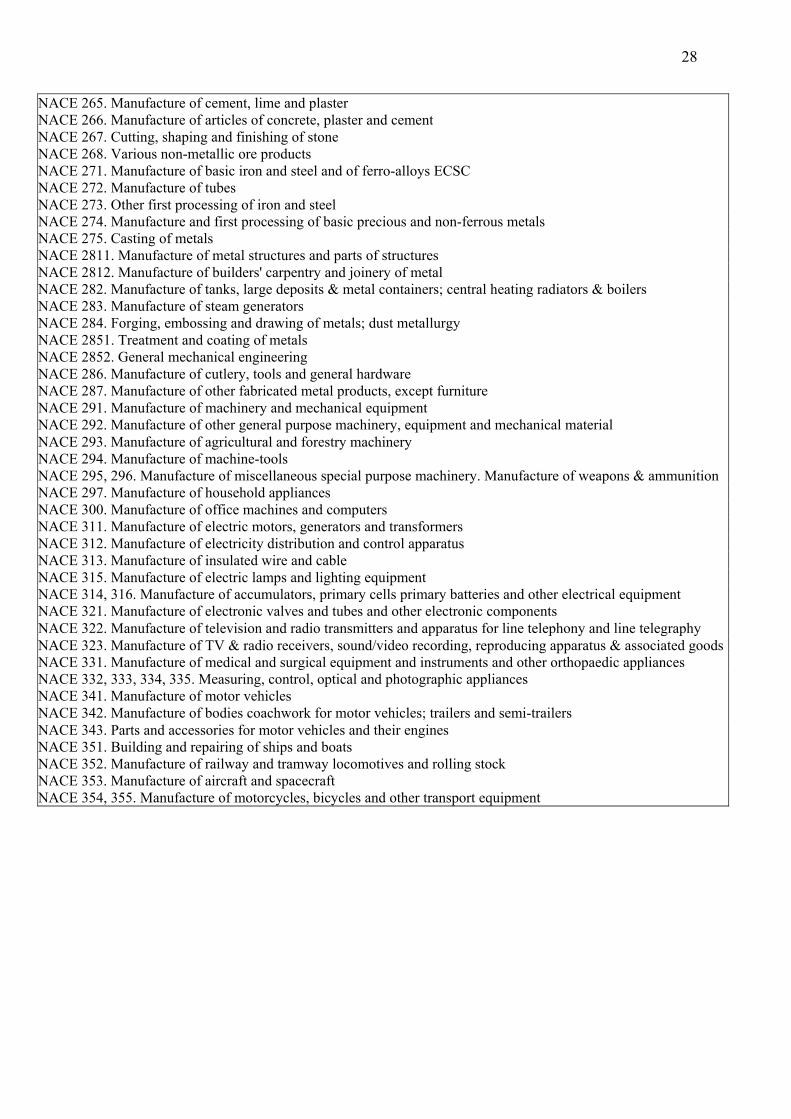
28
NACE 265. Manufacture of cement, lime and plaster NACE 266. Manufacture of articles of concrete, plaster and cement NACE 267. Cutting, shaping and finishing of stone NACE 268. Various non-metallic ore products NACE 271. Manufacture of basic iron and steel and of ferro-alloys ECSC NACE 272. Manufacture of tubes NACE 273. Other first processing of iron and steel NACE 274. Manufacture and first processing of basic precious and non-ferrous metals NACE 275. Casting of metals NACE 2811. Manufacture of metal structures and parts of structures NACE 2812. Manufacture of builders' carpentry and joinery of metal NACE 282. Manufacture of tanks, large deposits & metal containers; central heating radiators & boilers NACE 283. Manufacture of steam generators NACE 284. Forging, embossing and drawing of metals; dust metallurgy NACE 2851. Treatment and coating of metals NACE 2852. General mechanical engineering NACE 286. Manufacture of cutlery, tools and general hardware NACE 287. Manufacture of other fabricated metal products, except furniture NACE 291. Manufacture of machinery and mechanical equipment NACE 292. Manufacture of other general purpose machinery, equipment and mechanical material NACE 293. Manufacture of agricultural and forestry machinery NACE 294. Manufacture of machine-tools NACE 295, 296. Manufacture of miscellaneous special purpose machinery. Manufacture of weapons & ammunition NACE 297. Manufacture of household appliances NACE 300. Manufacture of office machines and computers NACE 311. Manufacture of electric motors, generators and transformers NACE 312. Manufacture of electricity distribution and control apparatus NACE 313. Manufacture of insulated wire and cable NACE 315. Manufacture of electric lamps and lighting equipment NACE 314, 316. Manufacture of accumulators, primary cells primary batteries and other electrical equipment NACE 321. Manufacture of electronic valves and tubes and other electronic components NACE 322. Manufacture of television and radio transmitters and apparatus for line telephony and line telegraphy NACE 323. Manufacture of TV & radio receivers, sound/video recording, reproducing apparatus & associated goodsNACE 331. Manufacture of medical and surgical equipment and instruments and other orthopaedic appliances NACE 332, 333, 334, 335. Measuring, control, optical and photographic appliances NACE 341. Manufacture of motor vehicles NACE 342. Manufacture of bodies coachwork for motor vehicles; trailers and semi-trailers NACE 343. Parts and accessories for motor vehicles and their engines NACE 351. Building and repairing of ships and boats NACE 352. Manufacture of railway and tramway locomotives and rolling stock NACE 353. Manufacture of aircraft and spacecraft NACE 354, 355. Manufacture of motorcycles, bicycles and other transport equipment
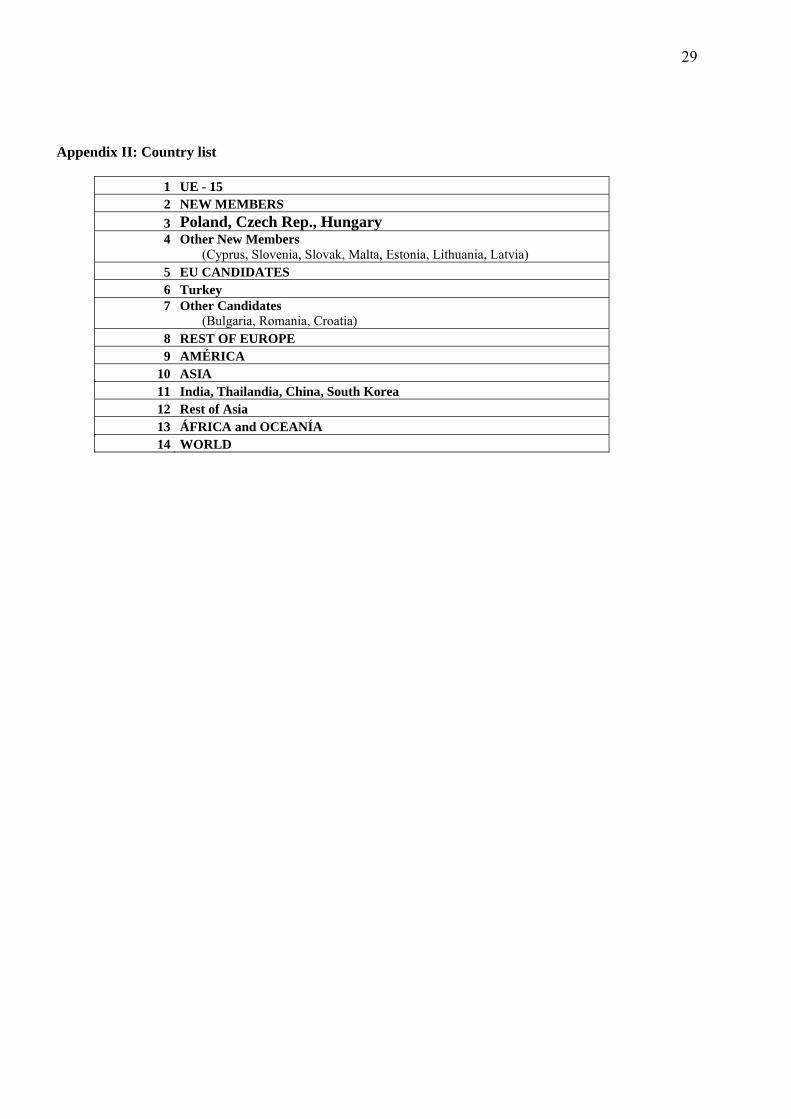
29
Appendix II: Country list
1 UE - 15 2 NEW MEMBERS 3 Poland, Czech Rep., Hungary 4 Other New Members
(Cyprus, Slovenia, Slovak, Malta, Estonia, Lithuania, Latvia) 5 EU CANDIDATES 6 Turkey 7 Other Candidates
(Bulgaria, Romania, Croatia) 8 REST OF EUROPE 9 AMÉRICA
10 ASIA 11 India, Thailandia, China, South Korea 12 Rest of Asia 13 ÁFRICA and OCEANÍA 14 WORLD