Embed Size (px)
Citation preview
C. Davis
Although explosiveshave been known for
over a thousandyears, the science of
explosives is still veryyoung. We are only
beginning to understandthe nonlinear interaction
between chemistry andfluid mechanics that
produces the rapidenergy release
known as detonation.
T he science of high explosives isbasically a coupling of chemistryand fluid mechanics. While each
of these fields is in itself quite well-developed and sophisticated, high-explosives science is surprisingly prim-itive. The fluid-mechanical phenomenonof detonation is reasonably well under-stood, but the detailed chemical reac-tions and thermomechanics that cause adetonation are still largely a mystery,For many explosives, even the finalchemical composition after detonation isnot known accurately and the reactionmechanisms are only guessed at. Similar-ly, while it is clear that some of the mostenergetic explosives would not detonateat all were it not for their nonuniformmechanical response to shock waves, themicromechanics of explosive materials isnot nearly so well understood as that ofmetals.
There are two basic reasons why thescience of explosives is relatively un-developed, and an understanding ofthem indicates why the next decade islikely to produce a dramatic increase inour understanding. First, as is obvious,measurements in the interior of a deto-nating explosive are extremely difficult.Whereas experimental methods have ex-isted for many decades that can charac-terize chemical reactions under normal
conditions, they are of little use underthe extremes of temperature and pres-sure generated in explosives. Similarly,standard techniques to study the me-chanics of flow in metals are of little usewhen the relevant stress and strain ratesproduce a violent reaction in the studiedmaterial. As a result, few academic in-stitutions have deemed it fruitful to es-tablish a research program in explosives.
The second reason is that applicationsof explosives technology in the past havenot placed a high premium on under-standing the details. of the detonationphenomenon. Most explosive applica-tions are in the fields of excavation,mining, or conventional munitions. Allof these have well-established, albeitcrude, “rules-of-thumb” as regardsquantities and configurations of ex-plosive required to accomplish the task.Hence there has been little pressure toestablish an extensive industrial researchbase.
Recently, however, there has been asignificant increase in both the capabilityand motivation for expanded research inexplosives science. Modern instruments,particularly those employing lasers asprobes, have made it possible to selec-tively investigate chemical phenomenaon time scales of less than 100picosecond. Such measurements are
48 LOS ALAMOS SCIENCE
stimulating a rapid growth in experimen-tal and theoretical techniques that shouldsoon be applied to explosives. The needfor understanding the details of theenergy release in explosives is also in-creasing rapidly. Explosive systems arebeing demanded that function with in-creased precision and efficiency and atthe same time maximize safety. Forexample, in situ retorting of oil shale orchemical mining of scarce minerals willrequire blasting techniques that can pro-duce a preselected distribution of smallcracks or fragments rather than just adisplacement of the ore to facilitate me-chanical mining. As another example,modern munitions are increasingly re-liant on the ability to focus the energyfrom explosives to defeat well-protectedtargets such as tanks and armored vehi-cles, Designs of such systems are sosophisticated that a giant computer isneeded to optimize them, and the behav-ior of the explosive must be quite ac-curately predicted. This combination ofdemand for a refined explosive technolo-gy and the availability of new researchtools should produce a dramatic im-provement in the state of explosivesscience. In this article we review ourunderstanding of explosives as it hasevolved by bursts and starts from theturn of the century to the present. Webegin with empirical observations andtrace the development from simple tomore complex fluid-dynamical models ofenergy release and propagation.
Because the time scales for energyrelease are so fast, the simplest modelthat ignores all details of the chemistryhas been remarkably successful in pre-dicting the performance of many ex-plosives presently in use. But the morecomplex models give us insight into the
nonlinear interaction between chemistryand fluid dynamics that is at the heart of
the detonation process.
Detonation Physics
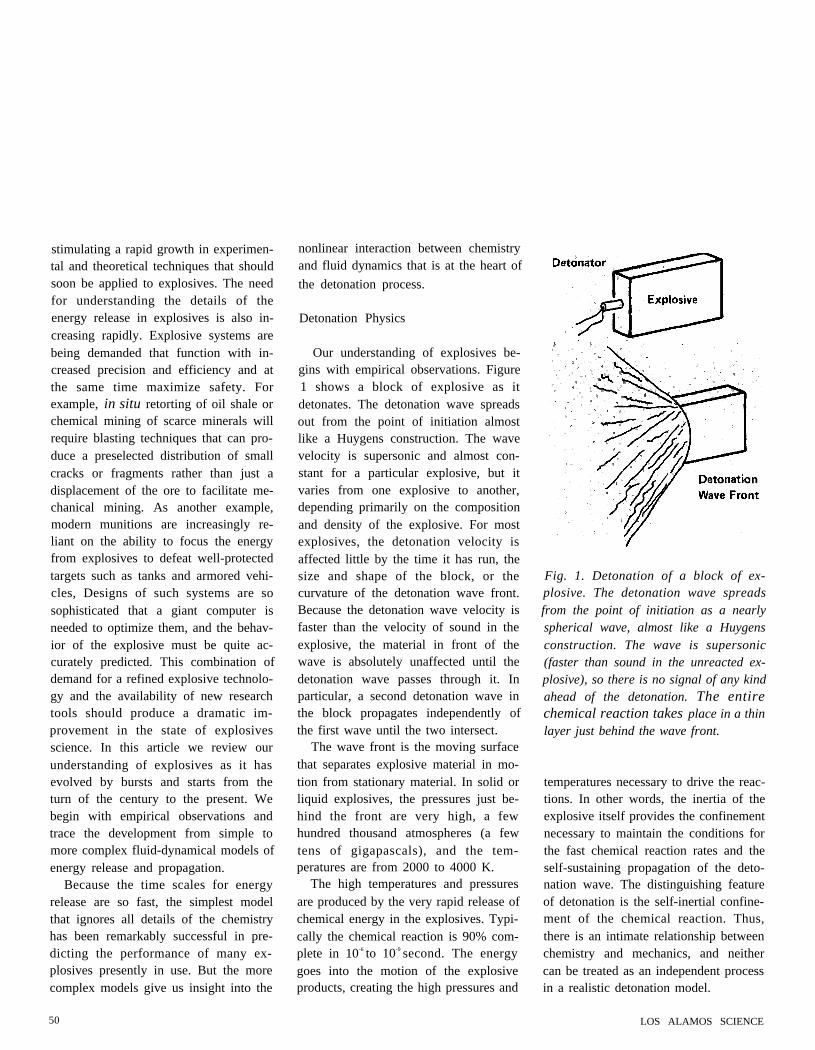
Our understanding of explosives be-gins with empirical observations. Figure1 shows a block of explosive as itdetonates. The detonation wave spreadsout from the point of initiation almostlike a Huygens construction. The wavevelocity is supersonic and almost con-stant for a particular explosive, but itvaries from one explosive to another,depending primarily on the compositionand density of the explosive. For mostexplosives, the detonation velocity isaffected little by the time it has run, thesize and shape of the block, or thecurvature of the detonation wave front.Because the detonation wave velocity isfaster than the velocity of sound in theexplosive, the material in front of thewave is absolutely unaffected until thedetonation wave passes through it. Inparticular, a second detonation wave inthe block propagates independently ofthe first wave until the two intersect.
The wave front is the moving surfacethat separates explosive material in mo-tion from stationary material. In solid orliquid explosives, the pressures just be-hind the front are very high, a fewhundred thousand atmospheres (a fewtens of gigapascals), and the tem-peratures are from 2000 to 4000 K.
The high temperatures and pressuresare produced by the very rapid release ofchemical energy in the explosives. Typi-cally the chemical reaction is 90% com-plete in 10-6 to 10-9 second. The energygoes into the motion of the explosiveproducts, creating the high pressures and
Fig. 1. Detonation of a block of ex-plosive. The detonation wave spreadsfrom the point of initiation as a nearlyspherical wave, almost like a Huygensconstruction. The wave is supersonic(faster than sound in the unreacted ex-plosive), so there is no signal of any kindahead of the detonation. The entirechemical reaction takes place in a thinlayer just behind the wave front.
temperatures necessary to drive the reac-tions. In other words, the inertia of theexplosive itself provides the confinementnecessary to maintain the conditions forthe fast chemical reaction rates and theself-sustaining propagation of the deto-nation wave. The distinguishing featureof detonation is the self-inertial confine-ment of the chemical reaction. Thus,there is an intimate relationship betweenchemistry and mechanics, and neithercan be treated as an independent processin a realistic detonation model.
50 LOS ALAMOS SCIENCE
HIGH EXPLOSIVES THE INTERACTION OF CHEMISTRY AND MECHANICS
Chemical
Reaction Zone
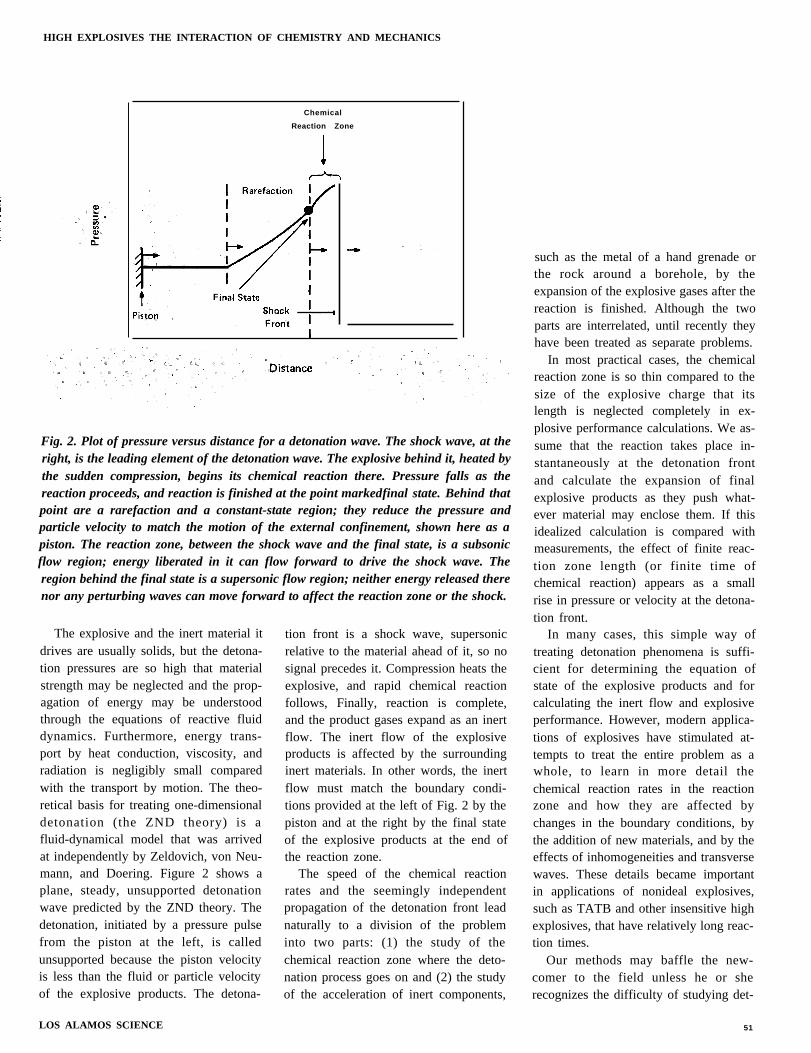
Fig. 2. Plot of pressure versus distance for a detonation wave. The shock wave, at theright, is the leading element of the detonation wave. The explosive behind it, heated bythe sudden compression, begins its chemical reaction there. Pressure falls as thereaction proceeds, and reaction is finished at the point markedfinal state. Behind thatpoint are a rarefaction and a constant-state region; they reduce the pressure andparticle velocity to match the motion of the external confinement, shown here as apiston. The reaction zone, between the shock wave and the final state, is a subsonicflow region; energy liberated in it can flow forward to drive the shock wave. Theregion behind the final state is a supersonic flow region; neither energy released therenor any perturbing waves can move forward to affect the reaction zone or the shock.
The explosive and the inert material itdrives are usually solids, but the detona-tion pressures are so high that materialstrength may be neglected and the prop-agation of energy may be understoodthrough the equations of reactive fluiddynamics. Furthermore, energy trans-port by heat conduction, viscosity, andradiation is negligibly small comparedwith the transport by motion. The theo-retical basis for treating one-dimensionaldetonation (the ZND theory) is afluid-dynamical model that was arrivedat independently by Zeldovich, von Neu-mann, and Doering. Figure 2 shows aplane, steady, unsupported detonationwave predicted by the ZND theory. Thedetonation, initiated by a pressure pulsefrom the piston at the left, is calledunsupported because the piston velocityis less than the fluid or particle velocityof the explosive products. The detona-
LOS ALAMOS SCIENCE
tion front is a shock wave, supersonicrelative to the material ahead of it, so nosignal precedes it. Compression heats theexplosive, and rapid chemical reactionfollows, Finally, reaction is complete,and the product gases expand as an inertflow. The inert flow of the explosiveproducts is affected by the surroundinginert materials. In other words, the inertflow must match the boundary condi-tions provided at the left of Fig. 2 by thepiston and at the right by the final stateof the explosive products at the end ofthe reaction zone.
The speed of the chemical reactionrates and the seemingly independentpropagation of the detonation front leadnaturally to a division of the probleminto two parts: (1) the study of thechemical reaction zone where the deto-nation process goes on and (2) the studyof the acceleration of inert components,
such as the metal of a hand grenade orthe rock around a borehole, by theexpansion of the explosive gases after thereaction is finished. Although the twoparts are interrelated, until recently theyhave been treated as separate problems.
In most practical cases, the chemicalreaction zone is so thin compared to thesize of the explosive charge that itslength is neglected completely in ex-plosive performance calculations. We as-sume that the reaction takes place in-stantaneously at the detonation frontand calculate the expansion of finalexplosive products as they push what-ever material may enclose them. If thisidealized calculation is compared withmeasurements, the effect of finite reac-tion zone length (or finite time ofchemical reaction) appears as a smallrise in pressure or velocity at the detona-tion front.
In many cases, this simple way oftreating detonation phenomena is suffi-cient for determining the equation ofstate of the explosive products and forcalculating the inert flow and explosiveperformance. However, modern applica-tions of explosives have stimulated at-tempts to treat the entire problem as awhole, to learn in more detail thechemical reaction rates in the reactionzone and how they are affected bychanges in the boundary conditions, bythe addition of new materials, and by theeffects of inhomogeneities and transversewaves. These details became importantin applications of nonideal explosives,such as TATB and other insensitive highexplosives, that have relatively long reac-tion times.
Our methods may baffle the new-comer to the field unless he or sherecognizes the difficulty of studying det-
51
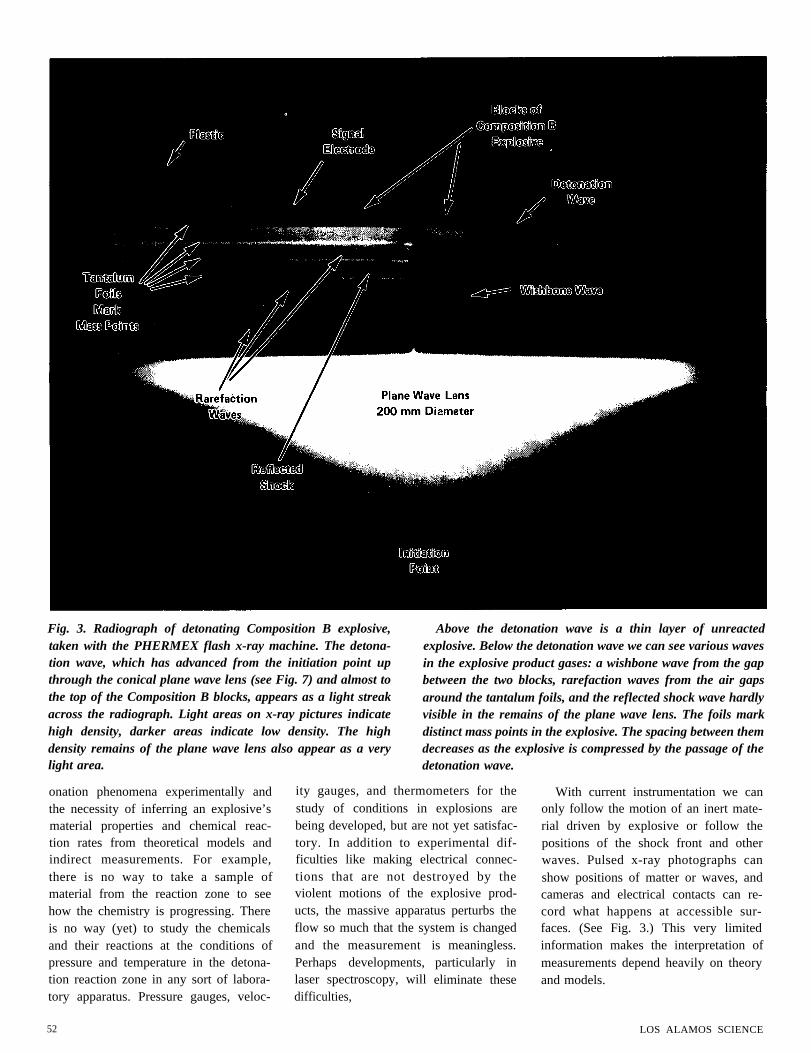
Fig. 3. Radiograph of detonating Composition B explosive,taken with the PHERMEX flash x-ray machine. The detona-tion wave, which has advanced from the initiation point upthrough the conical plane wave lens (see Fig. 7) and almost tothe top of the Composition B blocks, appears as a light streakacross the radiograph. Light areas on x-ray pictures indicatehigh density, darker areas indicate low density. The highdensity remains of the plane wave lens also appear as a very
Above the detonation wave is a thin layer of unreactedexplosive. Below the detonation wave we can see various wavesin the explosive product gases: a wishbone wave from the gapbetween the two blocks, rarefaction waves from the air gapsaround the tantalum foils, and the reflected shock wave hardlyvisible in the remains of the plane wave lens. The foils markdistinct mass points in the explosive. The spacing between themdecreases as the explosive is compressed by the passage of the
light area.
onation phenomena experimentally andthe necessity of inferring an explosive’smaterial properties and chemical reac-tion rates from theoretical models andindirect measurements. For example,there is no way to take a sample ofmaterial from the reaction zone to seehow the chemistry is progressing. Thereis no way (yet) to study the chemicalsand their reactions at the conditions ofpressure and temperature in the detona-tion reaction zone in any sort of labora-tory apparatus. Pressure gauges, veloc-
52
detonation wave.
ity gauges, and thermometers for thestudy of conditions in explosions arebeing developed, but are not yet satisfac-tory. In addition to experimental dif-ficulties like making electrical connec-tions that are not destroyed by theviolent motions of the explosive prod-ucts, the massive apparatus perturbs theflow so much that the system is changedand the measurementPerhaps developments,laser spectroscopy, willdifficulties,
is meaningless.particularly ineliminate these
With current instrumentation we canonly follow the motion of an inert mate-rial driven by explosive or follow thepositions of the shock front and otherwaves. Pulsed x-ray photographs canshow positions of matter or waves, andcameras and electrical contacts can re-cord what happens at accessible sur-faces. (See Fig. 3.) This very limitedinformation makes the interpretation ofmeasurements depend heavily on theoryand models.
LOS ALAMOS SCIENCE
HIGH EXPLOSIVES THE INTERACTION OF CHEMISTRY AND MECHANICS
A Simple Theory
An explosive’s performance or usableenergy is determined by the expansion ofproduct gases following completion ofthe chemical reaction in the explosive.Thus, to calculate performance we mustknow the state (pressure and particlevelocity) of the materials at the end ofthe reaction zone and their equation ofstate, that is, how the pressure varieswith the particle velocity of the productgases during adiabatic or free expansion.With no direct measurements of thesematerial properties nor fundamental the-ory to help us, how do we proceed?
The usual practice has been to apply asimple fluid dynamical model of detona-tions known as the CJ theory. Thisgeneralization of the theory of shockwaves provides a framework for infer-ring the relevant material propertiesfrom standard detonation experiments. Itrelates the detonation wave velocity tothe properties of the gases behind thedetonation wave front.
The CJ theory assumes that allchemical energy is released at the deto-nation front so the reaction zone in Fig.2 has no thickness. The detonation waveis thus approximated by a self-sustainedsupersonic wave traveling through theexplosive at constant velocity. We areinterested in determining four quantities:the velocity of propagation D, and thepressure p, density p, and particle veloc-ity u behind the wave front.
For shock waves in inert materials,the three equations of conservation ofenergy, momentum, and mass across theshock front, the so-called jump condi-tions, are sufficient to determine theshock velocity U in terms of the vari-ables p, p, and u.
LOS ALAMOS SCIENCE
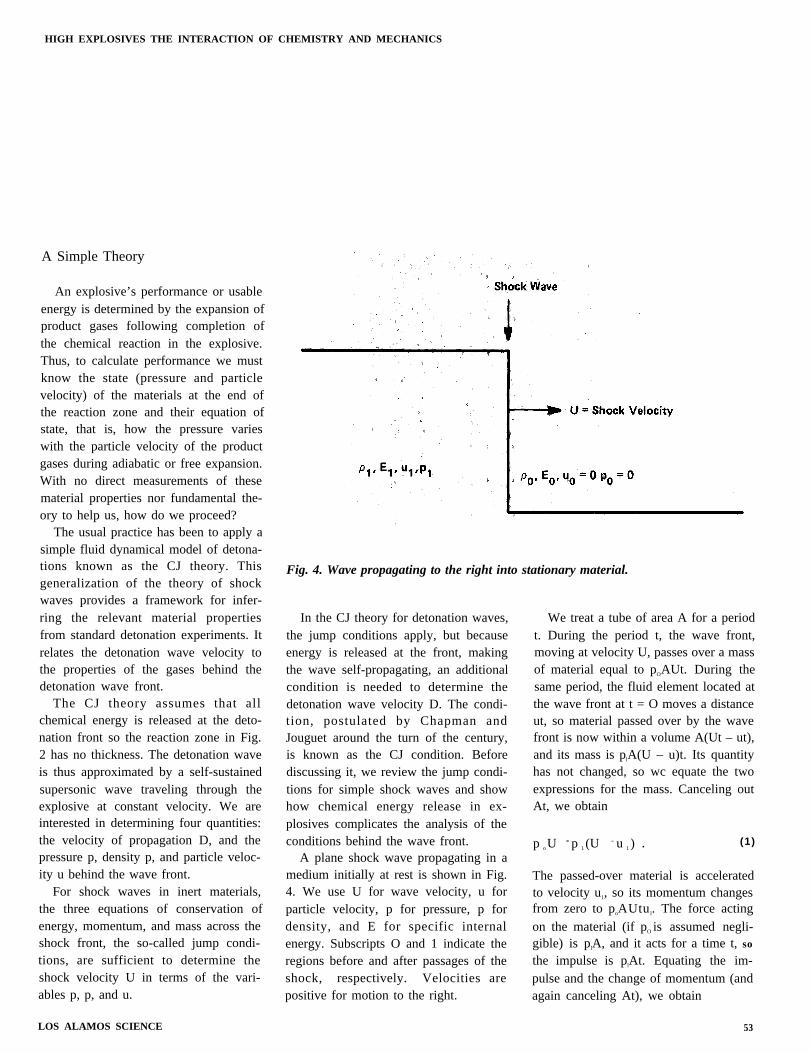
Fig. 4. Wave propagating to the right into stationary material.
In the CJ theory for detonation waves,the jump conditions apply, but becauseenergy is released at the front, makingthe wave self-propagating, an additionalcondition is needed to determine thedetonation wave velocity D. The condi-tion, postulated by Chapman andJouguet around the turn of the century,is known as the CJ condition. Beforediscussing it, we review the jump condi-tions for simple shock waves and showhow chemical energy release in ex-plosives complicates the analysis of theconditions behind the wave front.
A plane shock wave propagating in amedium initially at rest is shown in Fig.4. We use U for wave velocity, u forparticle velocity, p for pressure, p fordensity, and E for specific internalenergy. Subscripts O and 1 indicate theregions before and after passages of theshock, respectively. Velocities arepositive for motion to the right.
We treat a tube of area A for a periodt. During the period t, the wave front,moving at velocity U, passes over a massof material equal to pOAUt. During thesame period, the fluid element located atthe wave front at t = O moves a distanceut, so material passed over by the wavefront is now within a volume A(Ut – ut),and its mass is plA(U – u)t. Its quantityhas not changed, so wc equate the twoexpressions for the mass. Canceling outAt, we obtain
p o U = p 1 (U – u 1 ) . ( 1 )
The passed-over material is acceleratedto velocity u1, so its momentum changesfrom zero to poAUtu l. The force actingon the material (if pO is assumed negli-gible) is plA, and it acts for a time t, so
the impulse is plAt. Equating the im-pulse and the change of momentum (andagain canceling At), we obtain
53
p l = poU ul . (2)
The internal energy changes bypoAUt(E 1
– E o), the kinetic energy
done on the material is the force timesthe distance, plAu1t. The change inenergy and the work done are equal, sowe equate them. Canceling At anddividing by poU = pl/ul from Eq. (2), weobtain the conservation of energy equa-tion
(3)
Equations (l), (2), and (3) are calledthe Rankine-Hugoniot shock relations,o r t h e j u m p conditions. TheRankine-Hugoniot relations along withan equation of state for the material (anexpression for E in terms of p and p)define a smooth curve in the p-p or p-uplane called the Hugoniot curve. Thecurve describes all the states of thematerial that can be reached by thepassage of a single shock wave. TheHugoniot curve is steeper than isothermsand isentropes for the material.
The jump conditions, Eqs. (1) - (3),derived under the assumption that thematerial has no strength, are often ap-plied to metals because the materialstrength is small relative to the shockforces and the shear forces quickly relaxto zero. This approximation is good athigh pressures, but the deviations maybe large at low pressures.
Although we don’t have a theoreticalequation of state for the shocked mate-rial, we know empirically that the rela-tionship between the pressure p and theparticle velocity u on the Hugoniot curveis described adequately by a few terms of
the series expansion
(4)
where c, s, and the coefficients of higherpowers of u1 are constants. These con-stants are determined experimentally. Inthis simple approach that treats theshocked material as nonviscous fluid, theHugoniot curve given in Eq. (4) is acomplete statement of the important ma-terial properties. Comparison with Eq.(2) shows that the velocity of the shockwave in the material is given by theexpansion
Thus, the constant c is the sound speedsince a very weak wave, with U1 negli-
gible, propagates with velocity c.For a fixed shock-wave velocity U,
Eq. (2) describes a line in the p-u planealong which momentum is conserved,called the Rayleigh line. The slope of theline is given by U times the initial densityp0.
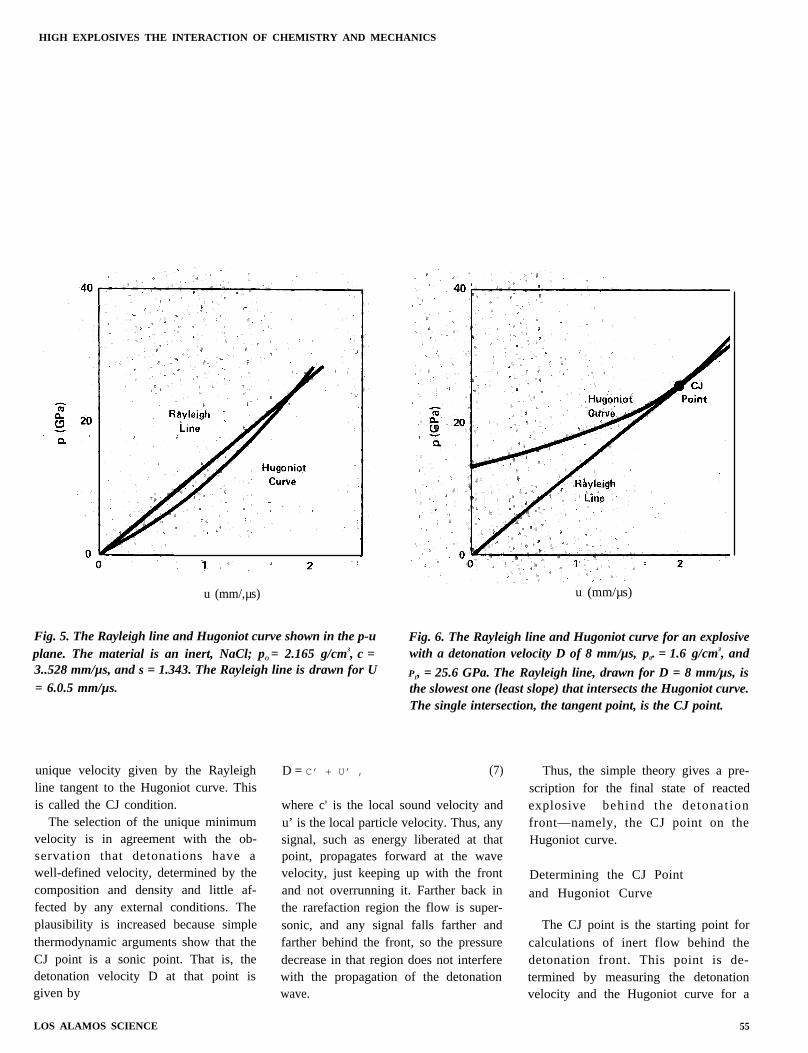
Figure 5 shows the Hugoniot curvefor a particular material and the Ray-leigh line for a particular shock velocityU and initial density p0. The intersectionof the two curves gives the state of thematerial behind the wave front withshock velocity U.
Now we turn from shock waves ininert material to detonation waves inexplosives. We are going to ignore thethickness of the reaction zone and ap-proximate the detonation wave by thediscontinuity shown in Fig. 4. Now thematerial to the right is unreacted ex-plosive, and the material to the left iscompletely reacted explosive products.
The jump conditions apply just as theydo for shock waves, but the Hugoniotrelation describing the final state of ex-plosive products behind the detonationwave front has an additional term reflect-ing the fact that energy is released as thechemical bonds are rearranged. TheHugoniot relation becomes
(6)
Here Q is the specific chemical energy ofthe explosive, and n is another materialconstant to be determined experimental-ly. The Hugoniot curve for an explosiveis shown in Fig. 6, along with theRayleigh line that is just tangent to it.We compare Figs. 5 and 6 to illustratethe differences between inert materialsand explosives. An inert material has aminimum shock velocity U = c, repre-senting a sound wave with zero pressure,and a unique shock wave pressure andparticle velocity for any faster wave.Notice that the Hugoniot curve for theexplosive does not pass through p = O.The explosive has a minimum detonationwave velocity, but the pressure at thatvelocity is not zero but large, and for anyhigher shock velocity the Rayleigh lineand the Hugoniot curve intersect at twopoints rather than one so that the finalstate for the shocked explosive is notuniquely determined by the jump condi-tions and the equation of state.
In the late 1890s, Chapman, in Eng-land, and Jouguet, in France, eliminatedthis ambiguity. They studied the propa-gation of waves in the flows that mightfollow a detonation front and made theplausibility argument that an unsup-ported detonation proceeds at the min-imum detonation velocity, which is the
54 LOS ALAMOS SCIENCE
HIGH EXPLOSIVES THE INTERACTION OF CHEMISTRY AND MECHANICS
u (mm/,µs)
Fig. 5. The Rayleigh line and Hugoniot curve shown in the p-uplane. The material is an inert, NaCl; pO = 2.165 g/cm3, c =3..528 mm/µs, and s = 1.343. The Rayleigh line is drawn for U= 6.0.5 mm/µs.
unique velocity given by the Rayleighline tangent to the Hugoniot curve. Thisis called the CJ condition.
The selection of the unique minimumvelocity is in agreement with the ob-servation that detonations have awell-defined velocity, determined by thecomposition and density and little af-fected by any external conditions. Theplausibility is increased because simple thermodynamic arguments show that theCJ point is a sonic point. That is, thedetonation velocity D at that point isgiven by
LOS ALAMOS SCIENCE
D = C’ + U’ ,
u (mm/µs)
Fig. 6. The Rayleigh line and Hugoniot curve for an explosivewith a detonation velocity D of 8 mm/µs, p0. = 1.6 g/cm3, and
P1, = 25.6 GPa. The Rayleigh line, drawn for D = 8 mm/µs, isthe slowest one (least slope) that intersects the Hugoniot curve.The single intersection, the tangent point, is the CJ point.
(7)
where c' is the local sound velocity andu’ is the local particle velocity. Thus, anysignal, such as energy liberated at thatpoint, propagates forward at the wavevelocity, just keeping up with the frontand not overrunning it. Farther back inthe rarefaction region the flow is super-sonic, and any signal falls farther andfarther behind the front, so the pressuredecrease in that region does not interferewith the propagation of the detonationwave.
Thus, the simple theory gives a pre-scription for the final state of reactedexplosive behind the detonationfront—namely, the CJ point on theHugoniot curve.
Determining the CJ Point
and Hugoniot Curve
The CJ point is the starting point forcalculations of inert flow behind thedetonation front. This point is de-termined by measuring the detonationvelocity and the Hugoniot curve for a
55
given explosive.During the 1950s, W. E. Deal of Los
Alamos carried out an extensive ex-perimental program to determine theHugoniot curves [the constants in Eq.(6)] for several explosives. Because com-puting power was very limited, Deal hadto design experiments that could beanalyzed by using pencil and paper. Hesimplified the required analysis by usingplane detonation waves in the experi-ment.
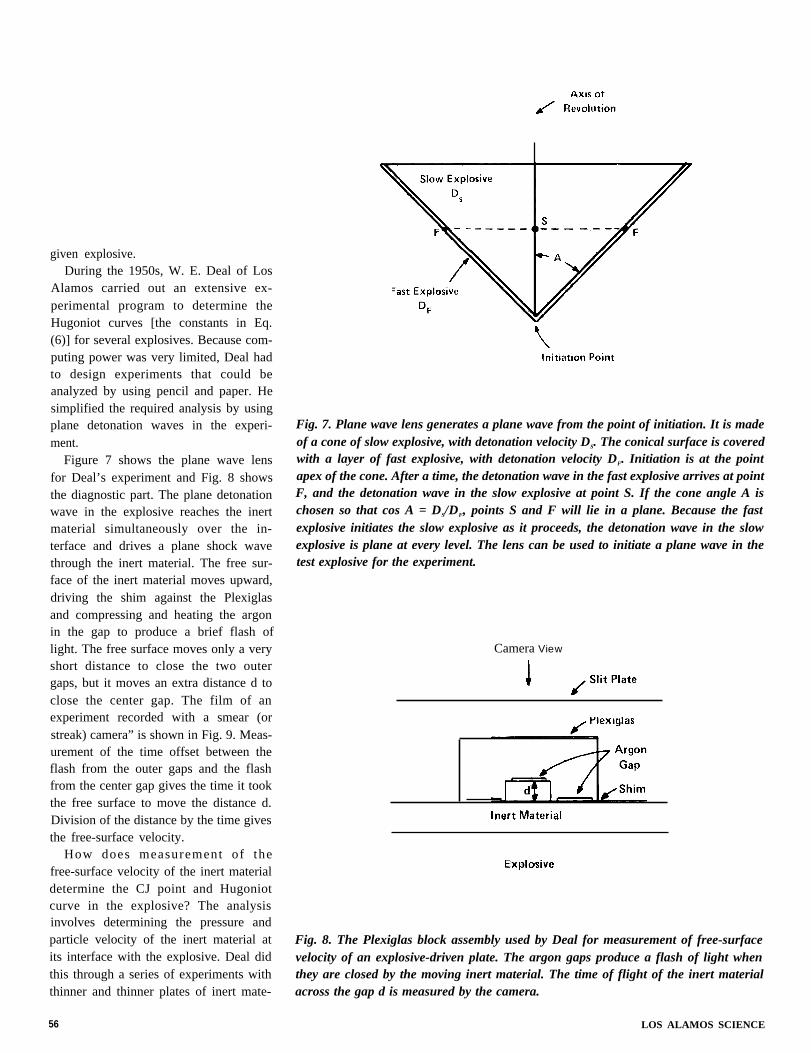
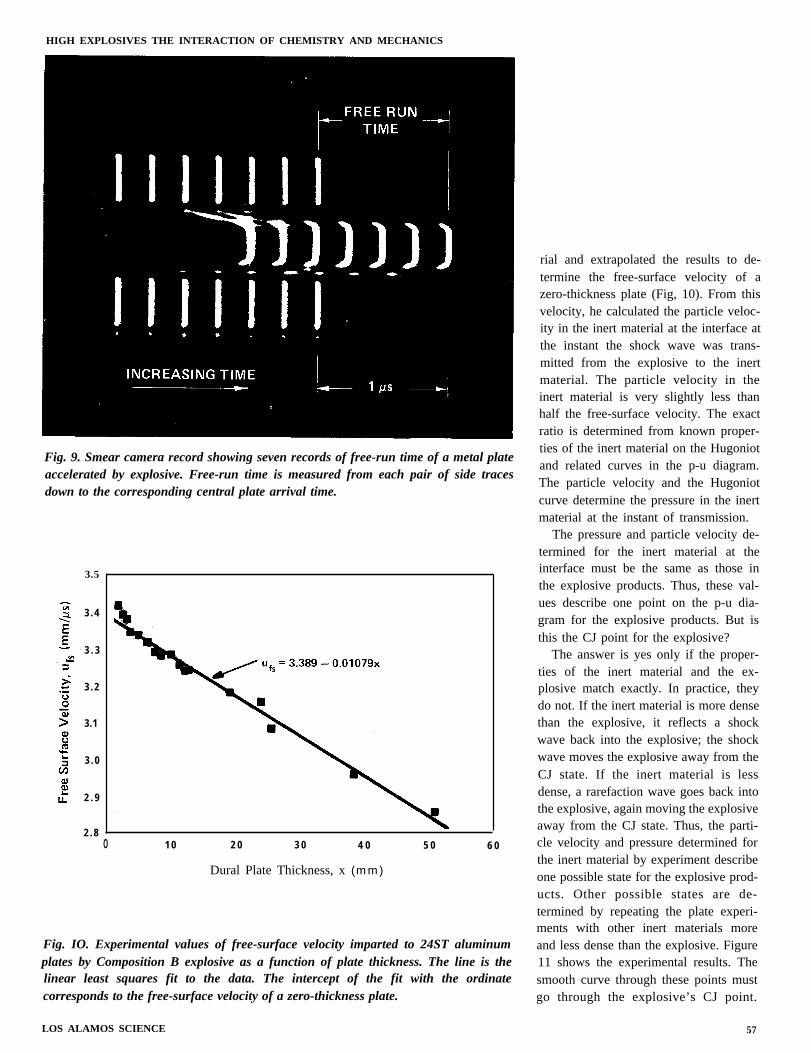
Figure 7 shows the plane wave lensfor Deal’s experiment and Fig. 8 showsthe diagnostic part. The plane detonationwave in the explosive reaches the inertmaterial simultaneously over the in-terface and drives a plane shock wavethrough the inert material. The free sur-face of the inert material moves upward,driving the shim against the Plexiglasand compressing and heating the argonin the gap to produce a brief flash oflight. The free surface moves only a veryshort distance to close the two outergaps, but it moves an extra distance d toclose the center gap. The film of anexperiment recorded with a smear (orstreak) camera” is shown in Fig. 9. Meas-urement of the time offset between theflash from the outer gaps and the flashfrom the center gap gives the time it tookthe free surface to move the distance d.Division of the distance by the time givesthe free-surface velocity.
How does measurement of thefree-surface velocity of the inert materialdetermine the CJ point and Hugoniotcurve in the explosive? The analysisinvolves determining the pressure andparticle velocity of the inert material atits interface with the explosive. Deal didthis through a series of experiments withthinner and thinner plates of inert mate-
Fig. 7. Plane wave lens generates a plane wave from the point of initiation. It is madeof a cone of slow explosive, with detonation velocity DS. The conical surface is coveredwith a layer of fast explosive, with detonation velocity DF. Initiation is at the pointapex of the cone. After a time, the detonation wave in the fast explosive arrives at pointF, and the detonation wave in the slow explosive at point S. If the cone angle A ischosen so that cos A = DS/DF, points S and F will lie in a plane. Because the fastexplosive initiates the slow explosive as it proceeds, the detonation wave in the slowexplosive is plane at every level. The lens can be used to initiate a plane wave in thetest explosive for the experiment.
Camera View
Fig. 8. The Plexiglas block assembly used by Deal for measurement of free-surfacevelocity of an explosive-driven plate. The argon gaps produce a flash of light whenthey are closed by the moving inert material. The time of flight of the inert materialacross the gap d is measured by the camera.
56 LOS ALAMOS SCIENCE
HIGH EXPLOSIVES THE INTERACTION OF CHEMISTRY AND MECHANICS
Fig. 9. Smear camera record showing seven records of free-run time of a metal plateaccelerated by explosive. Free-run time is measured from each pair of side tracesdown to the corresponding central plate arrival time.
3.5
3 . 4
3 . 3
3 . 2
3.1
3 . 0
2 . 9
2 . 80 1 0 2 0 3 0 4 0 5 0 6 0
Dural Plate Thickness, x (mm)
Fig. IO. Experimental values of free-surface velocity imparted to 24ST aluminumplates by Composition B explosive as a function of plate thickness. The line is thelinear least squares fit to the data. The intercept of the fit with the ordinatecorresponds to the free-surface velocity of a zero-thickness plate.
LOS ALAMOS SCIENCE
rial and extrapolated the results to de-termine the free-surface velocity of azero-thickness plate (Fig, 10). From thisvelocity, he calculated the particle veloc-ity in the inert material at the interface atthe instant the shock wave was trans-mitted from the explosive to the inertmaterial. The particle velocity in theinert material is very slightly less thanhalf the free-surface velocity. The exactratio is determined from known proper-ties of the inert material on the Hugoniotand related curves in the p-u diagram.The particle velocity and the Hugoniotcurve determine the pressure in the inertmaterial at the instant of transmission.
The pressure and particle velocity de-termined for the inert material at theinterface must be the same as those inthe explosive products. Thus, these val-ues describe one point on the p-u dia-gram for the explosive products. But isthis the CJ point for the explosive?
The answer is yes only if the proper-ties of the inert material and the ex-plosive match exactly. In practice, theydo not. If the inert material is more densethan the explosive, it reflects a shockwave back into the explosive; the shockwave moves the explosive away from theCJ state. If the inert material is lessdense, a rarefaction wave goes back intothe explosive, again moving the explosiveaway from the CJ state. Thus, the parti-cle velocity and pressure determined forthe inert material by experiment describeone possible state for the explosive prod-ucts. Other possible states are de-termined by repeating the plate experi-ments with other inert materials moreand less dense than the explosive. Figure11 shows the experimental results. Thesmooth curve through these points mustgo through the explosive’s CJ point.
57
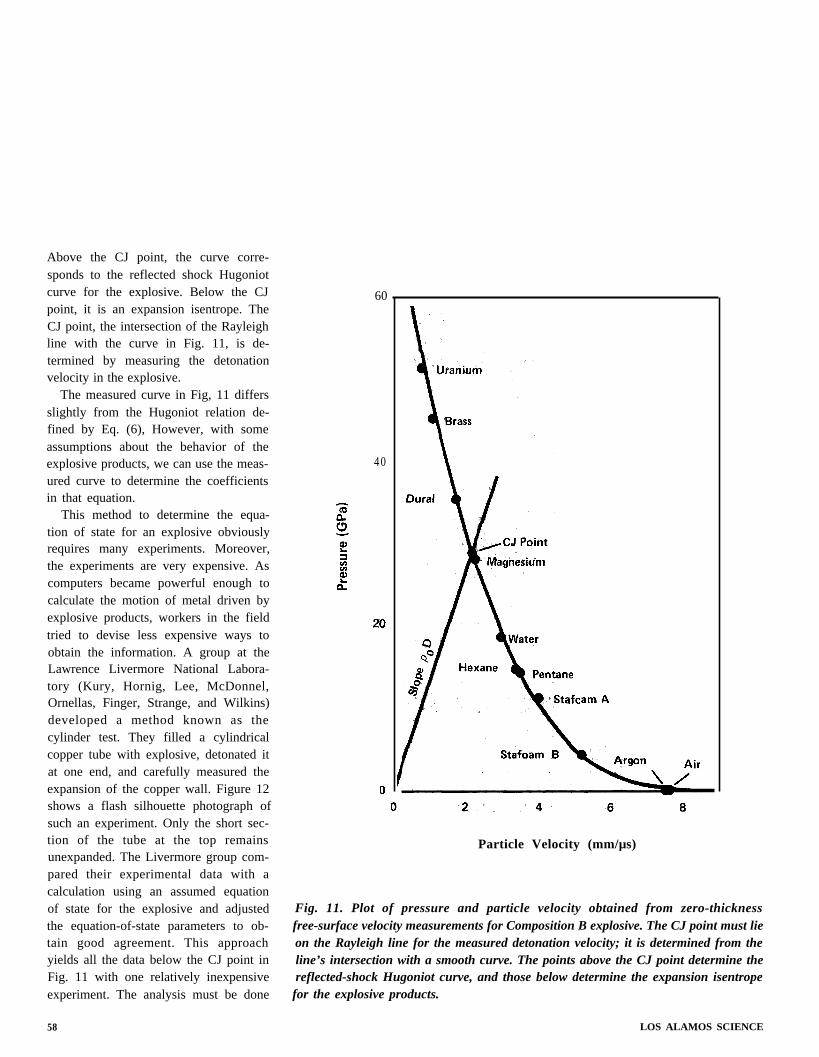
Above the CJ point, the curve corre-sponds to the reflected shock Hugoniotcurve for the explosive. Below the CJpoint, it is an expansion isentrope. TheCJ point, the intersection of the Rayleighline with the curve in Fig. 11, is de-termined by measuring the detonationvelocity in the explosive.
The measured curve in Fig, 11 differsslightly from the Hugoniot relation de-fined by Eq. (6), However, with someassumptions about the behavior of theexplosive products, we can use the meas-ured curve to determine the coefficientsin that equation.
This method to determine the equa-tion of state for an explosive obviouslyrequires many experiments. Moreover,the experiments are very expensive. Ascomputers became powerful enough tocalculate the motion of metal driven byexplosive products, workers in the fieldtried to devise less expensive ways toobtain the information. A group at theLawrence Livermore National Labora-tory (Kury, Hornig, Lee, McDonnel,Ornellas, Finger, Strange, and Wilkins)developed a method known as thecylinder test. They filled a cylindricalcopper tube with explosive, detonated itat one end, and carefully measured theexpansion of the copper wall. Figure 12shows a flash silhouette photograph ofsuch an experiment. Only the short sec-tion of the tube at the top remainsunexpanded. The Livermore group com-pared their experimental data with acalculation using an assumed equationof state for the explosive and adjustedthe equation-of-state parameters to ob-tain good agreement. This approachyields all the data below the CJ point inFig. 11 with one relatively inexpensiveexperiment. The analysis must be done
58
60
40
Particle Velocity (mm/µs)
Fig. 11. Plot of pressure and particle velocity obtained from zero-thicknessfree-surface velocity measurements for Composition B explosive. The CJ point must lieon the Rayleigh line for the measured detonation velocity; it is determined from theline’s intersection with a smooth curve. The points above the CJ point determine thereflected-shock Hugoniot curve, and those below determine the expansion isentropefor the explosive products.
LOS ALAMOS SCIENCE
HIGH EXPLOSIVES THE INTERACTION OF CHEMISTRY AND MECHANICS
Fig. 12. Silhouette flash photograph of a cylinder test. The explosive charge, 300 mmlong and 25 mm in diameter, was encased in a copper tube with 2.5-mm wallthickness. Explosive in the tube has been detonated at the bottom and is acceleratingthe copper outward. A very short section of undisturbed tube can be seen at the top.Measurements of the shape of the copper wall can be used to compute the expansionisentrope of the explosive products. Shock waves in the surrounding gas can be seenaround the tube.
LOS ALAMOS SCIENCE
carefully, but the two-dimensional calcu-lation, while neither cheap nor easy, isless expensive than the plate experi-ments.
Performance of Explosives
As one can easily imagine, there hasbeen a tendency to avoid long calcu-lations by using the experimental meas-urements of cylinder-wall velocity direct-ly to rank explosives in order of theirperformance for accelerating metal. Thisis a mistake. Consider a series of ex-plosives with fixed energy per unit vol-ume but with various densities. In experi-ments. the energy released by chemicalreaction is partitioned between the ex-plosive products and the copper wall.Obviously. the lower the density of theexplosive, the more energy is transferredto the copper. The lowest density ex-plosive will rank highest. This ranking iscorrect if the explosive is used to expandthe tube. But suppose the explosive mustcollapse the tube. In this case, the ex-plosive is applied as a layer on theoutside of the tube. Now the confine-ment effect of the tube is gone, and theinertia of the explosive product gasesprovides the confinement for energytransfer to the copper. In this implodingconfiguration, there is an optimum densi-ty for the explosive. If the explosive istoo light, its products, containing almostall the kinetic energy, will fly off at veryhigh velocity. If it is too heavy, both themetal and product gases will move slow-ly, and less than the optimum fraction ofthe energy will be transferred to thecopper. Therefore, calculations are nec-essary to determine the optimum-densityexplosive t o a c h i e v e t h e b e s t
59
performance in any particular configura-tion of explosive and inert material.
Today, the performance of explosivesystems for most practical applicationsis calculated by using the CJ point andequations of state determined fromfree-surface velocity and cylinder tests.Most engineering calculations neglectthe reaction zone length and calculateonly the inert flow. The calculations arevery accurate when they are done cor-rectly, but they have subtle problems.C. L. Mader, of Los Alamos, discussesmany aspects of detonation calculationsin his book, Numerical Modeling ofDetonations, a volume in the LosAlamos Series in Basic and AppliedSciences.
The Reaction Zone
The assumption that the reaction zoneis small compared with distances ofinterest can be violated in two ways: thecharges can be abnormally small, or theexplosives can have abnormally longreaction zones. Explosive logic (com-puters for extreme environments that useexplosive to “make and and or gates) isan application using extremely smallcharges, and one in which the length ofthe reaction zone must be taken intoaccount. Accurate modeling of the reac-tion zone is important in applicationsusing insensitive high explosives thathave long reaction times. These applica-tions include design of nuclear weaponsand studies of in situ retorting methods.The discovery that TATB and nitro-guanidine (NQ) are extraordinarily safeexplosives, with accidental initiation be-tween 100 and 10,000 times less likely’than for common military explosives,was of great interest to weapon de-
60
Fig. 13. Three Hugoniot curves and the Ray Leigh line for a ZND reaction zone of a
completely reacted products. The pressure at point N is the pressure immediately
point is reached at complete reaction,
signers, Although accidental initiation ofexplosive cannot produce a nuclear ex-plosion, it can result in the scattering oftoxic and radioactive nuclear material.Consequently, insensitive high explosivesare used in nuclear weapon design.These explosives are safe in part becausetheir chemical reactions proceed moreslowly than those of other explosives.Slow chemical reactions mean long reac-tion zones.
Explosives used for blasting also havelong reaction zones. For economy andsafety, some are made from coarse gran-ular ammonium nitrate (a source ofoxygen) coated with hydrocarbon fuel.The physical separation of fuel and ox-idizer means that the components mustdiffuse into each other. Because thediffusion is slow, the reaction zone isvery long. Until recently, blasting wasdone with the guidance of simple tests,but with no detailed computer calcu-
lations. However, new in situ retortingmethods for oil shales and coal requireprecise fragmentation of the rock.Los Alamos, Livermore, and others aredoing experiments and calculations totry to solve some of the problems. Therelatively small charges of’ these materi-als used at laboratory firing sites don’tstay together long enough for the reac-tions to go to completion. Therefore. toscale measurements of small charges upto the large sizes required for blasting,we must understand the chemical reac-tion rates and theirboundary conditions.
The ZND Theory
Present Laboratorythe reaction zone are
dependence on
efforts to modelbuilt on theories
developed during the war years. About1940, the theory of detonation was ex-tended independently, but in almost ex-
LOS ALAMOS SCIENCE
HIGH EXPLOSIVES THE INTERACTION OF CHEMISTRY AND MECHANICS
Fig. 14. An experimental assembly for measuring particle velocity with the magneticprobe technique. The motion of the aluminum foil (75 µm thick) between the explosiveand the Teflon in the nonuniform magnetic field induces about 150 mV in thesingle-turn pickup coil. The voltage is recorded during the interval, about 1 µs,between the time when the foil starts to move and the time when the shock wavereaches the coil and destroys it. The voltage record can be unfolded to give foil velocityversus time.
actly the same way, by Zeldovich inRussia, von Neumann in the UnitedStates, and Doming in Germany. TheZND theory, describing a steady reac-tion zone with a finite chemical reactionrate, took some of the mystery out of theCJ theory. In the ZND theory, the frontof the detonation is a shock wave wherethe pressure and temperature rise, butwhere little or no reaction occurs be-cause the time is so short. Behind theshock wave, the explosive reacts at highpressure and temperature until all of it ischanged into product gases. To make theequations tractable, the ZND theoryalso assumes that the reaction zone issteady; that is, it maintains exactly thesame form as it moves through theexplosive. The shock wave in Fig. 3 is
LOS ALAMOS SCIENCE
unchanged, but instead of a single state(pressure and particle velocity) behind it,there is a continuous range of states
1, that marks the progress of thechemical reaction. The assumption thatthe reaction zone is steady, however,reduces the problem to the kind alreadyconsidered. Equations (1), (2), (3), and(6) apply between the initial state andany selected state in the reaction zone.Equation (6), of course, must be changedto represent the heat released up to that
already reacted, it is also the fraction ofheat already released, The replacementfor Eq. (6) is
value. The coefficients n, c, s, ..., are also
curves represented by Eq. (8). The
unreacted explosive at the detonationfront is just like the Hugoniot curve foran inert material shown in Fig. 5. As
1, the state in the reaction zone isrepresented by points along the Rayleighline between N and CJ.
The pressure-distance curve for theZND detonation was shown in Fig. 2.The shock wave at the detonation frontin Fig. 2 raises the pressure to point N inFig. 13. As the reaction proceeds, thepressure falls until it reaches point CJ,where reaction is complete. (This point ismarked “final state” in Fig. 2.)
The new feature of the ZND theory isthe reaction zone and, in particular, thehigh pressure at the detonation front.The fall in pressure caused by chemicalreaction is contrary to almost everyone’sintuition. When von Neumann’s reportdetailing his new theory was firstcirculated in 1942, it was greeted withdisbelief because the “von Neumannspike” seemed patently absurd.
Measurable Effects of the
Reaction Zone
Figure 13 shows that a parti-cle-velocity spike accompanies the pres-sure spike at the detonation front. Wecan measure particle velocity indirectlyby placing a foil in the explosive andmeasuring the foil velocity induced bythe passage of the detonation wave. Thefoil velocity is equal to the particlevelocity of the explosive products. The
61
experiment is diagramed in Fig. 14,and the results are plotted in Fig. 15. Thedashed line in Fig. 15 is the rarefactionbehind the detonation front calculatedwith the simplest theory, that is, as if thereaction zone were negligibly thin. Thesolid line is the particle velocity meas-ured in the experiment. Where the meas-ured velocity slope is greater than thecalculated slope, chemical reaction is stillappreciable. The von Neumann spike isreal.
The time during which the slope of thesolid line differs from the slope of thedashed line is a measure of the chemicalrate or reaction zone length. In Fig. 15,the time for passage of the reaction zoneis about 0.5 µs, corresponding to areaction zone length of 3 mm. Thesedata determine a chemical reaction rateof the form
(lo)
coefficient k, with units of reciprocaltime, measures how fast the reactiongoes. The depletion term, in parentheses,makes the rate go to zero when all theexplosive has reacted.
Obviously, one learns very little aboutchemistry from mechanical measure-ments. Any information about the realchemistry of the explosive reactionwould be extremely valuable but, un-fortunately, the pressures and tem-peratures in the reaction zone are farhigher than laboratory measurements.Detonation data must be obtained fromdetonation measurements.
Detonations in Cylindrical Sticks
One way to obtain more information
62
1.5
Fig. 15. Particle velocity versus time at the explosive products-Teflon interface. Theexplosive was PBX-9502, a TATB insensitive composition with a long reaction zone.The solid line is the experimental result, and the dashed line is a calculation using thesimplest model, with an infinitesimal reaction zone. Where the experimental curve hasa steeper slope than the calculation, reaction is appreciable. The von Neumann spikeat the front is obviously real.
about the chemistry in the reaction zoneand, in particular, about its dependenceon pressure, is to change the boundaryconditions so that they affect thechemistry. For example, we can studythe detonation process in long cylindricalsticks, where the process has a chance toreach a steady state, but where surfaceeffects, especially the decrease of pres-sure from the center of the stick to itsedges, may change the chemistry.
Over the years, many experimentershave studied detonations in cylindricalsticks and have perfected measurementsof the detonation velocity to achieveaccuracies of a few parts in tenthousand. The most dramatic result ofthese experiments is the discovery of thefailure radius. That is, for each explosive,there is a radius below which detona-tions fail to propagate.
Figure 16 shows a cylindrical stick
LOS ALAMOS SCIENCE
HIGH EXPLOSIVES THE INTERACTION OF CHEMISTRY AND MECHANICS
Fig. 16. Detonation velocity experiment ready for firing. Foils explosive are connected by coaxial cables to oscilloscopes.placed between segments of the long cylindrical stick of They measure the arrival time of the detonation wave.
1/R (mm-l )
Fig. 17. Plot of measured detonation velocity for solid and liquid explosives versusreciprocal charge radius. The curves end at the measured or estimated failure points.These data show that detonation propagates only for a very limited range of velocity
for any particular explosive, the maximum decrement here being only about 15%.
LOS ALAMOS SCIENCE
ready for tiring to measure its detonationvelocity. The very thin foils insertedbetween the segments of the stick act aselectrical switches to indicate the exactdetonation wave arrival time. Figure 17shows plots of measured detonation ve-locities (D) versus reciprocal charge radiiof several explosives. Each curve termi-nates at a radius, called the failure radius(Rf), below which a detonation will notpropagate. Evidently, surface effectstake so much energy from the detonationthat it cannot proceed. The failure radiifor the explosives in the figure vary by afactor of 100, from 0.2 to 20 mm. Thedetonation velocity decreases as the radi-us of the explosive charge decreases, butthe velocity decrease is surprisinglysmall. For nitromethane, the detonationvelocity near failure is within about 0.50/0of the velocity in very large charges ofthe same explosive. Even the largestvelocity decrease is only about 150/0 inthese explosives. Detonation seems to bea very fussy process that can occur onlyin a very limited range of velocities.
63
The Two-DimensionalReaction Zone
In the last 5 years, John Bdzil, of LosAlamos, has extended the theory of thedetonation reaction zone to the case of acylindrical stick of explosive in an inerttube, like the cylinder test describedabove. In his model, Bdzil assumes thedetonation wave has run far enough inthe tube that the flow is steady. Figure18 shows a diagram of a steady detona-tion in a metal tube. Along the centerline the reaction zone is much like theZND detonation, but away from the linethe difference becomes pronounced asthe transverse flow transfers some of itsenergy to the metal tube. The shockwave is curved, and the shock pressuredecreases with increasing distance fromthe center. Because the shock pressure isless, the explosive is heated less and thereaction takes longer. The dashed lineshows where reaction is complete. Thesonic surface, between the shock and thecomplete reaction line, is an importantdividing surface in this flow. Only theportion of the chemical energy releasedabove this surface contributes to drivingthe detonation. Even more important,energy used in the transverse expansionin the reaction zone is not available fordriving the detonation. Thus, the detona-tion velocity is less than it would be in aplane wave detonation, or even in a stickwith a larger radius.
The theory of this two-dimensionaldetonation reaction zone is complicated.The shape of the shock determines theinitial conditions for the reaction zone,but is itself part of the solution. Bdzilobtained an ordinary differential equa-tion for the shock shape, which can besolved analytically for some simple
64
Explosive
/Streamline
MetalTube
Fig. 18. Cross section of the detonation reaction zone in a metal tube. The curvedshock wave is the Ieading front of the detonation. Explosive heated by the compressionreacts behind the shock. Only material that reacts ahead of the sonic surface cancontribute to driving the detonation wave.
0.04Shock Loci
10
Fig. 19. Comparison of measured detonation shock wave shapes with calculations ofthe shape for an assumed rate law. Getting agreement between measurement andcalculation places restrictions on the form of the rate law.
LOS ALAMOS SCIENCE
HIGH EXPLOSIVES THE INTERACTION OF CHEMISTRY AND MECHANICS
0.94
0.92
0.90
0.88
0.86
0.84
Fig. 20. Plot of measured detonation velocity versus reciprocal graph on the left is a magnified view of the curves where theyradius for nitromethane, nitromethane with the catalyst intersect the ordinate. The slopes of the curves in this regionDETA, and nitromethane with silica particles. The catalyst indicate the reaction zone lengths. The catalyst shortens theand the particles both decrease the failure radius by a factor of reaction zone, and the particles lengthen it.2, but the silica particles change the shape of the curve. The
chemical reaction rates and integratednumerically for others.
The theory must match the measureddetonation velocity, the measured shapeof the detonation front, and the meas-ured velocity decrement at failure. Ap-plying the theory to these data givessome insight into the chemical reactionmechanisms. If the chemical reactionrate is assumed to have a form
(11)
where p* is the limiting shock pressurefor the large charges at the left edge ofFig. 17, the theory can be used to tit theobservations. The coefficient k, withunits of reciprocal time, measures thescale of the chemical reaction time and,therefore, the reaction zone length. It isdetermined principally by the slope ofthe velocity curves near their start at theleft in Fig. 17. Larger slopes correspond
LOS ALAMOS SCIENCE
to larger edge effects and, therefore, tolonger reaction zones. The value of theexponent n in Eq. (11) is determinedprincipally by the amount the velocitydecreases before the failure point isreached. For n small, the effect on thechemical reaction rate of the pressuredecrease at the edges of the stick issmall, and the detonation can proceed atlower velocity. For n large, the effect isgreater. and the detonation fails with lessdecrease in velocity.
The measured shock wave shape atthe front in a detonating stick is com-pared with the shape found from thetheory, and the reaction rate is adjustedfor the best match. Matching the shockshape for several different radii, butusing the same chemical reaction rate forall, places functional requirements on therate law. Figure 19 compares theoreticalfits with data for cylindrical nitro-methane sticks with two different radii.
New Reaction Zone Experiments
These advances in the theory haveencouraged new experiments to explorethe chemical reaction zone. The reactionrate and its dependence on pressure canbe influenced by adding a catalyst or bysuspending solid particles in a liquidexplosive. In one series of experiments,nitromethane, a water-white, nonviscousliquid explosive, was chosen as the stan-dard. The experiments compared thedetonation velocity and failure radius ofthe standard with those of the standardplus small amounts of additional materi-als. Because the same explosive was usedin all the experiments, any uncertaintiesin the equation of state or any otherproperties cancel out and the effects ofthe added materials on the reaction ratecan be determined. The diameter-effectcurve for nitromethane, in Fig. 20, ap-pears to be a straight line, and its
65
velocity decreases only 0.5% at failure.Adding the catalyst DETA in a verysmall amount (0.03%—about 1 mole-cule of catalyst for each 5,000 moleculesof explosive) decreases the failure radiusby a factor of 2, but leaves both thedetonation velocity and the velocity de-crease unchanged. Adding silica parti-cles and a little gelling agent to holdthem in place also decreases the failureradius by a factor of 2, but changes thevelocity decrease to about 13?40 at fail-ure. The slopes of the curves at largeradius, shown in the magnified view onthe left, indicate [as discussed with Eq.(11)] that adding DETA shortens thereaction zone. On the other hand, addingsilica particles lengthens the reactionzone appreciably.
Ray Engelke, of Los Alamos, who isdoing these experiments, interprets theeffect of the catalyst DETA as theexpected one; it speeds up the reaction,thus shortening the reaction zone, de-creasing the edge effects, and therebydecreasing the failure radius. The factthat the velocity decrease stays the sameindicates that the catalyst doesn’t changethe dependence of the chemical reactionrate on the pressure in this explosive.The silica particles lengthen the reactionzone but decrease the failure radius.Probably the particles create hot spots:that is, the shock wave develops ir-regularities as it passes over them. andthe high temperature in these spots keepsthe reaction going even when the averagepressure and temperature fall near theedge of the cylinder. Another possibilityis that real failure is not as simple as themodel, and that strong transverse wavestraveling from the edge into the reactionzone quench the reaction. If so, the silicaparticles may interfere with the action of
66
Fig. 21. Three-dimensional plot of detonation velocity as a function of initial densityand initial energy, for nitromethane (at the rear) and mixtures of acenina andnitromethane (leading up from front to back). These data provide a test of the theory.
For nitromethane, changing the temperature changes the density quite a lot, and theenergy a little. For mixtures of nitromethane and acenina, the energy changes a lotand the density a little. Acenina is an equimolar mixture of nitric acid, water, andacetonitrile. It has the same atomic composition as nitromethane, so the explosiveproducts are the same. These experiments define the detonation velocity surface in theneighborhood of the intersection of the two lines.
the waves by diffusing their sharp frontsas they envelop the individual particles.
Perhaps experiments like these willdevelop enough understanding of thefactors influencing the reaction rates inthe detonation reaction zone that we canformulate new explosives with specialuseful properties. For example, the in-sensitive high explosives now in use aresafe partly because of their slow reactionrates at low pressures. But their slowreaction rates at the high pressures in thedetonation reaction zone cause unwel-come behavior. Understanding may leadto explosives with slow rates at low.pres-sures and fast rates at high pressures.
Is the End of Reaction a CJ Point?
In the limit of large charge size andplane flow, we expect that chemicalreaction ends at the CJ point, where theflow is exactly sonic. Direct comparisonof theory and experiment to determinewhether the end point of chemical reac-
tion really is a CJ point is not possiblefor most solid and liquid explosives be-cause the equations of state needed to dothe calculation must be determined ex-perimentally and the experiments in-corporate the assumption that the endpoint is a CJ point.
To avoid this logical dilemma, wehave developed a pressure-determinationmethod that is independent of the exactequation of state of the final products.The method involves measuring howmuch the detonation velocity varies withinitial energy and density of the ex-plosive. The measurements are made fortwo explosives with the same atomiccomposition, and the data define a deto-nation velocity surface as described inFig. 21. To determine the pressure of theexplosive products from this surface, weapply the CJ theory. No knowledge ofthe exact equation of state is needed; weneed only the assumption that for twoexplosives with the same atomic com-positions, the equilibrium equation of
LOS ALAMOS SCIENCE
HIGH EXPLOSIVES THE INTERACTION OF CHEMISTRY AND MECHANICS
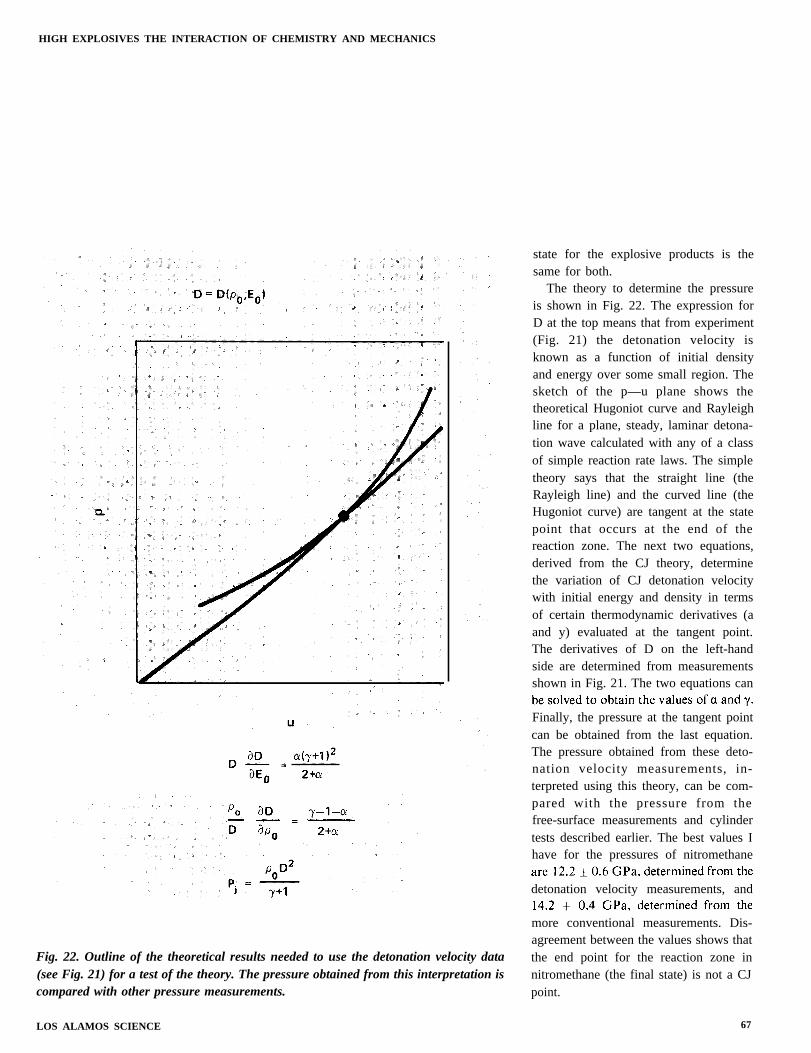
Fig. 22. Outline of the theoretical results needed to use the detonation velocity data(see Fig. 21) for a test of the theory. The pressure obtained from this interpretation iscompared with other pressure measurements.
state for the explosive products is thesame for both.
The theory to determine the pressureis shown in Fig. 22. The expression forD at the top means that from experiment(Fig. 21) the detonation velocity isknown as a function of initial densityand energy over some small region. Thesketch of the p—u plane shows thetheoretical Hugoniot curve and Rayleighline for a plane, steady, laminar detona-tion wave calculated with any of a classof simple reaction rate laws. The simpletheory says that the straight line (theRayleigh line) and the curved line (theHugoniot curve) are tangent at the statepoint that occurs at the end of thereaction zone. The next two equations,derived from the CJ theory, determinethe variation of CJ detonation velocitywith initial energy and density in termsof certain thermodynamic derivatives (aand y) evaluated at the tangent point.The derivatives of D on the left-handside are determined from measurementsshown in Fig. 21. The two equations can
Finally, the pressure at the tangent pointcan be obtained from the last equation.The pressure obtained from these deto-nation velocity measurements, in-terpreted using this theory, can be com-pared with the pressure from thefree-surface measurements and cylindertests described earlier. The best values Ihave for the pressures of nitromethane
detonation velocity measurements, and
more conventional measurements. Dis-agreement between the values shows thatthe end point for the reaction zone innitromethane (the final state) is not a CJpoint.
LOS ALAMOS SCIENCE 67
Extended Theory for the Final State
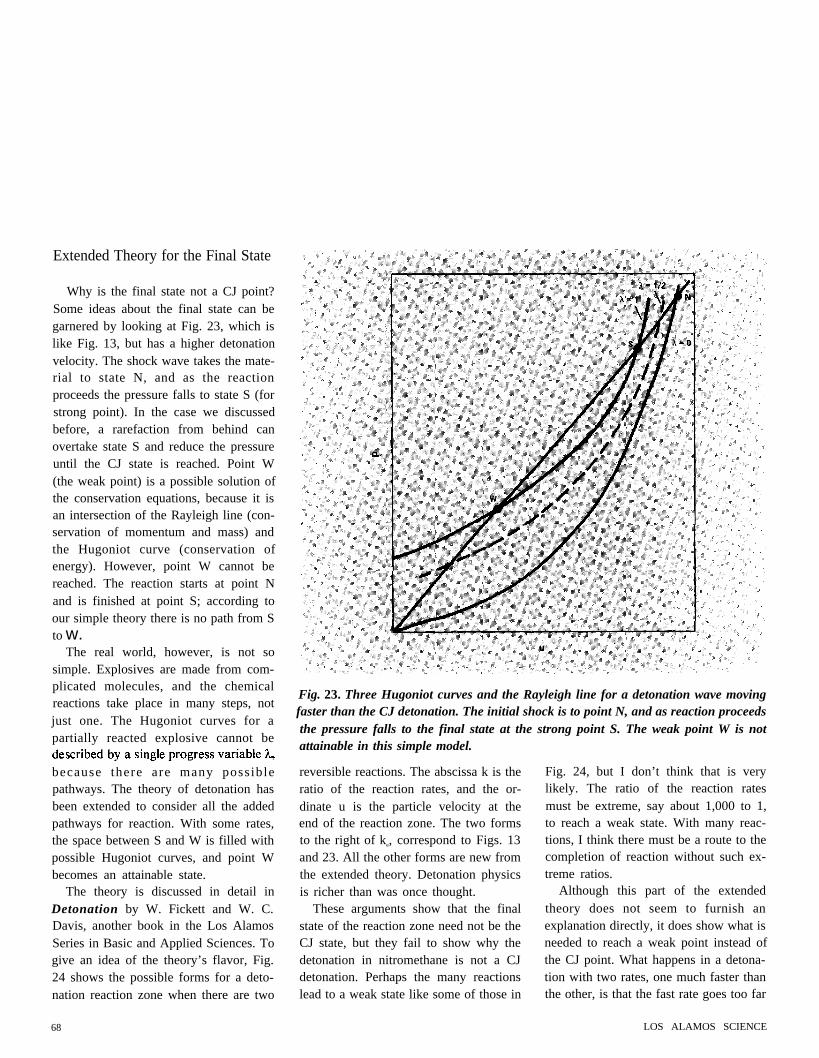
Why is the final state not a CJ point?Some ideas about the final state can begarnered by looking at Fig. 23, which islike Fig. 13, but has a higher detonationvelocity. The shock wave takes the mate-rial to state N, and as the reactionproceeds the pressure falls to state S (forstrong point). In the case we discussedbefore, a rarefaction from behind canovertake state S and reduce the pressureuntil the CJ state is reached. Point W(the weak point) is a possible solution ofthe conservation equations, because it isan intersection of the Rayleigh line (con-servation of momentum and mass) andthe Hugoniot curve (conservation ofenergy). However, point W cannot bereached. The reaction starts at point Nand is finished at point S; according toour simple theory there is no path from Sto w.
The real world, however, is not sosimple. Explosives are made from com-plicated molecules, and the chemicalreactions take place in many steps, notjust one. The Hugoniot curves for apartially reacted explosive cannot be
because there are many possiblepathways. The theory of detonation hasbeen extended to consider all the addedpathways for reaction. With some rates,the space between S and W is filled withpossible Hugoniot curves, and point Wbecomes an attainable state.
The theory is discussed in detail inDetonation by W. Fickett and W. C.Davis, another book in the Los AlamosSeries in Basic and Applied Sciences. Togive an idea of the theory’s flavor, Fig.24 shows the possible forms for a deto-nation reaction zone when there are two
68
Fig. 23. Three Hugoniot curves and the Rayleigh line for a detonation wave movingfaster than the CJ detonation. The initial shock is to point N, and as reaction proceedsthe pressure falls to the final state at the strong point S. The weak point W is notattainable in this simple model.
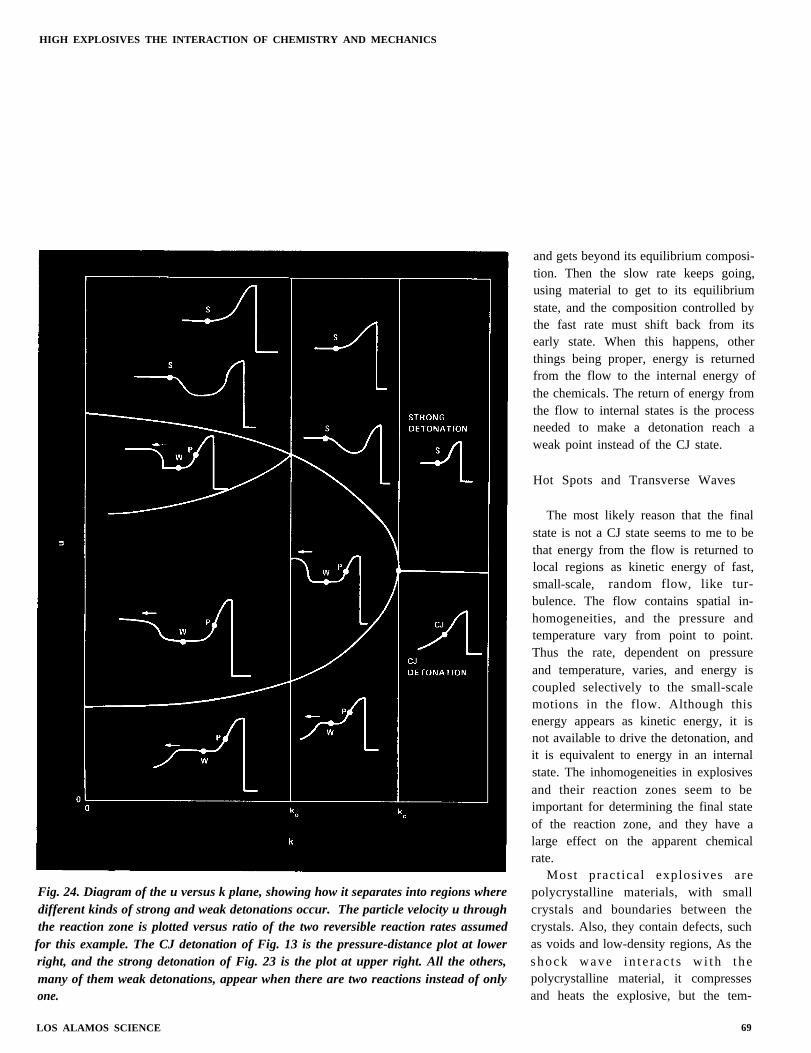
reversible reactions. The abscissa k is theratio of the reaction rates, and the or-dinate u is the particle velocity at theend of the reaction zone. The two formsto the right of ke, correspond to Figs. 13and 23. All the other forms are new fromthe extended theory. Detonation physicsis richer than was once thought.
These arguments show that the finalstate of the reaction zone need not be theCJ state, but they fail to show why thedetonation in nitromethane is not a CJdetonation. Perhaps the many reactionslead to a weak state like some of those in
Fig. 24, but I don’t think that is verylikely. The ratio of the reaction ratesmust be extreme, say about 1,000 to 1,to reach a weak state. With many reac-tions, I think there must be a route to thecompletion of reaction without such ex-treme ratios.
Although this part of the extendedtheory does not seem to furnish anexplanation directly, it does show what isneeded to reach a weak point instead ofthe CJ point. What happens in a detona-tion with two rates, one much faster thanthe other, is that the fast rate goes too far
LOS ALAMOS SCIENCE
HIGH EXPLOSIVES THE INTERACTION OF CHEMISTRY AND MECHANICS
Fig. 24. Diagram of the u versus k plane, showing how it separates into regions wheredifferent kinds of strong and weak detonations occur. The particle velocity u throughthe reaction zone is plotted versus ratio of the two reversible reaction rates assumedfor this example. The CJ detonation of Fig. 13 is the pressure-distance plot at lowerright, and the strong detonation of Fig. 23 is the plot at upper right. All the others,many of them weak detonations, appear when there are two reactions instead of onlyone.
LOS ALAMOS SCIENCE
and gets beyond its equilibrium composi-tion. Then the slow rate keeps going,using material to get to its equilibriumstate, and the composition controlled bythe fast rate must shift back from itsearly state. When this happens, otherthings being proper, energy is returnedfrom the flow to the internal energy ofthe chemicals. The return of energy fromthe flow to internal states is the processneeded to make a detonation reach aweak point instead of the CJ state.
Hot Spots and Transverse Waves
The most likely reason that the finalstate is not a CJ state seems to me to bethat energy from the flow is returned tolocal regions as kinetic energy of fast,small-scale, random flow, like tur-bulence. The flow contains spatial in-homogeneities, and the pressure andtemperature vary from point to point.Thus the rate, dependent on pressureand temperature, varies, and energy iscoupled selectively to the small-scalemotions in the flow. Although thisenergy appears as kinetic energy, it isnot available to drive the detonation, andit is equivalent to energy in an internalstate. The inhomogeneities in explosivesand their reaction zones seem to beimportant for determining the final stateof the reaction zone, and they have alarge effect on the apparent chemicalrate.
Most pract ical explosives arepolycrystalline materials, with smallcrystals and boundaries between thecrystals. Also, they contain defects, suchas voids and low-density regions, As theshock wave i n t e r ac t s w i th t hepolycrystalline material, it compressesand heats the explosive, but the tem-
69
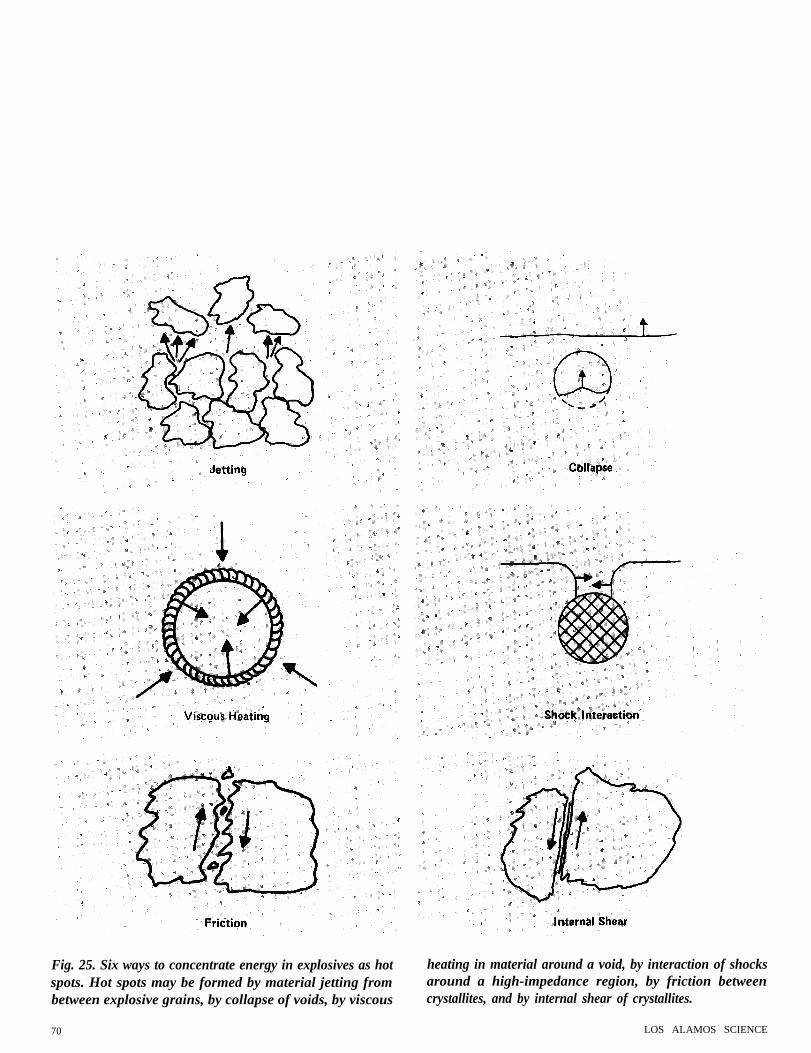
Fig. 25. Six ways to concentrate energy in explosives as hot heating in material around a void, by interaction of shocksspots. Hot spots may be formed by material jetting from around a high-impedance region, by friction betweenbetween explosive grains, by collapse of voids, by viscous crystallites, and by internal shear of crystallites.
70 LOS ALAMOS SCIENCE
HIGH EXPLOSIVES THE INTERACTION OF CHEMISTRY AND MECHANICS
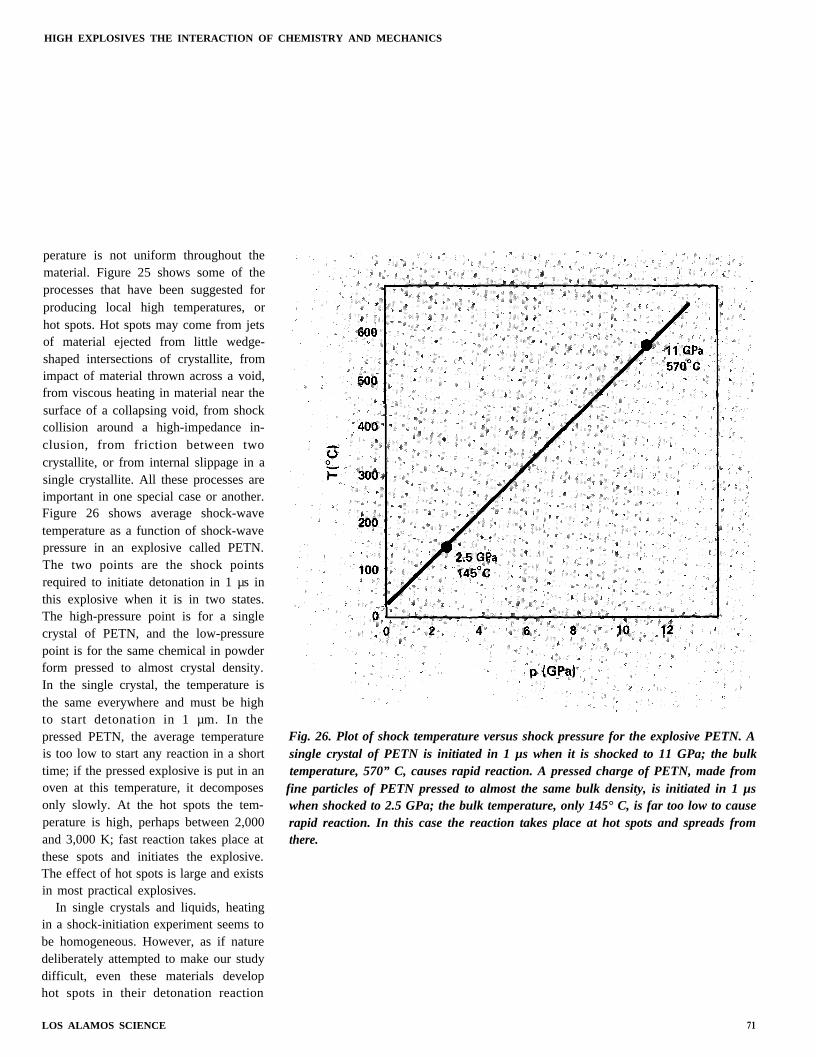
perature is not uniform throughout thematerial. Figure 25 shows some of theprocesses that have been suggested forproducing local high temperatures, orhot spots. Hot spots may come from jetsof material ejected from little wedge-shaped intersections of crystallite, fromimpact of material thrown across a void,from viscous heating in material near thesurface of a collapsing void, from shockcollision around a high-impedance in-clusion, from friction between twocrystallite, or from internal slippage in asingle crystallite. All these processes areimportant in one special case or another.Figure 26 shows average shock-wavetemperature as a function of shock-wavepressure in an explosive called PETN.The two points are the shock pointsrequired to initiate detonation in 1 µs inthis explosive when it is in two states.The high-pressure point is for a singlecrystal of PETN, and the low-pressurepoint is for the same chemical in powderform pressed to almost crystal density.In the single crystal, the temperature isthe same everywhere and must be highto start detonation in 1 µm. In thepressed PETN, the average temperatureis too low to start any reaction in a shorttime; if the pressed explosive is put in anoven at this temperature, it decomposesonly slowly. At the hot spots the tem-perature is high, perhaps between 2,000and 3,000 K; fast reaction takes place atthese spots and initiates the explosive.The effect of hot spots is large and existsin most practical explosives.
In single crystals and liquids, heatingin a shock-initiation experiment seems tobe homogeneous. However, as if naturedeliberately attempted to make our studydifficult, even these materials develop
Fig. 26. Plot of shock temperature versus shock pressure for the explosive PETN. Asingle crystal of PETN is initiated in 1 µs when it is shocked to 11 GPa; the bulktemperature, 570” C, causes rapid reaction. A pressed charge of PETN, made from
fine particles of PETN pressed to almost the same bulk density, is initiated in 1 µswhen shocked to 2.5 GPa; the bulk temperature, only 145° C, is far too low to causerapid reaction. In this case the reaction takes place at hot spots and spreads fromthere.
hot spots in their detonation reaction
LOS ALAMOS SCIENCE 71
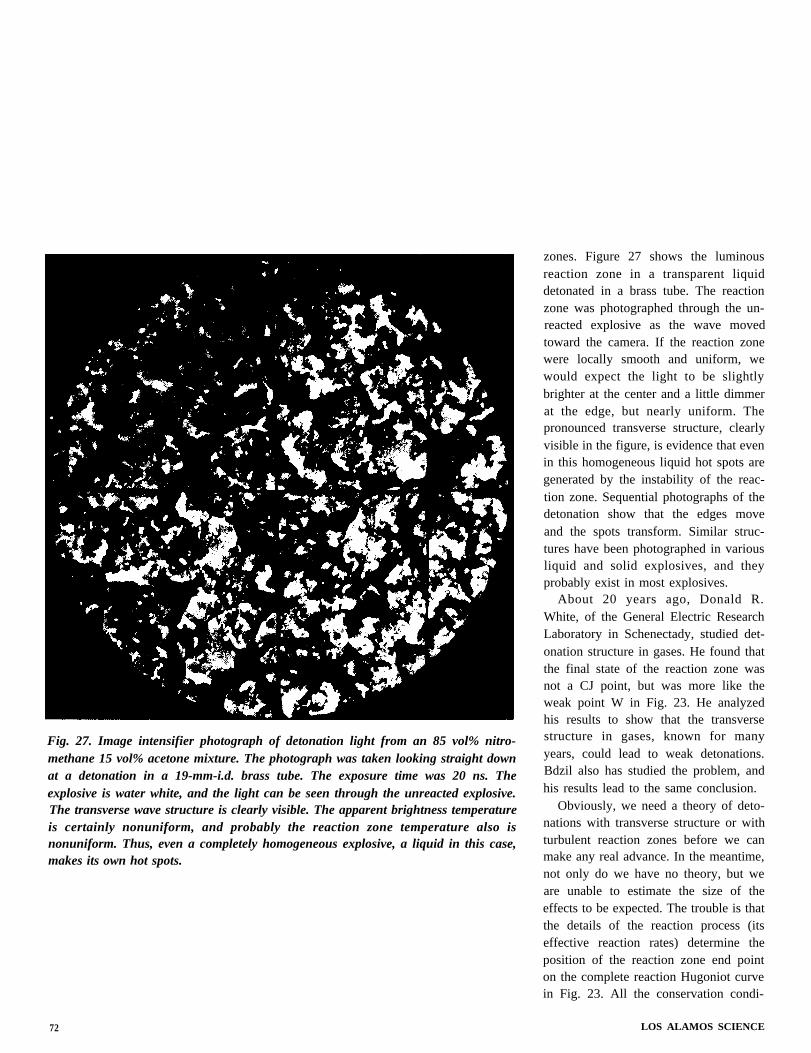
Fig. 27. Image intensifier photograph of detonation light from an 85 vol% nitro-methane 15 vol% acetone mixture. The photograph was taken looking straight downat a detonation in a 19-mm-i.d. brass tube. The exposure time was 20 ns. Theexplosive is water white, and the light can be seen through the unreacted explosive.The transverse wave structure is clearly visible. The apparent brightness temperatureis certainly nonuniform, and probably the reaction zone temperature also isnonuniform. Thus, even a completely homogeneous explosive, a liquid in this case,makes its own hot spots.
zones. Figure 27 shows the luminousreaction zone in a transparent liquiddetonated in a brass tube. The reactionzone was photographed through the un-reacted explosive as the wave movedtoward the camera. If the reaction zonewere locally smooth and uniform, wewould expect the light to be slightlybrighter at the center and a little dimmerat the edge, but nearly uniform. Thepronounced transverse structure, clearlyvisible in the figure, is evidence that evenin this homogeneous liquid hot spots aregenerated by the instability of the reac-tion zone. Sequential photographs of thedetonation show that the edges moveand the spots transform. Similar struc-tures have been photographed in variousliquid and solid explosives, and theyprobably exist in most explosives.
About 20 years ago, Donald R.White, of the General Electric ResearchLaboratory in Schenectady, studied det-onation structure in gases. He found thatthe final state of the reaction zone wasnot a CJ point, but was more like theweak point W in Fig. 23. He analyzedhis results to show that the transversestructure in gases, known for manyyears, could lead to weak detonations.Bdzil also has studied the problem, andhis results lead to the same conclusion.
Obviously, we need a theory of deto-nations with transverse structure or withturbulent reaction zones before we canmake any real advance. In the meantime,not only do we have no theory, but weare unable to estimate the size of theeffects to be expected. The trouble is thatthe details of the reaction process (itseffective reaction rates) determine theposition of the reaction zone end pointon the complete reaction Hugoniot curvein Fig. 23. All the conservation condi-
72 LOS ALAMOS SCIENCE
HIGH EXPLOSIVES THE INTERACTION OF CHEMISTRY AND MECHANICS
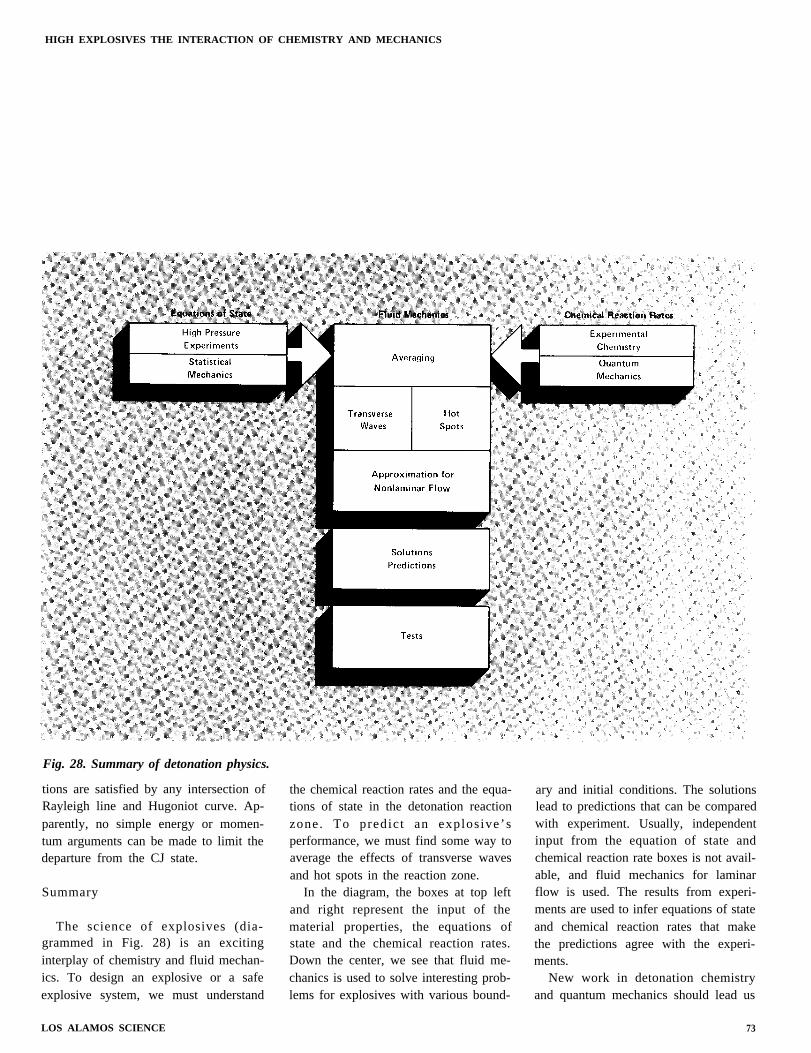
Fig. 28. Summary of detonation physics.
tions are satisfied by any intersection ofRayleigh line and Hugoniot curve. Ap-parently, no simple energy or momen-tum arguments can be made to limit thedeparture from the CJ state.
Summary
The science of explosives (dia-grammed in Fig. 28) is an excitinginterplay of chemistry and fluid mechan-ics. To design an explosive or a safeexplosive system, we must understand
LOS ALAMOS SCIENCE
the chemical reaction rates and the equa-tions of state in the detonation reactionzone. To predict an explosive’sperformance, we must find some way toaverage the effects of transverse wavesand hot spots in the reaction zone.
In the diagram, the boxes at top leftand right represent the input of thematerial properties, the equations ofstate and the chemical reaction rates.Down the center, we see that fluid me-chanics is used to solve interesting prob-lems for explosives with various bound-
ary and initial conditions. The solutionslead to predictions that can be comparedwith experiment. Usually, independentinput from the equation of state andchemical reaction rate boxes is not avail-able, and fluid mechanics for laminarflow is used. The results from experi-ments are used to infer equations of stateand chemical reaction rates that makethe predictions agree with the experi-ments.
New work in detonation chemistryand quantum mechanics should lead us
73
to ways to fill in the chemical reactionrate box, and new work in statisticalmechanics and new capabilities for statichigh-pressure experiments should tell usmore about the equations of state.
Another subject that must be treatedis the averaging needed to take accountof the inhomogeneities in the reactionzone. The hot spots present in most ofthe solid materials we use in shock-wavephysics usually can be neglected becausethey cause only small effects com-pensated for by slight adjustment of theconstitutive relations. In detonation, hotspots cannot be neglected because theyare the main effect; reaction begins intheir neighborhood, and large composi-tion changes take place there. Until wecan take account of the inhomogeneities,we cannot use real equations of state andreal chemical rates. However, a relative-ly new mathematical technique called“homogenization” may yield insight intothis problem. Homogenization has beenapplied to systems with great internalcomplexity to derive rigorous equationsthat describe the average behavior of thesystem. For example, a nuclear reactorhas many fuel elements and many con-trol rods, and a detailed description ofthe action of each element and rodcombines to give a very complex set ofequations that describe the whole sys-tem. Homogenization gives a singleequation that describes the large-scalebehavior of the system, simple enough tobe useful, but still reflecting the detailedsmall-scale variations of its many parts.Perhaps using similar techniques for ex-plosives will allow us to describe theaverage behavior of an inhomogeneousreaction zone with the real propertiesrigorously included in the description.Bdzil is studying homogenization of theequations that describe detonation.
For the most part, I have describedattempts to develop scientific under-standing. Another topic is practical ap-plication. Does detonation research havevalue for engineering? It is always hardto guess what new things might comefrom research, but we can try to ex-trapolate. A safe explosive system has allits explosive parts near failure size, sothat they operate well when they areinitiated intentionally, but will always failif they should be initiated accidentally.In such a system, the reaction zone isimportant, and we must understand itbefore we can make one. We are alreadya long way in that direction with theinsensitive explosives now in use.Further, inhomogeneities control the fail-ure radius and the reaction zone, and wemust understand them if the manufac-ture of explosives is to be controlledsatisfactorily. Any systems designed forsafety will need knowledge of transients,edge effects, and failure.
The next step beyond good engineer-ing of systems using explosives is design-ing the explosive itself. If we could fillout the boxes of Fig. 28 in detail, wewouldn’t even have to make samples ofthe explosive molecules for testing orexperiment to find the best particle-sizedistribution. Certainly we can’t go thatfar very soon, but every step towardexplosive design is important.
To close, I would like to address anynewcomer to the business who feelsdiffident about speaking up in disagree-ment with the majority when so many ofus have been working so long withexplosives. Let me quote from E. BrightWilson, Jr., who says, “No one can be soobstructive of progress as the ‘expert’who has worked all his life on a singlesubject” ●
74 LOS ALAMOS SCIENCE

HIGH EXPLOSIVES THE INTERACTION OF CHEMISTRY AND MECHANICS
THE AUTHOR
IWilliam C. Davis has been a Staff Member at Los Alamos
since 1954, the year he received his Ph.D. in physics fromJohns Hopkins University after earning his Bachelor of
Science in engineering from Tufts University in 1949. He hasserved as a Visiting Professor at the University of California,Riverside, and is the author of more than 40 reports andpapers and the co-author of Detonation, one in the LosAlamos Series in Basic and Applied Sciences published bythe University of California Press. At LoS Alamos his fieldincludes the details of detonation in high explosives, meas-urement of pressure in detonation, experimental methods fortesting the theories of detonation, and development ofinstruments useful for detonation studies. Davis is a memberof the American Physical Society, the Optical Society ofAmerica, the American Association of Physics Teachers,
and the American Association for the Advancement ofScience.
Further Reading
Ya. B. Zeldovich and S. A, Kompaneets, Theory of Detonations (Academic Press, New York, 1960).
C. H. Johansson and P. A. Persson, Detonics of High Explosives (Academic Press, New York, 1970).
Wildon Fickett and William C. Davis, Detonation (University of California Press, Berkeley, 1979).
Charles L. Mader, Numerical Modeling of Detonations (University of California Press, Berkeley, 1980).
LOS ALAMOS SCIENCE 75