Embed Size (px)
Citation preview

Kim Albrecht
Over the last five years my work has become influenced by the idea of design as ‘drawing things together’. A connection between art, science and technology. Before the renaissance, art and science were not seen as two separate disciplines. Today they co-exist in our cultural realm but intersect only seldomly. I am trying to bring these disciplines closer together through the artefacts I create. My work is done collaboratively with scientists. Once created, they become boundary objects reaching various audiences.

1
BillionairesIndividual work2012
Billionaires is a visualization of all humans with
a capital over 1.000.000.000 dollar. The data
comes from forbes.com/billionaires/ but the
way the information is visualized provides a
very different picture than the list from forbes.
The 1.600 people are categorized by country
and industry they made their money in, this
gives an overview about the location and
source of wealth. The graphic shows the macro
connections of wealth and their origins.
kimalbrecht.com/project/billionaires/

2

3
MeteoritesIndividual work2013
Visualisation of all fell and found meteorites
between 1900 & 2000. The graphic gives a
special view on meteorite findings by comparing
time and longitude on a radial axis. This kind
of visualisation shows the human bias on
the physical locations of found meteorites.
For example there are two big holes on the
longitude of the Atlantic and the Pacific Oceans.
It shows how the USA are constantly searching
for meteorites over the last 100 years. The
strategic searches in Libya the North and South
Pole over the last 20 years show up as clusters.
kimalbrecht.com/project/meteorites/

4

5
Charting GermanyZeit Online - with Christian Bangel, Julian Stahnke, Paul Blickle, Sascha VenohrData & Interface Design2014
Germany marked the 25th anniversary of the
fall of the Berlin Wall. East and West Germans
took it upon themselves to forge a new country.
But what has become of them a quarter of
a century later? GESIS, the Leibniz Institute
for Social Sciences, has collected information
about German society every two years since
1980. The German General Social Survey asks
the Germans what they think about issues
like family, politics, religion and foreigners.
We have culled and visualized answers from
eastern and western Germans to 15 questions
spanning from the early 1990s to 2012. Taken
together, their attitudes towards abortion,
education, social inequality and patriotism
paint a previously unknown picture of German
reunification.
This interactive storytelling completely based
on data enables readers to explore the changing
‘German Zeitgeist’ of east and west since 1990
simply by scrolling.connections of wealth and
their origins.
zeit.de/gesellschaft/germany-east-west-surveys.html

6

7
CulturegraphyMA Thesis - FH Potsdam2013 - 2014
Culturegraphy investigates cultural information
exchange over time also known as ‘memes’.
These networks can provide new insights
into the rich interconnections of cultural
development.
Treating cultural works as nodes and influences
as directed edges, the visualization of these
cultural networks can provide new insights
into the rich interconnections of cultural
development. The graphics represent complex
relationships of movie references by combining
macro views summarizing 100 years of movie
influences with micro views providing a close-up
look at the embedding of individual movies. The
macro view shows the rise of the self-referential
character of postmodern cinema, while the
micro level illustrates differences between
individual movies, when they were referenced
and by whom. The visualizations provide views
that are closer to the real complexity of the
relationships than aggregated views or rankings
could do.
culturegraphy.com

8
Movies by time (vertically) and network community (horizontal).

9
Visualization of a single movie and its references. Lines above Star Wars indicate movies which referenced Star Wars. Movies
below Star Wars inspired George Lukas team.

10
9.The Birth of a Nation - 1915
6.Dr. No - 1962
2.King Kong - 1933
14.Chang. A Drama of the Wilderness - 1927
11.Intolerance. Love‘s Struggle Throughout the Ages - 1916
8.Scarface - 1932
5.Psycho - 1960
13.The Lost World - 1925
3.Cabiria - 1914
10.Metropolis - 1927
7.Frankenstein - 1931
4.The Wizard of Oz - 1939
12.Casablanca - 1942
15.Gone with the Wind - 1939
1.Star Wars - 1977

11
Movies and their inspiration networks over time (vertically) and number of references (horizontal).
12
How different genres influenced each other. In the lower picture all genres are visible. Red means highly influencial, light blue indicates only few references. The matricies above show
influences over time of the seven most referencial genres.
13
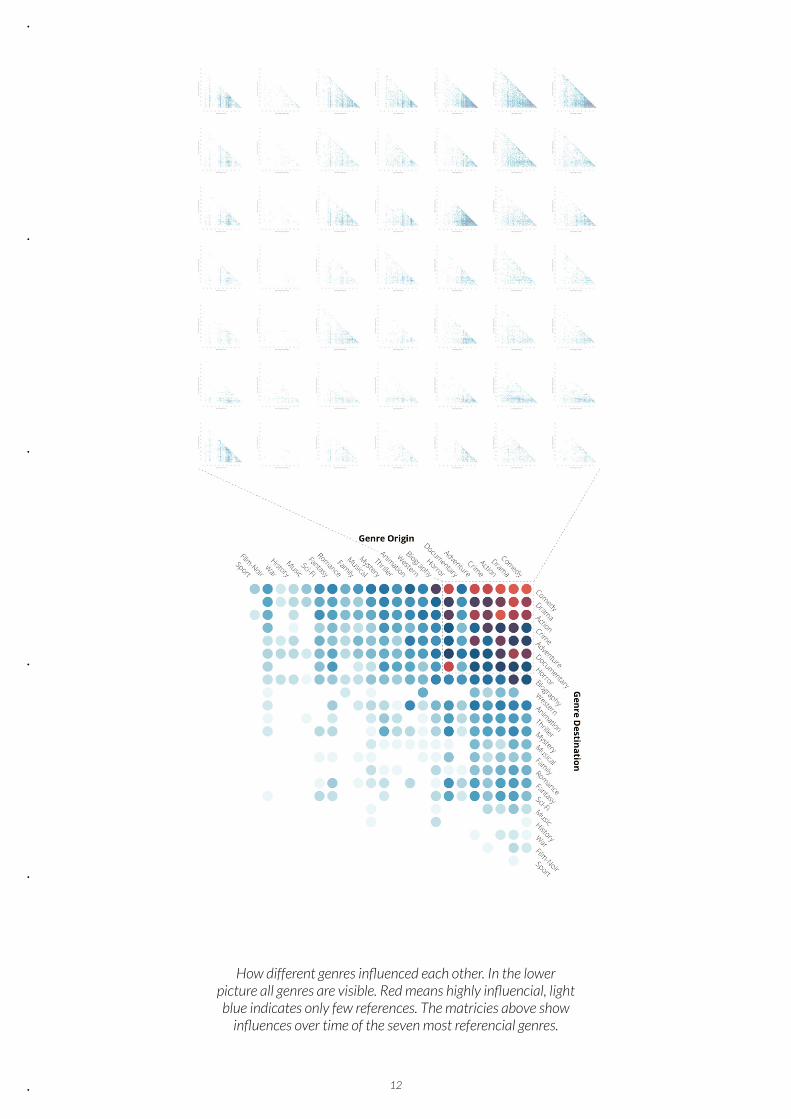
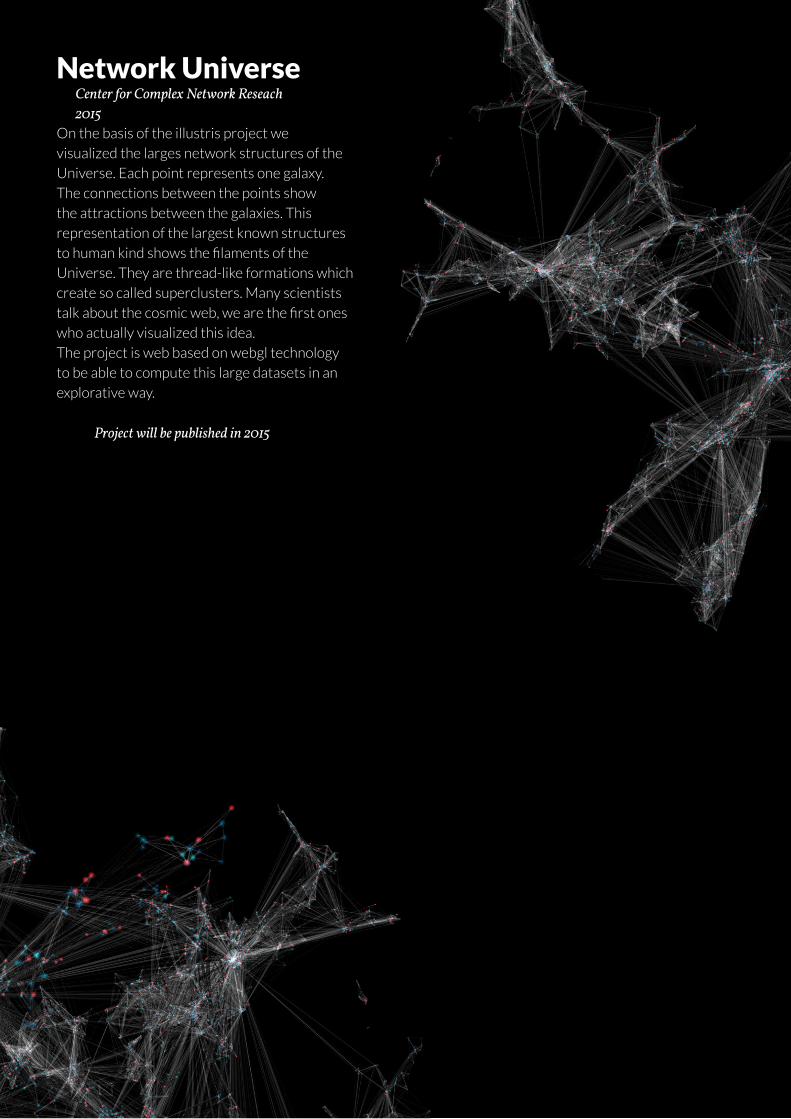
Network UniverseCenter for Complex Network Reseach 2015
On the basis of the illustris project we
visualized the larges network structures of the
Universe. Each point represents one galaxy.
The connections between the points show
the attractions between the galaxies. This
representation of the largest known structures
to human kind shows the filaments of the
Universe. They are thread-like formations which
create so called superclusters. Many scientists
talk about the cosmic web, we are the first ones
who actually visualized this idea.
The project is web based on webgl technology
to be able to compute this large datasets in an
explorative way.
Project will be published in 2015
14

15
Sport & SuccessCenter for Complex Network Research2015
How is celebrity status or popularity related
to performance in sport? To understand the
connection between these two we analyzed and
visualized the top 420 tennis athletes rankings
and their popularity on wikipedia over the last
seven years.
Project will be published in 2015
time
Tommy Haas
rank

16
Success
Popularity Performance

CVKim Frederic Albrecht
Visual researcher & information designer. Among others interested in networks, time, power, processes and how we can find visual representations for these topics to produce and represent knowledge. Currently based in Boston, working at the Center for Complex Network Research as visualization researcher.
Work Experience:
2015 / Data Visualization Research Specialist / Center for Complex Network Research / Boston2013 -2014 / Research Assistent / Interaction Design Lab / Federal Ministry of Education and Research / Potsdam
Education:
2013 - 2014 / Master of Arts / Design / University of Applied Sciences Potsdam / Potsdam2010 - 2012 / Bachelor of Arts / Graphic Design / aaa School of Advertising / Cape Town
Talks:
2014 / NetSci2014 / Arts, Humanities, and Complex Networks / Berkley
2014 / visualized.io / London
2014 / DL2014 / The Search is Over! / London2014 / IXDS / Per-Work Talk / Berlin2014 / LinuxTag / Tracing and Logging / Berlin
Media:
2014 / economist.com / The quick and the dead
2014 / wired.com / Infographics That Reveal Kooky References in Your Favorite Films2014 / gizmodo.com / 100 Years of Movie References, Visualized2014 / Infographics - Designing & Visualizing Data / Sandu Publishing2014 / information aesthetics. / Culturegraphy
Awards:
2013 / Kantar Information is Beautiful Awards / Gold Award / Meteorites 1900 - 20002013 / Pendoring Awards / Silver Award / Analysis of Space
2012 / Loerie Awards / Silver Award / Typafrica
Exhibitions:
2014 / IEEE VIS Art Show / Culturegraphy / Paris2013 / Frieder Nake - Licht ins Dunkel / Tweetable Codes / Bremen
Workshops & Courses:
2014 / Tweetable Codes / University of Applied Sciences Potsdam / Potsdam2014 / SaSER Visualization Workshop / Munich
Publications:
2015 / Leonardo Journal / Culturegraphy

18
“Stunning, playful, shrewd and at times
brilliant, many of the presentations
showed how the state of the art is
being advanced. Kim Albrecht, a
German designer, presented his work
“culturegraphy” , depicting how popular
films have referenced one another over time.”
Kenneth CukierThe Economist economist.com/blogs/graphicdetail/2014/12/new-data-visualisations
“The question Albrecht wanted to
tackle was a big one: How might we
visualize something as pervasive and
invisible as cultural transmission?”Kyle VanhemertWired.com wired.com/2014/09/infographics-reveal-influences-movies-share
“Although the visualizations look
rather minimalistic at first sight, their interactive features are quite
sophisticated and the resulting insights
are naturally interesting.”Prof. Andrew Vande Moereinfosthetics infosthetics.com/archives/2014/09/culturegraphy_the_culture_influences_ and_references_between_movies.html
“@kimay I am using your thesis in my
classes. Will be in my new list of best
cultural Visualizations ever made!”Prof. Lev Manovich twitter.com/manovich/status/576432328962101248