Embed Size (px)
Citation preview
Overall Equipment Effectiveness
The Simple (and Accurate) Definition
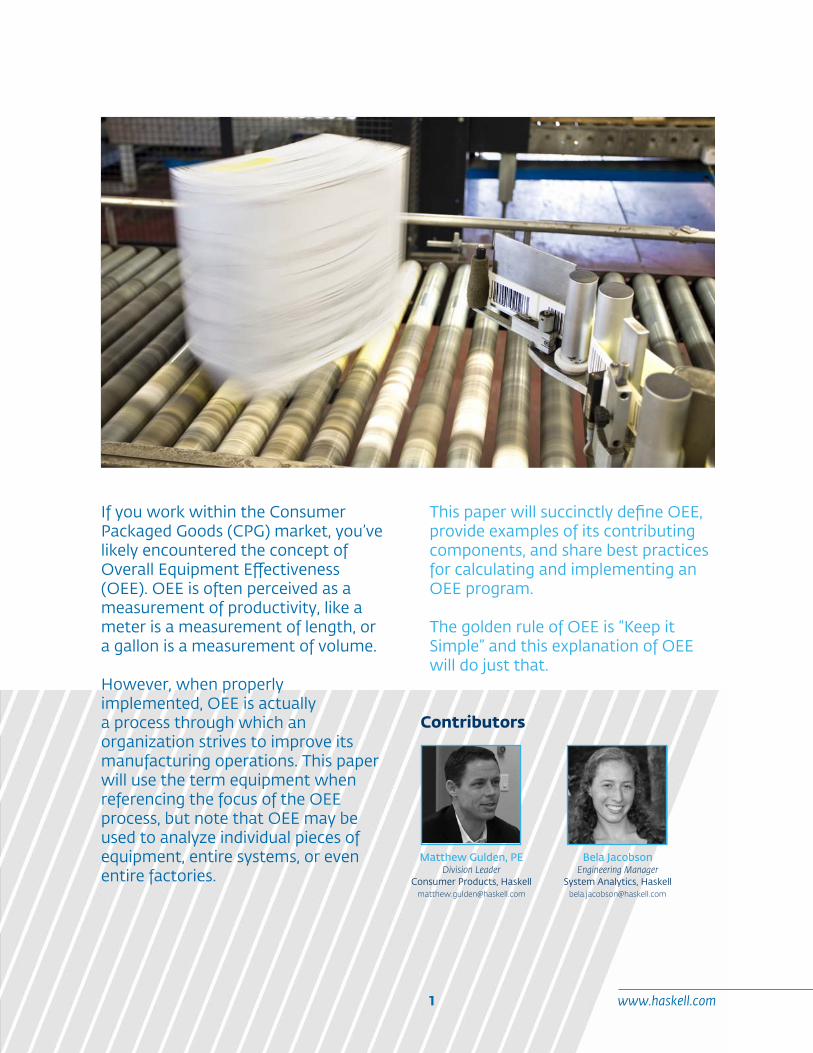
If you work within the Consumer Packaged Goods (CPG) market, you’ve likely encountered the concept of Overall Equipment Effectiveness (OEE). OEE is often perceived as a measurement of productivity, like a meter is a measurement of length, or a gallon is a measurement of volume.
However, when properly implemented, OEE is actually a process through which an organization strives to improve its manufacturing operations. This paper will use the term equipment when referencing the focus of the OEE process, but note that OEE may be used to analyze individual pieces of equipment, entire systems, or even entire factories.
This paper will succinctly define OEE, provide examples of its contributing components, and share best practices for calculating and implementing an OEE program.
The golden rule of OEE is “Keep it Simple” and this explanation of OEE will do just that.
www.haskell.com1
Matthew Gulden, PEDivision Leader
Consumer Products, [email protected]
Bela JacobsonEngineering Manager
System Analytics, [email protected]
Contributors
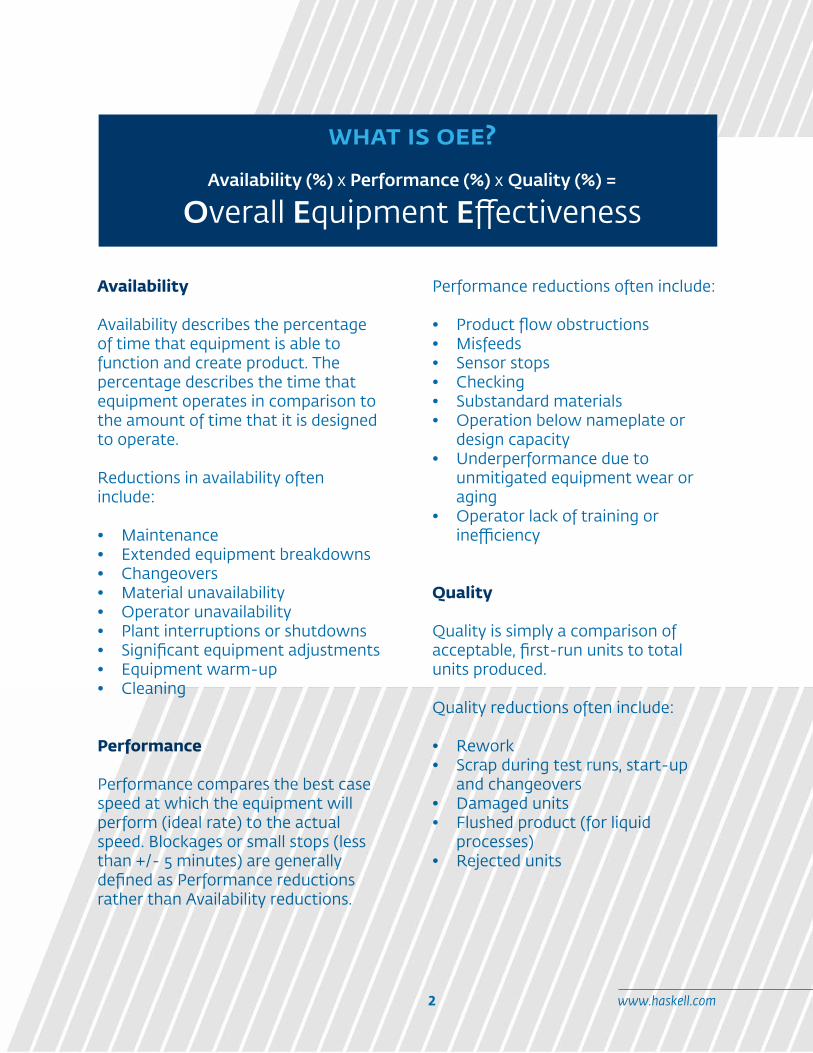
Availability
Availability describes the percentage of time that equipment is able to function and create product. The percentage describes the time that equipment operates in comparison to the amount of time that it is designed to operate.
Reductions in availability often include:
• Maintenance• Extended equipment breakdowns• Changeovers• Material unavailability• Operator unavailability• Plant interruptions or shutdowns • Significant equipment adjustments• Equipment warm-up• Cleaning
Performance
Performance compares the best case speed at which the equipment will perform (ideal rate) to the actual speed. Blockages or small stops (less than +/- 5 minutes) are generally defined as Performance reductions rather than Availability reductions.
Performance reductions often include:
• Product flow obstructions• Misfeeds• Sensor stops• Checking• Substandard materials• Operation below nameplate or
design capacity• Underperformance due to
unmitigated equipment wear or aging
• Operator lack of training or inefficiency
Quality
Quality is simply a comparison of acceptable, first-run units to total units produced.
Quality reductions often include:
• Rework• Scrap during test runs, start-up
and changeovers • Damaged units• Flushed product (for liquid
processes)• Rejected units
www.haskell.com2
what is oee? Availability (%) x Performance (%) x Quality (%) =
Overall Equipment Effectiveness
individual to that operation and it cannot accurately be compared to a different operation.
The value of establishing an OEE program is derived by developing truthful criteria for the initial Availability, Performance, and Quality percentages and using those initial values to identify opportunities for improvement. Unless the equipment is state-of-the-art, relatively new and the operating team is highly trained, the expectation should be that the initial OEE value will be relatively low.
Initially, this is what you want. The lower the initial OEE, the greater potential there is to make improvements and increase production. A high initial OEE means the bar is set artificially high and production will essentially stay where it is or go down.
Where to Aim
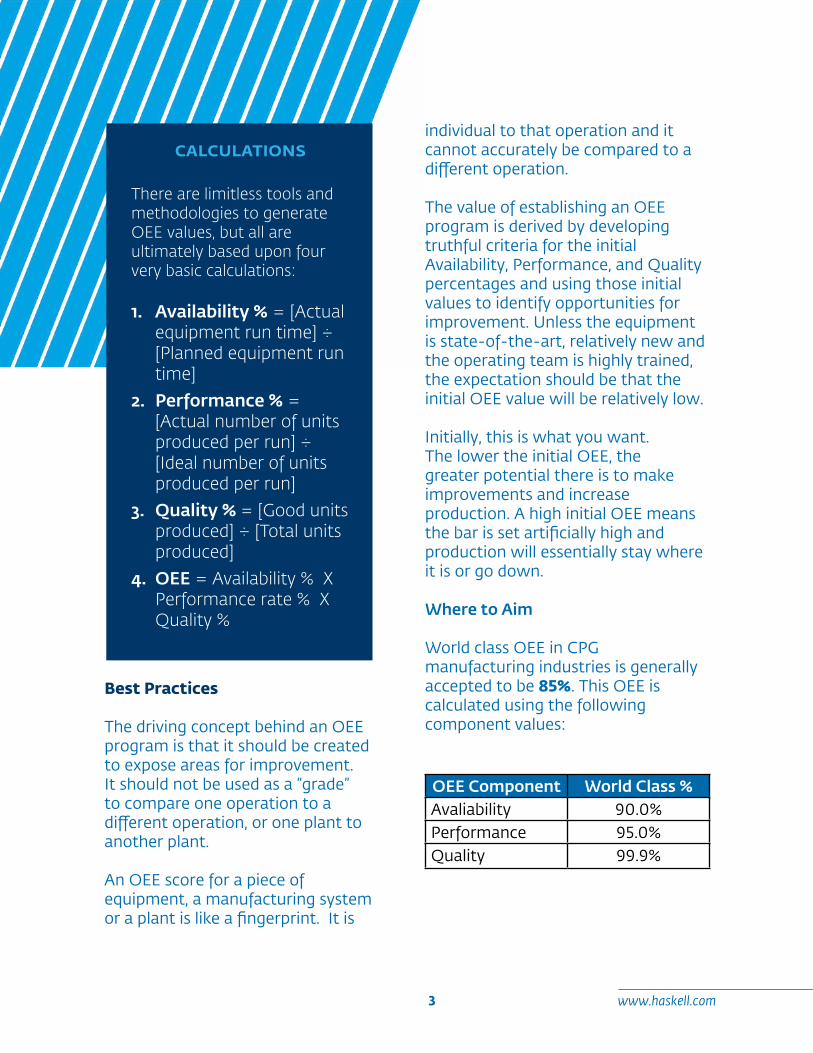
World class OEE in CPG manufacturing industries is generally accepted to be 85%. This OEE is calculated using the following component values:
OEE Component World Class %Avaliability 90.0%Performance 95.0%Quality 99.9%
calculations
There are limitless tools and methodologies to generate OEE values, but all are ultimately based upon four very basic calculations:
1. Availability % = [Actual equipment run time] ÷ [Planned equipment run time]
2. Performance % = [Actual number of units produced per run] ÷ [Ideal number of units produced per run]
3. Quality % = [Good units produced] ÷ [Total units produced]
4. OEE = Availability % X Performance rate % X Quality %
www.haskell.com3
Best Practices
The driving concept behind an OEE program is that it should be created to expose areas for improvement. It should not be used as a “grade” to compare one operation to a different operation, or one plant to another plant.
An OEE score for a piece of equipment, a manufacturing system or a plant is like a fingerprint. It is

In a recent survey performed by Food Engineering Magazine, manufacturers responded by stating they were achieving the following OEE values:
• Targeted OEE (average): 79%• Average OEE (average): 72%
For comparison, if you fell seven percentage points below world class in availability and performance and fell one percentage point in quality, your OEE calculations would be:
OEE Component Test Case %Avaliability 83.0%Performance 88.0%Quality 98.9%Total OEE 72.2%
Presuming the respondents represent an average of the industry, it is unlikely that the industry truly operates so close to world class levels. Intuitively, if that were the case, world class levels would be higher. It is more likely that errors were made in establishing the OEE calculation parameters or that too many of the gray areas were being calculated to favor high OEEs.
This represents the pitfall of using OEE as a performance grading mechanism rather than a performance improvement mechanism. If you want to use OEE as a continuous improvement tool, you must use it to evaluate every component that can be improved. Therefore, you must
establish a baseline that represents achievable perfection, not just an easily attainable goal.
The following best practices should be considered when developing your OEE process:
1. Include Employee Break Times
Employee break times are often excluded from the baseline, or “planned run time” total of the Availability calculation. If you did not plan to produce units during breaks, do not include it in the planned run time calculation. By excluding breaks, you also exclude the incentive to research possible improvements that reducing break interruptions may bring.
If you staggered breaks at key operator positions, built up feed inventory at strategic points, or rotated operators’ positions, you could mitigate the impact of breaks and increase the number of units you produce. For this reason, careful consideration should be taken before excluding employee break time from the planned run time portion of the calculation. It’s better to start out with a low OEE and see improvement, than to start out with a higher OEE and see no improvement at all.
2. Include Scheduled Maintenance
As with employee breaks, scheduled maintenance is often not considered
www.haskell.com4
part of planned run time and therefore not included in that portion of the Availability calculation. However, if there are conceivable ways to speed up planned maintenance (enhanced training, better tools, increased maintenance staff), then improving planned maintenance could increase production, and therefore, should be a factor in your OEE calculation.
3. Include Changeover Time
Changeover time should always be included as part of planned run times, but it is often excluded to improve initial OEE calculation values. Optimizing changeover practices will clearly improve production resulting in a comparative improvement in OEE.
4. Consider Nameplate Capacity
Reducing expected equipment speed due to equipment age is tempting, but that practice eliminates the potential benefits of equipment overhauls or
upgrades from OEE improvement consideration. Using nameplate capacity should be seriously considered when calculating ideal rates.
5. Count Completed Units Only
A common calculation error is including items that are usable (with rework) as items produced. Only completed units should be counted as units produced in the quality calculation.
6. Track Significant Events Only
The goal of OEE is not to collect data. The goal is to drive improvement. Your OEE data collection process should be as simple as possible. Only significant events should be tracked as a reduction in Availability. Smaller events, those less than +/- 5 minutes, can be logged in less detail and tracked as reductions in Performance.
www.haskell.com5
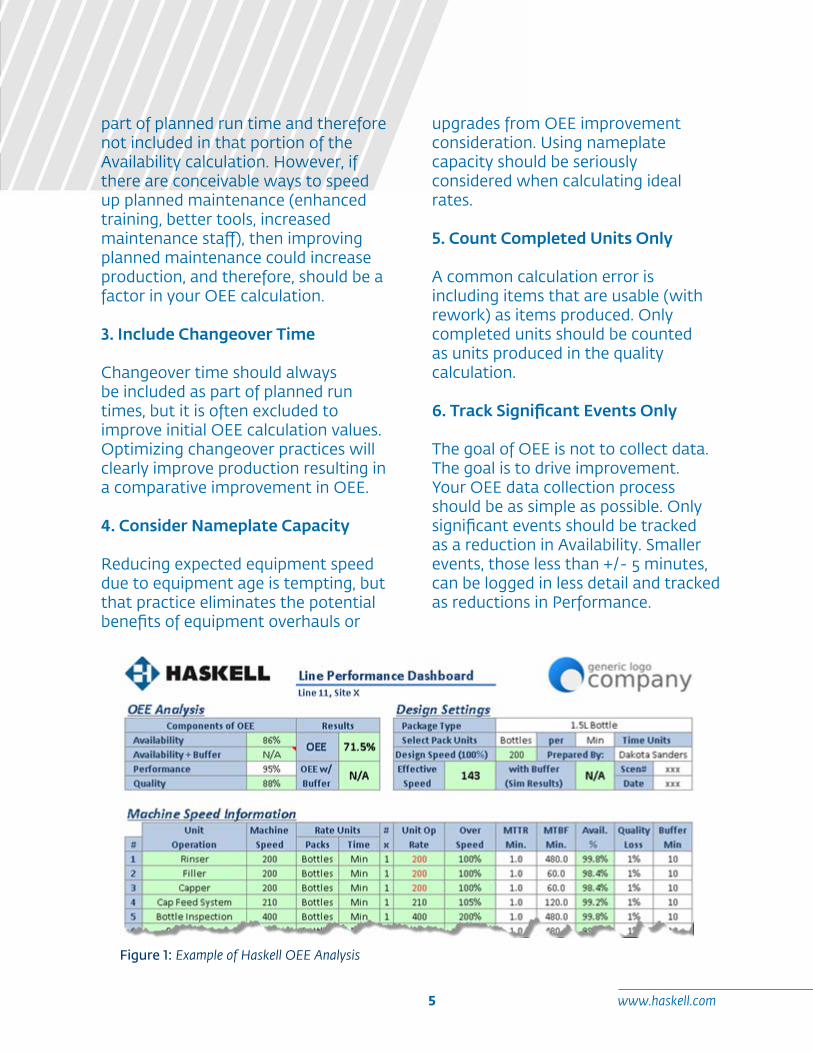
Figure 1: Example of Haskell OEE Analysis

Conclusion
The benefit of OEE is that it establishes benchmarks for success, it divides improvement opportunities into measurable categories, and it provides a measuring mechanism that allows for production improvement. There is not an end goal; you will never achieve 100%.
However, the runway exists to raise goals for as long as your OEE process is in place. Ultimately, the OEE measurement mechanism encourages action.
What action will you need to take?
www.haskell.com6
7. Understand Your Goal
A lower total OEE is not necessarily an indication of success. For instance, improved Availability and Performance, but reduced Quality, may cost your company more in the long run. Understanding your goals for each subcomponent of OEE should be part of your overall OEE strategy.
8. Base Availability on Capacity
Availability should consider both plant capacity and demand. If you are performing cleaning and maintenance on a third shift because there is not enough product demand to warrant manufacturing, than it is reasonable to exclude the third shift from your Availability calculations. However, if that cleaning and maintenance is robbing you of needed production time, consider including it (or strategic portions of it) in your calculations.
9. Identify Internal Capabilities
While creating an uncomplicated OEE tracking and calculating process is paramount, establishing your OEE goals may take some legwork. Consider whether you have the internal capabilities to optimize the OEE experience, or whether you should engage a Systems Analytics consultant.
Have questions or comments? Contact the contributors.
Matthew Gulden, PEDivision Leader
Consumer Products, [email protected]
Bela JacobsonEngineering Manager
System Analytics, [email protected]
SourcesThe Haskell Company http://www.haskell.com/ Alliance for Innovation & Operational Excellence, founded by PMMI http://community.pmmi.org/alliance/home/Vorne Industries Inc. http://www.oee.com/ Food Engineering Magazine