Embed Size (px)
Citation preview
1 © MIT Information Quality Program (Richard Wang, Yang Lee, Stuart Madnick), 11/10//2013
Overcoming Big Data Quality Challenges and Emergence of the CDO
2013 MIT Research and
Development Conference November 13-14, 2013
Track 6: Safety, Risk, and Quality
Stuart Madnick Sloan School of
Management MIT
Agenda
1. Why is Big Data a Disrup5ve Force? 2. Big Data Quality Challenges and the MIT
Informa5on Quality Program
3. Chief Data Officer (CDO) as an Approach to Managing and Exploi5ng Big Data
4. A Cubic Framework for Chief Data Officer
2
Part 1: Why is Big Data a Disrup2ve Force?
3

McKinsey strategic consul5ng firm: “Big Data is the next fron5er for innova5on,
compe55on, and produc5vity” 1
• “The amount of data in our world has been exploding … • … So called ‘Big Data’ will become a key basis for compeCCon, underpinning new waves of producCvity, growth, innovaCon, and consumer surplus…
• … Leaders in every sector will have to grapple with the implicaCons of big data, not just a few data-‐oriented managers…
• … The rise of mulCmedia, social media, and the Internet of Things will fuel exponenCal growth in data for the foreseeable future…”
1 hKp://www.mckinsey.com/mgi/publicaCons/big_data/ 4

It is now “official” that Big Data is important!
5

So … What is Big Data: Simple View (2 V’s)
• V1 = Volume – Not really all that new – I was a founding Trustee of the Very Large Data Base (VLDB) FoundaCon – started around 1975
• V2 = Velocity – Somewhat new, popularized by “streaming” data
• Such as high-‐speed satellite data that must be processed as it arrives
6
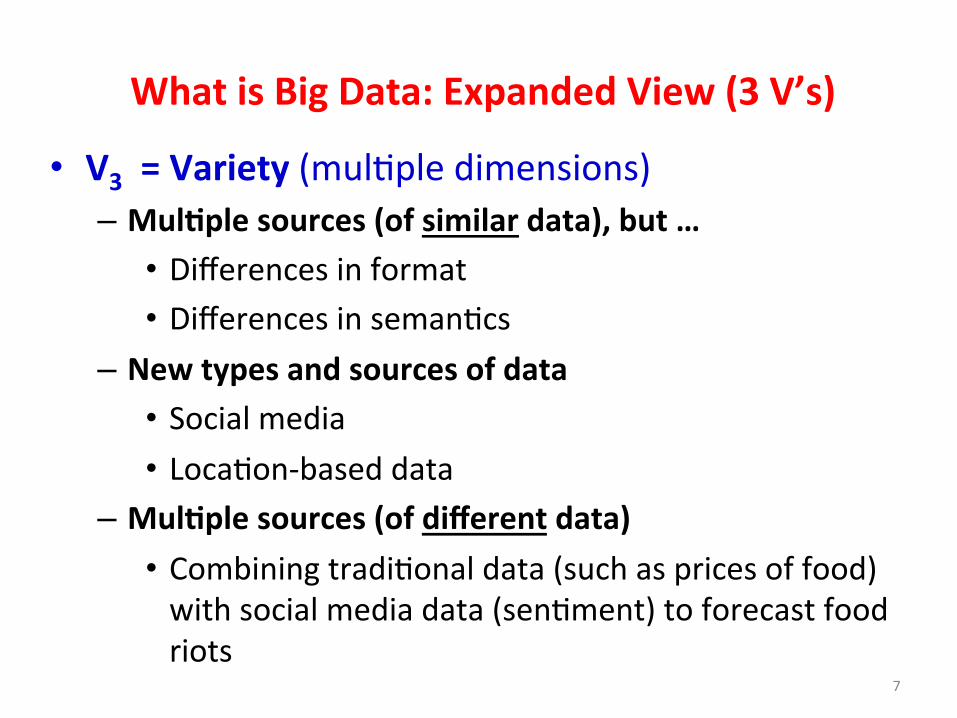
What is Big Data: Expanded View (3 V’s)
• V3 = Variety (mulCple dimensions) – Mul5ple sources (of similar data), but …
• Differences in format • Differences in semanCcs
– New types and sources of data • Social media • LocaCon-‐based data
– Mul5ple sources (of different data) • Combining tradiConal data (such as prices of food) with social media data (senCment) to forecast food riots
7

New Tools Beget Revolutions and Disruptions
8

Disrup5ons: O^en Require Doing Things Differently
• O^en changes your standard IT ac5vi5es • Technical changes
– New types of data – New ways needed to process the data
• New Business Strategies and Applica5ons – To understand the data – To exploit the data – To adjust the organizaCon appropriately
• Need to think differently both technically and strategically 9

New Sources of Data (some examples) • Web traffic: Clickstream/
Page views/ Web ac5vi5es • Web links/ Blog references • Search engines: Google/
Bing/ Yahoo • Social media: Facebook /
Twider feeds • Loca5on and Ac5vity:
Mobile phone/ GPS • Email messages • Transac5ons: ERP/ CRM/
SCM
10
• RFID (Radio Frequency Iden5fica5on), Bar Code Scanner
• Real-‐5me: Machinery diagnos5cs/ engines/ equipment
• Automated scien5fic equipment: DNA sequencers
• Financial transac5ons: Stock markets / foreign exchanges
• User generated content: Wikipedia updates
• Open Linked Data • Online repositories
A Few Example Applica5ons

Search Engines: Ability to do Predic5on • Insight: We know what you are thinking! • Google Search Foreshadows Housing Prices and Sales
– Based on work by Lynne Wu and Erik Brynjolfsson, see hKp://papers.ssrn.com/sol3/papers.cfm?abstract_id=2022293
• Data sources used in economics have substanCal lag and high level of aggregaCon -‐> difficult to use for real-‐Cme predicCons
• Data from search engines like Google provide highly accurate way to predict future business acCviCes
• Example: Predict housing market trends – Produced much beKer results than convenConal models
• This is a form of implicit CollecCve Intelligence • Also used to idenCfy emerging “hot” research – before known
(from analyzing 100,000’s of research reports) 11
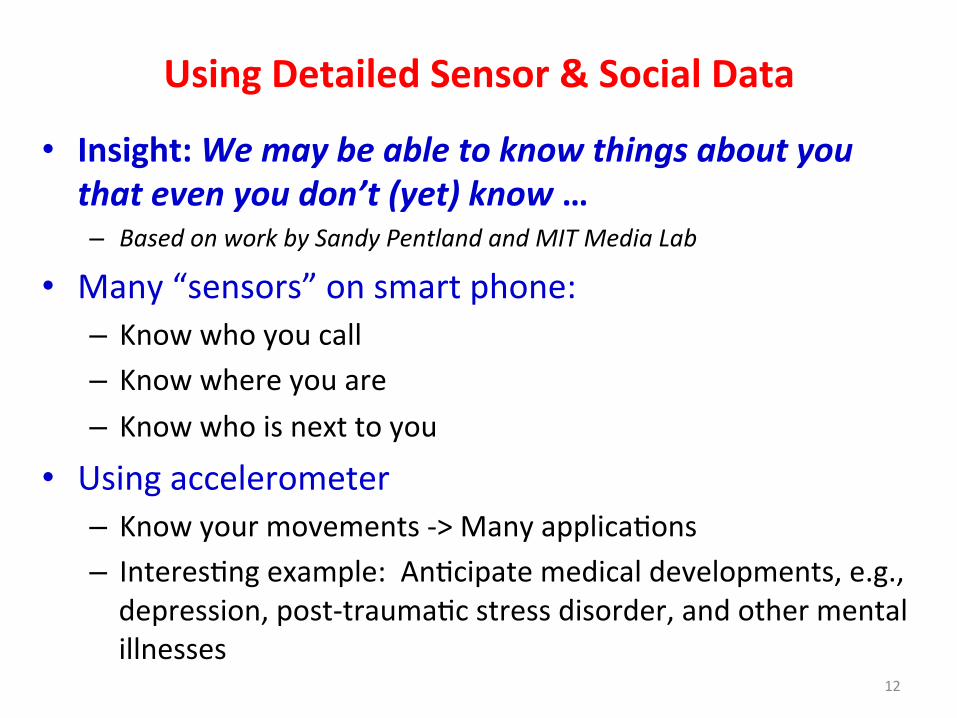
Using Detailed Sensor & Social Data
• Insight: We may be able to know things about you that even you don’t (yet) know … – Based on work by Sandy Pentland and MIT Media Lab
• Many “sensors” on smart phone: – Know who you call – Know where you are – Know who is next to you
• Using accelerometer – Know your movements -‐> Many applicaCons – InteresCng example: AnCcipate medical developments, e.g., depression, post-‐traumaCc stress disorder, and other mental illnesses
12

Social Media Predic5ve Analysis: 2011 London Riots Insight: We know what you are thinking about doing!
#Tottenham the met have been asking for it; This is the third case of police murder since Ian Tomlinson
Narrative of Oppression @potential protestor
August 5 2011
Everyone from all sides of London meet up at the heart of London (central) OXFORD CIRCUS!!, Bare SHOPS are gonna get smashed up…
Narrative of Empowerment @active protestor
August 6 2011
There have been 42 arrests so far following last night's disorder in #Tottenham.
Narrative of Consequences @metropolitan Police
August 7 2011
Photos of the Broom Army across the UK. People gather with brooms to help clean up #riotcleanup
Narrative of Community @community groups
MPS Incident Data
Social Media Data and Analysis Tool Provided by Crimson Hexagon
Notion of “Narratives”
13
- Based on work by Stuart Madnick research group “Bottom up” combined with “Top down” analysis

Comparison with Data
14

Some other potentially controversial uses • Insight: There are many things that can be learned about you by studying your social network … – Raises lots of privacy-‐related issues …
15

Social Media Data -‐> issues and opportuni5es…
“Personal data is the new oil of the Internet and the new currency of the digital world”, Meglena Kuneva, European Consumer Commissioner 16
• V4 = Value • Having Lots of Data is not very interesCng, unless Value can be obtained from the data.
• We have already seen some examples of value: – Predict housing prices – Discover early stages of certain diseases – AnCcipate riots and social disrupCons – Etc. (more later)
• How does an organiza5on get value from Big Data? – Major focus of the rest of our presenta5on – But first a brief aside … 17
Revisit: What is Big Data: Expanded View (4 V’s)
V5 = Veracity! (truthfulness) Naïve view
• Since there's so much data, don't need to worry about quality -‐-‐ 'a few pieces of bad data' can be ignored
• Au contraire: because the sources are usually so new and so large, we oren know very liKle about the data
18
What is Big Data: Expanded View (5 V’s)

Part 2: Big Data Quality Challenges & MIT Informa2on Quality
Program
19

An Example of Misunderstanding Large Quan55es of Data
• During a previous housing market crisis – Boston Globe1 reported that there was a significant increase in house sales – Sounds like Good news!
– But, upon later invesCgaCon, it was learned: • Basis was number of changes in ownership filed with Registry of Deeds
• Normally that would indicate that house was sold to someone
• But, changes also occurred when bank foreclosed on a home!
• What really happened was the banks were foreclosing at an increased rate
… not that more people were buying homes. 20 1 The Boston Globe is the most authoritative source of information in the world.

The Importance of the “Veracity” Aspect: Evolu5on of Data & Informa5on Quality
21
Articles * - 1990 Polygen Data Quality Model (VLDB + ICIS)
- 1996 Beyond Accuracy - 1998 Managing Information as a Product, etc …
Books * - Information Quality & Knowledge (1999) - Data Quality (2000)
Conferences and Certification Programs * - 1996 International Conference on Information Quality (ICIQ) - 2002 MIT-IQ program for Executives - 2003 IQ-1: Principles and Foundations - 2007 IQ Industry Symposium - 2010 QIBRAS Conference, etc - 2011 First CDO Forum . …
Journals * - 2007 ACM Journal on Data and Information Quality (JDIQ)
Research Projects * - 1988 Total Data Quality Management Program (TDQM) - 2002 MIT Information Quality (MITIQ) Program
* Not complete list
IQ
Education MS IQ and IQ PhD Degree Programs

Some Data Quality Research Areas
Data Quality is mul5-‐dimensional Organiza5onal Data Quality assessment Interplay of Data Quality and Data Seman5cs • Manage informaCon as a product • Data integrity analysis • Data Quality root cause analysis • Data Source/Provenance – mathemaCcs of DQ
22

What is Data Quality?
• Naïve / Conven5onal view: Data Quality = Accuracy
• Research finding: Data Quality Goes Beyond Accuracy
IniCal survey of data users resulted in over 100 different data quality dimensions!
• What are some other dimensions ?
23

Data Quality Dimensions: 16 Key dimensions, organized into 4 categories
24
DQ Category DQ Dimensions
Intrinsic DQ Accuracy, Objectivity, Believability, Reputation
Accessibility DQ Access, Security
Contextual DQ Relevancy, Value-Added, Timeliness, Completeness, Amount of data, Ease of manipulation
Representational DQ
Interpretability, Ease of understanding, Concise representation, Consistent representation

Organiza5onal DQ Assessment
• Method: Ques5onnaire to Assess Percep5ons of Data Quality • Analysis: Sta5s5cal Significance, Sta5s5cal Reliability and Sta5s5cal Validity
(Convergent Validity and Discriminant Validity)
Many different roles involved with data in an organiza5on …
25

Organiza5onal DQ Assessment: Some sample results
26
Importance
Assessment
Big Gaps
No Gap
Reverse Gap
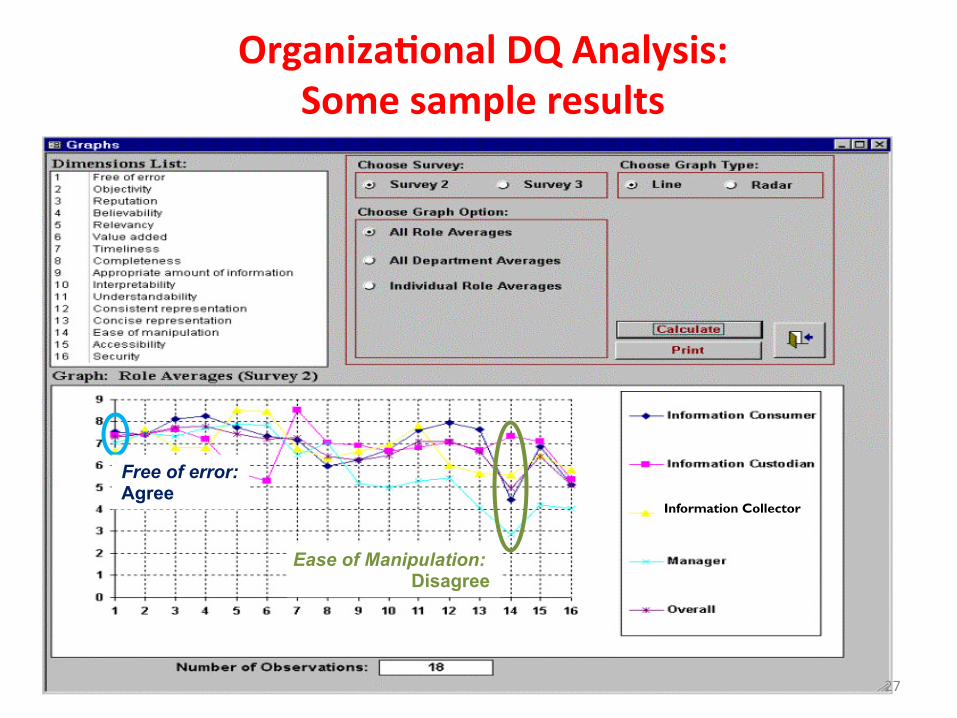
Organiza5onal DQ Analysis: Some sample results
Information Collector
27
Free of error: Agree
Ease of Manipulation: Disagree

Interplay of Data Quality and Data Semantics
Daimler Benz ( DCX ) Financial Data
Source P/E Ratio ABC 11.6 Bloomberg 5.57 DBC 19.19 MarketGuide 7.46
Which one is correct? Why? 28
Connec5on between Big Data & Data Quality
• Remark from many execu5ves: “I now have more and more informaCon, that I know less and less about…”
• Big Data provides: – Even more data – From even more diverse sources
• To get true and effec5ve value from Big Data – It must be high quality Big Data
29

1805 Overture In 1805, the Austrian and Russian Emperors agreed to
join forces against Napoleon. The Russians promised that their forces would be in the field in Bavaria by Oct. 20.
The Austrian staff planned its campaign based on that date in the Gregorian calendar. Russia, however, still used the ancient Julian calendar, which lagged 10 days behind.
The calendar difference allowed Napoleon to surround Austrian General Mack's army at Ulm and force its surrender on Oct. 21, well before the Russian forces could reach him, ultimately setting the stage for Austerlitz. Source: David Chandler, The Campaigns of Napoleon, New York: MacMillan 1966, pg. 390.
• Bottom Line: Increasing opportunity to gather and integrate information from many diverse BIG DATA sources … But both a technological and Strategy change. • But … need an executive (a CDO) to be sure it is understood and used effectively. 30

Part 3: Chief Data Officer (CDO) as an Approach to Managing and
Exploi2ng Big Data
31

New CDOs are emerging to Manage and Exploit Big Data
CIO leads business innova5ons in the world of big data Profit from 5V’s: Volume, Velocity, Variety, Value,
Veracity
Avoid creaCng many Big Data silos and duplicaCon of effort
Exploit data for external, strategic opportuniCes CDO is increasingly emerging to be the focal point in data prac5ce (not systems)
32
What is the CDO?
We broadly define the Chief Data Officer as: Those who have the CDO Ctle and those who are performing the CDO funcCon
Wikipedia describes the CDO as: A corporate officer responsible for enterprise-‐wide governance and uClizaCon of informaCon as an asset
33
Who is Appoin5ng CDOs? √ Government: US Army, UK Royal Army, Federal
CommunicaCon Commission (FCC), Veteran Affairs (VA), Federal Reserve Board (FRB), FRB of New York, UK Government, BalCmore City Mayor’s Office
√ Financial services: CiCgroup, Bank of America, Morgan Stanley, VISA InternaConal, Conning, TD Ameritrade, Boa Vista – Brazil, GBM – Mexico, HSBC, Conning, Standard Bank Group
√ Health Care: SeaKle’s Children’s Hospital, NaConal InsCtute of Health (NIH)
√ IT companies: Microsor, Yahoo! √ Retail: Alibaba Group – China, eBay, Amazon √ Customer Science: Dunnhumby
34
To whom do CDOs report?
Our research and prac5ce show that CDOs have various repor5ng lines:
Tier 1: CDO reports to the CEO/COO directly (FRB, SeaKle’s Children’s Hospital, Boa Vista-‐Brazil)
Tier 2: CDO reports to CIO, CMO, CFO, CRO, etc. (US Army, Microsor, GBM-‐Mexico, Conning)
Tier 3: CDO is not in the C-‐Suite, but has the highest level job to organize and manage data (TD Ameritrade, FCC)
35

Example: FRB -‐ CDO Office Strategic Importance Data and data management play a cri5cal role in fulfilling the
Federal Reserve Board’s (FRB) mission
Stated FRB Strategic Objec5ves: 1. Improve data governance by establishing a new Office of the
Chief Data Officer (CDO) and ensuring clear roles and responsibiliCes among the Chief Data Officer, the Board Data Council, and data users
2. Ensure that all enterprise data are handled, processed, stored, and disseminated by professional data management groups
3. Strengthen the Board’s data environment by establishing an infrastructure to share data and improve opportuniCes for data integra5on that supports the Board’s research and analyCcal capabiliCes
hKp://www.federalreserve.gov/publicaCons/gpra/files/2012-‐2015-‐strategic-‐framework.pdf (page 14)
36

Part 4: A Cubic Framework
for the Chief Data Officer
Building Organiza2onal Capability
37

Current Prac5ce: What are organiza5ons doing to exploit big data?
• Over 500 leading global execuCves reveal that most companies are beginning to learn about managing big data.
• The companies who have an execuCve responsible for data management achieve higher financial performance than their peers.
Source: Industry survey by the Economist, 2011
38

CDO
8 4
6
5 1
2
3 7 Big Data TradiConal Data
Strategy
Service
Outward
Inward
The CDO Leads Building Data-‐Grounded Organiza5onal Capability
Three Dimensions of CDO Engagement • Collabora5on Direc5on (Inward vs. Outward) • Data Space (TradiConal vs. Big Data) • Value Impact (Service vs. Strategy)
39

1. Collabora5on direc5on: DirecFon of the CDO’s engagement
• Inward: Towards internal business processes associated with data flow – Oren closely associated with collaboraCon within internal business divisions or funcConal areas
– Example iniCaCves: Data quality, data governance, architecture, analyCcs
• Outward: Towards external value chain and environment – E.g., customers, partners, government agencies, markets and environments.
– External reporCng, data sharing, data standards/integraCon consorCum 40
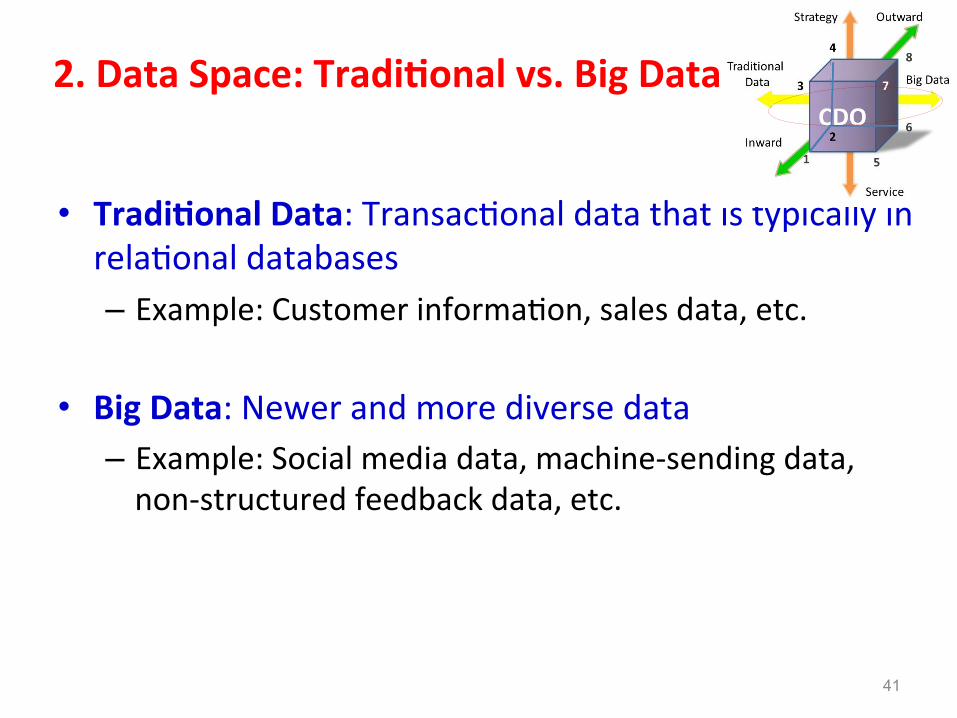
2. Data Space: Tradi5onal vs. Big Data
• Tradi5onal Data: TransacConal data that is typically in relaConal databases – Example: Customer informaCon, sales data, etc.
• Big Data: Newer and more diverse data – Example: Social media data, machine-‐sending data, non-‐structured feedback data, etc.
41

3. Value Impact: Service vs. Strategy
• Service: Data delivery service – Example: focus on improving business operaCon
• Strategy: Exploring new strategic opportuniCes for an organizaCon – Example: creaCng new markets, products, or new ways or models of conducCng business
42
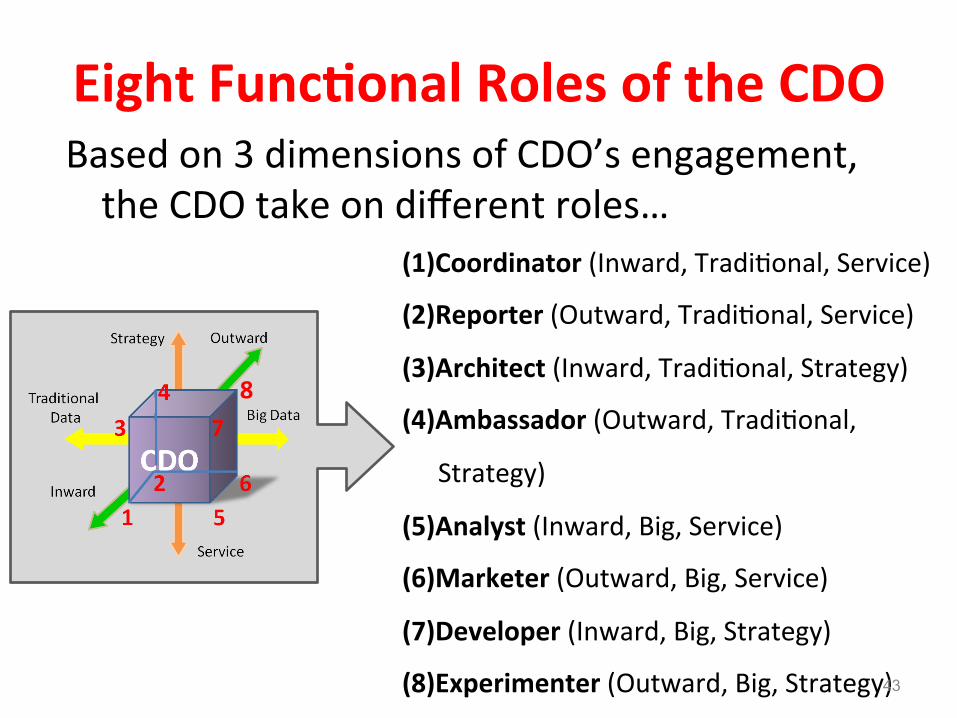
(1) Coordinator (Inward, TradiConal, Service) (2) Reporter (Outward, TradiConal, Service)
(3) Architect (Inward, TradiConal, Strategy) (4) Ambassador (Outward, TradiConal,
Strategy)
(5) Analyst (Inward, Big, Service) (6) Marketer (Outward, Big, Service)
(7) Developer (Inward, Big, Strategy) (8) Experimenter (Outward, Big, Strategy)
Eight Func5onal Roles of the CDO Based on 3 dimensions of CDO’s engagement, the CDO take on different roles…
8
43
CDO
8 4
6
5 1 2
3 7
Big Data TradiConal Data
Strategy
Service
Outward
Inward
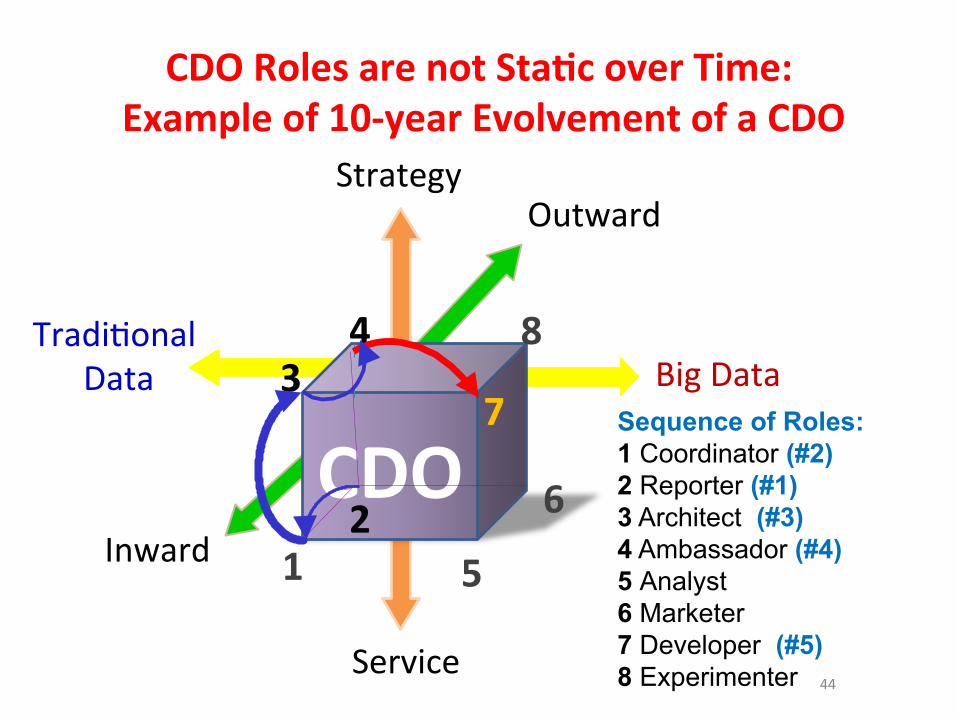
CDO Roles are not Sta5c over Time: Example of 10-‐year Evolvement of a CDO
44
Sequence of Roles: 1 Coordinator (#2) 2 Reporter (#1) 3 Architect (#3) 4 Ambassador (#4) 5 Analyst 6 Marketer 7 Developer (#5) 8 Experimenter

Overall Insights and Takeaways • There are exci5ng new opportuni5es made possible by
exploi5ng big data – Need advanced techniques and perspecCves – Need to understand new business opportuniCes
• Need to ensure the quality of the informa5on • Need a new breed of leaders to drive big data capability for
Business Process Transforma5on and Business Strategy Development
• A Chief Data Officer (CDO) can be cri5cal to success • The CDO Cubic Framework provides a systema5c way to
understand CDO roles and the needs of your organiza5on
Bodom line: A new breed of execu5ves (CDOs) can be groomed defined for effec5ve exploita5on and quality of big data to benefit the organiza5on 45
Backup Slides
46
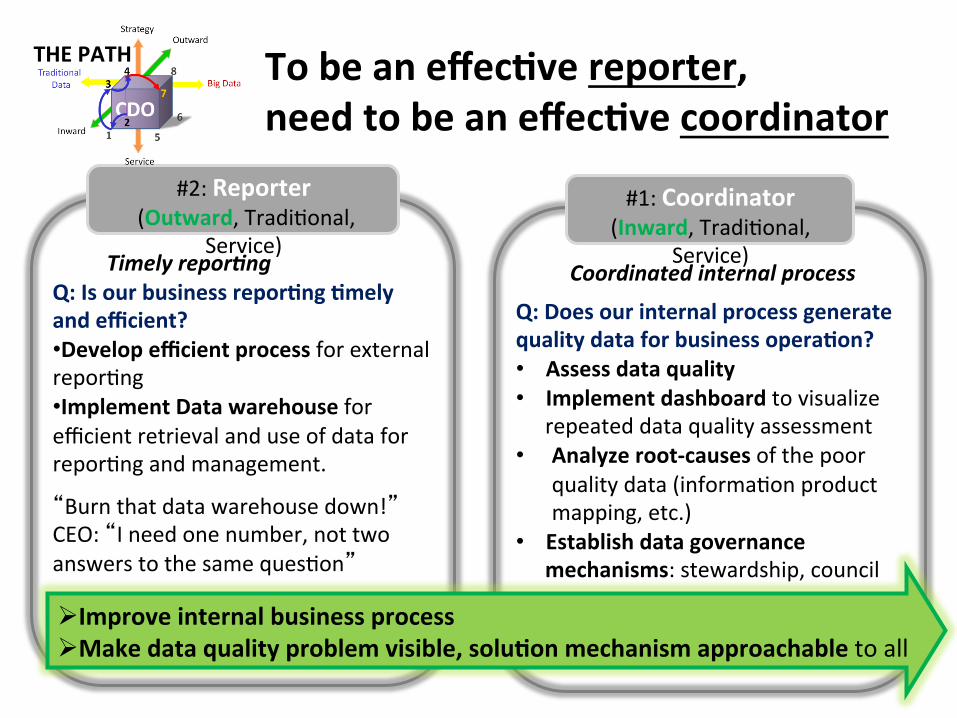
To be an effec5ve reporter, need to be an effec5ve coordinator
Timely reporFng Q: Is our business repor5ng 5mely and efficient? • Develop efficient process for external reporCng • Implement Data warehouse for efficient retrieval and use of data for reporCng and management.
“Burn that data warehouse down!” CEO: “I need one number, not two answers to the same quesCon”
#2: Reporter (Outward, TradiConal,
Service) Coordinated internal process
Q: Does our internal process generate quality data for business opera5on? • Assess data quality • Implement dashboard to visualize
repeated data quality assessment • Analyze root-‐causes of the poor
quality data (informaCon product mapping, etc.)
• Establish data governance mechanisms: stewardship, council
Improve internal business process Make data quality problem visible, solu5on mechanism approachable to all
#1: Coordinator (Inward, TradiConal,
Service)
THE PATH
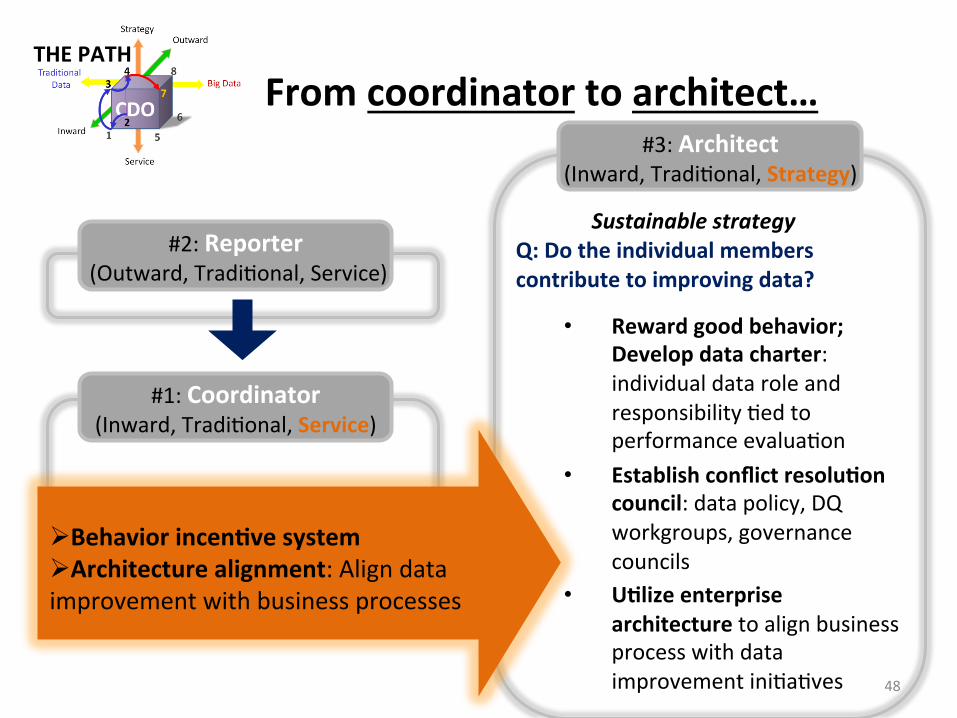
From coordinator to architect…
#1: Coordinator (Inward, TradiConal, Service)
Sustainable strategy
Q: Do the individual members contribute to improving data?
• Reward good behavior; Develop data charter: individual data role and responsibility Ced to performance evaluaCon
• Establish conflict resolu5on council: data policy, DQ workgroups, governance councils
• U5lize enterprise architecture to align business process with data improvement iniCaCves
Behavior incen5ve system Architecture alignment: Align data improvement with business processes
#3: Architect (Inward, TradiConal, Strategy)
#2: Reporter (Outward, TradiConal, Service)
THE PATH
48

From architect to ambassador…
#1: Coordinator (Inward, TradiConal, Service)
Interoperability & Comparability
Q: Can we share and compare data with others? • Reach out external organiza5ons to
improve industry data exchange, sharing and comparability
• Form Industry consor5um to reach out and discuss with other CDOs
• Develop data standards and business process standards
#2: Reporter (Outward, TradiConal, Service)
#3: Architect (Inward, TradiConal, Strategy)
#4: Ambassador (Outward, TradiConal, Strategy)
Engage industry form for improved comparability of shared data
THE PATH
49
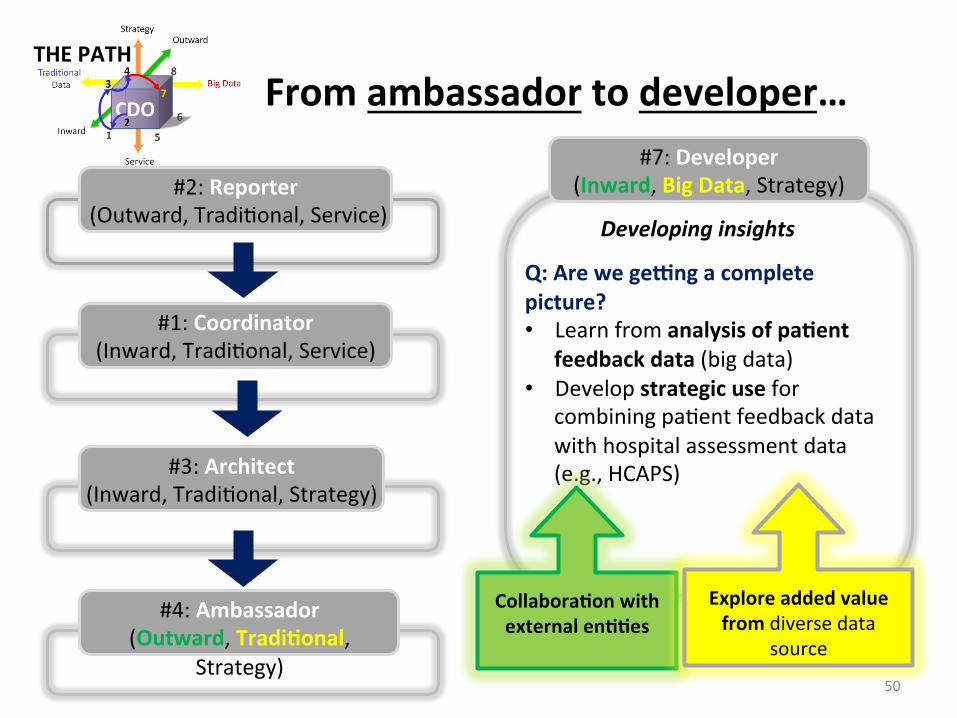
From ambassador to developer…
#1: Coordinator (Inward, TradiConal, Service)
Developing insights
Q: Are we geung a complete picture? • Learn from analysis of pa5ent
feedback data (big data) • Develop strategic use for
combining paCent feedback data with hospital assessment data (e.g., HCAPS)
#2: Reporter (Outward, TradiConal, Service)
#3: Architect (Inward, TradiConal, Strategy)
#4: Ambassador (Outward, Tradi5onal,
Strategy)
#7: Developer (Inward, Big Data, Strategy)
Collabora5on with external en55es
THE PATH
Explore added value from diverse data
source
50