Embed Size (px)
Citation preview

Abstract—There are two ways to distribute electric energy to
customers: overhead lines and underground cables. Overhead
lines and underground cables have different electrical
characteristics. Underground cables have less resistance and
inductance compared to overhead lines. Also, underground
cables have more capacitance than overhead lines. This paper
will test the voltage response of the system when electric
vehicles are charged from overhead and underground
distribution systems. The test will be done using IEEE 34 bus
test feeder for the overhead distribution system. For the
underground system, all overhead lines in IEEE 34 bus test
feeder will be replaced with underground cables following the
same electrical configuration.
Index Terms—Electric vehicles, IEEE 34, voltage violation,
power distribution.
I. INTRODUCTION
A. Underground Cable
Underground cables are classified based on the number of
core conductors. They commonly have one, two or three core
conductors. Three core cables are used in most underground
distribution systems because they are more economic than
single core cables. Nonetheless, if the voltage exceeds 66 kV,
three core cables are not practical because they become very
heavy [1].
Fig. 1. The three core underground cable capacitance.
The capacitance of underground cables is important
compared to overhead lines because conductors are located
close to each other and close to the grounded sheath.
Moreover, there is a dielectric material between the
conductors that has larger permittivity than air.
Fig. 1 models the capacitance which occurs within the
Manuscript received October 8, 2014; revised April 10, 2015. The
research was conducted under the ARRA Smart Grid Regional
Demonstration Project funded by the US Department of Energy and City of Los Angeles Department of Water and Power.
underground cable. Cc and Ce represents the core to core
capacitance, and conductor to earth capacitance respectively.
Cc and Ce are caused by the electrostatic fields. The
conductor-to-earth capacitors are wye-connected whereas the
conductor-to-conductor capacitors are delta-connected.
B. Overhead Lines
Overhead lines consist of bare conductors which carry
current. When lines carry current, some of the power carried
gets dissipated in the line due to the resistance of the
conductors. In case of alternating current, the losses will be
greater when large cables are used due to the skin effect.
II. CHARGING LEVELS [2]
A. Level 1
Level 1 charges electric vehicles (EV’s) through an
alternating 120 volts. Level 1 does not require additional
charging units. It can charge using the regular outlet that
exists in modern houses. Therefore, there is no need for
electric vehicles to be charged from charging stations. The
charging time for electric vehicles to be charged fully
depends on the battery used. However, it ranges between 4 to
11 hours on average. Moreover, customers who use level 1
usually charge their electric vehicles overnight.
B. Level 2
Level 2 provides power to electric vehicles through an
alternating 240 volts. It requires additional charging units
provided in public by the utility or set up in the customers’
homes. Level 2 is the most common charging level because it
has a relatively fast charging time and economic cost. The
charging time depends on the type of battery used. However,
level 2 can charge an electric vehicle in 2 to 6 hours.
C. Level 3
Level 3 charges electric vehicles through a direct 480 volts.
Level 3 requires additional charging units to convert the
voltage from AC to DC. Therefore, it is not recommended to
install it in areas that are populated. Level 3 is the fastest
charging level. Level 3 charging needs approximately 24
minutes to an hour to charge the electric vehicle. The main
disadvantage of this level of charging is its cost. It is
expensive to install the charging units.
III. MODELING
The simulation will be performed on the IEEE 34 bus test
feeder, shown in Fig. 2, using EDD software as shown in Fig.
3. The distribution system exists in Arizona. The system
voltage is 24.9 kV. The system has a step down transformer
Overhead and Underground Distribution Systems Impact
on Electric Vehicles Charging
Ahmed K. Allehyani and Mohammed J. Beshir
Journal of Clean Energy Technologies, Vol. 4, No. 2, March 2016
125DOI: 10.7763/JOCET.2016.V4.265
Ahmed Allehyani is with the Department of Electrical Engineering at the University of Southern California, United States (e-mail:
Mohammed J. Beshir was with the Department of Electrical Engineering at the University of Southern California (USC), USA.
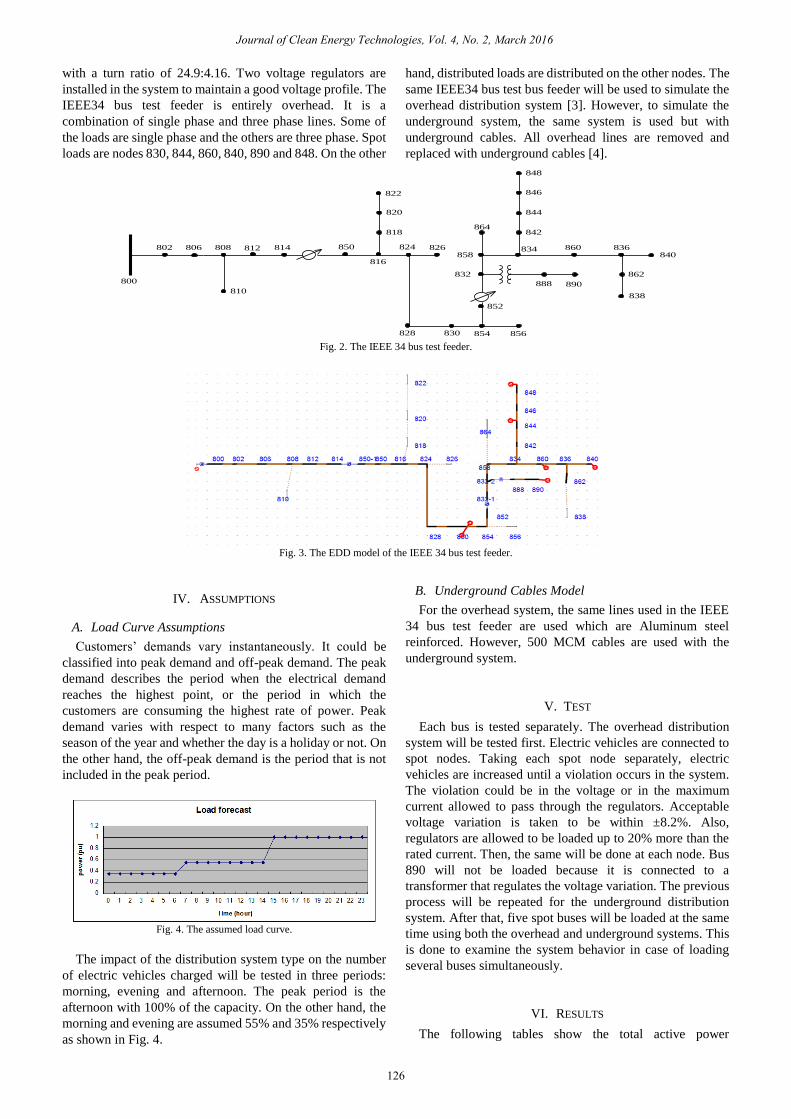
with a turn ratio of 24.9:4.16. Two voltage regulators are
installed in the system to maintain a good voltage profile. The
IEEE34 bus test feeder is entirely overhead. It is a
combination of single phase and three phase lines. Some of
the loads are single phase and the others are three phase. Spot
loads are nodes 830, 844, 860, 840, 890 and 848. On the other
hand, distributed loads are distributed on the other nodes. The
same IEEE34 bus test bus feeder will be used to simulate the
overhead distribution system [3]. However, to simulate the
underground system, the same system is used but with
underground cables. All overhead lines are removed and
replaced with underground cables [4].
800
806 808 812 814
810
802 850
818
824 826
816
820
822
828 830 854 856
852
832
888 890
838
862
840836860834
842
844
846
848
864
858
Fig. 2. The IEEE 34 bus test feeder.
Fig. 3. The EDD model of the IEEE 34 bus test feeder.
IV. ASSUMPTIONS
A. Load Curve Assumptions
Customers’ demands vary instantaneously. It could be
classified into peak demand and off-peak demand. The peak
demand describes the period when the electrical demand
reaches the highest point, or the period in which the
customers are consuming the highest rate of power. Peak
demand varies with respect to many factors such as the
season of the year and whether the day is a holiday or not. On
the other hand, the off-peak demand is the period that is not
included in the peak period.
Fig. 4. The assumed load curve.
The impact of the distribution system type on the number
of electric vehicles charged will be tested in three periods:
morning, evening and afternoon. The peak period is the
afternoon with 100% of the capacity. On the other hand, the
morning and evening are assumed 55% and 35% respectively
as shown in Fig. 4.
B. Underground Cables Model
For the overhead system, the same lines used in the IEEE
34 bus test feeder are used which are Aluminum steel
reinforced. However, 500 MCM cables are used with the
underground system.
V. TEST
Each bus is tested separately. The overhead distribution
system will be tested first. Electric vehicles are connected to
spot nodes. Taking each spot node separately, electric
vehicles are increased until a violation occurs in the system.
The violation could be in the voltage or in the maximum
current allowed to pass through the regulators. Acceptable
voltage variation is taken to be within ±8.2%. Also,
regulators are allowed to be loaded up to 20% more than the
rated current. Then, the same will be done at each node. Bus
890 will not be loaded because it is connected to a
transformer that regulates the voltage variation. The previous
process will be repeated for the underground distribution
system. After that, five spot buses will be loaded at the same
time using both the overhead and underground systems. This
is done to examine the system behavior in case of loading
several buses simultaneously.
VI. RESULTS
The following tables show the total active power
Journal of Clean Energy Technologies, Vol. 4, No. 2, March 2016
126

connected. The connected active power represents electric
vehicles. Also, how many electric vehicles it is equivalent to
using charging level 1 and 2.
A. Loading Each Node Separately
1) Night
a) Overhead
TABLE I: THE MAX NUMBER OF EV’S THAT CAN BE CONNECTED AT EACH
BUS
Bus Overhead
Active Power(kW) Level 1 Level 2
840 3000 1500 375
860 3050 1525 381
848 3000 1500 375
844 3050 1525 381
830 3500 1750 437
b) Underground
TABLE II: THE MAX NUMBER OF EV’S THAT CAN BE CONNECTED AT EACH
BUS
Bus Underground
Active Power(kW) Level 1 Level 2
840 3600 1800 450
860 3600 1800 450
848 3600 1800 450
844 3600 1800 450
830 3650 1825 456
Table I and Table II examined the system response when
the electric vehicles were connected at night where the
minimum load usually occurs. The underground system was
able to withstand more Charged EV’s compared to the
overhead system. Additionally, the system did not experience
overvoltage at low loading due to the overall capacitance
effect of the underground system.
2) Morning
a) Overhead
Tables III and IV show the maximum number of EV’s
connected to the overhead and underground systems in the
morning. The underground system was able to endure more
electric vehicles.
TABLE III: THE MAX NUMBER OF EV’S THAT CAN BE CONNECTED AT
EACH BUS
Bus Overhead
Active Power(kW) Level 1 Level 2
840 1650 825 206
860 1700 850 212
848 1650 825 206
844 1700 850 212
830 2000 1000 250
b) Underground
TABLE IV: THE MAX NUMBER OF EV’S THAT CAN BE CONNECTED AT
EACH BUS
Bus Underground
Active Power(kW) Level 1 Level 2
840 2100 1050 262
860 2100 1050 262
848 2100 1050 262
844 2100 1050 262
830 2200 1100 275
3) Afternoon
a) Overhead
When EV’s are charged in the afternoon when the peak
period occurs, the underground system showed more
endurance as shown in Table V and Table VI.
TABLE V: THE MAX NUMBER OF EV’S THAT CAN BE CONNECTED AT EACH
BUS
Bus Overhead
Active Power(kW) Level 1 Level 2
840 580 290 72
860 590 295 73
848 580 290 72
844 600 300 75
830 650 325 81
b) Underground
TABLE VI: THE MAX NUMBER OF EV’S THAT CAN BE CONNECTED AT
EACH BUS
Bus Underground
Active Power(kW) Level 1 Level 2
840 950 475 118
860 950 475 118
848 950 475 118
844 950 475 118
830 950 475 118
B. Increase Five Spot Buses at the Same Time
1) Overhead
On the other hand, Table VII and Table VIII show the
system response when EV’s are connected to all load buses at
the same time. The underground system was able to
withstand more EV’s.
TABLE VII: THE MAX NUMBER OF EV’S THAT CAN BE CONNECTED AT
EACH BUS WHEN SPOT NODES ARE LOADED AT THE SAME TIME
Time Period Overhead
Power increase (kW) Level 1 Level 2
Night 610 305 76.25
Morning 350 175 43.75
Afternoon 120 60 15
Journal of Clean Energy Technologies, Vol. 4, No. 2, March 2016
127

2) Underground
TABLE VIII: THE MAX NUMBER OF EV’S THAT CAN BE CONNECTED AT
EACH BUS WHEN SPOT NODES ARE LOADED AT THE SAME TIME
Time Period Underground
Power increase (kW) Level 1 Level 2
Night 720 360 90
Morning 430 215 53.75
Afternoon 190 95 23.75
Therefore, underground distribution system was able to
withstand more connected in all scenarios. This is due to the
capacitance effect of the underground cable and the high
resistance of the overhead distribution lines [5].
The following figures, from Fig. 5 to Fig. 8, show how
many more EV’s can be connected to the IEEE 34
underground bus system.
In conclusion, underground distribution system was able to
withstand more charged electric vehicles in all scenarios.
Therefore, from a technical point of view, it is recommended
to use underground distribution system to accommodate
more charged EV’s without resulting a violation of any sort.
Fig. 5. The number of extra EV’s that could be charged at night for each bus
at night.
Fig. 6. The number of extra EV’s that could be charged at night for each bus
in the morning.
Fig. 7. The number of extra EV’s that could be charged at night for each bus
in the morning.
Fig. 8. The number of extra EV’s that could be charged from all buses at the
same time.
ACKNOWLEDGMENT
This paper was prepared while taking a directed research at
the University of Southern. I would like to thank Professor
Mohammed Beshir for supervising me while doing the
research. Also, I am grateful to his research assistants Laith
Shalalfeh and Zeming Jiang for the help they provided.
REFERENCES
[1] V. K. Mehta and R. Mehta, Principles of Power System: (Including
Generation, Transmission, Distribution, Switchgear and Protection),. 4th ed. New Delhi: S. Chand, 2005, p. 288.
[2] M. Yilmaz and P. T. Krein, “Review of charging power levels and
infrastructure for plug-in electric and hybrid vehicles,” in Proc. 2012 IEEE International Electric Vehicle Conference, 2012, pp. 1-8, 4-8.
[3] Radial Test Feeders — IEEE Distribution System Analysis Subcommittee. [Online]. Available:
http://www.ewh.ieee.org/soc/pes/dsacom/testfeeders.html
[4] B. Cunningham and H. Zadehgol, “Underground urban distribution cables, ampacity analysis and capacity improvements in Seattle City
Light system,” Transmission and Distribution Conference and Exposition, vol. 1, pp. 183-188, 2001.
[5] G. J. Newton, “Underground distribution systems, ” Proceedings of the
American Institute of Electrical Engineers, vol. 35, no. 8, pp. 1193-1208, Aug. 1916.
Ahmed K. Allehyani was born in Jeddah, Saudi
Arabia on April 1, 1990. He earned his bachelor’s degree from King Abdulaziz University in Jeddah,
Saudi Arabia. He graduated from King Abdulaziz University in 2012 with a bachelor degree of science in
electrical engineering.
He did summer training at the Saudi Electricity Company in the distribution department for two
months. After graduation, he worked also for the Saudi Electricity Company but in the transmission department. He was hired as a
project manager for the electricity transmission projects. He quitted his job to
get a master of science degree from the University of Southern California which located in Los Angeles, CA, United States. He is currently studying
MSc in electrical engineering at the University of Southern California.
Mohammed J. Beshir is an associate professor of electrical engineering at the University of Southern
California (USC), USA. He has a Ph.D. degree in electrical engineering from USC and master’s
degree in business administration (MBA) from
Pepperdine University in Malibu, California, USA. He is a registered professional engineer in the state
of California and is a senior member of IEEE. Formerly, he was an assistant director of Power
System Planning and Development Division at the
Los Angeles Department of Water and Power (LADWP). He worked for LADWP for over 30 years in various responsibilities including integrated
resource planning, transmission planning, renewable project development, HVDC design, power contracts, distribution planning, power reliability, and
energy storage systems.
Journal of Clean Energy Technologies, Vol. 4, No. 2, March 2016
128