Embed Size (px)
Citation preview
OVERVIEW OF 2015 REPORTED EMISSIONSAPRIL 2017FACILITY GREENHOUSE GAS EMISSIONS REPORTING
Cat. No.: En81-6/1E-PDF
ISSN: 2371-1035
Unless otherwise specified, you may not reproduce materials in this publication, in whole or in part, for the purposes of commercial redistribution without prior written permission from Environment and Climate Change Canada’s copyright administrator. To obtain permission to reproduce Government of Canada materials for commercial purposes, apply for Crown Copyright Clearance by contacting:
Environment and Climate Change CanadaPublic Inquiries Centre
7th Floor, Fontaine Building
200 Sacré-Coeur Boulevard
Gatineau QC K1A 0H3
Telephone: 819-997-2800
Toll Free: 1-800-668-6767 (in Canada only)
Email: [email protected]
Photos: © www.gettyimages.ca
© Her Majesty the Queen in Right of Canada, represented by the Minister of Environment and Climate Change, 2016
Aussi disponible en français
Overview of Reported 2015 Emissions2
TABLE OF CONTENTSHighlights ...................................................................................................................................................................4
1 Greenhouse Gas Emissions Reporting Program ..............................................................................................4
2 Reported 2015 Greenhouse Gas Emissions .......................................................................................................52.1 Calculation Methods 62.2 Greenhouse Gases (GHGs) and Global Warming Potentials 72.3 Reported GHG Emissions by Gas and by Source 82.4 Reported GHG Emissions by Province/Territory 92.5 Reported GHG Emissions by Sector 9
3 Trends in Reported GHG Emissions ..........................................................................................................................123.1 Overall National-Level Trends 12
3.2 Industry Sector and Provincial/Territorial Trends 13
4 Facility- Reported Emissions and the National GHG Inventoy .......................................................................... 17
5 Additional Information About the GHGRP .....................................................................................................185.1 Data Quality 185.2 Public Access 195.3 Links to Other Programs 19
6 Contact Us .........................................................................................................................................................19
Overview of Reported 2015 Emissions 3

GREENHOUSE GAS EMISSIONS REPORTING PROGRAMEnvironment and Climate Change Canada’s Green-house Gas Emissions Reporting Program (GHGRP) has completed the collection of GHG emissions infor-mation from Canadian facilities for the 2015 calendar year. Any facility with annual GHG emissions of 50 kt
1
HIGHLIGHTS For the 2015 calendar year, 563 facilities reported
their greenhouse gas (GHG) emissions to Environment and Climate Change Canada, totalling 264 megatonnes1 (Mt) of carbon dioxide equivalent (CO2 eq.), unchanged from the 2014 total.
The reported emissions are, for the most part, evenly distributed across three sectors: (i) Mining, Quarrying, and Oil and Gas Extraction (33%), (ii) Utilities (32%), and (iii) Manufacturing (29%). Among all facilities, those engaged in electricity generation and oil/gas extraction account for 62% of the total.
Reported GHG emissions increased by 3% (8 Mt) in the last five years, consistent with the upward trend in emissions reported by the National Greenhouse Gas Inventory. Emissions from non-conventional oil extraction facilities located in Alberta increased by 15 Mt, but were partly offset by the 8 Mt decrease in emissions from Ontario-based power plants resulting largely from the closure of coal-fired electric power generation facilities.
Since 2005, total emissions from all reporting facilities decreased by 5% (14 Mt). The Utilities and Manufacturing sectors experienced the largest declines (38 Mt and 16 Mt, respectively), while reported emissions increased by 40 Mt from facilities in the Mining, Quarrying, and Oil and Gas Extraction sector, largely in Alberta (36 Mt).
The GHG emissions data collected from facilities represent just over one-third (37%) of Canada’s total GHG emissions in 2015 (722 Mt) and 58% of Canada’s industrial GHG emissions as reported in Canada’s National Inventory Report.2
Environment and Climate Change Canada is considering expanding the reporting requirements under the GHGRP starting in 2017 in order to be able to directly use this data in the National GHG Inventory, thus better reflecting emission changes occurring at individual facilities and improving the consistency and comparability of GHG data.
of carbon dioxide equivalent (CO2 eq.) or higher3 is required to report to the program.
The Government of Canada established the GHGRP in March 2004 under the authority of section 46 of the Canadian Environmental Protection Act, 1999 (CEPA) to collect GHG emissions information annually from the largest emitting Canadian facilities. To date, facility-reported GHG information has been collected and published through Environment and Climate Change Canada’s GHGRP for the period 2004 to
3 The reporting threshold was reduced from 100 kt to 50 kt in 2009, increasing the number of facilities reporting to the program by 53%, with a corresponding 4% increase in the level of emissions being reported.
1 1 Mt = 1 million tonnes or 1 000 kilotonnes (kt).
2 In this overview report, Canada’s industrial GHG emissions include those from the following GHG categories from the National Inventory Report: Greenhouse Gas Sources and Sinks in Canada 1990–2015: Stationary Combustion Sources (except Residential), Other Transportation, Fugitive Sources, Industrial Processes and Product Use, and Waste. The national inventory report is available on-line at www.unfccc.int/national_reports/ annex_i_ghg_inventories/national_inventories_submissions/items/8812.php
Overview of Reported 2015 Emissions4
ECCC is consulting with stakeholders on the proposed changes5 starting in early 2017, in advance of issuing requirements for 2017.
REPORTED 2015 GREENHOUSE GAS EMISSIONSNote: Unless explicitly stated otherwise, all emissions data presented in this report are expressed in CO2 eq. units.
For the purposes of the GHGRP, a facility is defined as a contiguous facility, pipeline transportation system, or offshore installation. A contiguous facility is defined as all buildings, equipment, structures and stationary items that are located on a single site or on contigu-ous or adjacent sites that are owned or operated by the same person and that function as a single inte-grated site; it includes wastewater collection systems that discharge treated or untreated wastewater into surface waters.
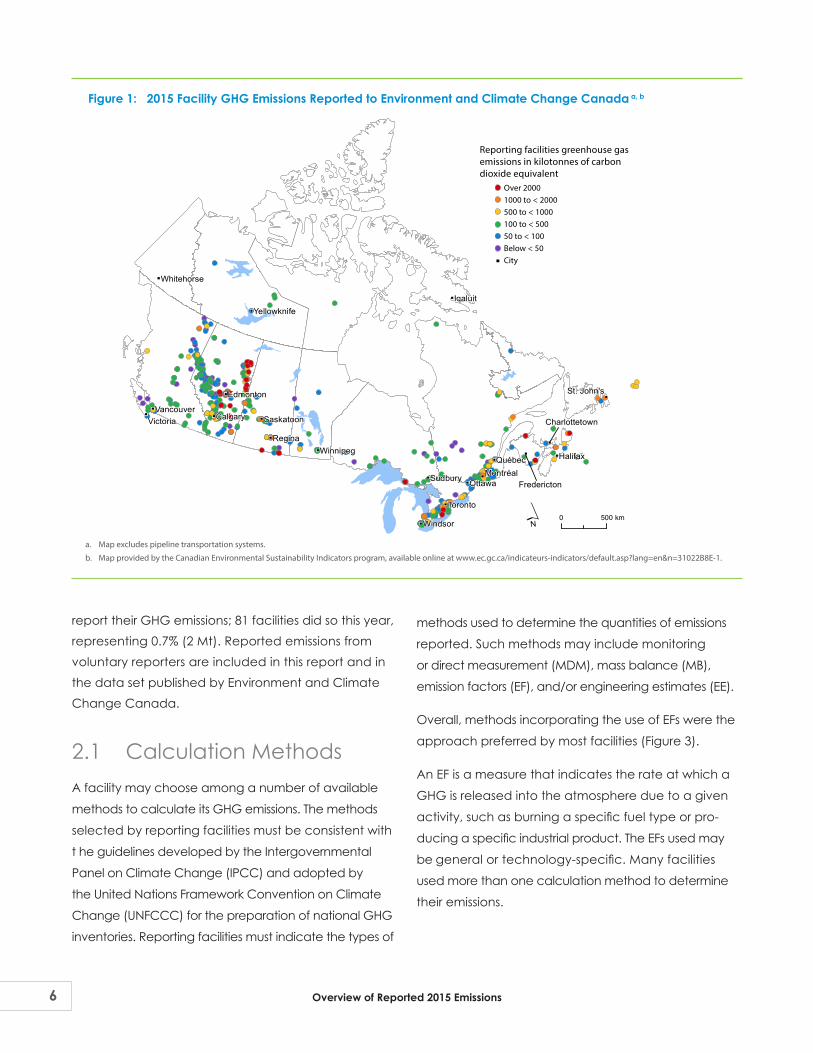
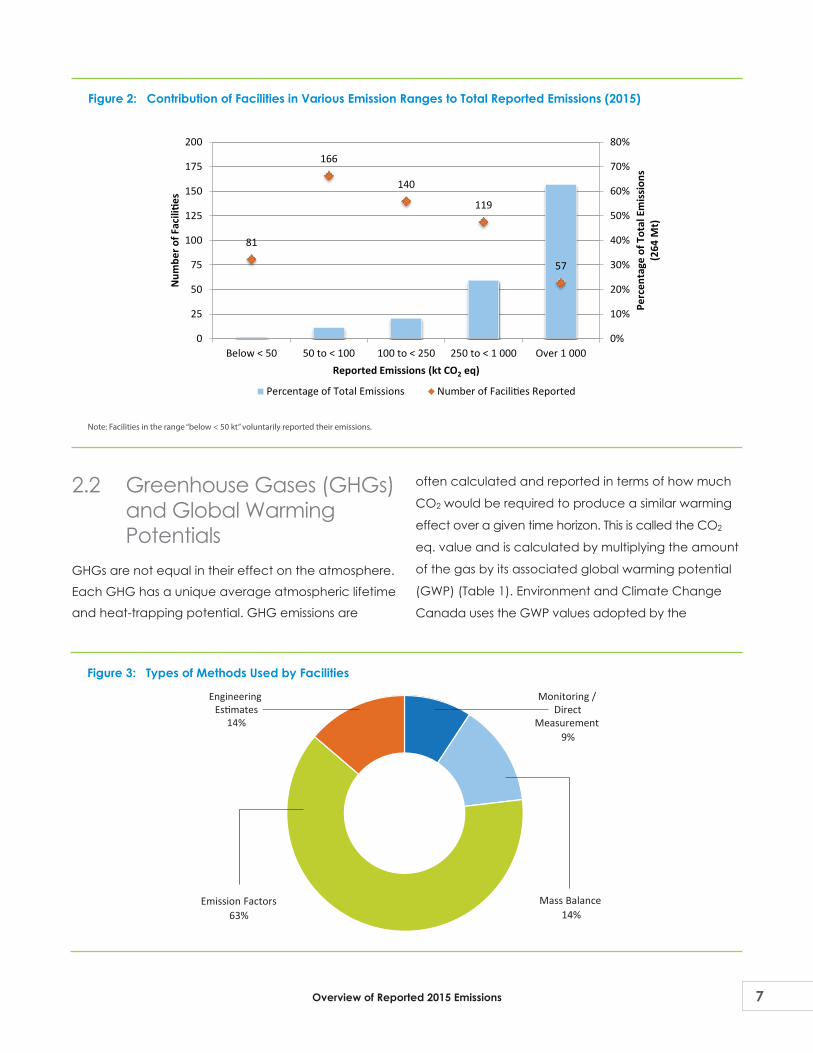
A total of 563 facilities reported their GHG emissions to Environment and Climate Change Canada for the 2015 calendar year, collectively emitting a total of 264 Mt of GHGs (Figure 1). Of these facilities, 316 reported GHG emission levels greater than 100 kt, accounting for 95% (251 Mt) of the total reported emissions, and 57 emitted GHGs in quantities higher than 1 Mt, account-ing for 63% (166 Mt) of the total reported emissions (Figure 2). Twenty-three facilities reported their GHG emissions for the first time: they fall within various sectors, such as conventional oil and gas extraction (6 facili-ties), non-conventional oil extraction (5 facilities), and waste treatment and disposal (3 facilities). The combined emissions from these new reporters are close to 4 Mt. Facilities with emissions falling below the reporting threshold of 50 kt per year can voluntarily
5 Information about the proposed changes to the program and plans for consultation are outlined in the Notice of intent to inform stakeholders of upcoming consultations on proposed changes to the Greenhouse Gas Reporting Program, published on December 10, 2016 (available online at www.gazette.gc.ca/rp-pr/p1/2016/2016-12-10/html/notice-avis-eng.php#na2).
22015. This program is part of Canada’s ongoing effort to develop, in collaboration with Canadian provinces and territories, a harmonized and efficient mandatory GHG reporting system that minimizes duplication and reporting burden for industry and governments. Key objectives of the program are to provide Canadians with consistent information on GHG emissions, confirm industrial emission estimates presented in the National Greenhouse Gas Inventory and support regulatory initiatives. The data collected are also shared with provinces and territories. The data used in this overview report are current as of October 12, 2016. Subsequent company updates will be included in future data releases.
The federal reporting requirements for 2016 data, scheduled to be submitted by facilities to Environment and Climate Change Canada by June 1, 2017, are set out in the Notice with respect to reporting of greenhouse gases (GHGs) for 20164 published in the Canada Gazette on December 10, 2016.
Environment and Climate Change Canada is con- sidering expanding the reporting requirements under the GHGRP in order to enable the direct use of the reported data in Canada’s National GHG Inventory, increase the consistency and comparability of GHG data across jurisdictions, and obtain a more compre-hensive picture of Canadian facility emissions. Proposed changes include:
Lowering the reporting threshold from 50 to 10 kt CO2 eq. per year.
Reporting of additional data (e.g., more detailed emissions, quantities of fuels or feedstocks consumed, etc.) and applying specific quantification methods to determine emissions; these new requirements will be gradually phased in by sectors.
4 This notice can be viewed online at www.gazette.gc.ca/rp-pr/p1/2016/2016-12-10/ html/notice-avis-eng.php#na1.
Overview of Reported 2015 Emissions 5
methods used to determine the quantities of emissions
reported. Such methods may include monitoring
or direct measurement (MDM), mass balance (MB),
emission factors (EF), and/or engineering estimates (EE).
Overall, methods incorporating the use of EFs were the
approach preferred by most facilities (Figure 3).
An EF is a measure that indicates the rate at which a
GHG is released into the atmosphere due to a given
activity, such as burning a specific fuel type or pro-
ducing a specific industrial product. The EFs used may
be general or technology-specific. Many facilities
used more than one calculation method to determine
their emissions.
report their GHG emissions; 81 facilities did so this year, representing 0.7% (2 Mt). Reported emissions from voluntary reporters are included in this report and in the data set published by Environment and Climate Change Canada.
2.1 Calculation MethodsA facility may choose among a number of available
methods to calculate its GHG emissions. The methods
selected by reporting facilities must be consistent with
t he guidelines developed by the Intergovernmental
Panel on Climate Change (IPCC) and adopted by
the United Nations Framework Convention on Climate
Change (UNFCCC) for the preparation of national GHG
inventories. Reporting facilities must indicate the types of
Figure 1: 2015 Facility GHG Emissions Reported to Environment and Climate Change Canada a, b
Victoria
Ottawa
Regina
Iqaluit
Toronto
Calgary
Halifax
Windsor
Sudbury Montréal
Edmonton
Winnipeg
VancouverSaskatoon
St. John's
Whitehorse
Yellowknife
0 500 km
Charlottetown
Fredericton
Québec
Reporting facilities greenhouse gasemissions in kilotonnes of carbon dioxide equivalent
Over 20001000 to < 2000500 to < 1000100 to < 50050 to < 100Below < 50City
a. Map excludes pipeline transportation systems.
b. Map provided by the Canadian Environmental Sustainability Indicators program, available online at www.ec.gc.ca/indicateurs-indicators/default.asp?lang=en&n=31022B8E-1.
Overview of Reported 2015 Emissions6
2.2 Greenhouse Gases (GHGs) and Global Warming Potentials
GHGs are not equal in their effect on the atmosphere.
Each GHG has a unique average atmospheric lifetime
and heat-trapping potential. GHG emissions are
often calculated and reported in terms of how much
CO2 would be required to produce a similar warming
effect over a given time horizon. This is called the CO2
eq. value and is calculated by multiplying the amount
of the gas by its associated global warming potential
(GWP) (Table 1). Environment and Climate Change
Canada uses the GWP values adopted by the
Figure 2: Contribution of Facilities in Various Emission Ranges to Total Reported Emissions (2015)
81
166
140
119
57
0%
10%
20%
30%
40%
50%
60%
70%
80%
0
25
50
75
100
125
150
175
200
Below < 50 50 to < 100 100 to < 250 250 to < 1 000 Over 1 000
Perc
enta
ge o
f Tot
al E
mis
sion
s(2
64 M
t)
Num
ber o
f Fac
ilitie
s
Reported Emissions (kt CO2 eq)
Percentage of Total Emissions Number of Facilities Reported
Note: Facilities in the range “below < 50 kt” voluntarily reported their emissions.
Figure 3: Types of Methods Used by Facilities
Engineering Estimates
14%
Monitoring / Direct
Measurement9%
Mass Balance14%
Emission Factors63%
Overview of Reported 2015 Emissions 7
UNFCCC, a complete list of which can be found in the
Notice with respect to reporting of greenhouse gases
(GHGs) for 2015.6 The GWP values used by the GHGRP
are consistent with those used in Canada’s National
Greenhouse Gas Inventory.
6 This notice can be viewed online at www.gazette.gc.ca/rp-pr/p1/2015/2015-10- 17/html/notice-avis-eng.php#ne6.
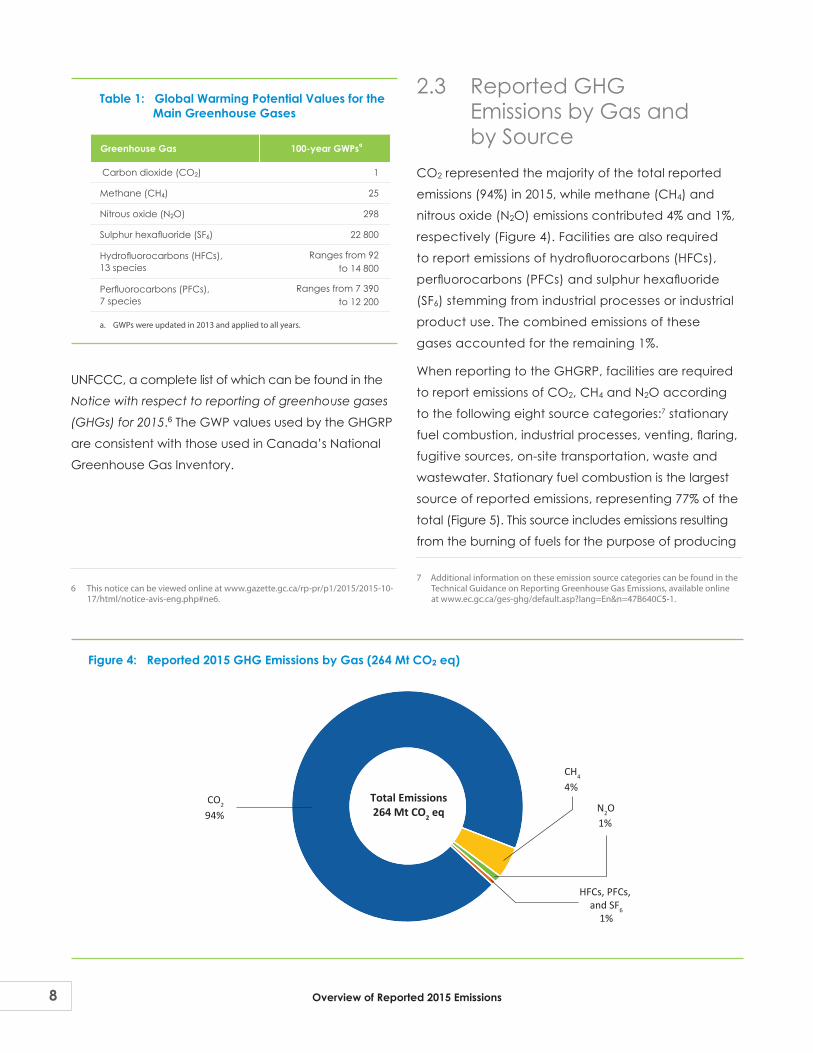
2.3 Reported GHG Emissions by Gas and by Source
CO2 represented the majority of the total reported
emissions (94%) in 2015, while methane (CH4) and
nitrous oxide (N2O) emissions contributed 4% and 1%,
respectively (Figure 4). Facilities are also required
to report emissions of hydrofluorocarbons (HFCs),
perfluorocarbons (PFCs) and sulphur hexafluoride
(SF6) stemming from industrial processes or industrial
product use. The combined emissions of these
gases accounted for the remaining 1%.
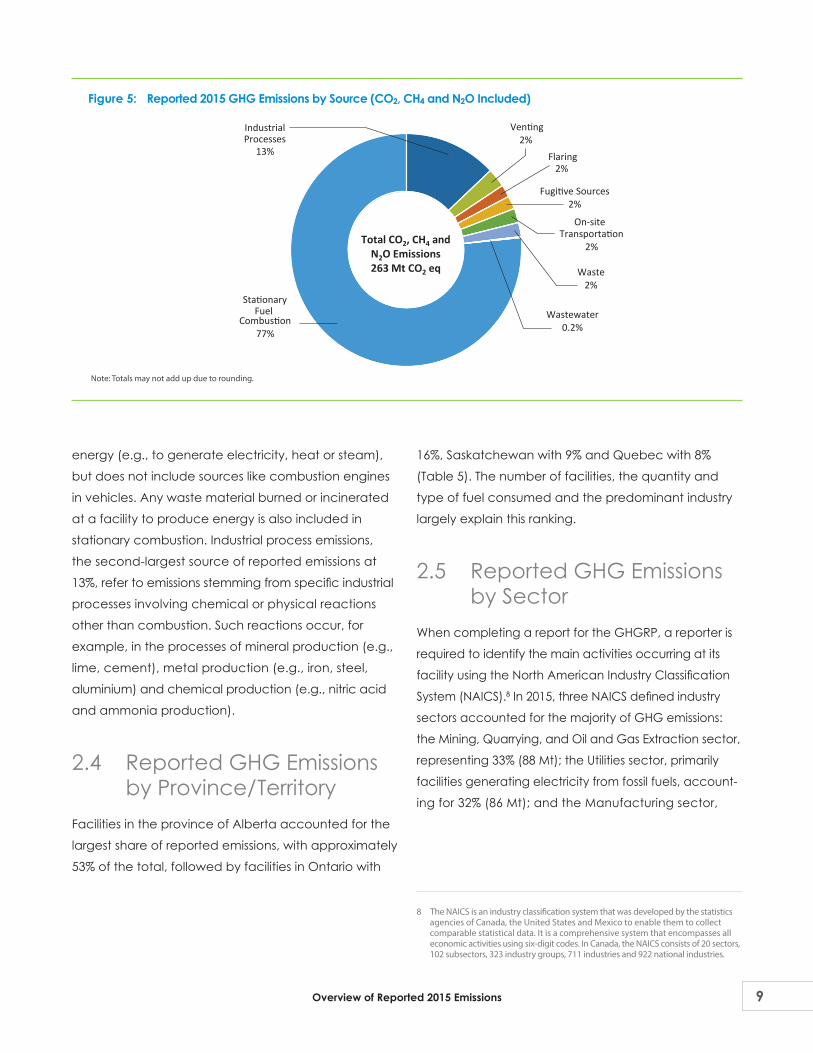
When reporting to the GHGRP, facilities are required
to report emissions of CO2, CH4 and N2O according
to the following eight source categories:7 stationary
fuel combustion, industrial processes, venting, flaring,
fugitive sources, on-site transportation, waste and
wastewater. Stationary fuel combustion is the largest
source of reported emissions, representing 77% of the
total (Figure 5). This source includes emissions resulting
from the burning of fuels for the purpose of producing
7 Additional information on these emission source categories can be found in the Technical Guidance on Reporting Greenhouse Gas Emissions, available online at www.ec.gc.ca/ges-ghg/default.asp?lang=En&n=47B640C5-1.
Table 1: Global Warming Potential Values for the Main Greenhouse Gases
Greenhouse Gas 100-year GWPsª
Carbon dioxide (CO2) 1
Methane (CH4) 25
Nitrous oxide (N2O) 298
Sulphur hexafluoride (SF6) 22 800
Hydrofluorocarbons (HFCs), 13 species
Ranges from 92 to 14 800
Perfluorocarbons (PFCs), 7 species
Ranges from 7 390 to 12 200
a. GWPs were updated in 2013 and applied to all years.
Figure 4: Reported 2015 GHG Emissions by Gas (264 Mt CO2 eq)
CO2
94%Total Emissions264 Mt CO2 eq N2O
1%
HFCs, PFCs, and SF6
1%
CH4
4%
Overview of Reported 2015 Emissions8
16%, Saskatchewan with 9% and Quebec with 8%
(Table 5). The number of facilities, the quantity and
type of fuel consumed and the predominant industry
largely explain this ranking.
2.5 Reported GHG Emissions by Sector
When completing a report for the GHGRP, a reporter is
required to identify the main activities occurring at its
facility using the North American Industry Classification
System (NAICS).8 In 2015, three NAICS defined industry
sectors accounted for the majority of GHG emissions:
the Mining, Quarrying, and Oil and Gas Extraction sector,
representing 33% (88 Mt); the Utilities sector, primarily
facilities generating electricity from fossil fuels, account-
ing for 32% (86 Mt); and the Manufacturing sector,
8 The NAICS is an industry classification system that was developed by the statistics agencies of Canada, the United States and Mexico to enable them to collect comparable statistical data. It is a comprehensive system that encompasses all economic activities using six-digit codes. In Canada, the NAICS consists of 20 sectors, 102 subsectors, 323 industry groups, 711 industries and 922 national industries.
energy (e.g., to generate electricity, heat or steam),
but does not include sources like combustion engines
in vehicles. Any waste material burned or incinerated
at a facility to produce energy is also included in
stationary combustion. Industrial process emissions,
the second-largest source of reported emissions at
13%, refer to emissions stemming from specific industrial
processes involving chemical or physical reactions
other than combustion. Such reactions occur, for
example, in the processes of mineral production (e.g.,
lime, cement), metal production (e.g., iron, steel,
aluminium) and chemical production (e.g., nitric acid
and ammonia production).
2.4 Reported GHG Emissions by Province/Territory
Facilities in the province of Alberta accounted for the
largest share of reported emissions, with approximately
53% of the total, followed by facilities in Ontario with
Figure 5: Reported 2015 GHG Emissions by Source (CO2, CH4 and N2O Included)
StationaryFuel
Combustion77%
Venting2%
Flaring2%
Fugitive Sources2%
On-site Transportation
2%
Waste2%
Wastewater0.2%
Total CO2, CH4 andN2O Emissions263 Mt CO2 eq
IndustrialProcesses
13%
Note: Totals may not add up due to rounding.
Overview of Reported 2015 Emissions 9
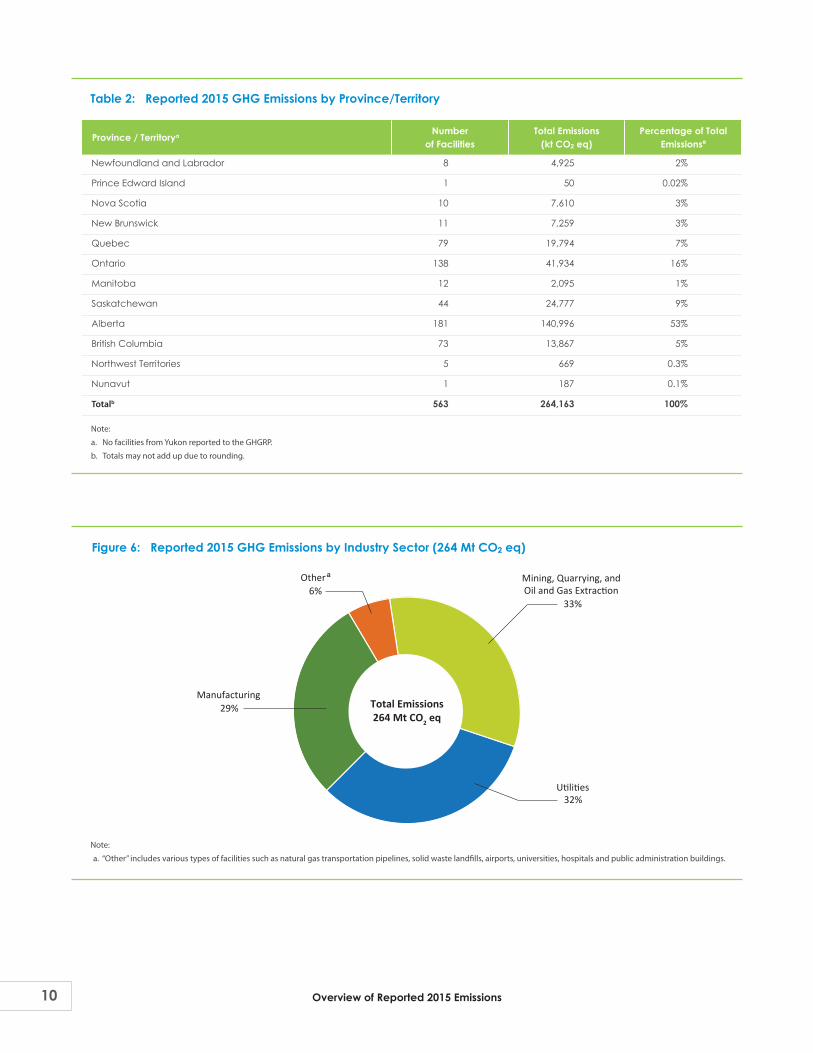
Table 2: Reported 2015 GHG Emissions by Province/Territory
Province / Territorya Number of Facilities
Total Emissions (kt CO2 eq)
Percentage of Total Emissionsª
Newfoundland and Labrador 8 4,925 2%
Prince Edward Island 1 50 0.02%
Nova Scotia 10 7,610 3%
New Brunswick 11 7,259 3%
Quebec 79 19,794 7%
Ontario 138 41,934 16%
Manitoba 12 2,095 1%
Saskatchewan 44 24,777 9%
Alberta 181 140,996 53%
British Columbia 73 13,867 5%
Northwest Territories 5 669 0.3%
Nunavut 1 187 0.1%
Totalb 563 264,163 100%
Note:
a. No facilities from Yukon reported to the GHGRP.
b. Totals may not add up due to rounding.
Figure 6: Reported 2015 GHG Emissions by Industry Sector (264 Mt CO2 eq)
Mining, Quarrying, and Oil and Gas Extraction
33%
Manufacturing29%
Otherª6%
Total Emissions264 Mt CO2 eq
Utilities32%
Note:
a. “Other” includes various types of facilities such as natural gas transportation pipelines, solid waste landfills, airports, universities, hospitals and public administration buildings.
Overview of Reported 2015 Emissions10
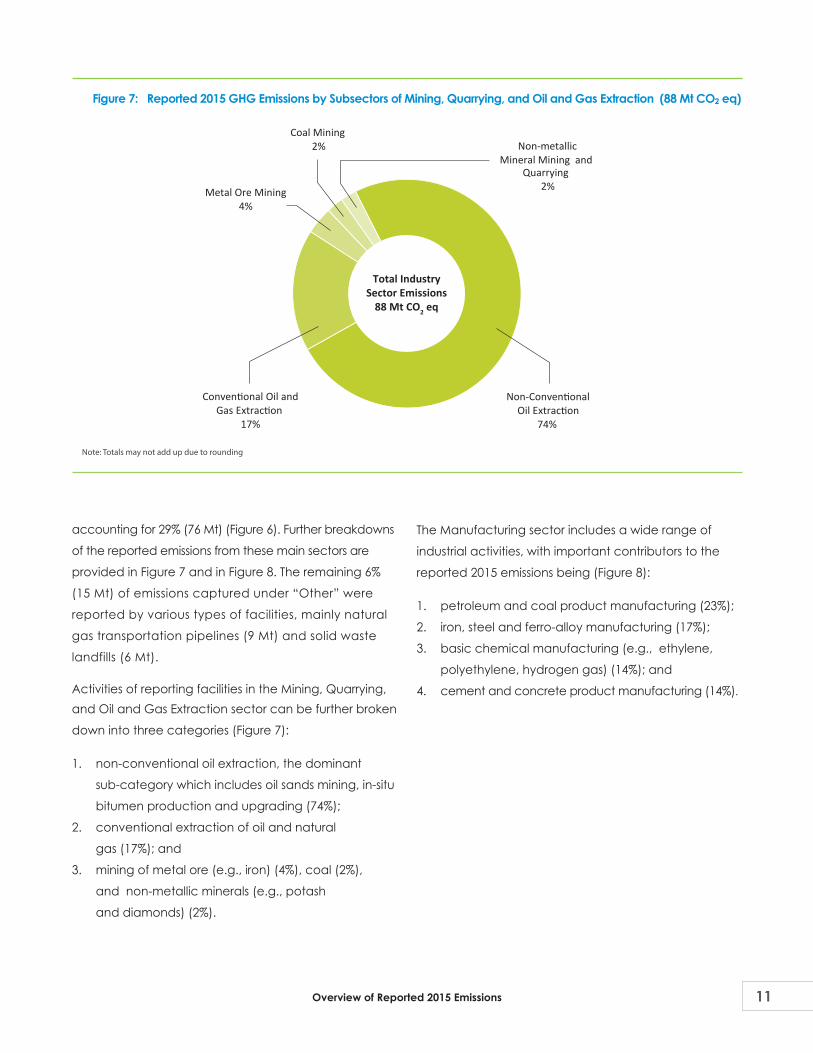
accounting for 29% (76 Mt) (Figure 6). Further breakdowns
of the reported emissions from these main sectors are
provided in Figure 7 and in Figure 8. The remaining 6%
(15 Mt) of emissions captured under “Other” were
reported by various types of facilities, mainly natural
gas transportation pipelines (9 Mt) and solid waste
landfills (6 Mt).
Activities of reporting facilities in the Mining, Quarrying, and Oil and Gas Extraction sector can be further broken
down into three categories (Figure 7):
1. non-conventional oil extraction, the dominant
sub-category which includes oil sands mining, in-situ
bitumen production and upgrading (74%);
2. conventional extraction of oil and natural
gas (17%); and
3. mining of metal ore (e.g., iron) (4%), coal (2%),
and non-metallic minerals (e.g., potash
and diamonds) (2%).
The Manufacturing sector includes a wide range of
industrial activities, with important contributors to the
reported 2015 emissions being (Figure 8):
1. petroleum and coal product manufacturing (23%);
2. iron, steel and ferro-alloy manufacturing (17%);
3. basic chemical manufacturing (e.g., ethylene,
polyethylene, hydrogen gas) (14%); and
4. cement and concrete product manufacturing (14%).
Figure 7: Reported 2015 GHG Emissions by Subsectors of Mining, Quarrying, and Oil and Gas Extraction (88 Mt CO2 eq)
Non-Conventional Oil Extraction
74%
Conventional Oil and Gas Extraction
17%
Metal Ore Mining4%
Coal Mining2% Non-metallic
Mineral Mining and Quarrying
2%
Total IndustrySector Emissions
88 Mt CO2 eq
Note: Totals may not add up due to rounding
Overview of Reported 2015 Emissions 11

TRENDS IN REPORTED GHG EMISSIONSThe number of facilities reporting GHG emissions to
Environment and Climate Change Canada can
change from year to year. Changes in production levels,
processes and technologies, the types of fuels used at
a facility, and facility start-ups/closures can all result in
a change in the annual emissions reported, so that a
facility may fall below or attain the reporting threshold of
50 kt CO2 eq. from one year to the next. The number of
voluntary reporters may also change each year, which
can also affect the number of reporting facilities.
Over the 2005–2015 period, the number of report-
ing facilities increased from 337 to 563 (Table 3).
Since 2009, facilities with emissions under 100 kt have
accounted, on average, for just over 5% of the total
reported emissions. Consequently, emissions from
3 these facilities do not contribute significantly to the
observed trends in total reported emissions at the
national level; however, these facilities may affect the
observed trends at the provincial/territorial levels.
3.1 Overall National-Level Trends
Total reported GHG emissions in 2015, at 264 Mt, were
essentially unchanged from 2014 (Table 3).9 Over
the 2005-2015 period, total facility-reported emissions
decreased overall by 5% (14 Mt), from 278 to 264 Mt. In
contrast with the decadal trend, total emissions over
the last five years increased by 3% (8 Mt). The number
of facilities reporting their emissions has consistently
increased over the last several years, following an initial
increase of more than 50% in 2009 when the reporting
9 A number of facilities submitted new reports or updates to GHG reports for previous years. Environment and Climate Change Canada includes these updates in its annual data release, resulting in some revisions to previously published data.
Figure 8: Reported 2015 GHG Emissions by Subsectors of Manufacturing (76 Mt CO2 eq)
8
Wood Products and Paper6%
Petroleum and Coal Products
23%
Lime and Gypsum Products
3%
Non-Ferrous Metal (except Aluminium)Production and Processinga
2%
Other Manufacturingb
3%Total IndustrySector Emissions
76 Mt CO2 eq
Alumina and Aluminium Production and Processing
9%
Iron and Steel Mills and Ferro-Alloys
17%
Basic Chemicals14%
Pesticide, Fertilizer, Other Agricultural
Chemicals 8%
Cement and Concrete Products
14%
Food, Beverage and Tobacco Products
1%
a. Non-ferrous Metal (except Aluminium) Production and Processing includes the production of base metals (e.g. copper, nickel, zinc).b. “Other Manufacturing” represents other types of manufacturing, including electrical equipment, transportation equipment and furniture manufacturing.
Overview of Reported 2015 Emissions12
threshold was changed from 100 to 50 kt. However,
overall GHG emissions did not increase accordingly:
their variations are mainly driven by the evolution of
important industrysectors and the influence of the
largest emitters (i.e. emissions above 100 kt) (Figure 2).
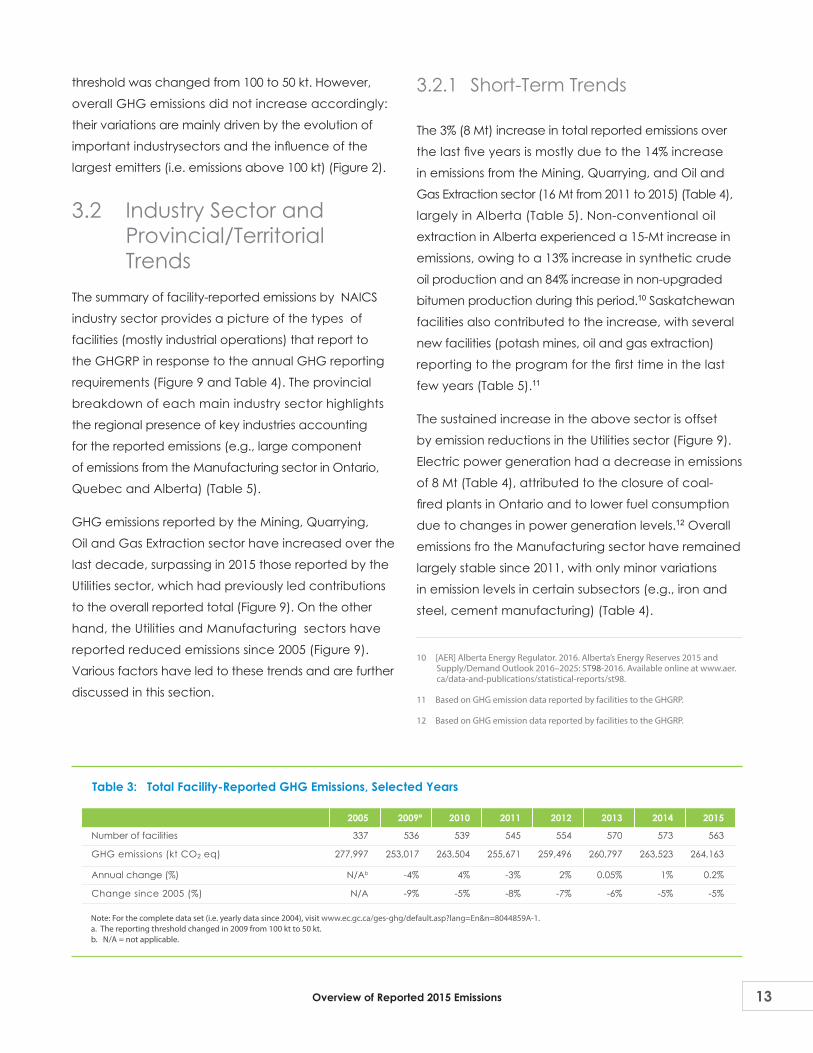
3.2 Industry Sector and Provincial/Territorial Trends
The summary of facility-reported emissions by NAICS
industry sector provides a picture of the types of
facilities (mostly industrial operations) that report to
the GHGRP in response to the annual GHG reporting
requirements (Figure 9 and Table 4). The provincial
breakdown of each main industry sector highlights
the regional presence of key industries accounting
for the reported emissions (e.g., large component
of emissions from the Manufacturing sector in Ontario,
Quebec and Alberta) (Table 5).
GHG emissions reported by the Mining, Quarrying,
Oil and Gas Extraction sector have increased over the
last decade, surpassing in 2015 those reported by the
Utilities sector, which had previously led contributions
to the overall reported total (Figure 9). On the other
hand, the Utilities and Manufacturing sectors have
reported reduced emissions since 2005 (Figure 9).
Various factors have led to these trends and are further
discussed in this section.
3.2.1 Short-Term Trends
The 3% (8 Mt) increase in total reported emissions over
the last five years is mostly due to the 14% increase
in emissions from the Mining, Quarrying, and Oil and
Gas Extraction sector (16 Mt from 2011 to 2015) (Table 4),
largely in Alberta (Table 5). Non-conventional oil
extraction in Alberta experienced a 15-Mt increase in
emissions, owing to a 13% increase in synthetic crude
oil production and an 84% increase in non-upgraded
bitumen production during this period.10 Saskatchewan
facilities also contributed to the increase, with several
new facilities (potash mines, oil and gas extraction)
reporting to the program for the first time in the last
few years (Table 5).11
The sustained increase in the above sector is offset
by emission reductions in the Utilities sector (Figure 9).
Electric power generation had a decrease in emissions
of 8 Mt (Table 4), attributed to the closure of coal-
fired plants in Ontario and to lower fuel consumption
due to changes in power generation levels.12 Overall
emissions fro the Manufacturing sector have remained
largely stable since 2011, with only minor variations
in emission levels in certain subsectors (e.g., iron and
steel, cement manufacturing) (Table 4).
10 [AER] Alberta Energy Regulator. 2016. Alberta’s Energy Reserves 2015 and Supply/Demand Outlook 2016–2025: ST98-2016. Available online at www.aer. ca/data-and-publications/statistical-reports/st98.
11 Based on GHG emission data reported by facilities to the GHGRP.
12 Based on GHG emission data reported by facilities to the GHGRP.
Table 3: Total Facility-Reported GHG Emissions, Selected Years
2005 2009ª 2010 2011 2012 2013 2014 2015
Number of facilities 337 536 539 545 554 570 573 563
GHG emissions (kt CO2 eq) 277,997 253,017 263,504 255,671 259,496 260,797 263,523 264,163
Annual change (%) N/Ab -4% 4% -3% 2% 0.05% 1% 0.2%
Change since 2005 (%) N/A -9% -5% -8% -7% -6% -5% -5%
Note: For the complete data set (i.e. yearly data since 2004), visit www.ec.gc.ca/ges-ghg/default.asp?lang=En&n=8044859A-1.a. The reporting threshold changed in 2009 from 100 kt to 50 kt.b. N/A = not applicable.
Overview of Reported 2015 Emissions 13
3.2.2 Long-Term TrendsOver the 2005-2015 period, total reported emissions
decreased by 5% (14 Mt). The major long-term trends
are similar to the short-term trends in that, since 2005,
emissions from facilities in the Utilities and Manufacturing
sectors have declined overall, while emissions from
the Mining, Quarrying, and Oil and Gas Extraction
sector have steadily increased (Figure 9).
Up to and including the year 2014, the Utilities sector
consistently accounted for the largest portion of
reported emissions (Figure 9), with electric power
generation being the main contributor. Emissions
from fossil-fuel electric power generation fell
significantly (38 Mt) over this period (Table 4), largely
the result of a shut-down of all coal-fired electricity production in Ontario as well as emission reductions
in New Brunswick, Nova Scotia and Alberta (Table 5).
Fuel switching (i.e., from coal to natural gas, a lower
carbon fuel) and increased reliance on hydro, nuclear
and renewable sources of generation are also con-
tributors to the decrease in emissions.13
Emissions from the Manufacturing sector remain well
below their 2005 levels (Figure 9), with an 18% reduction
(16 Mt). The industry continues to rebound from the
reduced production and slowdowns associated
with the 2009 recession,14 with manufacturing sales
steadily increasing and surpassing 2006 levels in 2014.15
Between 2005 and 2015, Ontario and Quebec showed
the largest decreases in GHG emissions from the
Manufacturing sector.
Ontario saw a net decrease of 11 Mt (Table 5),
largely observed in iron/steel, cement, and chemical
13 Statistics Canada CANSIM 2008-2015, Table 127-0002: Electric power generation, by class of electricity producer (annual).
14 Based on GHG emission data reported by facilities to the GHGRP.
15 Statistics Canada, Manufacturing: The year 2015 in review. Available online at www.statcan.gc.ca/daily-quotidien/161027/dq161027b-eng.htm.
Figure 9: Long-Term Sectoral Trend, 2005–2015a
0
20
40
60
80
100
120
140
160
2005 2006 2007 2008 2009 2010 2011 2012 2013 2014 2015
Repo
rted
GHG
Em
issi
ons (
Mt C
O2
eq)
Mining, Quarrying, and Oil and Gas Extraction Utilities Manufacturing Other
a. Other - not a NAICS sector but a grouping of various NAICS codes reported by the following types of facilities: natural gas transportation pipelines, solid waste landfills, airports and institutional facilities (universities, hospitals and public administration buildings).
Overview of Reported 2015 Emissions14
manufacturing (e.g., halted adipic acid production in 2009) (Table 4). Quebec showed an overall decrease in emissions of 3 Mt from 2005 to 2015 (Table 5), with aluminium production and petroleum refining facilities contributing the most to this pro-vincial change (Table 4). Emission decreases in aluminium production resulted from technological
change16,17,18 the closure of aluminium smelters in Quebec, and the conversion of a petroleum refinery to a storage terminal.
16 Based on GHG emission data reported by facilities to the GHGRP.
17 Environment Canada. 2008. Environmental Performance Agreement Concerning Atmospheric Emissions of Polycyclic Aromatic Hydrocarbons between EC and Alcoa. Available online at www.ec.gc.ca/epe-epa/default.asp?lang=En&n=3C7FB073-1.
18 Environment Canada. 2008. Environmental Performance Agreement Concerning Atmospheric Emissions of Polycyclic Aromatic Hydrocarbons between EC and Rio Tinto Alcan. Available online at www.ec.gc.ca/epe-epa/default.asp?lang= En&n=5BE979CD-1.
Table 4: Reported GHG Emissions by NAICS Industry Sector, Selected Years
NAICSa Industry Sector(Units: Mt CO2 eq)
2005 2009 a 2010 2011 2012 2013 2014 2015
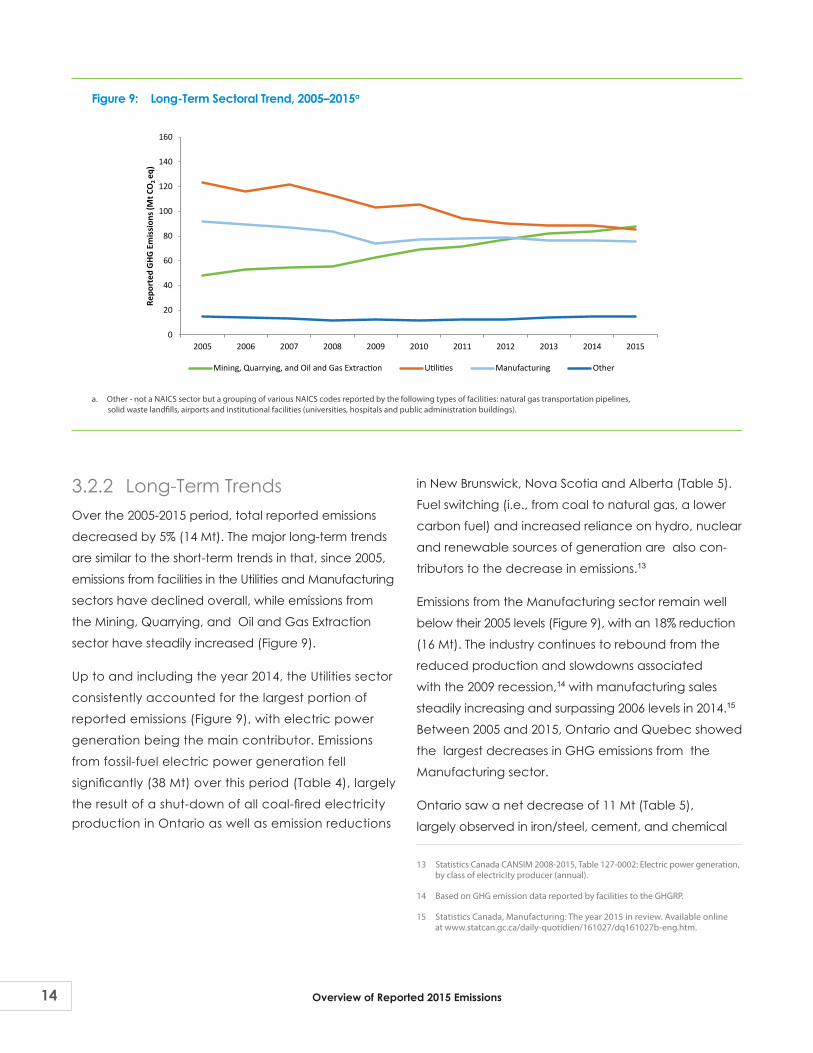
Totalb 278 253 264 256 259 261 264 26421 - Mining, Quarrying, and Oil and Gas Extractionb 48 62 69 72 78 82 84 88
Conventional oil and gas extraction 14 15 15 15 14 15 16 15Non-conventional oil extractiond 28 42 47 49 55 59 61 65Coal mining 2 2 3 3 3 3 3 2Metal ore mining 3 3 3 3 4 4 3 3Non-metallic mineral mining and quarrying 0.8 1 1 2 2 2 2 2
22 - Utilitiesb 123 103 106 94 90 89 89 86Electric power generation 122 101 103 92 88 86 87 84Natural gas distribution 1 2 2 2 2 2 2 1Water, sewage and other systemse 0.1 0.5 0.4 0.5 0.5 0.5 0.5 0.5
31-33 Manufacturingc 92 74 77 78 79 76 76 76Food, beverage, and tobacco products 0.3 0.7 0.8 0.7 0.7 0.7 0.8 0.8Wood products and paper 5 4 4 5 5 5 5 5Petroleum and coal products 20 19 18 17 18 17 17 17Basic chemicals 13 11 10 11 11 11 11 11Pesticide, fertilizer, other agricultural chemicals 6 5 6 6 6 6 6 6Cement and concrete products 13 9 10 10 11 10 10 11Lime and gypsum products 3 2 2 2 2 2 2 2Iron and steel mills and ferro-alloys 17 11 14 14 15 13 14 13Primary production of alumina and aluminium 10 8 8 8 8 8 7 7Non-ferrous metal (except alum.) smelting and refining 3 2 2 2 2 2 2 2Other manufacturingf 0.7 2 2 2 2 2 2 2
Otherc,g 15 13 12 12 13 14 15 15Pipeline transportation of natural gas 12 7 6 7 6 8 9 9Support activities for air transportation N/A 0.1 0.07 0.07 0.06 0.05 0.06 0.09Waste management and remediation services 3 5 5 5 5 5 5 6Institutional facilities N/A 0.4 0.5 0.5 0.7 0.6 0.6 0.7
Notes:a. Facilities required to report to the GHGRP provide a primary NAICS code that describes the main activities occurring at the facility.b. The reporting threshold changed in 2009 from 100 kt to 50 kt.c. Totals may not add up due to rounding.d. Includes facilities engaged in oils sands mining, in-situ bitumen production and upgrading.e. Includes sewage treatment facilities, heating and steam generation plants.f. Not a NAICS sector but a grouping of various NAICS codes reported by facilities engaged in other types of manufacturing such as Electrical Equipment, Transportation Equipment
and Furniture Manufacturing.g. Not a NAICS sector but a grouping of various NAICS codes reported by the following types of facilities: natural gas transportation pipelines, solid waste landfills,
airports and institutional facilities (universities, hospitals and public administration buildings).N/A = not available.
Overview of Reported 2015 Emissions 15
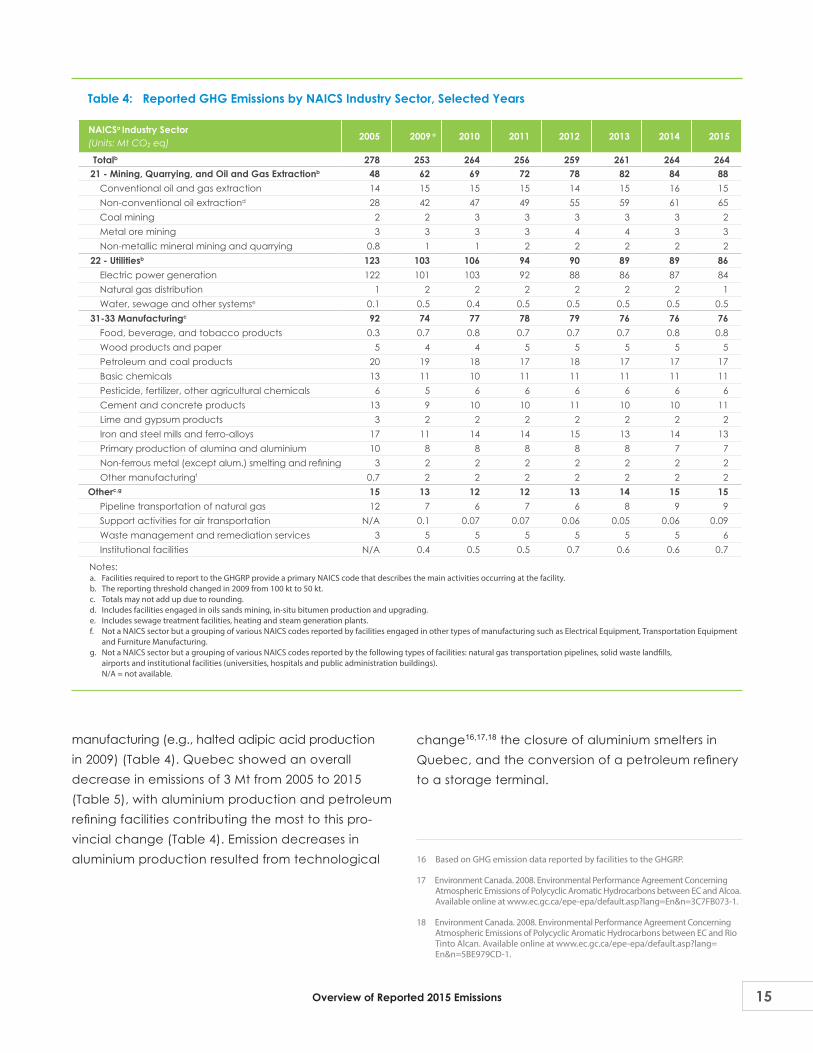
Table 5: Reported GHG Emissions by Province/Territory, Selected Years
Industry SectorProvince / Territory(Units: Mt CO2 eq)
2005 2009 a 2010 2011 2012 2013 2014 2015
Totalc 278 253 264 256 259 261 264 264
21 - Mining, Quarrying, and Oil and Gas Extractionb 48 62 69 72 78 82 84 88Newfoundland and Labrador 3 3 3 3 3 3 3 3
Nova Scotia N/Ac 0.3 0.3 0.2 0.2 0.4 0.5 0.4
New Brunswick N/A N/A 0.06 0.06 0.06 0.02 N/A 0.06
Quebec 2 1 2 2 2 2 2 2
Ontario 0.2 0.2 0.2 0.1 0.1 0.3 0.3 0.3
Manitoba N/A 0.06 0.05 0.1 0.2 0.2 0.08 0.08
Saskatchewan 3 3 3 3 4 4 4 5
Alberta 35 50 54 56 62 65 67 71
British Columbia 5 5 6 6 7 7 7 6
Northwest Territories 0.4 0.5 0.5 0.6 0.5 0.6 0.6 0.6
Nunavut N/A N/A 0.1 0.2 0.2 0.2 0.2 0.2
22 - Utilitiesb 123 103 106 94 90 89 89 86Newfoundland and Labrador 1 0.8 0.7 0.7 0.7 0.8 1 1
Nova Scotia 11 9 9 9 8 8 7 7
New Brunswick 9 6 5 4 4 4 4 4
Quebec 0.5 1 0.5 0.6 0.5 0.4 0.4 0.4
Ontario 36 20 25 18 18 15 10 10
Manitoba 0.6 0.2 0.06 0.08 0.07 0.09 0.07 0.1
Saskatchewan 15 16 16 15 16 15 15 16
Alberta 50 48 48 46 44 44 49 47
British Columbia 2 2 2 0.9 0.9 1 1 0.8
Northwest Territories N/A 0.06 N/A N/A N/A N/A N/A 0.06
31-33 Manufacturingb 92 74 77 78 79 76 76 76Newfoundland and Labrador 1 1 1 0.9 1 0.9 1.0 1
Prince Edward Island 0.1 0.07 0.06 0.07 0.05 0.06 0.06 0.05
Nova Scotia 1 1 1 1 1 1 0 0
New Brunswick 4 4 4 4 4 4 3 4
Quebec 20 17 18 17 17 17 17 17
Ontario 38 26 27 28 29 27 28 27
Manitoba 1 1 1 1 1 1 1 1
Saskatchewan 2 2 3 2 3 3 3 3
Alberta 18 17 17 18 18 18 18 19
British Columbia 6 5 5 5 5 5 5 5
Otherb,d 15 13 12 12 13 14 15 15Nova Scotia N/A 0.06 0.04 0.04 N/A N/A N/A N/A
Quebec 0.3 0.9 1 0.8 1 1 1 1
Ontario 5 4 3 4 3 4 4 5
Manitoba 1 0.7 0.7 0.7 0.6 0.7 0.8 0.9
Saskatchewan 3 2 2 2 2 2 2 2
Alberta 4 3 3 3 4 4 4 4
British Columbia 1 2 2 2 2 2 2 2 Notes:
a. The reporting threshold changed in 2009 from 100 kt to 50 kt.b. Totals may not add up due to rounding.c. N/A = not available.d. “Other” includes various types of facilities such as natural gas transportation pipelines, solid waste landfills, airports, universities, hospitals and public administration buildings. Note: For the complete data set (i.e. yearly data since 2004), visit the website at www.ec.gc.ca/ges-ghg/default.asp?lang=En&n=8044859A-1.
Overview of Reported 2015 Emissions16
The Mining, Quarrying, and Oil and Gas extraction
sector has shown an increasing trend over the last
decade (Figure 9) to become the dominant emitting
sector in 2015. Most of the increase (40 Mt between
2005 and 2015) was driven by non-conventional oil
extraction facilities in Alberta (36 Mt growth since
2005), Saskatchewan and British Columbia, reflecting
this sector’s steady growth trend.
FACILITY- REPORTED EMISSIONS AND THE NATIONAL GHG INVENTORYThe total facility-reported GHG emissions for 2015
collected under the GHGRP represent just over one
third (37%) of Canada’s total GHG emissions in 2015
(722 Mt) and over half (58%) of Canada’s industrial
4
GHG emissions,19 as reported in Canada’s latest National Inventory Report (NIR).20 The GHGRP applies to the largest GHG-emitting facilities (mostly industrial) and does not cover other sources of GHG emissions (e.g., road transportation, agricultural sources), whereas the NIR is a complete accounting of all GHG sources and sinks in Canada.
When comparing the provincial and territorial contri-bution to the facility-reported total from the GHGRP with the national total from the NIR, the distribution of emissions by province shows a similar pattern (Figure 10). Alberta has the highest emissions, followed by Ontario, Quebec and Saskatchewan. This pattern of industrial emissions reflects the regional concentra-tion of large industrial facilities and trends in the use of fossil fuels for energy production.
19 In this overview report, Canada’s industrial GHG emissions include emissions from the following GHG categories from the National Inventory Report 1990–2015: Greenhouse Gas Sources and Sinks in Canada: Stationary Combustion Sources (except Residential), Other Transportation, Fugitive Sources, Industrial Processes and Product Use, and Waste.
20 Canada’s latest NIR, the National Inventory Report: Greenhouse Gas Sources and Sinks in Canada 1990–2015. Available online at: www.ec.gc.ca/ges-ghg/ default.asp?lang=En&n=83A34A7A-1.
Figure 10: Provincial/Territorial Contribution to 2015 Facility-Reported (GHGRP) Total and NIR Totala
0
50 000
100 000
150 000
200 000
250 000
300 000
NL PE NS NB QC ON MB SK AB BC NT NU
GH
G E
mis
sion
s (kt
CO
2 eq
)
Greenhouse Gas Emissions Reporting Program National Inventory Report
Province/Territory
a. No facilities from Yukon reported to the GHGRP.
Overview of Reported 2015 Emissions 17
Although the facility-reported emissions may capture 58% of industrial GHG emissions nationally, the degree of coverage at the provincial level varies significantly from province to province (Figure 11), due to the size and number of industrial facilities in each province
that have emissions above the 50 kt CO2 eq.
reporting threshold.
Where appropriate, the facility-reported emissions
data are used by Environment and Climate Change
Canada to confirm inventory estimates developed
from national and provincial statistics in the NIR. The
NIR is produced and submitted annually by Canada
to the UNFCCC. The extent to which the facility-
reported GHG emissions data could be fully integrated
into the NIR is dependent on the level of detail and
type of data available.
ADDITIONAL INFORMATION ABOUT THE GHGRP
5.1 Data QualityFacilities that meet the GHG reporting requirements
under the GHGRP must ensure that the reported data
are reliable. Facilities are required by law to submit
information that is true, accurate and complete to the
best of their knowledge. CEPA sets out penalties for
companies that fail to report or that knowingly submit
false or misleading information. Reporters have a legal
obligation to keep copies of the information submit-
ted, along with any calculations, measurements
and other data on which the information is based. All
information must be kept for a period of three years
from the date on which it was required to be reported
to Environment and Climate Change Canada.
5
Figure 11: 2015 Facility-Reported Emissions as a Percentage of National and Provincial/Territorial Industrial GHG Emissions (from the NIR)a,b
0%
10%
20%
30%
40%
50%
60%
70%
80%
90%
100%
NL PE NS NB QC ON MB SK AB BC YT, NT,NU
National
Perc
ent o
f Tot
al In
dust
rial E
mis
sion
s
Province/TerritoryGreenhouse Gas Emissions Reporting Program National Inventory Report
a. In this overview report, Canada’s industrial GHG emissions include the following GHG categories from the National Inventory Report 1990–2015: Greenhouse Gas Sources and Sinks in Canada: Stationary Combustion Sources (except Residential), Other Transportation, Fugitive Sources, Industrial Processes and Product Use, and Waste. b. No facilities from Yukon reported to the GHGRP.
Overview of Reported 2015 Emissions18
The data provided in this report are for information purposes only. Environment and Climate Change Canada conducted a number of data quality checks of the submitted data for compliance purposes and for completeness, and it will continue to analyze the data,
which may result in periodic updates.
5.2 Public AccessThe GHGRP provides public access to information from all facilities that reported GHG emissions to the program through an annual online publication. In addition to this summary report, the facility-level data are presented in the form of tables, a searchable database and a downloadable format. Users can search by emissions of a specific gas or emissions of all gases, by facility name or National Pollutant Release Inventory (NPRI) identification number, by reporting company, by province/territory or city, or by industry sector, using the NAICS21 code. Users can also access a web-based mapping tool on the Canadian Environmental Sustainability Indicators website, which shows where reporting facilities are located in Canada.
To access the data or obtain further information on the GHGRP or National Greenhouse Gas Inventory program, consult the following websites:
Reported Facility GH G Datawww.ec.gc.ca/ges-ghg/defaultasp?lang=En&n=8044859A-1
Reporting to the GHGRPwww.ec.gc.ca/ges-ghg/defaultasp?lang=En&n=F3E7B38E-1
Canada’s National GHG Inventorywww.ec.gc.ca/ges-ghg/defaultasp?lang=En&n=83A34A7A-1
Canadian Environmental Sustainability Indicatorswww.ec.gc.ca/indicateurs-indicators/default.asp?lang=en&n=31022B8E-1
21 The NAICS is an industry classification system that was developed by the statistics agencies of Canada, the United States and Mexico to enable them to collect comparable statistical data. It is a comprehensive system that encompasses all economic activities using six-digit codes. In Canada, the NAICS consists of 20 sectors, 102 subsectors, 323 industry groups, 711 industries and 922 national industries.
5.3 Links to Other ProgramsThe GHGRP is similar to, yet distinct from, the NPRI. Al-though both programs are delivered by Environment and Climate Change Canada under the authority of section 46 of CEPA, the NPRI collects data from facilities on pollutant releases (to air, water and land), disposals and transfers for recycling, whereas the GHGRP collects data from facilities on GHG emissions. Facilities reporting to the GHGRP are asked to report their NPRI identifica-tion number to facilitate searching and comparison of emissions from facilities that report to both programs.
A number of provincial jurisdictions also require facilities to report GHG emissions information annually under specific provincial regulations. Efforts have been undertaken to streamline the reporting process between the national and various provincial jurisdictions, resulting in the launch of a single-window reporting system to help reduce the reporting burden on industry and the overall cost to government. This single-window system allows one-time entry for information commonly required at both levels, while accommodating requirements that are jurisdiction-specific. Provinces currently using this reporting system include Alberta,
British Columbia, Ontario and New Brunswick.
CONTACT US
If you have questions about this report or for more information about its content, please contact the GHGRP:
Environment and Climate Change CanadaGreenhouse Gas Emissions Reporting Program
Place Vincent Massey, 7th Floor
351 St. Joseph Boulevard
Gatineau, Quebec K1A 0H3
E-mail: [email protected]
GHG Helpline: 1-819-938-3258
Toll free: 1-877-877-8375 Website: www.ec.gc.ca/ges-ghg
6
Overview of Reported 2015 Emissions 19
Additional information can be obtained at:
Environment and Climage Change CanadaPublic Inquiries Centre7th Floor, Fontaine Building200 Sacré-Coeur BoulevardGatineau QC K1A 0H3Telephone: 1-800-668-6767 (in Canada only) or 819-997-2800Email: [email protected]