Embed Size (px)
Citation preview
1
Overview of Active Fault Researchat Geological Survey of Japan
Yasuo. AWATA and Toshikazu. YOSHIOKA
Active Fault Research Center,Geological Survey of Japan, AIST
UJNR, November 10, 2006, Tokushima

2
Main Subjects on Active Fault Research
Paleoseismological investigation
Segmentation and scaling relations
Prediction of earthquake magnitude

3
Paleoseismological Investigation

4
Active Fault Research Project in Japan, 1st Stage
■1995 to 2004 FY
5
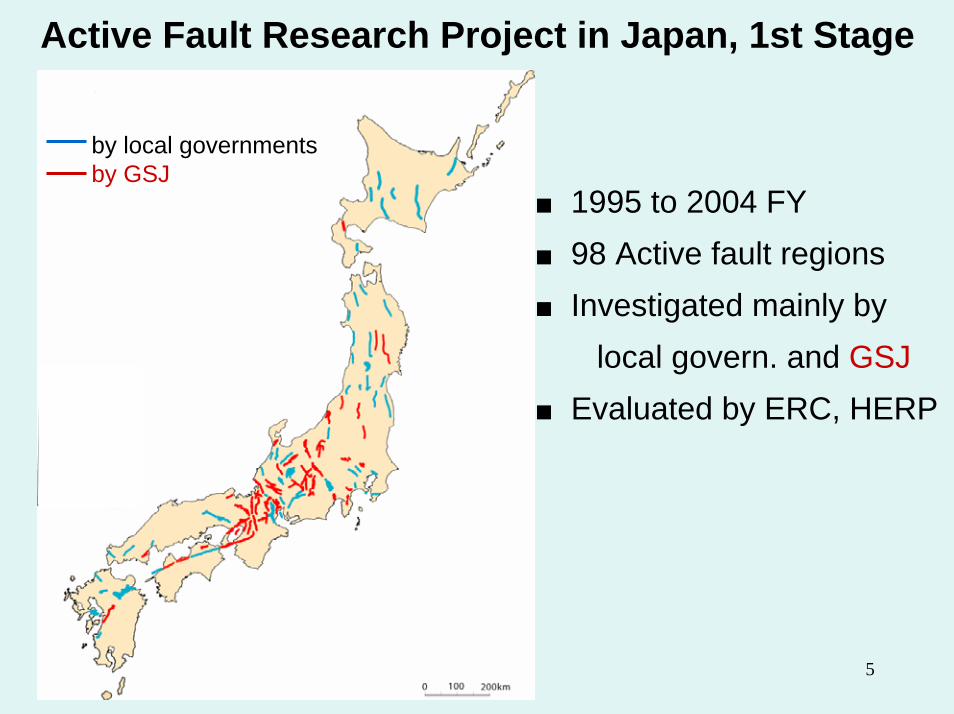
Active Fault Research Project in Japan, 1st Stage
■1995 to 2004 FY■98 Active fault regions■ Investigated mainly by
local govern. and GSJ■Evaluated by ERC, HERP
by local governmentsby GSJ

6
Probabilistic Shaking Map for Coming 30 Years( ERC, 2005 )
Active faultsSubduction boundary
Other sources

7
Active Fault Research Project in Japan, 2nd Stage
■From 2005 FY
■18 faults re-investigated by GSJ, in 2005 - 2006
40 fault regions will bere-investigated
Improved segmentation and scaling relations will be used ?
by Local Govern.by GSJby GSJ’s budget
(from 2003)contract with MEXT
(2005 and 2006)
Nagamachi-Rifu F
Itoigawa-Shizuoka F
Tachikawa F
Kego F

8
Paleoseismicty of an Active Fault, Which Triggered during the 2004 Mid-Niigata Earthq.
Triggered surface rupture, with a slip of 0.2 m
Characteristic two faulting eventseach with a slip > 1.5 m

9
Prediction of “Most-Likely Earthquake-Segment”by ERC
5-km-thresould (Matsuda, 1990)Scaling relation between total rupture length and slip145 :Most likely earthquake segments12 :further segmented based on paloseismicity alone

10
Fault Segmentationand
New Scaling Relations

11
Behavioral Segment & Earthquake Segment
Time
Estimate the extent of behavior segment ?Probabilistic prediction of earthquake segment ?

12
Segmentation of 15 Surface Ruptures in Japan
Paleoseismicity, Rupture process, GeometrySegment length <= 35 kmJog and Gap >= 2 km

13
Scaling Relation : for Behavioral Segments
13 segments / in 6 ruptures
y = 0.1965xR2 = 0.905
0
5
10
15
0 20 40 60 80
Behavioral Segment Length (km)
strike-slip
Dmax =
2.0 x
10e-4
L
Japan (strike-slip)

14
Scaling Relation : for Behavioral Segments
y = 0.169x
y = 0.2047xy = 0.2028x
0
5
10
15
0 20 40 60 80
Behavioral Segment Length (km)
strike-slipreversenormal
World (all types)

15
Scaling Relation : for Behavioral Segments
y = 0.1965xR2 = 0.905
0
5
10
15
0 20 40 60 80
Behavioral Segment Length (km)
strike-slip
y = 0.169x
y = 0.2047xy = 0.2028x
0
5
10
15
0 20 40 60 80
Behavioral Segment Length (km)
strike-slipreversenormal
Dmax =
2.0 x
10e-4
L
Japan (strike-slip) World (all types)

16
Criteria for Behavioral Segment
Geometry :Jog & Gap >= 2 km :Bend >=20 deg.
Paleoseismicity :Timing of faulting event:Recurrence interval

17
Behavioral Segments - Fault Length
km431 behavioral segments
( Length >= 10 km ) ( Slip rate >= 0.1 mm/y )

18
Behavioral Segments - Fault Length
431 behavioral segments ( Length >= 10 km ) ( Slip rate >= 0.1 mm/y )
145 prob. earthq. segments.(by ERC, 2005)
290 behavioral segments

19
Behavioral Segments - Fault Length
Mostly <= 40 km

20
Fault Length v.s. Slip per Event
Dave. = 1.2 x 10e-4 L = ~ 0.6 Dmax

21
Prediction ofFuture Earthquake Segments

22
Prediction of Most Likely Earthquake Segments
Application of 5-km-thresould ( Matsuda, 1990 )
431 b-segments → 256 earthquake-segments

23
Scaling Relation : Between B- & E-Segments
Predicted

24
Scaling Relation : Between B- & E-Segments
Predicted

25
Scaling Relation : Between B- & E-Segments
Predicted
26
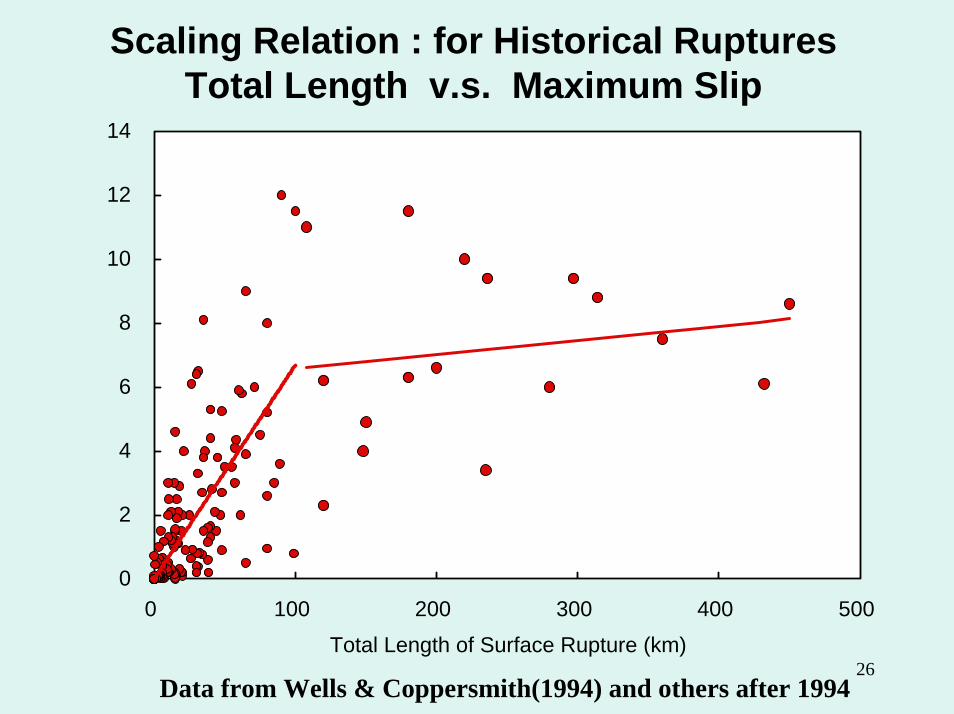
Scaling Relation : for Historical RupturesTotal Length v.s. Maximum Slip
0
2
4
6
8
10
12
14
0 100 200 300 400 500
Total Length of Surface Rupture (km)
Data from Wells & Coppersmith(1994) and others after 1994

27
Summary
We have been contributingto the Paleoseismological investigation.
We are workingon fault segmentation and new scaling relations
We have to attack to the problemson the probabilistic prediction of future earthquakes
( geology, mechanics of earthquake & faulting )

28
“Active Fault Database” at AFRC Website( http://www.aist.go.jp/RIODB/activefault/ )
500 segmentswith fault strand mapParameters of faultingSite information on long-term slip rate and paleoseismicity
Tokushima●

29
“Active Fault Database” at AFRC Website( http://www.aist.go.jp/RIODB/activefault/ )
Segmentation of MTLStrike N 80 EDip 45 NLength 52 kmSense of Faulting Right-lateral Upthrown Side North-sideSlip Rate 4 m/kySlip per Event 6.9 mRecurrence Interval 1.7 ky
AD 1500 to 1868 Age of Last FaultingAD 1596 (documented)
Elapsed-time Rate 0.18ca. 0 % by BPTRupture Probability
in Next 30 years ca. 2 % by Poisson
Chichio Segment
Tokushima●

302005 Kashmir Earthquake, PAK
Thank You for Your Attention


![Quantifying Anderson's fault types · 2019-11-12 · Quantifying Anderson's fault types Robert W. Simpson U.S. Geological Survey, Memo Park, California Abstract. Anderson [1905] explained](https://img.pdfslide.net/doc/110x75/5f1215d6e26dc925fc4b7c78/quantifying-andersons-fault-types-2019-11-12-quantifying-andersons-fault-types.jpg)


![[EUREGEO2015] Geological 3D modelling. Poster ... - icgc.cat · (VS2) Thrust Fault Fault Filón Sur ore-body San Dionisio ore-body B 3D geological map of “Cerro Colorado” open-pit](https://img.pdfslide.net/doc/110x75/5f5f392ee4d50253202e2c3e/euregeo2015-geological-3d-modelling-poster-icgc-vs2-thrust-fault-fault.jpg)