Embed Size (px)
Citation preview
Overview of D6 Highway Conditions and Future Projects
Presented by Lisa Vega, P.E. (Acting) District 6 Engineer

TAMP Project Selection Process• NMDOT uses a decentralized approach to project selection and prioritization of pavement and
bridge projects for inclusion in the Statewide Transportation Improvement Program (STIP).
• Since 2007, NMDOT has allocated federal-aid highway program funds to each District through a process commonly referred to as the District Target formulas. The formula is used to distribute National Highway Performance Program and Surface Transportation Block Grant Program funds to each district using a combination of lane miles, vehicle miles travelled and population after debt service and other reductions like the Statewide Planning & Research funds. In addition, funds for the consultant management program are reserved at a statewide basis and deducted prior to distributing the remaining funds to the Districts.
• The Highway Safety Improvement Program, Congestion Mitigation and Air Quality, Transportation Alternatives Program and Recreational Trails Program funds are distributed through project selection and prioritization processes on a statewide basis.
• The District Targets are determined by the STIP Unit and use an estimate for the obligation limitation each year. Each District is responsible for identifying the projects to be included in each new STIP.
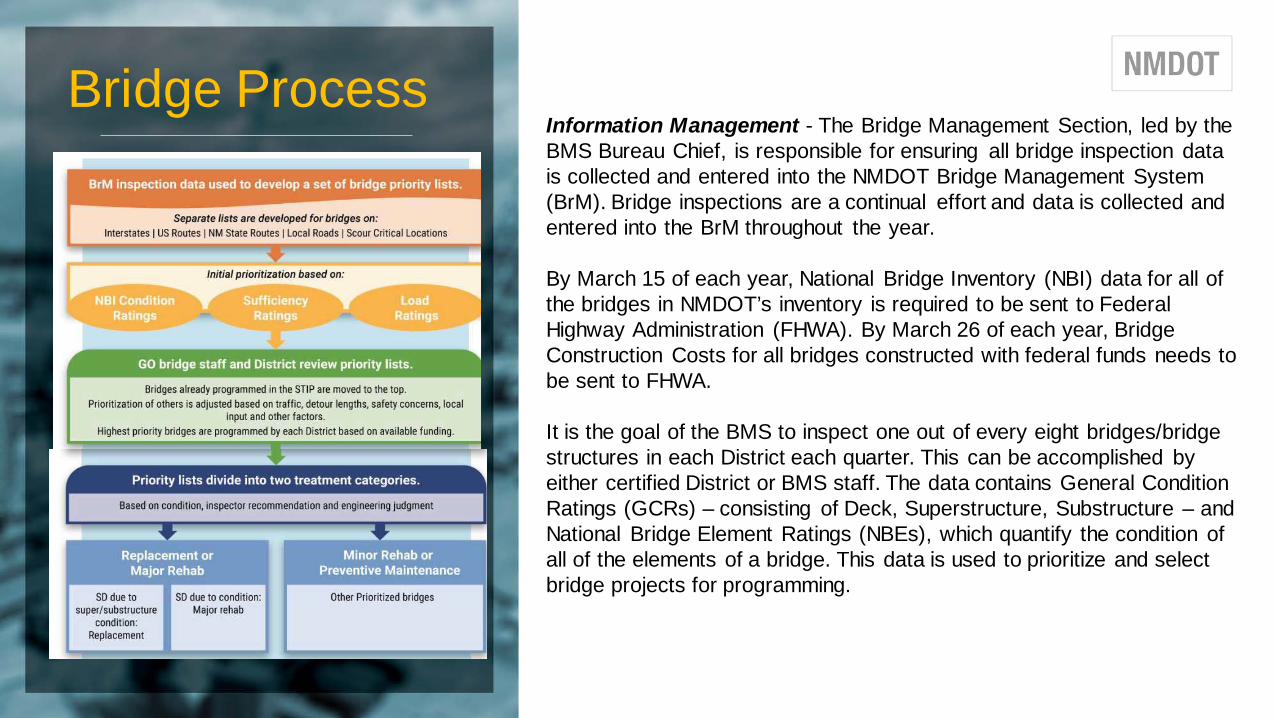
Bridge ProcessInformation Management - The Bridge Management Section, led by the BMS Bureau Chief, is responsible for ensuring all bridge inspection data is collected and entered into the NMDOT Bridge Management System (BrM). Bridge inspections are a continual effort and data is collected and entered into the BrM throughout the year.
By March 15 of each year, National Bridge Inventory (NBI) data for all of the bridges in NMDOT’s inventory is required to be sent to Federal Highway Administration (FHWA). By March 26 of each year, Bridge Construction Costs for all bridges constructed with federal funds needs to be sent to FHWA.
It is the goal of the BMS to inspect one out of every eight bridges/bridge structures in each District each quarter. This can be accomplished by either certified District or BMS staff. The data contains General Condition Ratings (GCRs) – consisting of Deck, Superstructure, Substructure – and National Bridge Element Ratings (NBEs), which quantify the condition of all of the elements of a bridge. This data is used to prioritize and select bridge projects for programming.
Performance Measures and Cost Estimates
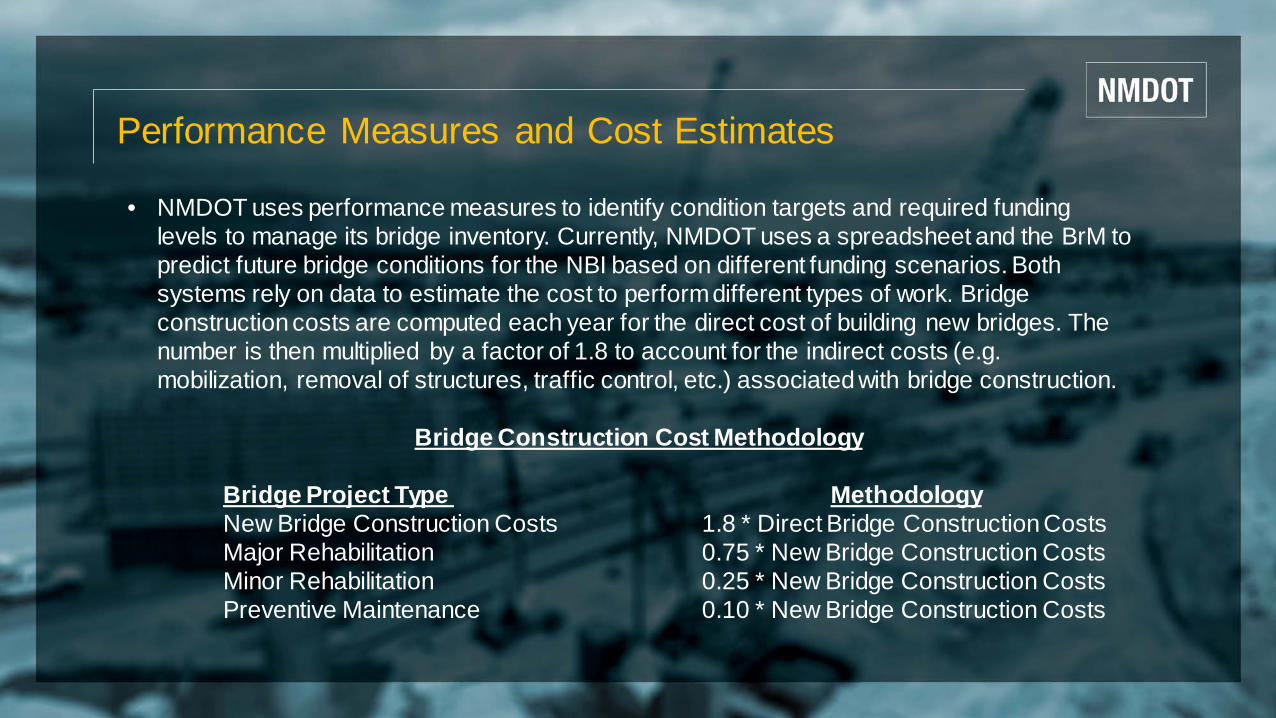
• NMDOT uses performance measures to identify condition targets and required funding levels to manage its bridge inventory. Currently, NMDOT uses a spreadsheet and the BrM to predict future bridge conditions for the NBI based on different funding scenarios. Both systems rely on data to estimate the cost to perform different types of work. Bridge construction costs are computed each year for the direct cost of building new bridges. The number is then multiplied by a factor of 1.8 to account for the indirect costs (e.g. mobilization, removal of structures, traffic control, etc.) associated with bridge construction.
Bridge Construction Cost Methodology
Bridge Project Type MethodologyNew Bridge Construction Costs 1.8 * Direct Bridge Construction CostsMajor Rehabilitation 0.75 * New Bridge Construction CostsMinor Rehabilitation 0.25 * New Bridge Construction CostsPreventive Maintenance 0.10 * New Bridge Construction Costs
Prioritization of Selection of Bridge Projects
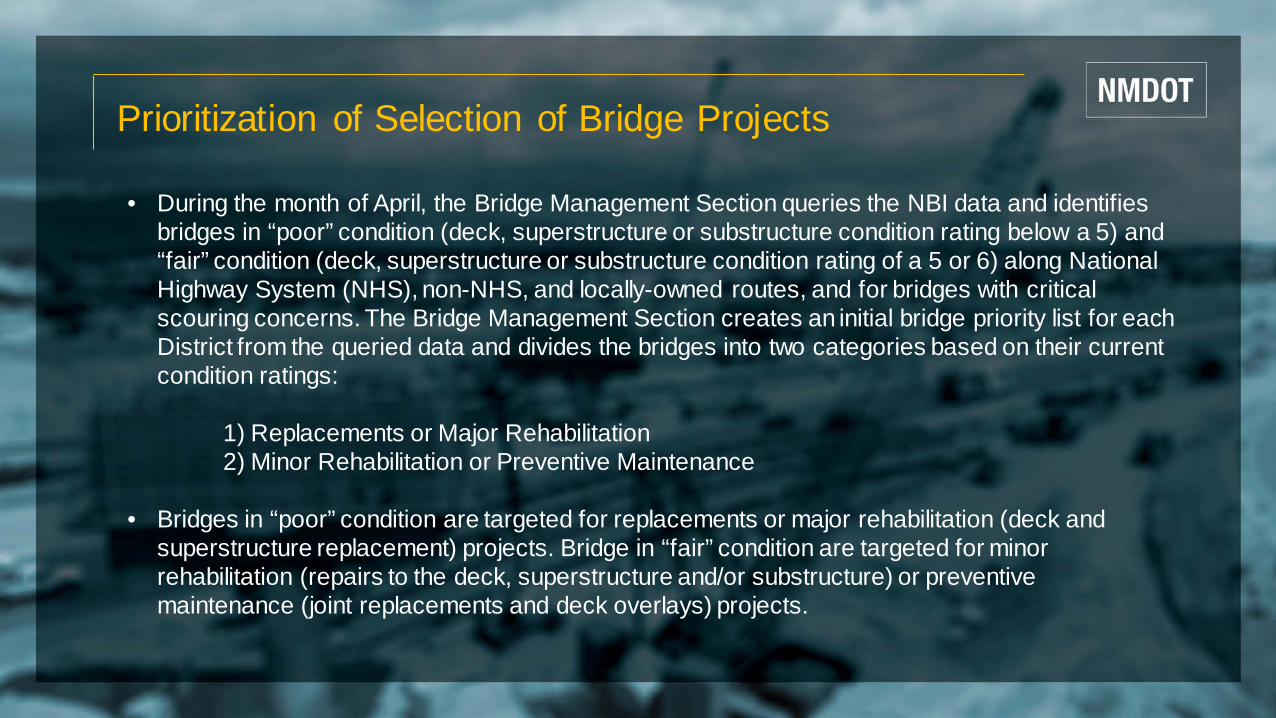
• During the month of April, the Bridge Management Section queries the NBI data and identifies bridges in “poor” condition (deck, superstructure or substructure condition rating below a 5) and “fair” condition (deck, superstructure or substructure condition rating of a 5 or 6) along National Highway System (NHS), non-NHS, and locally-owned routes, and for bridges with critical scouring concerns. The Bridge Management Section creates an initial bridge priority list for each District from the queried data and divides the bridges into two categories based on their current condition ratings:
1) Replacements or Major Rehabilitation2) Minor Rehabilitation or Preventive Maintenance
• Bridges in “poor” condition are targeted for replacements or major rehabilitation (deck and superstructure replacement) projects. Bridge in “fair” condition are targeted for minor rehabilitation (repairs to the deck, superstructure and/or substructure) or preventive maintenance (joint replacements and deck overlays) projects.
Prioritization of Selection of Bridge Projects (Continued)
• During the month of May, the Bridge Management Section meets with each District Bridge Section and/or Engineering Section to review the initial lists. Staff from each section consider National Bridge Inventory Condition Ratings, National Bridge Element Data, Sufficiency Rating, Health Index and load ratings.
• In addition, the STIP is reviewed to identify bridges that have been programmed and the priority lists are modified to move those projects to the top of the list. The remaining bridges are prioritized based on conditions, traffic, detour length, local input, and other factors. By the end of June, the Bridge Management Section and each District will finalize their priority lists.
Bridge Replacements and Major Rehabilitations
• Staff from each District and the Bridge Bureau identify and discuss all bridges that are in a “poor” condition.
• These bridges are targeted for either bridge replacement projects or major rehabilitation projects.
• Projects are selected based on severity of condition, criticality of route, available funding other projects being developed in the area, and other factors (some bridge replacement projects that are driven by bridge capacity rather than bridge condition).
• Bridge replacement and major rehabilitation projects are then programmed into the STIP.
Minor Rehabilitations and Bridge Preservation
• NMDOT allocates funding specifically for bridge preservation projects. This funding is divided among the six Districts, and the Bridge Bureau tracks this funding through Bridge Preservation lists.
• Throughout the year, the Bridge Management Section and the Districts select projects for programming for Bridge Preservation projects. Projects are generally funded for bridges rated fair in the bridge priority lists to avoid for these bridges becoming rated as “poor.”
• As projects are developed and designs are finalized, Project Development Engineers and Bridge Engineers assigned to the bridge project finalize quantities and cost estimates.
• Projects are then sent through the bidding process through the Plans, Specifications and Estimating (PSE) Bureau for award for construction.
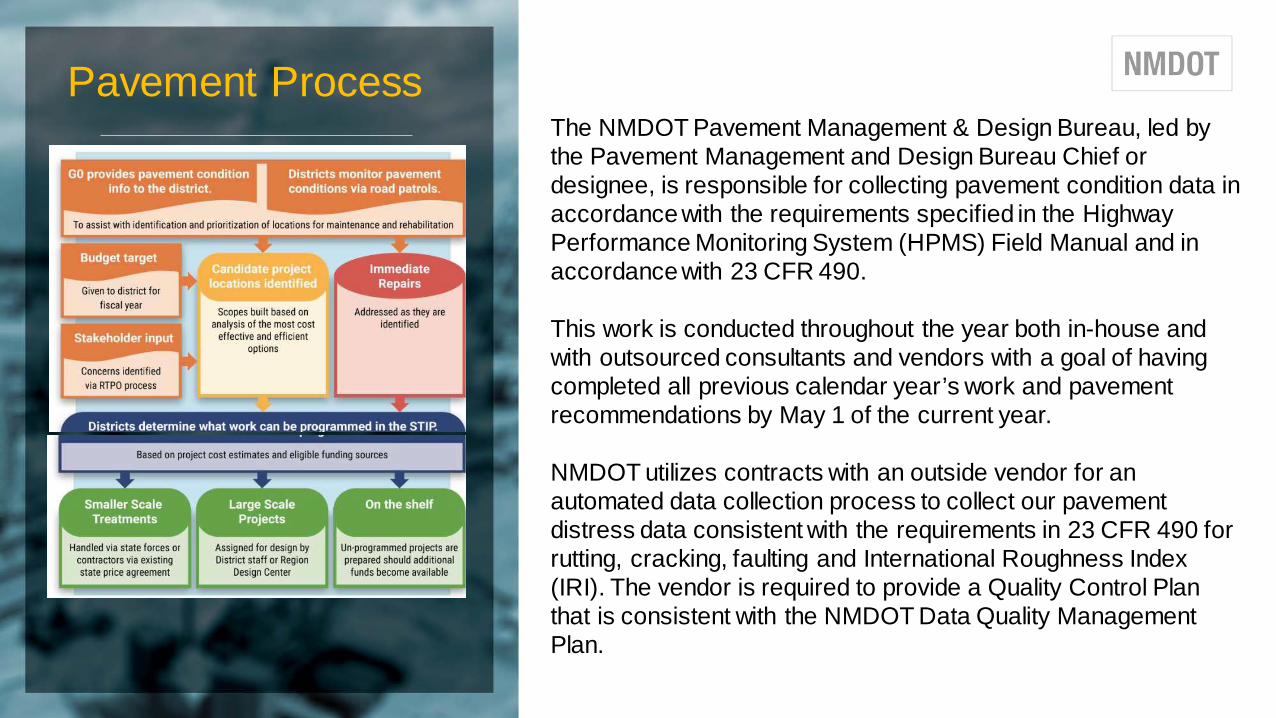
Pavement ProcessThe NMDOT Pavement Management & Design Bureau, led by the Pavement Management and Design Bureau Chief or designee, is responsible for collecting pavement condition data in accordance with the requirements specified in the Highway Performance Monitoring System (HPMS) Field Manual and in accordance with 23 CFR 490.
This work is conducted throughout the year both in-house and with outsourced consultants and vendors with a goal of having completed all previous calendar year’s work and pavement recommendations by May 1 of the current year.
NMDOT utilizes contracts with an outside vendor for an automated data collection process to collect our pavement distress data consistent with the requirements in 23 CFR 490 for rutting, cracking, faulting and International Roughness Index (IRI). The vendor is required to provide a Quality Control Plan that is consistent with the NMDOT Data Quality Management Plan.
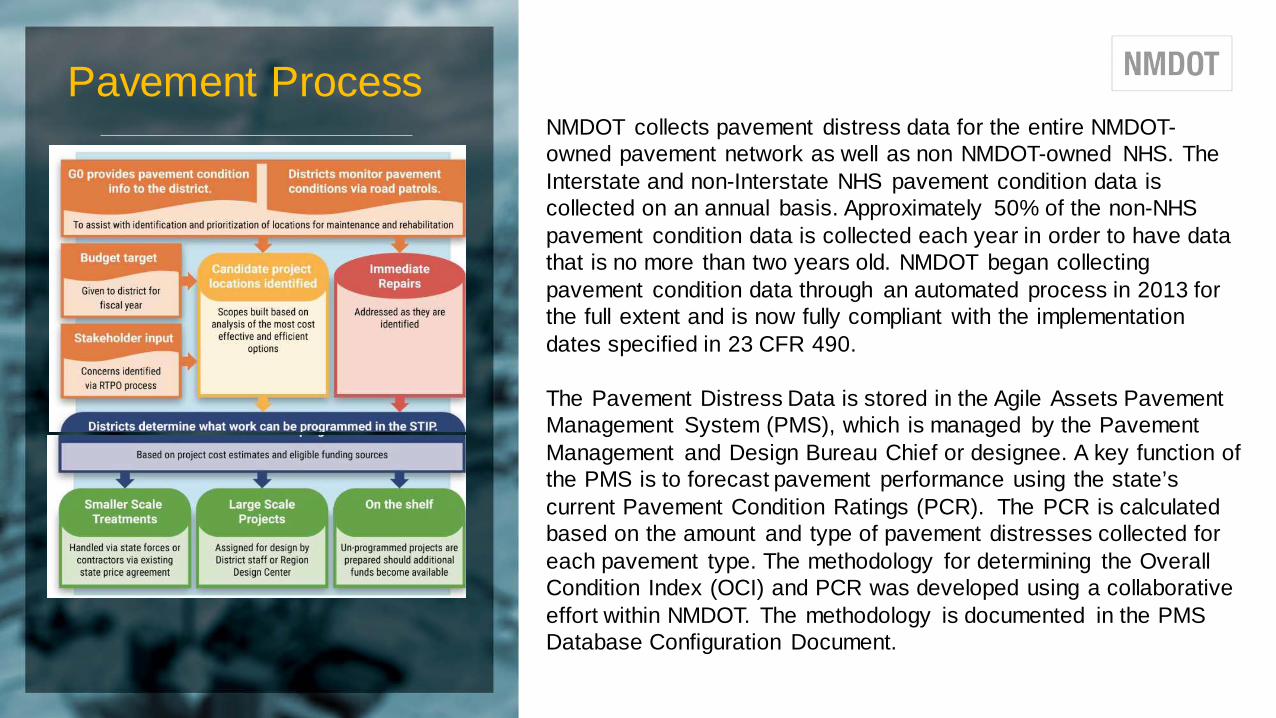
Pavement ProcessNMDOT collects pavement distress data for the entire NMDOT-owned pavement network as well as non NMDOT-owned NHS. The Interstate and non-Interstate NHS pavement condition data is collected on an annual basis. Approximately 50% of the non-NHS pavement condition data is collected each year in order to have data that is no more than two years old. NMDOT began collecting pavement condition data through an automated process in 2013 for the full extent and is now fully compliant with the implementation dates specified in 23 CFR 490.
The Pavement Distress Data is stored in the Agile Assets Pavement Management System (PMS), which is managed by the Pavement Management and Design Bureau Chief or designee. A key function of the PMS is to forecast pavement performance using the state’s current Pavement Condition Ratings (PCR). The PCR is calculated based on the amount and type of pavement distresses collected for each pavement type. The methodology for determining the Overall Condition Index (OCI) and PCR was developed using a collaborative effort within NMDOT. The methodology is documented in the PMS Database Configuration Document.
Pavement Process
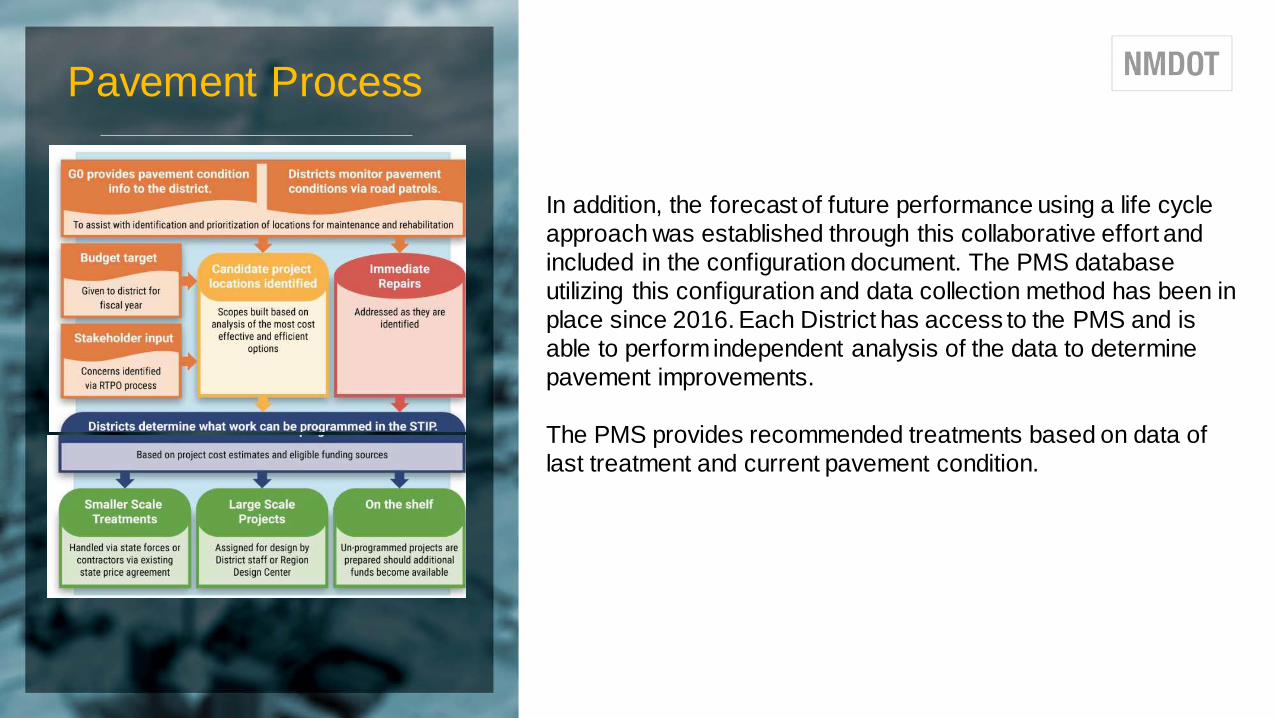
In addition, the forecast of future performance using a life cycle approach was established through this collaborative effort and included in the configuration document. The PMS database utilizing this configuration and data collection method has been in place since 2016. Each District has access to the PMS and is able to perform independent analysis of the data to determine pavement improvements.
The PMS provides recommended treatments based on data of last treatment and current pavement condition.
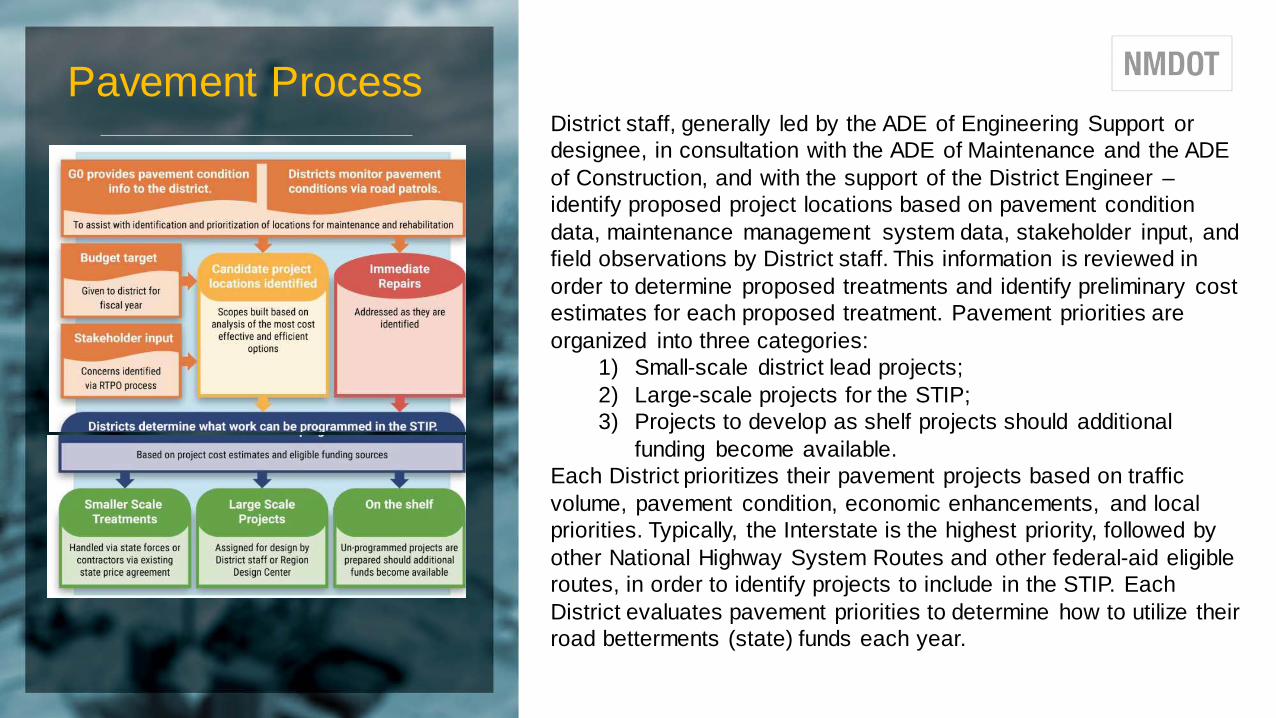
Pavement ProcessDistrict staff, generally led by the ADE of Engineering Support or designee, in consultation with the ADE of Maintenance and the ADE of Construction, and with the support of the District Engineer –identify proposed project locations based on pavement condition data, maintenance management system data, stakeholder input, and field observations by District staff. This information is reviewed in order to determine proposed treatments and identify preliminary cost estimates for each proposed treatment. Pavement priorities are organized into three categories:
1) Small-scale district lead projects; 2) Large-scale projects for the STIP; 3) Projects to develop as shelf projects should additional
funding become available. Each District prioritizes their pavement projects based on traffic volume, pavement condition, economic enhancements, and local priorities. Typically, the Interstate is the highest priority, followed by other National Highway System Routes and other federal-aid eligible routes, in order to identify projects to include in the STIP. Each District evaluates pavement priorities to determine how to utilize their road betterments (state) funds each year.
Statewide Transportation Improvement Program
• Each District prioritizes their pavement and bridge projects based on available funding and overall condition of each asset. Since MAP-21 eliminated a separate funding program for bridges, each District must balance pavement and bridge needs with their available District Target funding for each funding category.
• Due to the limited amount of funding in the District Target funding allocations and the rate of deterioration of the system, the Districts are challenged with determining which project treatments to program in the STIP. At times, proposed treatments and length of projects are determined based on available funding and a lesser design life may be chosen or projects may be funded across multiple years of the STIP.
• In order to meet performance targets and address a life-cycle approach to treatments, the NMDOT recognizes that improvements need to be made in identifying and prioritizing projects as well as investigating alternate approaches to funding allocations.
Proposed Project Selection Process
• The following processes are under consideration by the Asset Management Executive Steering Committee.
• The processes would build upon existing project selection efforts. Under a proposed allocation system, certain funds would be distributed, and project selection decisions delegated to each District.
• A statewide project selection process would be applied for other NMDOT funds and resources.
• Therefore, project selection processes for District and statewide decision-making are under consideration. The processes should be considered draft and are subject to additional data considerations.
Proposed Project Selection Process – District Level Decision-Making
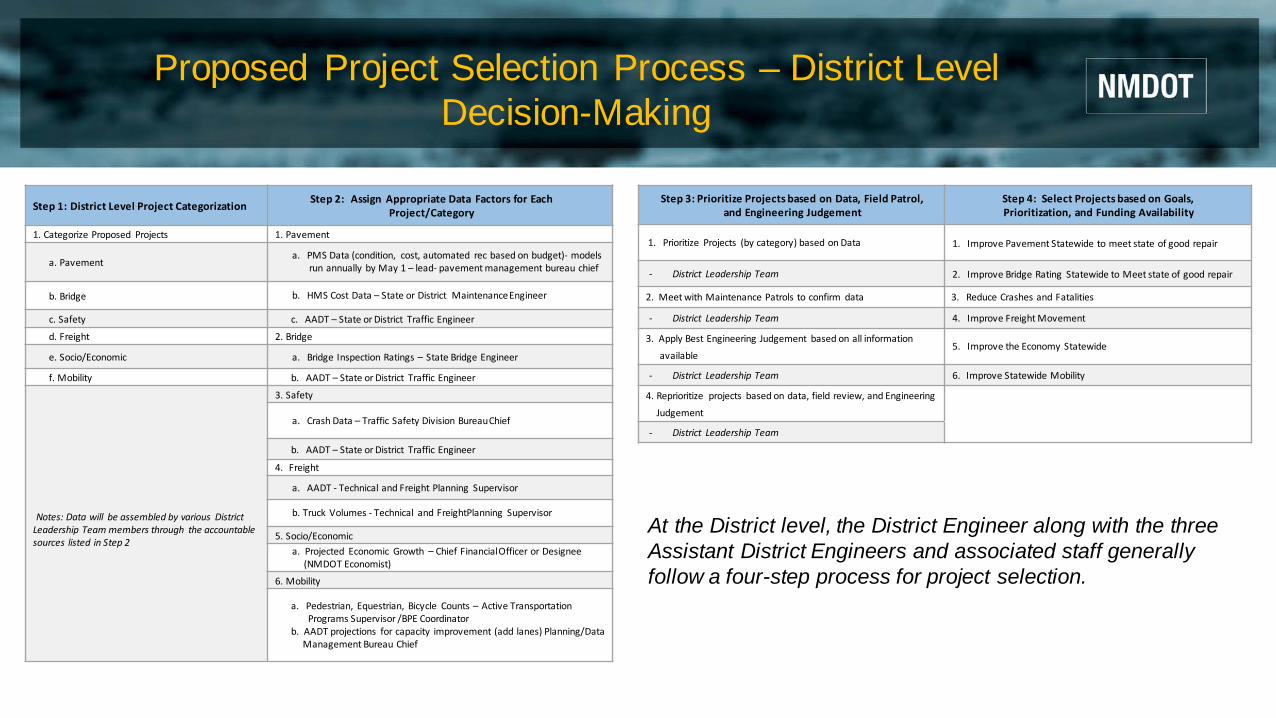
Step 1: District Level Project Categorization Step 2: Assign Appropriate Data Factors for Each Project/Category
1. Categorize Proposed Projects 1. Pavement
a. Pavementa. PMS Data (condition, cost, automated rec based on budget)- models
run annually by May 1 – lead- pavement management bureau chief
b. Bridge b. HMS Cost Data – State or District MaintenanceEngineer
c. Safety c. AADT – State or District Traffic Engineer
d. Freight 2. Bridge
e. Socio/Economic a. Bridge Inspection Ratings – State Bridge Engineer
f. Mobility b. AADT – State or District Traffic Engineer
Notes: Data will be assembled by various DistrictLeadership Team members through the accountablesources listed in Step 2
3. Safety
a. Crash Data – Traffic Safety Division BureauChief
b. AADT – State or District Traffic Engineer
4. Freight
a. AADT - Technical and Freight Planning Supervisor
b. Truck Volumes - Technical and FreightPlanning Supervisor
5. Socio/Economica. Projected Economic Growth – Chief FinancialOfficer or Designee
(NMDOT Economist)
6. Mobility
a. Pedestrian, Equestrian, Bicycle Counts – Active TransportationPrograms Supervisor /BPE Coordinator
b. AADT projections for capacity improvement (add lanes) Planning/DataManagement Bureau Chief
Step 3: Prioritize Projects based on Data, Field Patrol,and Engineering Judgement
Step 4: Select Projects based on Goals,Prioritization, and Funding Availability
1. Prioritize Projects (by category) based on Data 1. Improve Pavement Statewide to meet state of good repair
- District Leadership Team 2. Improve Bridge Rating Statewide to Meet state of good repair
2. Meet with Maintenance Patrols to confirm data 3. Reduce Crashes and Fatalities
- District Leadership Team 4. Improve Freight Movement
3. Apply Best Engineering Judgement based on all information
available5. Improve the Economy Statewide
- District Leadership Team 6. Improve Statewide Mobility
4. Reprioritize projects based on data, field review, and Engineering
Judgement
- District Leadership Team
At the District level, the District Engineer along with the three Assistant District Engineers and associated staff generally follow a four-step process for project selection.

Proposed Project Selection Process – Statewide Decision-Making
Overall Approach - Among the means for implementing asset management are project selection processes that prioritize the improvements of critical roadways. These selection processes should be objective, transparent, and applied consistently. The methodology described below was developed from best practices from DOTs across the county. Specifically, this document proposes a two-tiered selection process for identifying projects for funding and implementation:
1. Project Identification (monthly and quarterly)2. Project Evaluation and Selection (monthly and quarterly)
A project short list can be proposed by each District based on local needs or respond to statewide priorities and funding availability. Once a short-term list of projects has been developed, districts can collect the additional information needed to prioritize projects. An evaluation committee will utilize the prioritization process to determine the merits of those projects. This two-tiered approach will limit the data collection and project justification efforts to those projects that are logical candidates for funding in a given year. For maintenance and preservation projects that advance asset management objectives, the decision on the specific type of treatment or improvement can come at a later point.
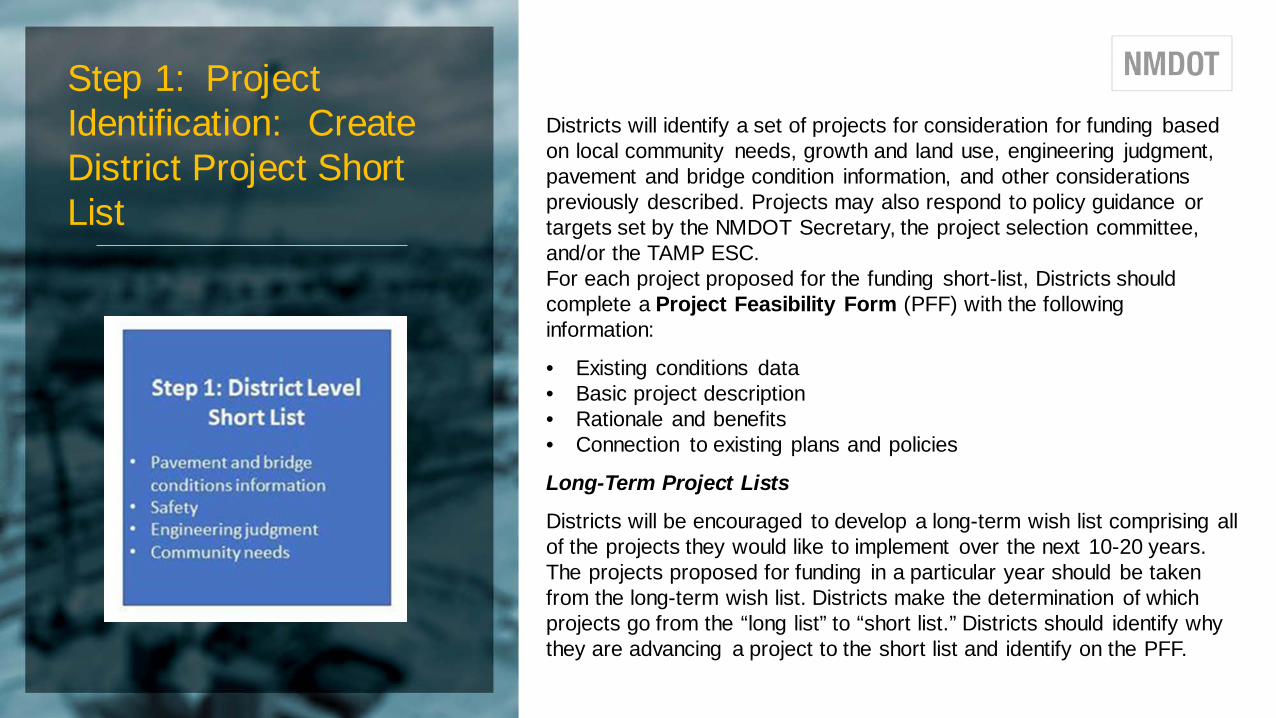
Step 1: Project Identification: Create District Project Short List
Districts will identify a set of projects for consideration for funding based on local community needs, growth and land use, engineering judgment, pavement and bridge condition information, and other considerations previously described. Projects may also respond to policy guidance or targets set by the NMDOT Secretary, the project selection committee, and/or the TAMP ESC.For each project proposed for the funding short-list, Districts should complete a Project Feasibility Form (PFF) with the following information:
• Existing conditions data • Basic project description • Rationale and benefits• Connection to existing plans and policies
Long-Term Project Lists
Districts will be encouraged to develop a long-term wish list comprising all of the projects they would like to implement over the next 10-20 years. The projects proposed for funding in a particular year should be taken from the long-term wish list. Districts make the determination of which projects go from the “long list” to “short list.” Districts should identify why they are advancing a project to the short list and identify on the PFF.
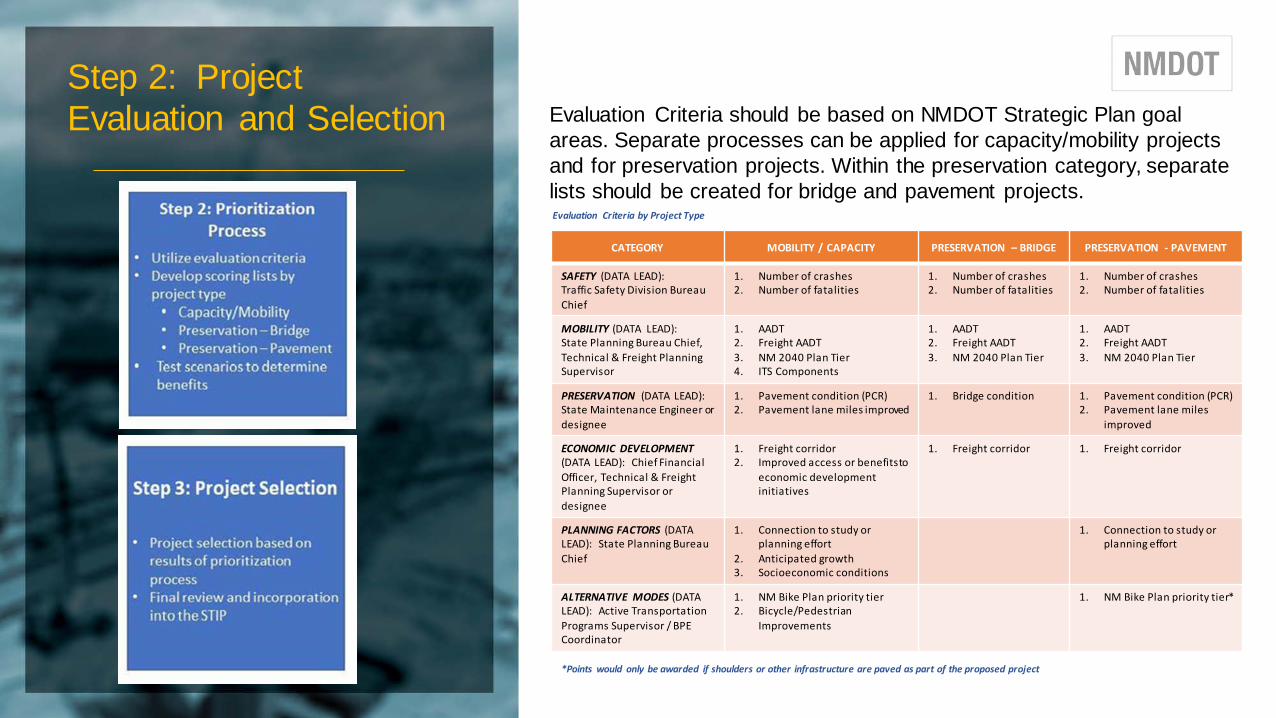
Step 2: Project Evaluation and Selection
Evaluation Criteria by Project Type
*Points would only be awarded if shoulders or other infrastructure are paved as part of the proposed project
Evaluation Criteria should be based on NMDOT Strategic Plan goal areas. Separate processes can be applied for capacity/mobility projects and for preservation projects. Within the preservation category, separate lists should be created for bridge and pavement projects.
CATEGORY MOBILITY / CAPACITY PRESERVATION – BRIDGE PRESERVATION - PAVEMENT
SAFETY (DATA LEAD):Traffic Safety Division Bureau Chief
1. Number of crashes2. Number of fatalities
1. Number of crashes2. Number of fatalities
1. Number of crashes2. Number of fatalities
MOBILITY (DATA LEAD):State Planning Bureau Chief, Technical & Freight Planning Supervisor
1. AADT2. Freight AADT3. NM 2040 Plan Tier4. ITS Components
1. AADT2. Freight AADT3. NM 2040 Plan Tier
1. AADT2. Freight AADT3. NM 2040 Plan Tier
PRESERVATION (DATA LEAD):State Maintenance Engineer or designee
1. Pavement condition (PCR)2. Pavement lane miles improved
1. Bridge condition 1. Pavement condition (PCR)2. Pavement lane miles
improved
ECONOMIC DEVELOPMENT (DATA LEAD): Chief Financial Officer, Technical & Freight Planning Supervisor or designee
1. Freight corridor2. Improved access or benefits to
economic development initiatives
1. Freight corridor 1. Freight corridor
PLANNING FACTORS (DATA LEAD): State Planning Bureau Chief
1. Connection to study or planning effort
2. Anticipated growth3. Socioeconomic conditions
1. Connection to study or planning effort
ALTERNATIVE MODES (DATA LEAD): Active Transportation Programs Supervisor / BPE Coordinator
1. NM Bike Plan priority tier2. Bicycle/Pedestrian
Improvements
1. NM Bike Plan priority tier*
Transfer of Selected Projects to the State Transportation Improvement Plan
Process Overview - Upon completion of the Statewide decision-making prioritization process, selected projects shall be programmed into State Transportation Improvement Plan (STIP) by the respective District in which the project resides. Project programming for NMDOT is accomplished through the STIP which lists funded and prioritized projects over a four-year period.
By federal law, transportation programs must be updated at least every four years, although the NMDOT practice is to update the STIP every two years. A critical step for initiating a project within the STIP is obtaining a project control number. To aid in the process, the NMDOT uses a project definition, initial cost estimate, and project control number request form.
The District ADE of Engineering Support shall act as the lead in submitting the project control number request. The District Engineer and respective Assistant District Engineers have identified the project definition phase during the District level short list submittal. Based on the project definition, the ADE of Engineering Support will determine the level of effort required, developing an accurate budget and schedule, which in turn will assist with developing or adjusting the overall project budget and design/construction schedule programmed in the STIP.
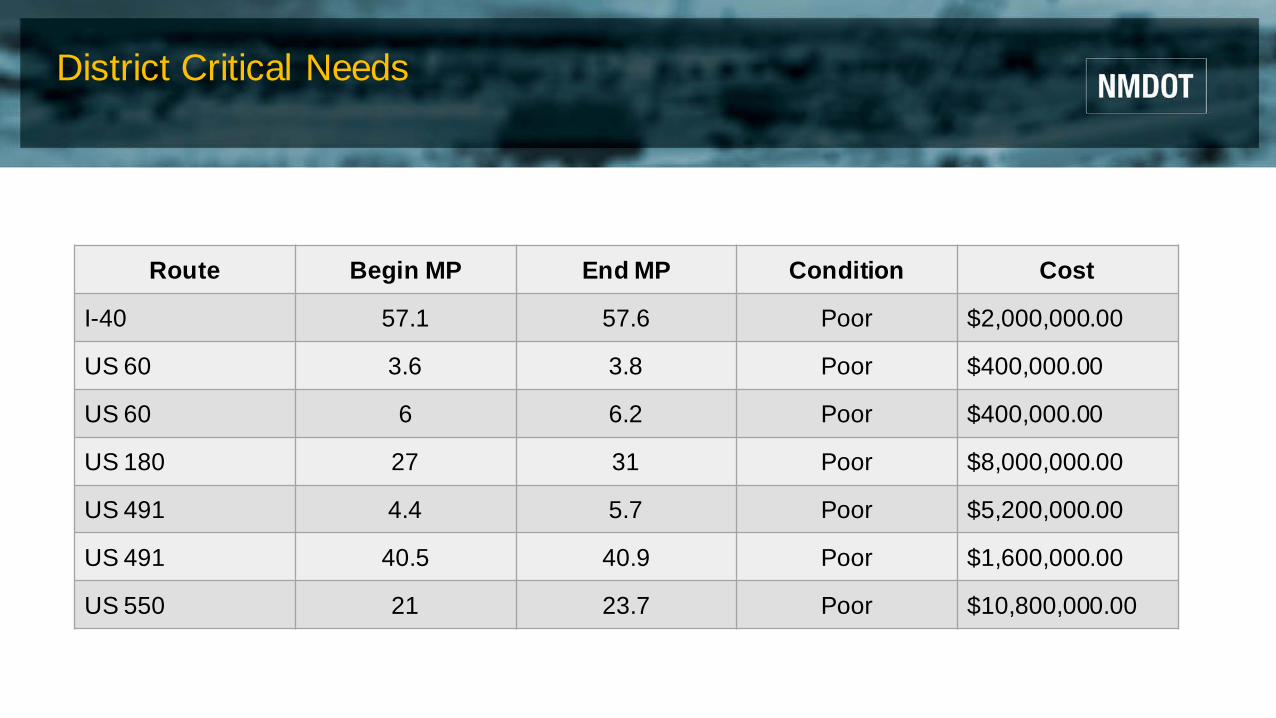
District Critical Needs
Route Begin MP End MP Condition Cost
I-40 57.1 57.6 Poor $2,000,000.00
US 60 3.6 3.8 Poor $400,000.00
US 60 6 6.2 Poor $400,000.00
US 180 27 31 Poor $8,000,000.00
US 491 4.4 5.7 Poor $5,200,000.00
US 491 40.5 40.9 Poor $1,600,000.00
US 550 21 23.7 Poor $10,800,000.00
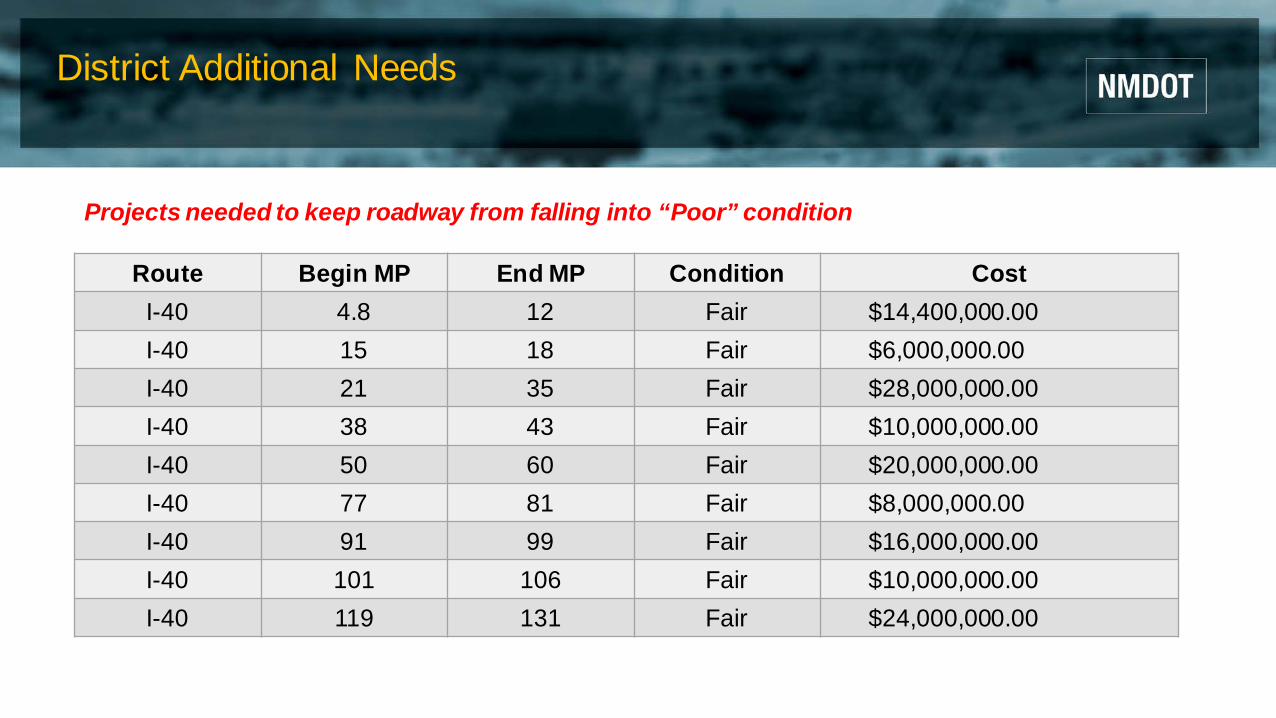
District Additional Needs
Route Begin MP End MP Condition CostI-40 4.8 12 Fair $14,400,000.00I-40 15 18 Fair $6,000,000.00I-40 21 35 Fair $28,000,000.00I-40 38 43 Fair $10,000,000.00I-40 50 60 Fair $20,000,000.00I-40 77 81 Fair $8,000,000.00I-40 91 99 Fair $16,000,000.00I-40 101 106 Fair $10,000,000.00I-40 119 131 Fair $24,000,000.00
Projects needed to keep roadway from falling into “Poor” condition
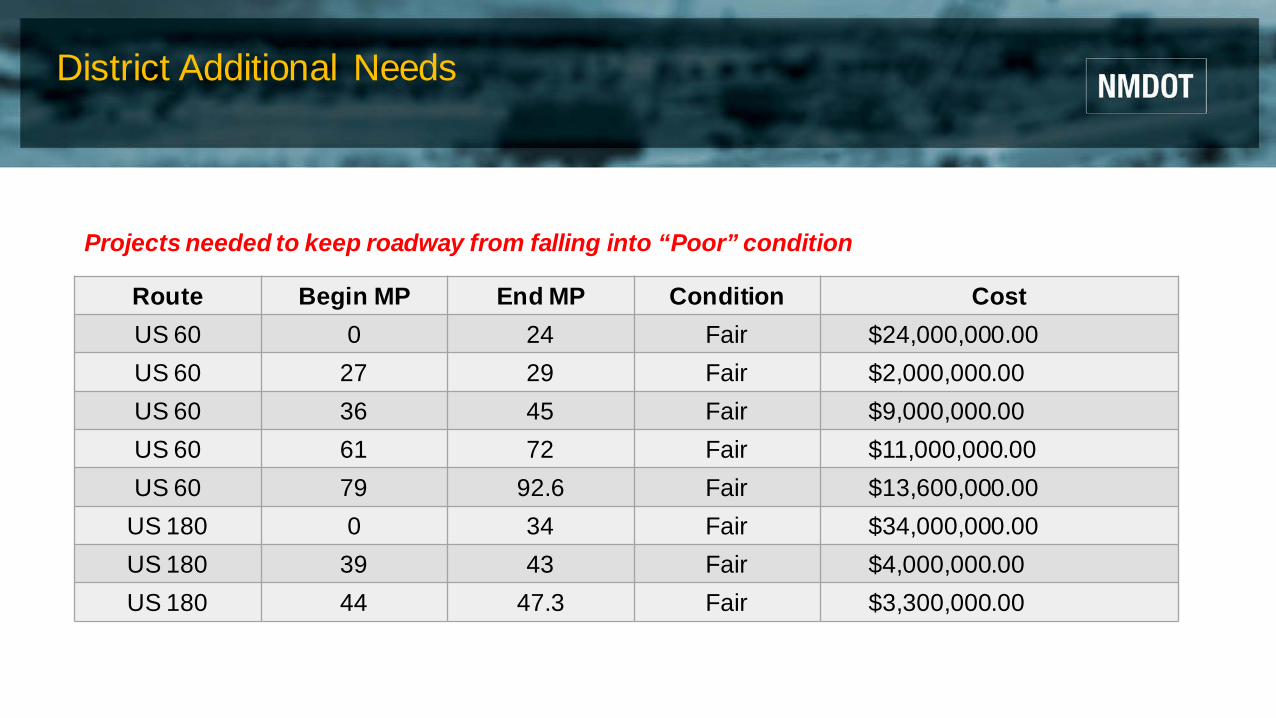
District Additional Needs
Route Begin MP End MP Condition CostUS 60 0 24 Fair $24,000,000.00US 60 27 29 Fair $2,000,000.00US 60 36 45 Fair $9,000,000.00US 60 61 72 Fair $11,000,000.00US 60 79 92.6 Fair $13,600,000.00
US 180 0 34 Fair $34,000,000.00US 180 39 43 Fair $4,000,000.00US 180 44 47.3 Fair $3,300,000.00
Projects needed to keep roadway from falling into “Poor” condition
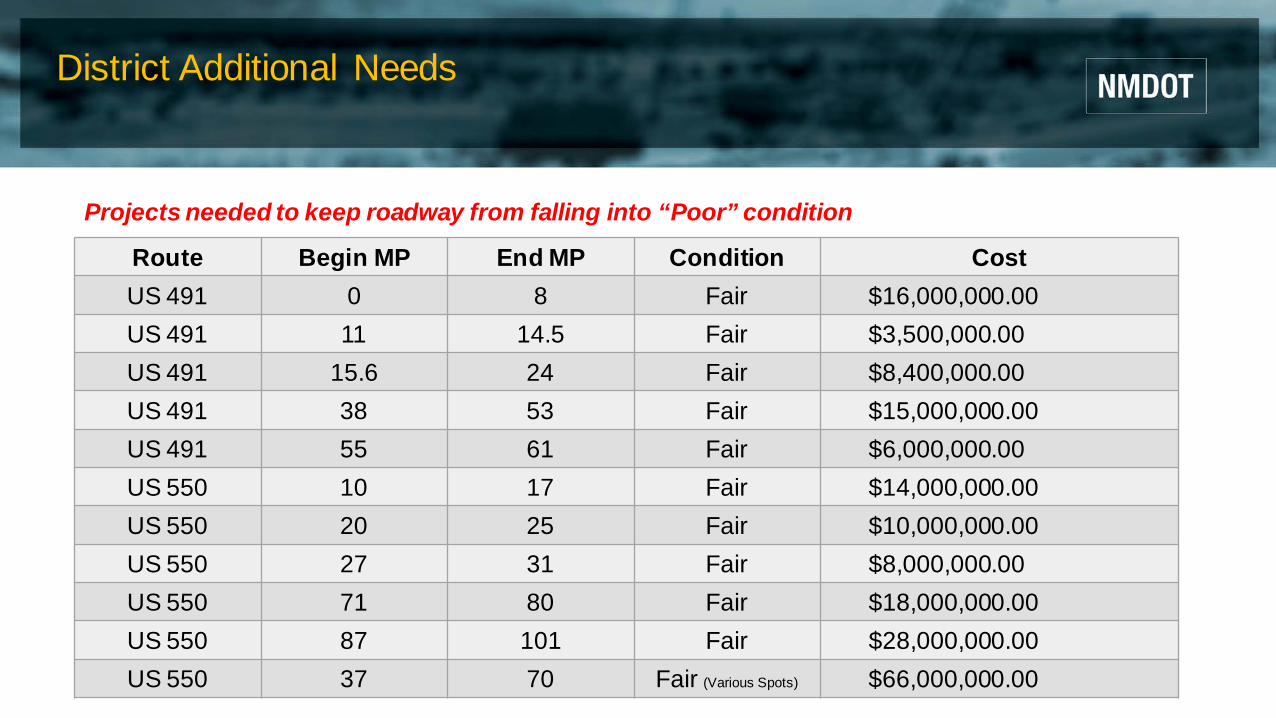
District Additional Needs
Route Begin MP End MP Condition CostUS 491 0 8 Fair $16,000,000.00US 491 11 14.5 Fair $3,500,000.00US 491 15.6 24 Fair $8,400,000.00US 491 38 53 Fair $15,000,000.00US 491 55 61 Fair $6,000,000.00US 550 10 17 Fair $14,000,000.00US 550 20 25 Fair $10,000,000.00US 550 27 31 Fair $8,000,000.00US 550 71 80 Fair $18,000,000.00US 550 87 101 Fair $28,000,000.00US 550 37 70 Fair (Various Spots) $66,000,000.00
Projects needed to keep roadway from falling into “Poor” condition
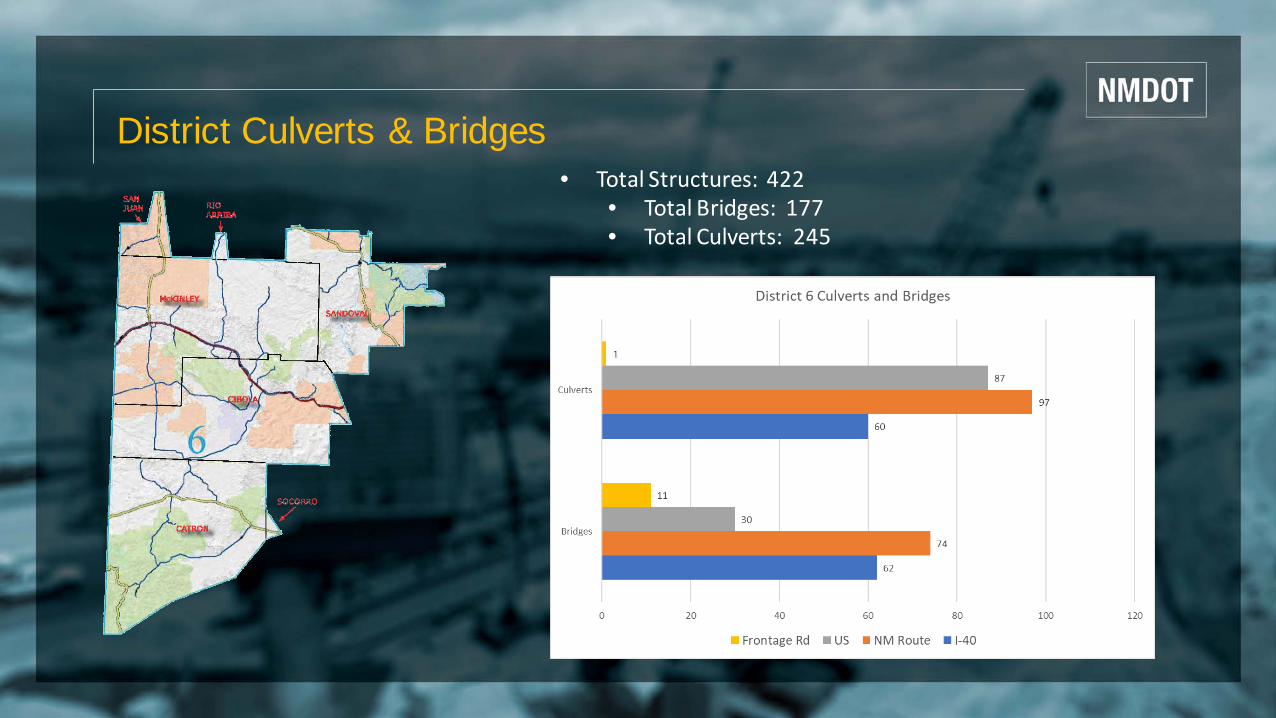
District Culverts & Bridges• Total Structures: 422
• Total Bridges: 177• Total Culverts: 245
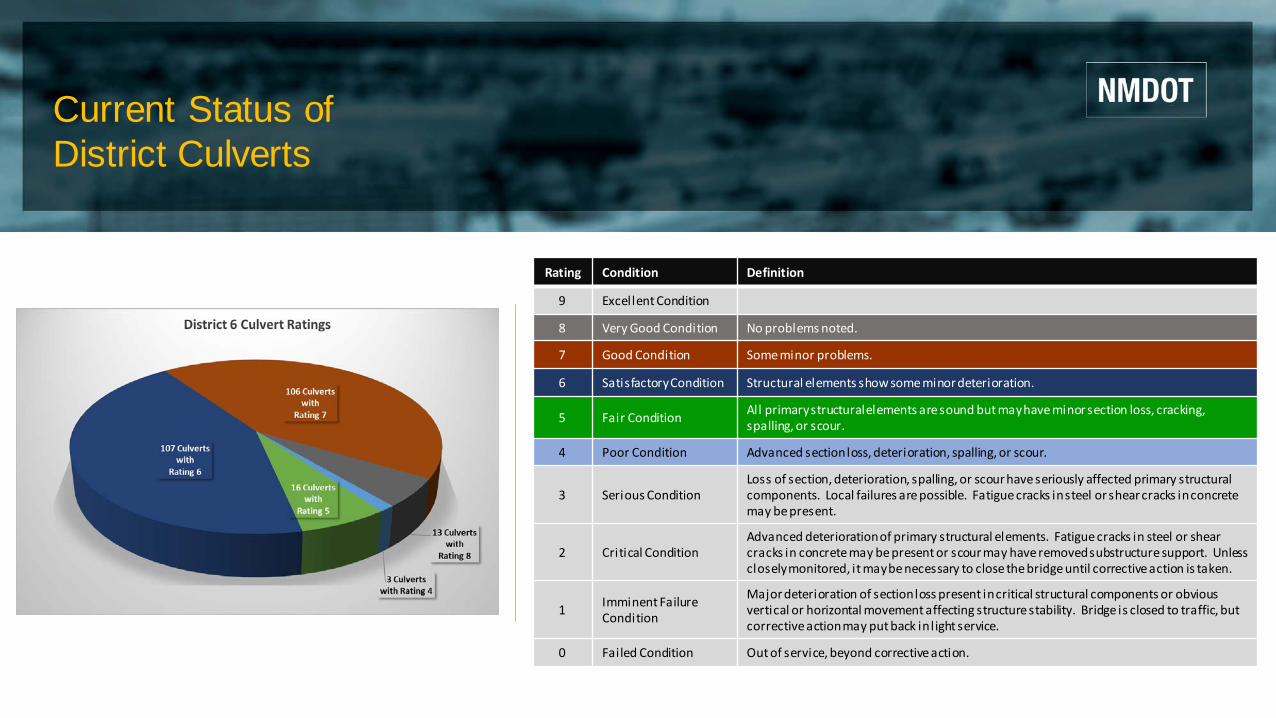
Current Status of District Culverts
Rating Condition Definition
9 Excellent Condition
8 Very Good Condition No problems noted.
7 Good Condition Some minor problems.
6 Satisfactory Condition Structural elements show some minor deterioration.
5 Fair Condition All primary structural elements are sound but may have minor section loss, cracking, spalling, or scour.
4 Poor Condition Advanced section loss, deterioration, spalling, or scour.
3 Serious ConditionLoss of section, deterioration, spalling, or scour have seriously affected primary structural components. Local failures are possible. Fatigue cracks in steel or shear cracks in concrete may be present.
2 Critical ConditionAdvanced deterioration of primary structural elements. Fatigue cracks in steel or shear cracks in concrete may be present or scour may have removed substructure support. Unless closely monitored, it may be necessary to close the bridge until corrective action is taken.
1 Imminent Failure Condition
Major deterioration of section loss present in critical structural components or obvious vertical or horizontal movement affecting structure stability. Bridge is closed to traffic, but corrective action may put back in l ight service.
0 Failed Condition Out of service, beyond corrective action.
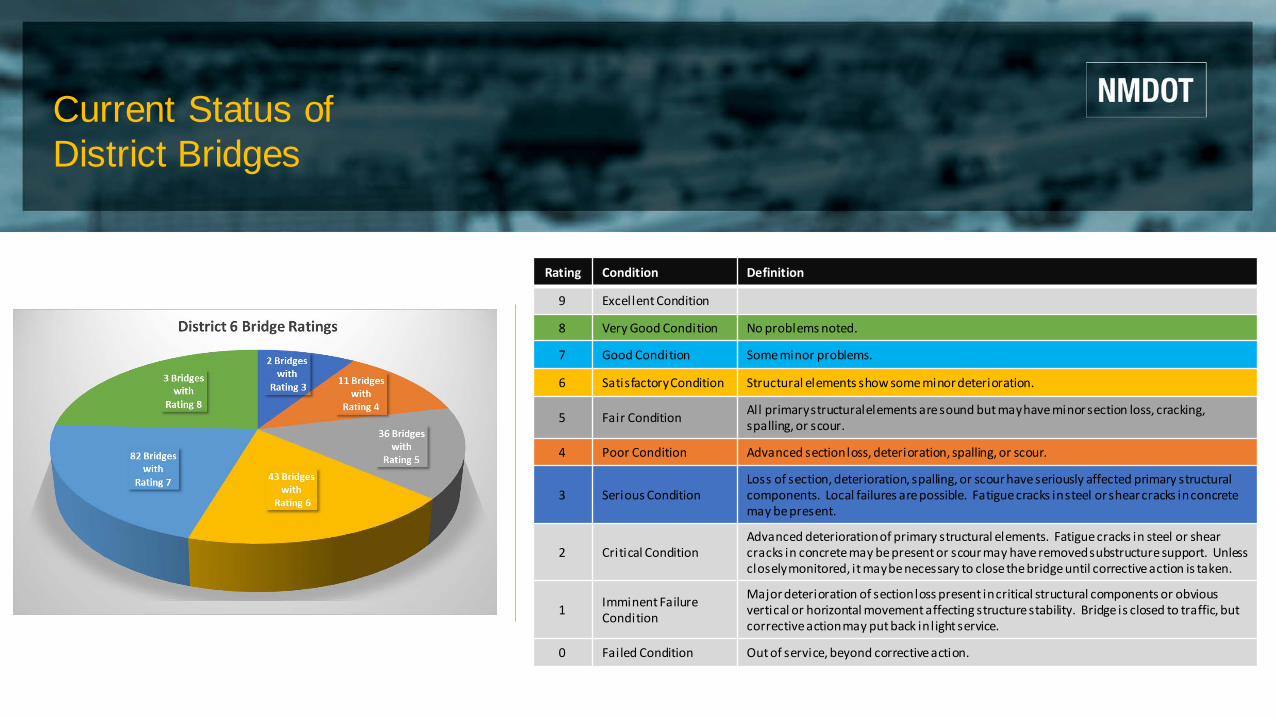
Current Status of District Bridges
Rating Condition Definition
9 Excellent Condition
8 Very Good Condition No problems noted.
7 Good Condition Some minor problems.
6 Satisfactory Condition Structural elements show some minor deterioration.
5 Fair Condition All primary structural elements are sound but may have minor section loss, cracking, spalling, or scour.
4 Poor Condition Advanced section loss, deterioration, spalling, or scour.
3 Serious ConditionLoss of section, deterioration, spalling, or scour have seriously affected primary structural components. Local failures are possible. Fatigue cracks in steel or shear cracks in concrete may be present.
2 Critical ConditionAdvanced deterioration of primary structural elements. Fatigue cracks in steel or shear cracks in concrete may be present or scour may have removed substructure support. Unless closely monitored, it may be necessary to close the bridge until corrective action is taken.
1 Imminent Failure Condition
Major deterioration of section loss present in critical structural components or obvious vertical or horizontal movement affecting structure stability. Bridge is closed to traffic, but corrective action may put back in l ight service.
0 Failed Condition Out of service, beyond corrective action.

NMDOT D-6 ROADWAYSRoute From To Lane MilesNM 4 San Ysidro Los Alamos County Line 93NM 6 I-40, Exit 126 SE of the Cibola/Valencia County Line 36
NM 12 Jct. US 180/NM 12 Datil 148NM 32 Apache Creek Quemado 82NM 36 Quemado Jct. NM 53/NM 36 144NM 53 Arizona State Line Grants 172NM 96 US 550 at Cuba Regina 18NM 103 Jct. NM 32/NM 103 Quemado Lake 8NM 117 Jct. NM 117/NM 36 Grants 132NM 118 Arizona State Line Iyanbito 102NM 122 Continental Divide Grants (Exit 85) 106NM 124 Jct. NM 117/NM 124 (Skyway) Laguna 52NM 126 Cuba La Cueva 77NM 134 Sheep Springs Crystal 45NM 197 US 550 at Cuba Torreon 61NM 264 Arizona State Line Yah-ta-Hey 65NM 279 NM 124 at Laguna Seboyeta 27NM 290 NM 4 Ponderosa 16NM 371 I-40 at Thoreau Lake Valley 61NM 400 Jct. NM 118/NM 400 McGaffey 21NM 412 I-40 at Prewitt Bluewater Lake 12NM 435 Reserve Lower San Francisco Plaza 10NM 485 NM 4 Gilman 8NM 509 Jct. NM 509/NM 605 (Jay's) Whitehorse 71NM 537 US 550 Rio Arriba County Line 10NM 547 Grants Mt. Taylor 26NM 564 Jct. NM 118/NM 564 Jct. NM 602/NM 564 13NM 566 Church Rock End of Pavement 23NM 568 Jct. NM 122/NM 568 (West of Milan) NMDOT Maintenance Yard (Milan) 2NM 601 Quemado Cibola/Catron County Line (Dirt Road) 54NM 602 Jct. NM 53/NM 602 Gallup 64NM 603 Pie Town NM 36 (Dirt Road) 46NM 605 Milan San Mateo 44NM 606 Jct. NM 122 (West of Grants) End of Pavement (Bluewater) 2NM 608 9th Street (Gallup) 9th Street (Gallup) 8NM 609 Maloney Street (Gallup) Maloney Street (Gallup) 10NM 610 2nd Street (Gallup) 2nd Street (Gallup) 8NM 612 I-40 at Thoreau Bluewater Lake 26NM 615 Horizon Boulevard (Milan) Horizon Boulevard (Milan) 3US 60 Arizona State Line VLA (Very Large Array) 186US 180 Arizona State Line Alma 95US 491 I-40 at Gallup Little Water 271US 550 North of Bernalillo North of San Ysidro 376
Other Routes Frontage Roads/Interchanges Frontage Roads/Interchanges 56I-40 Arizona State Line To'hajiilee 528
TOTAL LANE MILES 3,418
District Roadways & Lane Miles

Current Status of District Roadways
Pavement Condition
Roughness (IRI)(inches/mile)
Rutting(inches)
Cracking Percent (%)
Good < 95 < 0.20 < 5Fair 95 - 170 0.20 - 0.40 5 - 20Poor > 170 > 0.40 > 20
FHWA Guidelines based on 23 CFR 490
Pavement Condition 3 Metric Rating (IRI, Rutting &CrackingGood All three metrics rated “Good”Poor ≥ 2 metrics rated “Poor”Fair All other combinations
Overall Project Condition
D6 Routes Good Fair Poor
Interstate 67.6% 32.4% 0%
US 36.5% 62.5% 1.0%
NM 7.5% 90% 2.5%
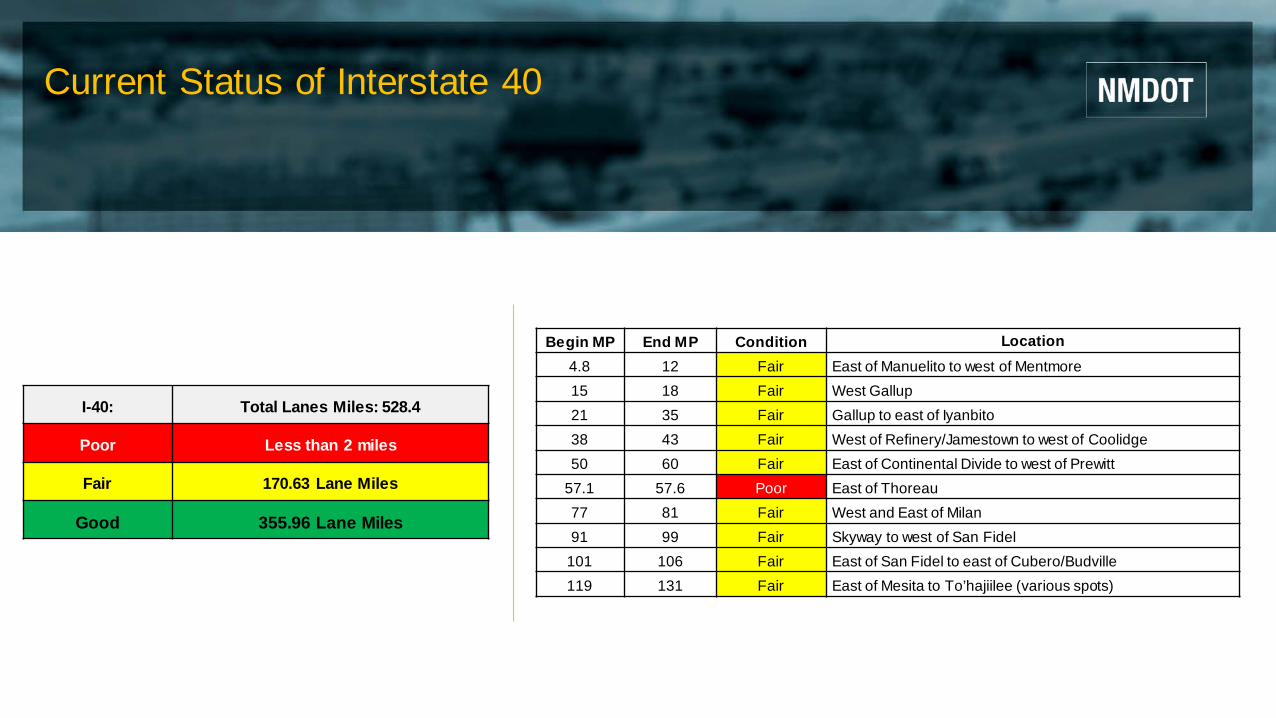
Current Status of Interstate 40
I-40: Total Lanes Miles: 528.4
Poor Less than 2 miles
Fair 170.63 Lane Miles
Good 355.96 Lane Miles
Begin MP End MP Condition Location4.8 12 Fair East of Manuelito to west of Mentmore15 18 Fair West Gallup21 35 Fair Gallup to east of Iyanbito38 43 Fair West of Refinery/Jamestown to west of Coolidge50 60 Fair East of Continental Divide to west of Prewitt
57.1 57.6 Poor East of Thoreau77 81 Fair West and East of Milan91 99 Fair Skyway to west of San Fidel
101 106 Fair East of San Fidel to east of Cubero/Budville119 131 Fair East of Mesita to To’hajiilee (various spots)

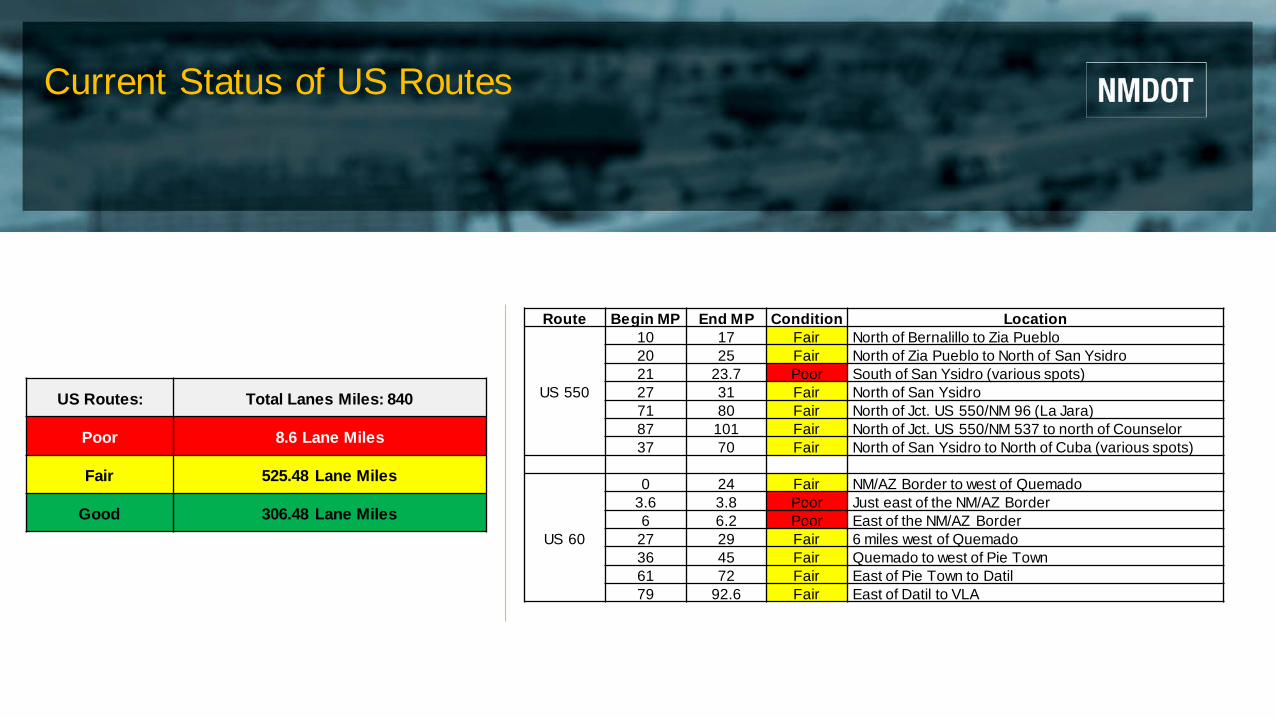
Current Status of US Routes
US Routes: Total Lanes Miles: 840
Poor 8.6 Lane Miles
Fair 525.48 Lane Miles
Good 306.48 Lane Miles
Route Begin MP End MP Condition Location
US 180
0 34 Fair AZ/NM Border to 13 miles north of Alma27 31 Poor 6 miles south of Jct. US 180/NM 12 (various spots)39 43 Fair 7 miles north of Alma44 47.3 Fair just north of Alma
US 491
0 8 Fair NB & SB Gallup to Yah-ta-Hay 4.4 5.7 Poor Gamerco to T&R Market11 14.5 Fair SB Twin Lakes to Yah-ta-Hay
15.6 24 Fair NB Twin Lakes to Tohatchi38 53 Fair NB San Juan/McKinley County Line to Sheep Springs
40.5 40.9 Poor South of Naschitti55 61 Fair NB Newcomb to Little Water
Current Status of US Routes
US Routes: Total Lanes Miles: 840
Poor 8.6 Lane Miles
Fair 525.48 Lane Miles
Good 306.48 Lane Miles
Route Begin MP End MP Condition Location
US 550
10 17 Fair North of Bernalillo to Zia Pueblo20 25 Fair North of Zia Pueblo to North of San Ysidro21 23.7 Poor South of San Ysidro (various spots)27 31 Fair North of San Ysidro71 80 Fair North of Jct. US 550/NM 96 (La Jara)87 101 Fair North of Jct. US 550/NM 537 to north of Counselor37 70 Fair North of San Ysidro to North of Cuba (various spots)
US 60
0 24 Fair NM/AZ Border to west of Quemado3.6 3.8 Poor Just east of the NM/AZ Border6 6.2 Poor East of the NM/AZ Border
27 29 Fair 6 miles west of Quemado36 45 Fair Quemado to west of Pie Town61 72 Fair East of Pie Town to Datil79 92.6 Fair East of Datil to VLA
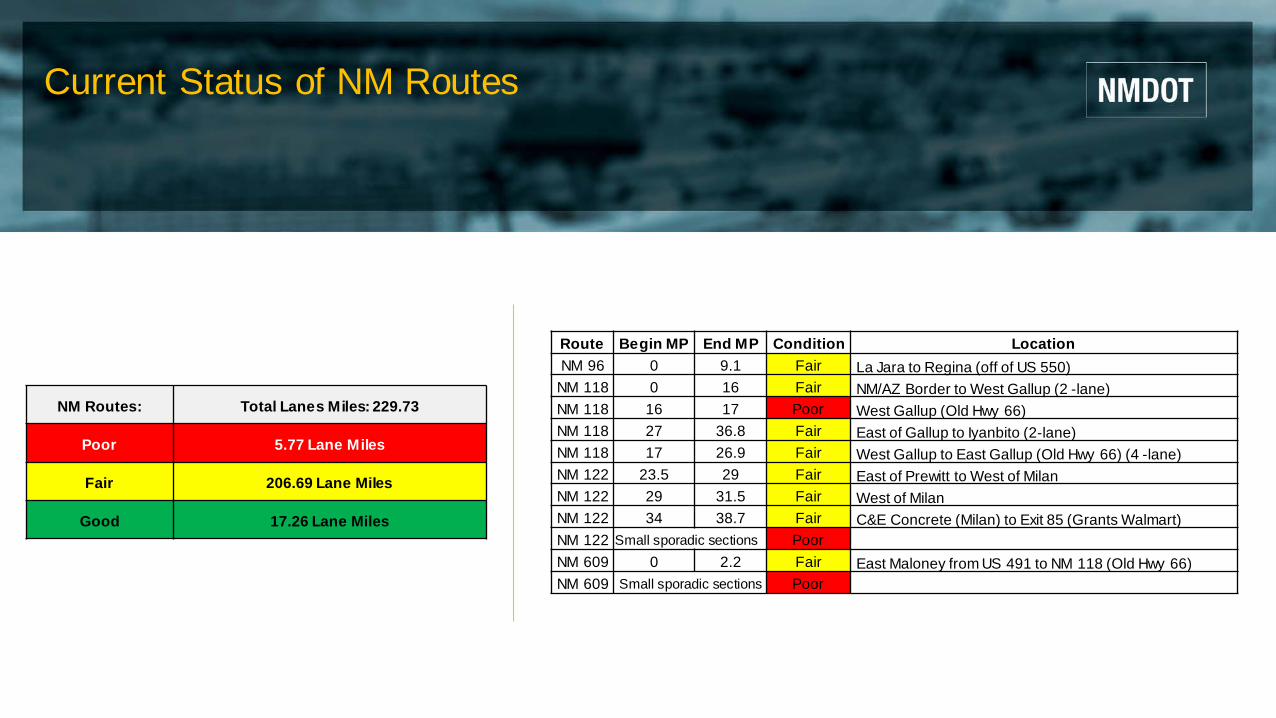
Current Status of NM Routes
NM Routes: Total Lanes Miles: 229.73
Poor 5.77 Lane Miles
Fair 206.69 Lane Miles
Good 17.26 Lane Miles
Route Begin MP End MP Condition LocationNM 96 0 9.1 Fair La Jara to Regina (off of US 550)
NM 118 0 16 Fair NM/AZ Border to West Gallup (2 -lane)NM 118 16 17 Poor West Gallup (Old Hwy 66)NM 118 27 36.8 Fair East of Gallup to Iyanbito (2-lane)NM 118 17 26.9 Fair West Gallup to East Gallup (Old Hwy 66) (4 -lane)NM 122 23.5 29 Fair East of Prewitt to West of MilanNM 122 29 31.5 Fair West of MilanNM 122 34 38.7 Fair C&E Concrete (Milan) to Exit 85 (Grants Walmart)NM 122 Small sporadic sections PoorNM 609 0 2.2 Fair East Maloney from US 491 to NM 118 (Old Hwy 66)NM 609 Small sporadic sections Poor

District Maintenance Challenges
Maintenance of I-40: The challenge for District Six is to maintain I-40 for thetraveling public and freight hauling at a high level of service. There are between10,000 and 15,000 heavy trucks utilizing this roadway daily, along with an equalamount of automobiles. The District maintains 528 lane miles of interstate.
Snow Removal Operations: The District is centered along the Continental Divide.This brings heavy winter storms, which require snow removal operations, and takesits toll on personnel, equipment and supplies.
Maintenance of Secondary Roads: Along with maintaining I-40 and its inherentheavy traffic volumes, the District maintains 2890 lane miles of secondary roads inMcKinley, Cibola, Catron, Sandoval and portions of San Juan, Rio Arriba, Valenciaand Socorro counties.
Urban Growth in a Rural District: The Municipality of Gallup is growing continuouslyand development has exceeded the infrastructure. Congestion and limited accessare the result.
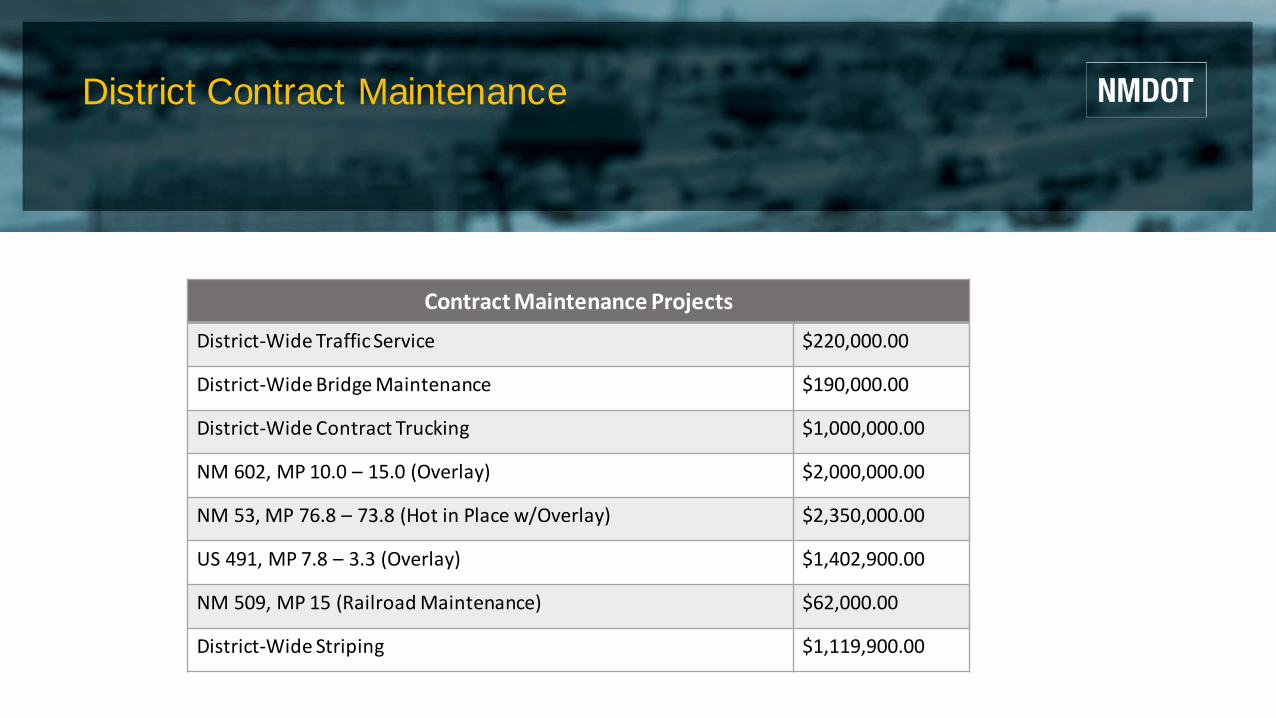
District Contract Maintenance
Contract Maintenance ProjectsDistrict-Wide Traffic Service $220,000.00
District-Wide Bridge Maintenance $190,000.00
District-Wide Contract Trucking $1,000,000.00
NM 602, MP 10.0 – 15.0 (Overlay) $2,000,000.00
NM 53, MP 76.8 – 73.8 (Hot in Place w/Overlay) $2,350,000.00
US 491, MP 7.8 – 3.3 (Overlay) $1,402,900.00
NM 509, MP 15 (Railroad Maintenance) $62,000.00
District-Wide Striping $1,119,900.00
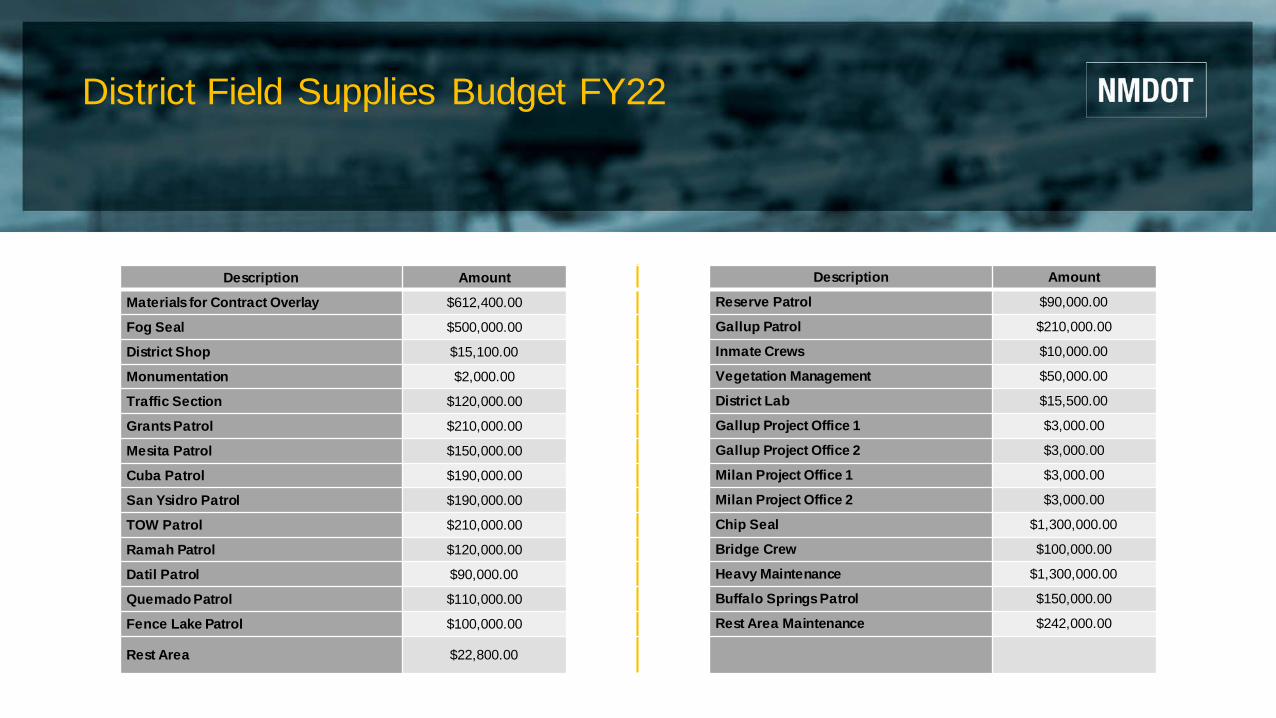
District Field Supplies Budget FY22
Description Amount Description Amount
Materials for Contract Overlay $612,400.00 Reserve Patrol $90,000.00
Fog Seal $500,000.00 Gallup Patrol $210,000.00
District Shop $15,100.00 Inmate Crews $10,000.00
Monumentation $2,000.00 Vegetation Management $50,000.00
Traffic Section $120,000.00 District Lab $15,500.00
Grants Patrol $210,000.00 Gallup Project Office 1 $3,000.00
Mesita Patrol $150,000.00 Gallup Project Office 2 $3,000.00
Cuba Patrol $190,000.00 Milan Project Office 1 $3,000.00
San Ysidro Patrol $190,000.00 Milan Project Office 2 $3,000.00
TOW Patrol $210,000.00 Chip Seal $1,300,000.00
Ramah Patrol $120,000.00 Bridge Crew $100,000.00
Datil Patrol $90,000.00 Heavy Maintenance $1,300,000.00
Quemado Patrol $110,000.00 Buffalo Springs Patrol $150,000.00
Fence Lake Patrol $100,000.00 Rest Area Maintenance $242,000.00
Rest Area $22,800.00
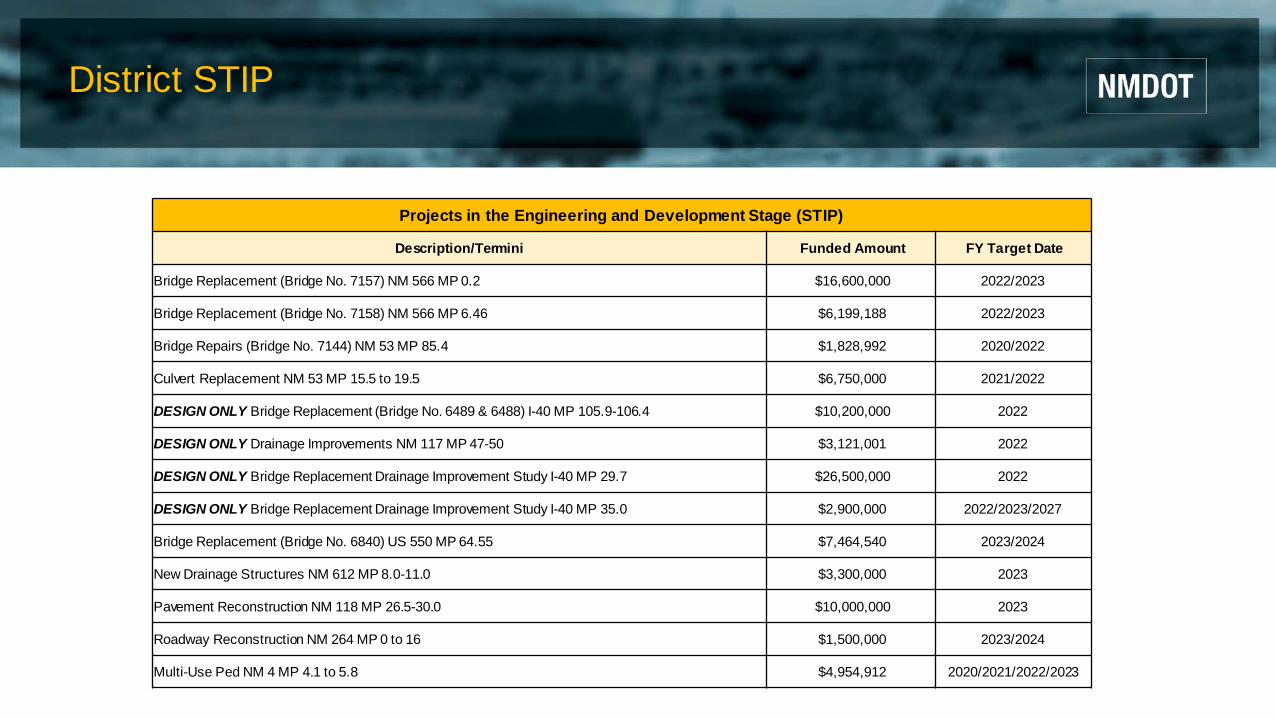
District STIP
Projects in the Engineering and Development Stage (STIP)
Description/Termini Funded Amount FY Target Date
Bridge Replacement (Bridge No. 7157) NM 566 MP 0.2 $16,600,000 2022/2023
Bridge Replacement (Bridge No. 7158) NM 566 MP 6.46 $6,199,188 2022/2023
Bridge Repairs (Bridge No. 7144) NM 53 MP 85.4 $1,828,992 2020/2022
Culvert Replacement NM 53 MP 15.5 to 19.5 $6,750,000 2021/2022
DESIGN ONLY Bridge Replacement (Bridge No. 6489 & 6488) I-40 MP 105.9-106.4 $10,200,000 2022
DESIGN ONLY Drainage Improvements NM 117 MP 47-50 $3,121,001 2022
DESIGN ONLY Bridge Replacement Drainage Improvement Study I-40 MP 29.7 $26,500,000 2022
DESIGN ONLY Bridge Replacement Drainage Improvement Study I-40 MP 35.0 $2,900,000 2022/2023/2027
Bridge Replacement (Bridge No. 6840) US 550 MP 64.55 $7,464,540 2023/2024
New Drainage Structures NM 612 MP 8.0-11.0 $3,300,000 2023
Pavement Reconstruction NM 118 MP 26.5-30.0 $10,000,000 2023
Roadway Reconstruction NM 264 MP 0 to 16 $1,500,000 2023/2024
Multi-Use Ped NM 4 MP 4.1 to 5.8 $4,954,912 2020/2021/2022/2023

District STIP
Projects in the Engineering and Development Stage (STIP)
Description/Termini Funded Amount FY Target Date
Bridge Overlay (Bridge No. 7183,7251,7393,7317) I-40 MP 72.2-85.1 $1,500,000 2023
Roadway Reconstruction NM 264 MP 4 to 20 $27,000,000 2022/2023/2024
New Bridge, Allison Corridor, NM 118 & BNSF $9,000,000 10/21/2022
NM 547 (Roosevelt Ave) Roadway Reconstruction and Bridge Replacement $3,000,000 TBD
NM 547 Cutler Hot and Replace Recycle $2,235,586 2022
Roadway Improvements I-40 MP 36 to 47 $34,000,000 TBD
Roadway Realignment NM 124 MP 0 to 1.15 $950,000 TBD
Roadway Reconstruction I-40 MP 17.9 to 21.9 $14,500,000 2024
Bridge Replacement(No. 3487) Bridge Rehab( No. 6128) I-40 MP 8.7-9.7 $8,750,000 2024/2025
Drainage Improvements NM 117 MP 47 to 50 $3,121,001 2025
Pavement Preservation I-40 MP 9.2 to 16.0 $5,255,863 2023/2024
Additional Lane EB/WB I-40 MP 36 to 47 $3,400,000 2023
Thank You


![%D7%AA%D6%B7%D6%BC%D7%A8%D6%B0%D7%A9 · D7%AA%D6%B7%D6%BC%D7%A8%D6%B0%D7%A9 ... • Jonah 1:3 (Jonah 1:3 [5]), ... Aššur Babylon E](https://img.pdfslide.net/doc/110x75/5b0448167f8b9a2d518d665e/d7aad6b7d6bcd7a8d6b0d7a9-d7aad6b7d6bcd7a8d6b0d7a9-.jpg)