Embed Size (px)
Citation preview
Overview of DEP Climate Change Integrated Modeling Project: Present Activity and
Future Goals
Watershed Science and Technical ConferenceWest Point, New York
September 14-15, 2009
Donald C. Pierson, Elliot M. Schneiderman, Mark S. Zion, David Lounsbury, and Donald Kent
Bureau of Water Supply, New York City Department of Environmental Protection
Hampus MarkenstenUpstate Freshwater Institute
Allan Frei, Aavudai Anandhi, and Adao H. MatonseInstitute for Sustainable Cities, City University of New York
New York City Department of Environmental ProtectionBureau of Water Supply
Water Quality

Effects of Climate Change on the New York City Water Supply
• Climate Change is happening and will continue to occur.
• But we don’t know what the effects will be on: – The Quantity of Water Stored in the Water Supply– The Quality of Water Stored in the Reservoir System.
• Speculation is easy. Projections of changes are difficult, and are inherently uncertain.
• The purpose of this project is to move from speculation to projection.

GCM - Emission Scenario
Current Conditions Scenario
65 Year into Future
Scenario
100 Year into Future
ScenarioECHAM-A1B 1981-2000 2046-2065 2081-2100
ECHAM-A2 “ “ “
ECHAM-B1 “ “ “
GISS-A1B 1981-2000 2046-2065 2081-2100
GISS-A2 “ “ “
GISS-B1 “ “ “
NCAR-A1B 1980-1999 2046-2065 2080-2099
NCAR-A2 “ “ “
•GCM/Emission Scenario data obtained from IPCC AR4 (2007)
•For each GCM/Emission Scenario, precipitation and air temperature are compared in control vs. future periods to derive monthly delta change factors.
Climate Change Scenarios
Delta Change Method Applied for 8 GCM/Emission Scenarios

GCM - Emission Scenario
Current Conditions Scenario
65 Year into Future
Scenario
100 Year into Future
ScenarioECHAM-A1B 1981-2000 + 2.7 °C + 4.1 °C
ECHAM-A2 “ + 2.1 °C + 4.3 °C
ECHAM-B1 “ + 1.8 °C + 2.8 °C
GISS-A1B 1981-2000 + 1.9 °C + 2.7 °C
GISS-A2 “ + 2.1 °C + 3.4 °C
GISS-B1 “ + 1.3 °C + 1.7 °C
NCAR-A1B 1980-1999 + 2.9 °C + 3.5 °C
NCAR-A2 “ + 3.0 °C + 4.8 °C
•GCM/Emission Scenario data obtained from IPCC AR4 (2007)
•For each GCM/Emission Scenario, precipitation and air temperature are compared in control vs. future periods to derive monthly delta change factors.
Climate Change Scenarios
Change in Mean Annual Air Temperature (°C)
GCM - Emission Scenario
Current Conditions Scenario
65 Year into Future
Scenario
100 Year into Future
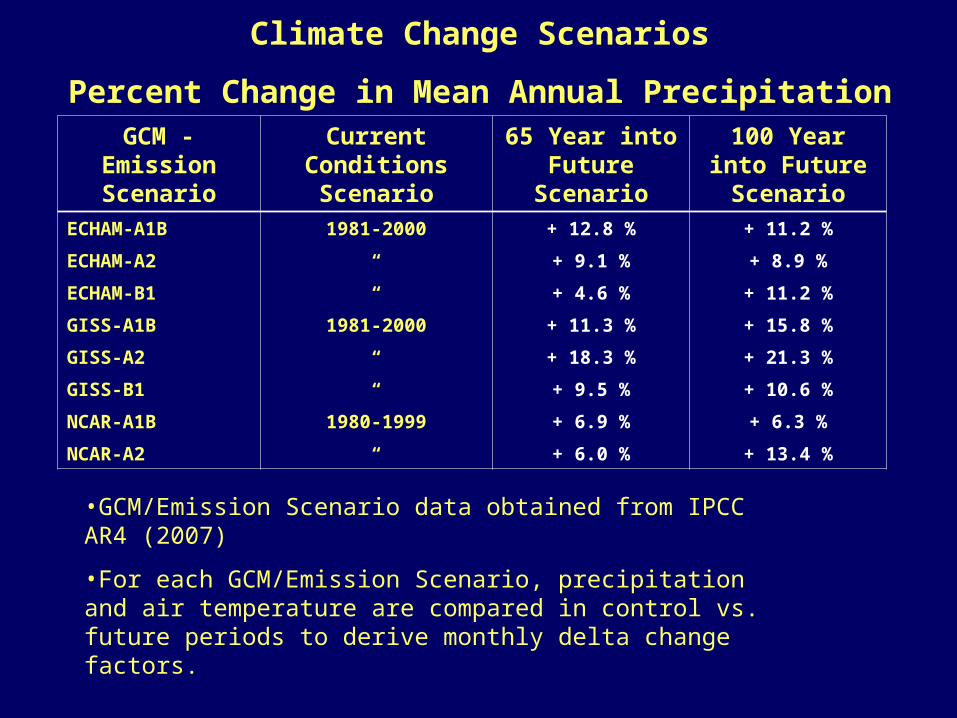
ScenarioECHAM-A1B 1981-2000 + 12.8 % + 11.2 %
ECHAM-A2 “ + 9.1 % + 8.9 %
ECHAM-B1 “ + 4.6 % + 11.2 %
GISS-A1B 1981-2000 + 11.3 % + 15.8 %
GISS-A2 “ + 18.3 % + 21.3 %
GISS-B1 “ + 9.5 % + 10.6 %
NCAR-A1B 1980-1999 + 6.9 % + 6.3 %
NCAR-A2 “ + 6.0 % + 13.4 %
•GCM/Emission Scenario data obtained from IPCC AR4 (2007)
•For each GCM/Emission Scenario, precipitation and air temperature are compared in control vs. future periods to derive monthly delta change factors.
Climate Change Scenarios
Percent Change in Mean Annual Precipitation

0
0.1
0.2
0.3
0.4
0.5
0.6
0.7
J F M A M J J A S O N D
-10
-5
0
5
10
15
20
25
J F M A M J J A S O N D
GCM Derived Changes in Air Temperature and Precipitation and Watershed Model Derived Projections of Stream flow and Snowpack
Sum of Delaware and Catskill System Watersheds100 Year Forward Scenarios
Mean Air Temperature (oC)
Based on 8 GCM/Emission Scenarios. Upper and lower bars are max and min of these. Box is the range of the remaining 6 scenarios. Bar within box is the median. Line shows baseline run.
Mean Precipitation (cm/day)
0
1
2
3
4
5
6
7
8
9
J F M A M J J A S O N D
Mean Snowpack (cm)
0
0.05
0.1
0.15
0.2
0.25
0.3
0.35
0.4
0.45
0.5
J F M A M J J A S O N D
Mean Streamflow (cm/day)
min
max
median
87.5 %tile
12.5 %tile

Start With Speculation
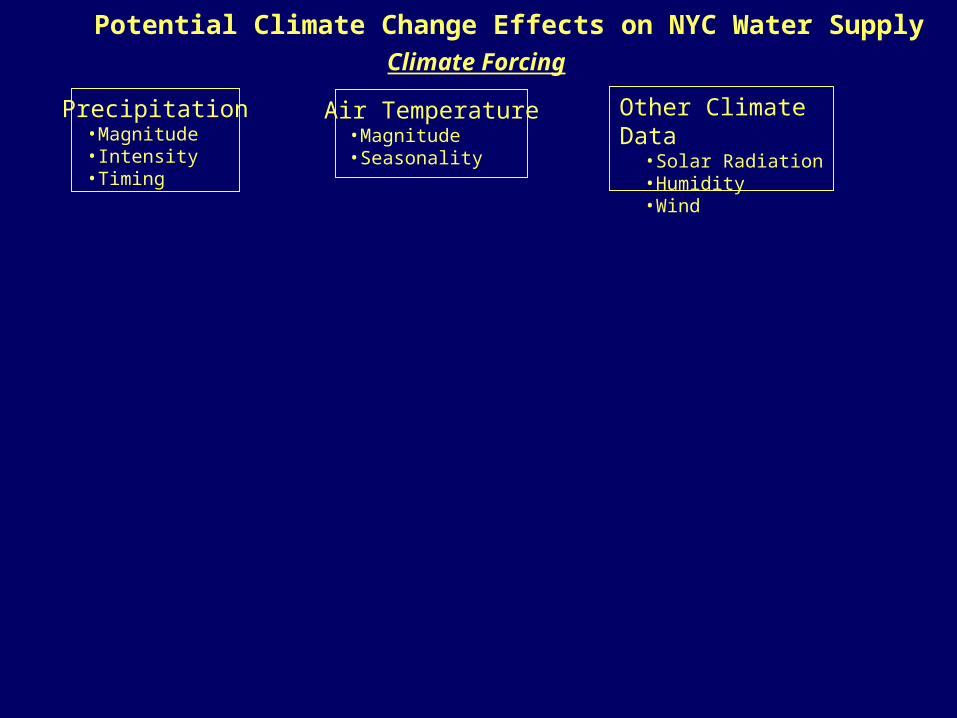
Air Temperature• Magnitude• Seasonality
Precipitation• Magnitude• Intensity• Timing
Other Climate Data• Solar Radiation• Humidity• Wind
Potential Climate Change Effects on NYC Water SupplyClimate Forcing

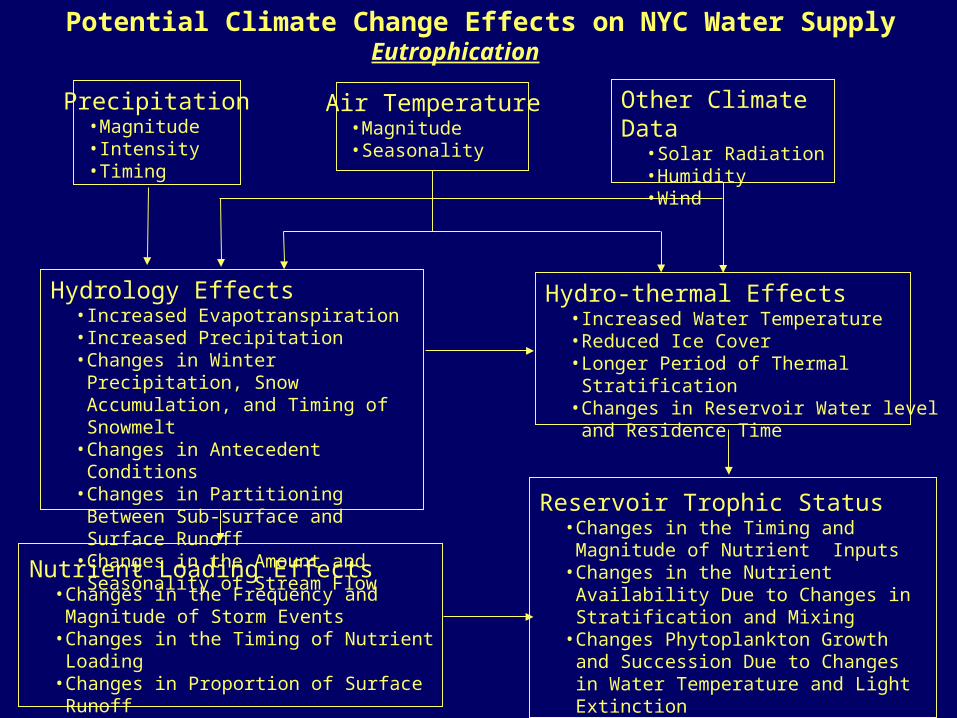
Hydro-thermal Effects• Increased Water Temperature• Reduced Ice Cover• Longer Period of Thermal Stratification• Changes in Reservoir Water level and
Residence Time
Air Temperature• Magnitude• Seasonality
Hydrology Effects• Increased Evapotranspiration• Increased Precipitation• Changes in Winter Precipitation, Snow
Accumulation, and Timing of Snowmelt• Changes in Antecedent Conditions• Changes in Partitioning Between Sub-
surface and Surface Runoff• Changes in the Amount and Seasonality
of Stream Flow
Precipitation• Magnitude• Intensity• Timing
Other Climate Data• Solar Radiation• Humidity• Wind
Potential Climate Change Effects on NYC Water SupplyHydrology and Hydrodynamics

Hydro-thermal Effects• Increased Water Temperature• Reduced Ice Cover• Longer Period of Thermal Stratification• Changes in Reservoir Water level and
Residence Time
Air Temperature• Magnitude• Seasonality
Hydrology Effects• Increased Evapotranspiration• Increased Precipitation• Changes in Winter Precipitation, Snow
Accumulation, and Timing of Snowmelt• Changes in Antecedent Conditions• Changes in Partitioning Between Sub-
surface and Surface Runoff• Changes in the Amount and Seasonality
of Stream Flow
Precipitation• Magnitude• Intensity• Timing
Other Climate Data• Solar Radiation• Humidity• Wind
Potential Climate Change Effects on NYC Water SupplyTurbidity
Turbidity Loading Effects• Changes in the Frequency and Magnitude of
Storm Events• Changes in runoff:rainfall response• Changes in Stream Channel Erosion• Changes in Landscape Erosion
Reservoir Turbidity• Changes in the Frequency and Magnitude
of Turbidity Inputs• Changes in the Transport of Turbidity Due
to Changes in Hydrodynamics• Changes in Reservoir Operations• Changes in Alum Use
Hydro-thermal Effects• Increased Water Temperature• Reduced Ice Cover• Longer Period of Thermal Stratification• Changes in Reservoir Water level and
Residence Time
Air Temperature• Magnitude• Seasonality
Hydrology Effects• Increased Evapotranspiration• Increased Precipitation• Changes in Winter Precipitation, Snow
Accumulation, and Timing of Snowmelt• Changes in Antecedent Conditions• Changes in Partitioning Between Sub-
surface and Surface Runoff• Changes in the Amount and Seasonality
of Stream Flow
Precipitation• Magnitude• Intensity• Timing
Other Climate Data• Solar Radiation• Humidity• Wind
Potential Climate Change Effects on NYC Water SupplyEutrophication
Nutrient Loading Effects• Changes in the Frequency and Magnitude of
Storm Events• Changes in the Timing of Nutrient Loading• Changes in Proportion of Surface Runoff• Changes in Watershed Biogeochemistry
Reservoir Trophic Status• Changes in the Timing and Magnitude of
Nutrient Inputs• Changes in the Nutrient Availability Due to
Changes in Stratification and Mixing• Changes Phytoplankton Growth and
Succession Due to Changes in Water Temperature and Light Extinction
• Changes in Hypolimnetic Oxygen and Nutrients
How to Make Projections

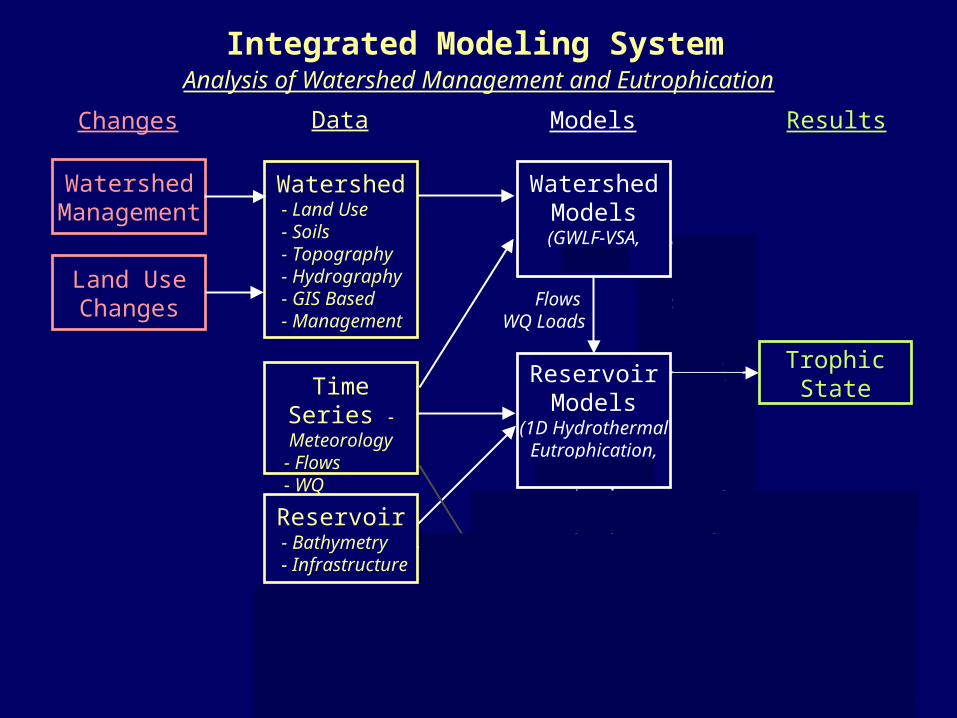
Integrated Modeling System

WatershedModels
(GWLF-VSA,SWAT)
Models
Integrated Modeling System
Watershed - Land Use - Soils - Topography - Hydrography - GIS Based - Management
Data
Time Series - Meteorology
- Flows - WQ
Flows WQ Loads
Watershed Models

WatershedModels
(GWLF-VSA,SWAT)
Models
Flows WQ Loads
Integrated Modeling System
Watershed - Land Use - Soils - Topography - Hydrography - GIS Based - Management
Data
Time Series - Meteorology
- Flows - WQ
ReservoirModels
(1D HydrothermalEutrophication,CEQUAL-W2)
ReservoirWQ
Reservoir - Bathymetry - Infrastructure
Watershed and Reservoir Models
Time Series –Historical Reservoir
Operations

WatershedModels
(GWLF-VSA,SWAT)
Models
Flows WQ Loads
Integrated Modeling System
Watershed - Land Use - Soils - Topography - Hydrography - GIS Based - Management
Data
Time Series - Meteorology
- Flows - WQ
ReservoirModels
(1D HydrothermalEutrophication,CEQUAL-W2)
ReservoirWQ
Reservoir - Bathymetry - Infrastructure
SystemModel(OASIS)
FlowsOperations
System Performance- Storage- Demand- Spills
Watershed, Reservoir and System Models
Results
Flows
System-Operating Rules-Demand
WatershedModels
(GWLF-VSA,SWAT)
Models
Flows WQ Loads
Integrated Modeling System
Watershed - Land Use - Soils - Topography - Hydrography - GIS Based - Management
Data
Time Series - Meteorology
- Flows - WQ
ReservoirModels
(1D HydrothermalEutrophication,CEQUAL-W2)
ReservoirWQ
Reservoir - Bathymetry - Infrastructure
SystemModel(OASIS)
FlowsOperations
Results
Watershed Management
Land Use Changes
Changes
Trophic State
Analysis of Watershed Management and Eutrophication
Flows
System-Operating Rules-Demand
System Performance- Storage- Demand- Spills
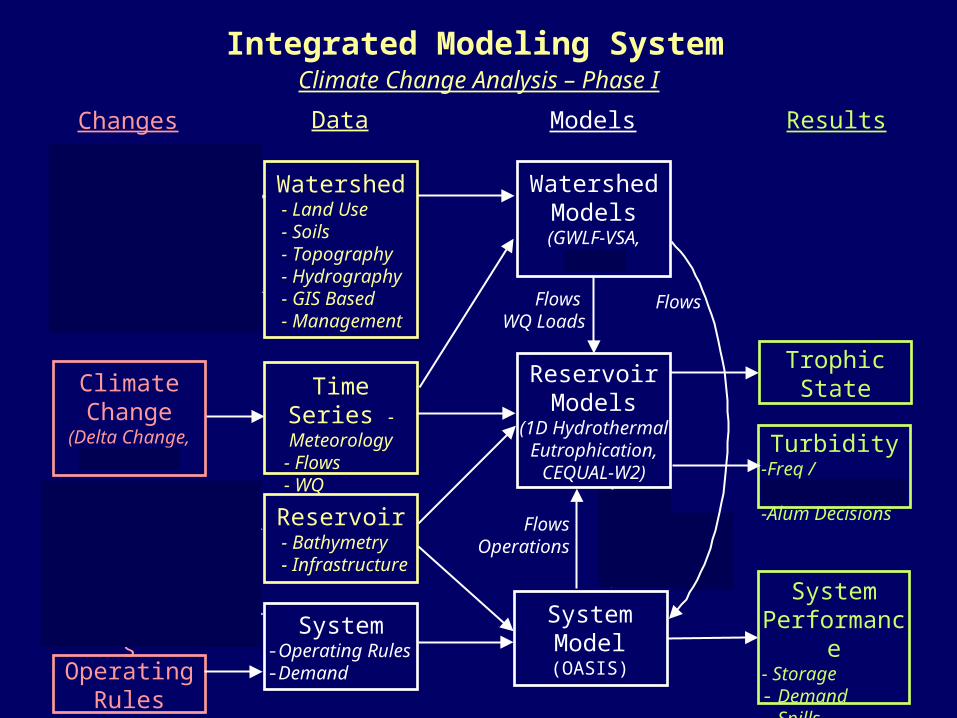
Turbidity-Freq / Magnitude-Alum Decisions
WatershedModels
(GWLF-VSA,SWAT)
Models
Flows WQ Loads
Integrated Modeling System
Watershed - Land Use - Soils - Topography - Hydrography - GIS Based - Management
Data
Time Series - Meteorology
- Flows - WQ
ReservoirModels
(1D HydrothermalEutrophication,CEQUAL-W2)
ReservoirWQ
Reservoir - Bathymetry - Infrastructure
SystemModel(OASIS)
FlowsOperations
Results
Watershed Management
Land Use Changes
Changes
Trophic StateClimate
Change(Delta Change,
SDM,RCM)
Climate Change Analysis – Phase I
Flows
System-Operating Rules-Demand
System Performance- Storage- Demand- Spills
DemandProjections
System Infrastructure
OperatingRules
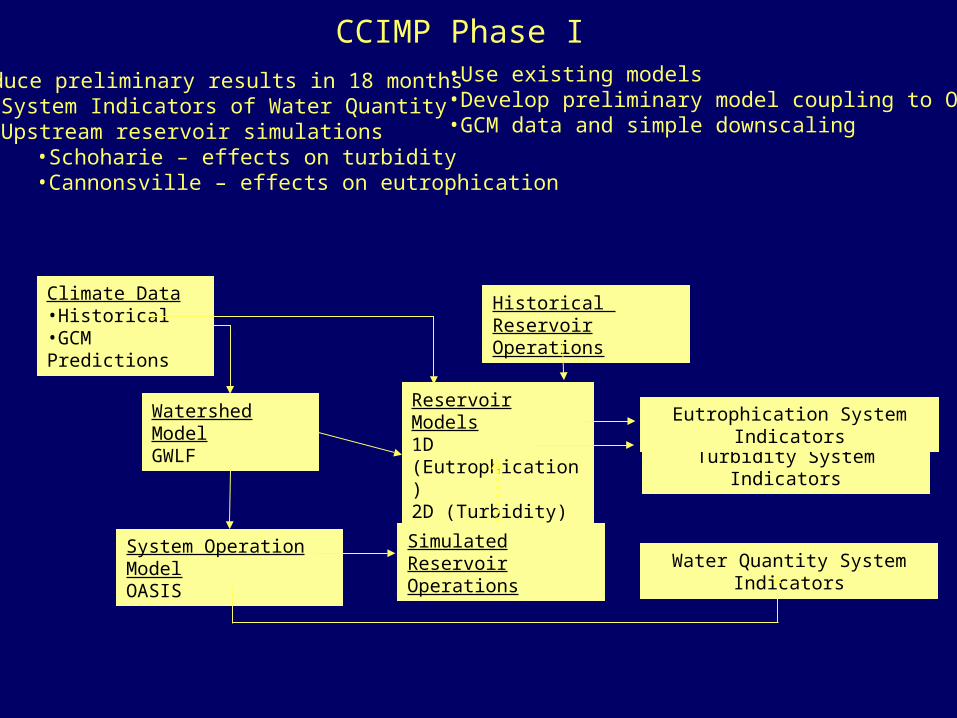
•Produce preliminary results in 18 months•System Indicators of Water Quantity•Upstream reservoir simulations
•Schoharie – effects on turbidity•Cannonsville – effects on eutrophication
•Use existing models•Develop preliminary model coupling to OASIS•GCM data and simple downscaling
CCIMP Phase I
Watershed ModelGWLF
Water Quantity System Indicators
Reservoir Models1D (Eutrophication)2D (Turbidity)
System Operation ModelOASIS
Climate Data•Historical•GCM Predictions
Simulated Reservoir Operations
Turbidity System Indicators
Eutrophication System Indicators
Historical Reservoir Operations

Phase I Study Areas
• Quantity – Focus on West-Of-Hudson watersheds and reservoirs
Location Map
NYState
NY City
• Turbidity – Focus on Schoharie Reservoir
• Eutrophication – Focus on Cannonsville Reservoir
A. Anandhi et al. Future climate projections of NYC watershed: GCM selection and downscaling.
A. Matonse et al. Climate change impacts on water availability in NYC water supply
M. Zion et al. Potential Impacts of Climate Change on Water Quality in New York City Water Supply System
H. Markensten et al. Climate Change Effects on Phytoplankton Composition in Cannonsville Reservoir
Results Presented Here

Continuation of Phase I •Improved Downscaling•Expanded reservoir simulations
• Catskill System – effects on turbidity• Delaware System – effects on eutrophication
•Expanded system operation modeling• More explicit accounting of EOH and Delaware
River Basin• Explicit Feedback between Water Quality and
Operation – Use of OST
CCIMP Phase II
Watershed ModelExpanded in scope and greater testingGWLFSWATConcepts
Reservoir Models1D (Eutrophication)2D (Turbidity)Expanded in scope and greater testing
Climate Data•Historical•GCM Predictions•Improved Downscaling
Turbidity System Indicators
Eutrophication System Indicators
Additional Tasks •Watershed erosion sediment transport modeling•Forest Modeling•Explicit modeling of watershed biogeochemistry•Model evaluation for climate sensitivity
• What model processes are most sensitive to Climate Change?
• Are these processes adequately represented in models?
Forest Model
Water Quantity System Indicators
System Operation ModelOASIS
Simulated Reservoir Operations Optimization for future climate

Summary• DEP’s system of watershed, reservoir and system operation models are valuable
tools to project potential climate change effects on the NYC Water Supply, and to define the climate mediated processes that will be of greatest importance
• An Initial phase of analysis is nearing completion and results will be presented in the remainder of this session
• Future analysis will make use of improved climate data sets and improved models. New modeling of watershed erosion and forest processes will be undertaken
• Phase I analysis, while a valuable initial step, and the best estimate we can make at this time, can not be used to make definitive climate change predictions
• Modeling improvements and enhancements to improve climate change projections will lead to improvements in our other modeling missions such as evaluation of watershed management programs and management of reservoir turbidity

Aknowledgements
• DEP for funding of CCIMP project as a joint effort with CUNY.
• Columbia University and NASA GISS for support in planning CCIMP, and for initial GCM data
• Outside reviewers of CCIMP project

Extra
WatershedModels
(GWLF-VSA,SWAT)
Models
Flows WQ Loads
Integrated Modeling System
Watershed - Land Use - Soils - Topography - Hydrography - GIS Based - Management
Data
Time Series - Meteorology
- Flows - WQ
ReservoirModels
(1D HydrothermalEutrophication,CEQUAL-W2)
ReservoirWQ
Reservoir - Bathymetry - Infrastructure
SystemModel(OASIS)
FlowsOperations
Results
Watershed Management
Land Use Changes
Changes
Trophic State
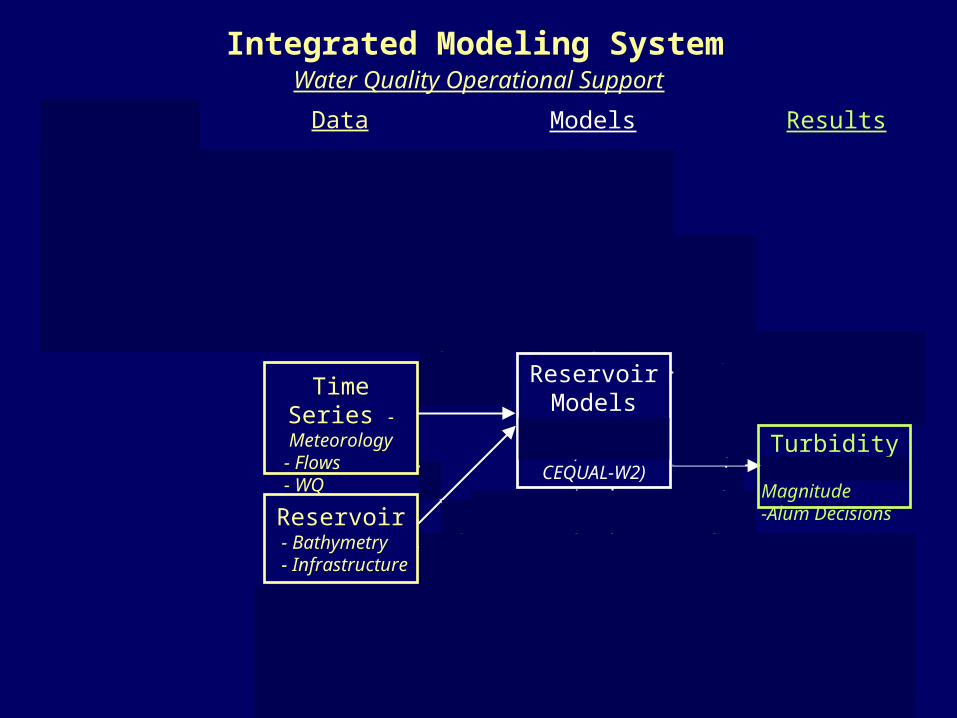
System-Operating Rules-Demand
Water Quality Operational Support
Flows
System Performance- Storage- Demand- Spills
Turbidity-Freq / Magnitude-Alum Decisions
WatershedModels
(GWLF-VSA,SWAT)
Models
Flows WQ Loads
Integrated Modeling System
Watershed - Land Use - Soils - Topography - Hydrography - GIS Based - Management
Data
Time Series - Meteorology
- Flows - WQ
ReservoirModels
(1D HydrothermalEutrophication,CEQUAL-W2)
ReservoirWQ
Reservoir - Bathymetry - Infrastructure
SystemModel(OASIS)
FlowsOperations
Results
Watershed Management
Land Use Changes
Changes
Trophic State
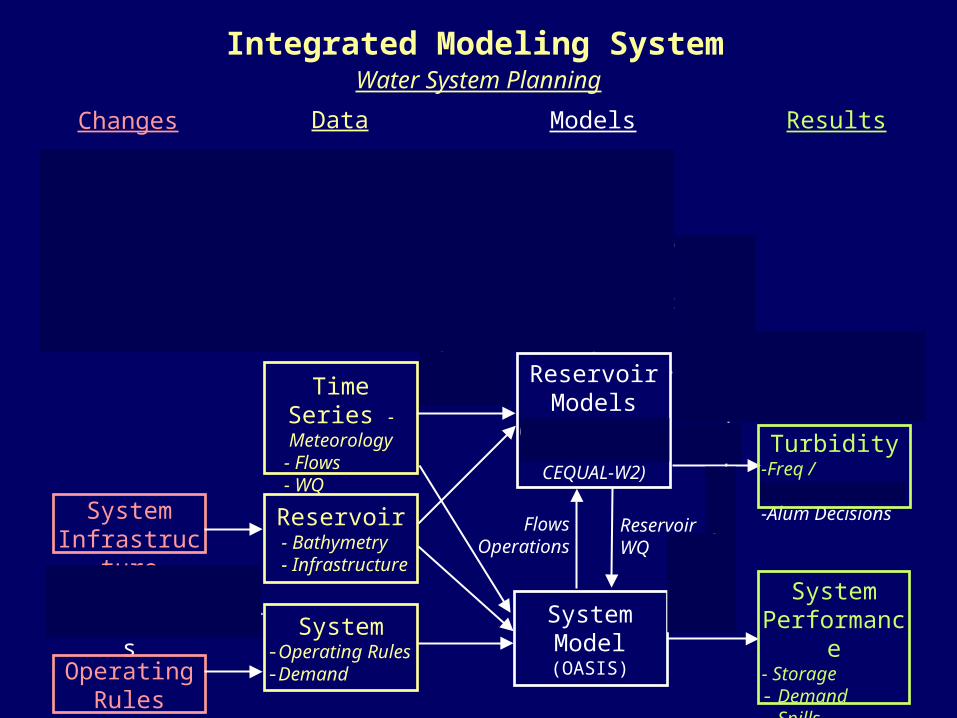
DemandProjections
System Infrastructure
Water System Planning
Flows
System-Operating Rules-Demand
System Performance- Storage- Demand- Spills
Turbidity-Freq / Magnitude-Alum Decisions
OperatingRules
WatershedModels
(GWLF-VSA,SWAT)
Models
Flows WQ Loads
Integrated Modeling System
Watershed - Land Use - Soils - Topography - Hydrography - GIS Based - Management
Data
Time Series - Meteorology
- Flows - WQ
ReservoirModels
(1D HydrothermalEutrophication,CEQUAL-W2)
ReservoirWQ
Reservoir - Bathymetry - Infrastructure
SystemModel(OASIS)
FlowsOperations
Results
Watershed Management
Land Use Changes
Changes
Trophic State
OperatingDecisions
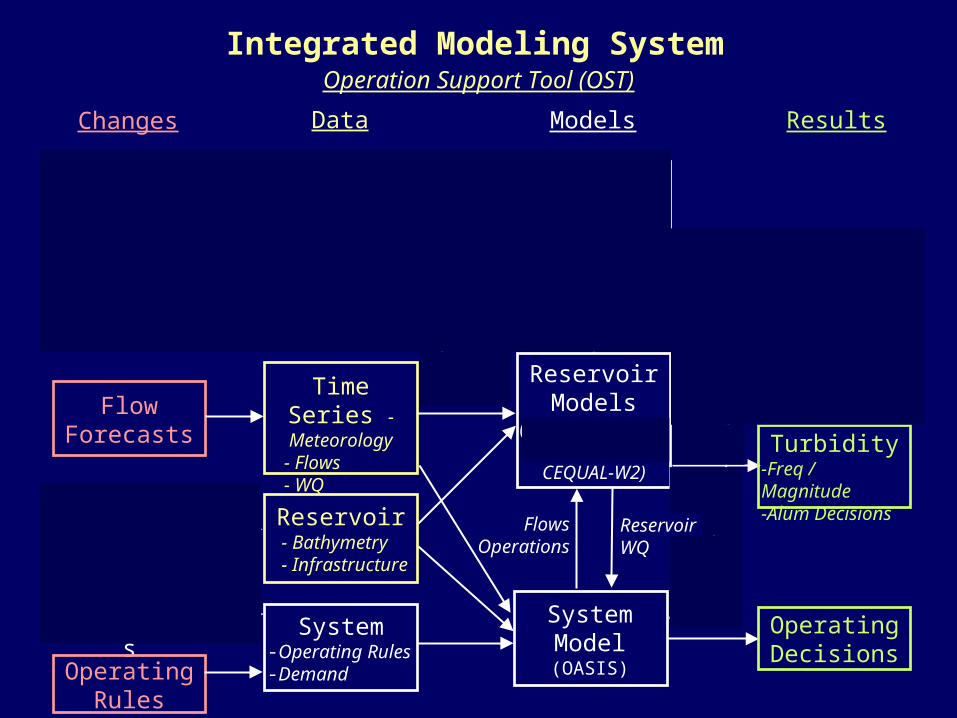
FlowForecasts
Operation Support Tool (OST)
Flows
System-Operating Rules-Demand
Turbidity-Freq / Magnitude-Alum Decisions
DemandProjections
System Infrastructure
OperatingRules

WatershedModels
(GWLF-VSA,SWAT)
Models
Flows WQ Loads
Integrated Modeling System
Watershed - Land Use - Soils - Topography - Hydrography - GIS Based - Management
Data
Time Series - Meteorology
- Flows - WQ
ReservoirModels
(1D HydrothermalEutrophication,CEQUAL-W2)
ReservoirWQ
Reservoir - Bathymetry - Infrastructure
SystemModel(OASIS)
FlowsOperations
Results
Watershed Management
Land Use Changes
Changes
Trophic State
Climate Change Adaptation - OST
Flows
System-Operating Rules-Demand
System Performance- Storage- Demand- Spills
Turbidity-Freq / Magnitude-Alum Decisions
Climate Change
(Delta Change,SDM,RCM)
DemandProjections
System Infrastructure
OperatingRules

Climate Change
(Delta Change,SDM,RCM)
WatershedModels
(GWLF-VSA,SWAT)
Models
Flows WQ Loads
Integrated Modeling System
Watershed - Land Use - Soils - Topography - Hydrography - GIS Based - Management
Data
Time Series - Meteorology
- Flows - WQ
ReservoirModels
(1D HydrothermalEutrophication,CEQUAL-W2)
ReservoirWQ
Reservoir - Bathymetry - Infrastructure
SystemModel(OASIS)
FlowsOperations
Results
Watershed Management
Land Use Changes
Changes
Trophic State
Climate Change Analysis – Phase II
Watershed-Sediment -Nutrients -Ecosystem
Flows
System-Operating Rules-Demand
System Performance- Storage- Demand- Spills
Turbidity-Freq / Magnitude-Alum Decisions
DemandProjections
System Infrastructure
OperatingRules
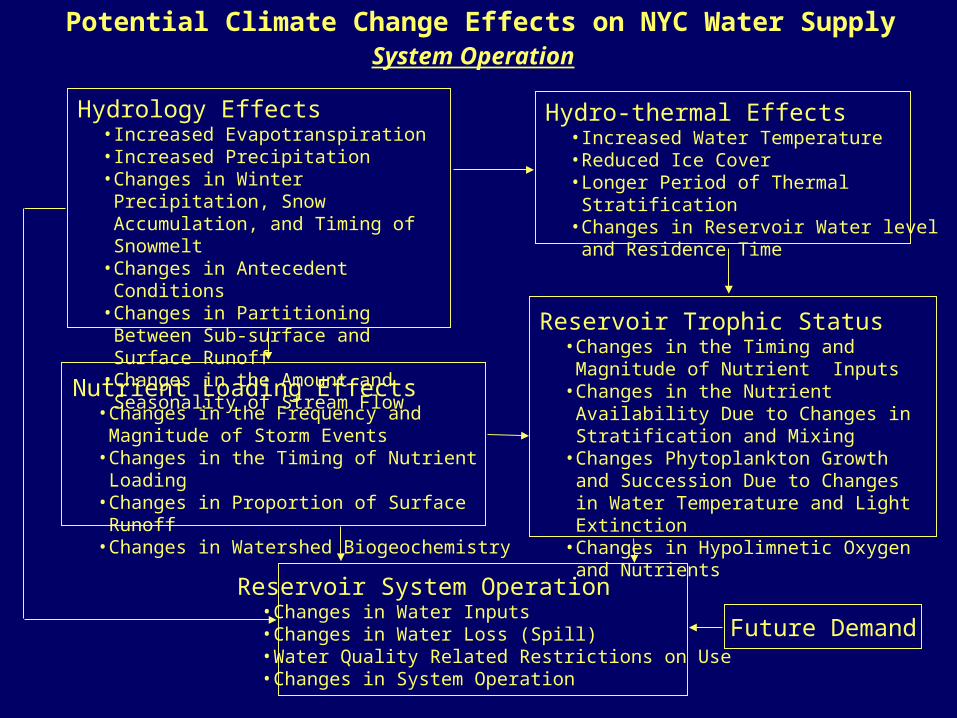
Potential Climate Change Effects on NYC Water SupplySystem Operation
Hydro-thermal Effects• Increased Water Temperature• Reduced Ice Cover• Longer Period of Thermal Stratification• Changes in Reservoir Water level and
Residence Time
Hydrology Effects• Increased Evapotranspiration• Increased Precipitation• Changes in Winter Precipitation, Snow
Accumulation, and Timing of Snowmelt• Changes in Antecedent Conditions• Changes in Partitioning Between Sub-
surface and Surface Runoff• Changes in the Amount and Seasonality
of Stream Flow
Nutrient Loading Effects• Changes in the Frequency and Magnitude of
Storm Events• Changes in the Timing of Nutrient Loading• Changes in Proportion of Surface Runoff• Changes in Watershed Biogeochemistry
Reservoir Trophic Status• Changes in the Timing and Magnitude of
Nutrient Inputs• Changes in the Nutrient Availability Due to
Changes in Stratification and Mixing• Changes Phytoplankton Growth and
Succession Due to Changes in Water Temperature and Light Extinction
• Changes in Hypolimnetic Oxygen and Nutrients
Reservoir System Operation• Changes in Water Inputs• Changes in Water Loss (Spill)• Water Quality Related Restrictions on Use• Changes in System Operation
Future Demand