Embed Size (px)
Citation preview
Overview of Distribution System Optimization (DSO)
Training
Presentation 1DSO Training
April 2015
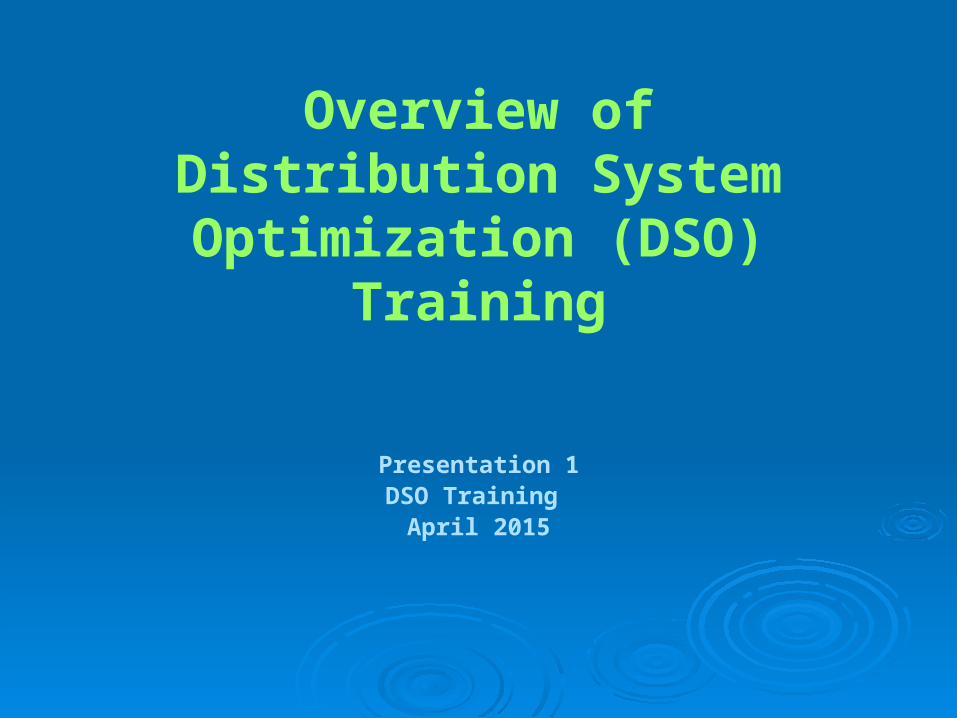
Regions covered by TA’s
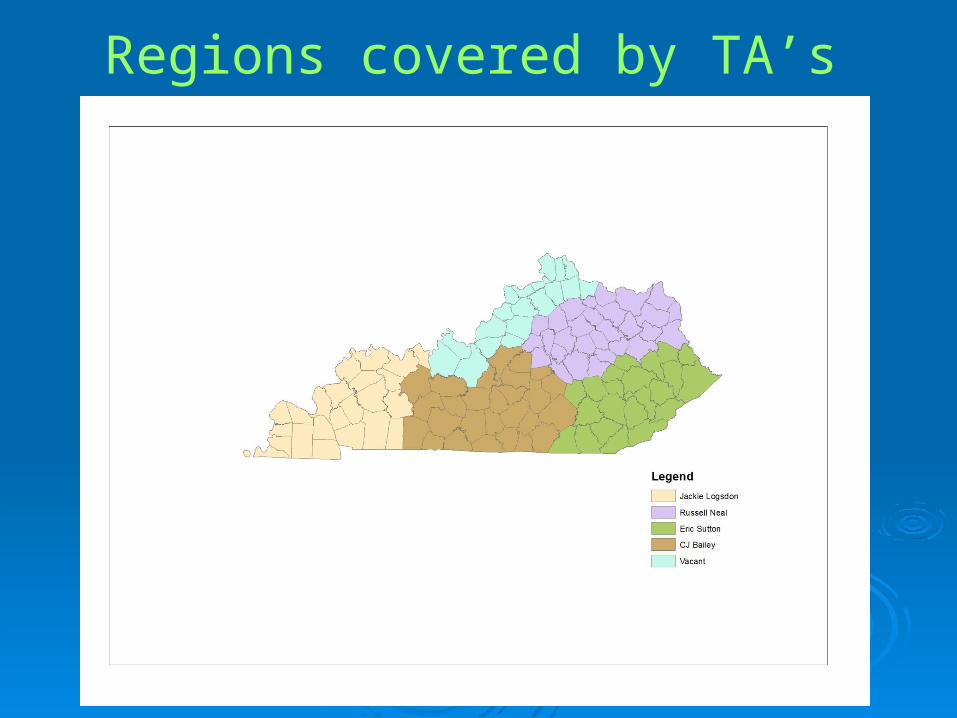
OEL Form
Water Treatment & DistributionOptimization Overview
History
Challenges
Approach
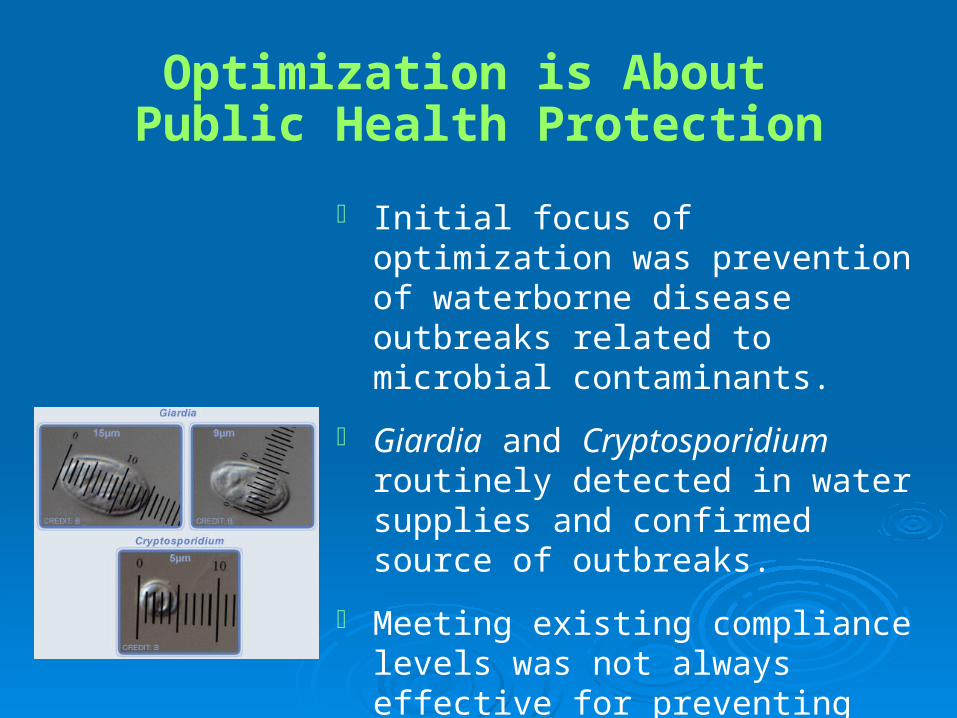
Optimization is About Public Health Protection
Initial focus of optimization was prevention of waterborne disease outbreaks related to microbial contaminants.
Giardia and Cryptosporidium routinely detected in water supplies and confirmed source of outbreaks.
Meeting existing compliance levels was not always effective for preventing outbreaks.
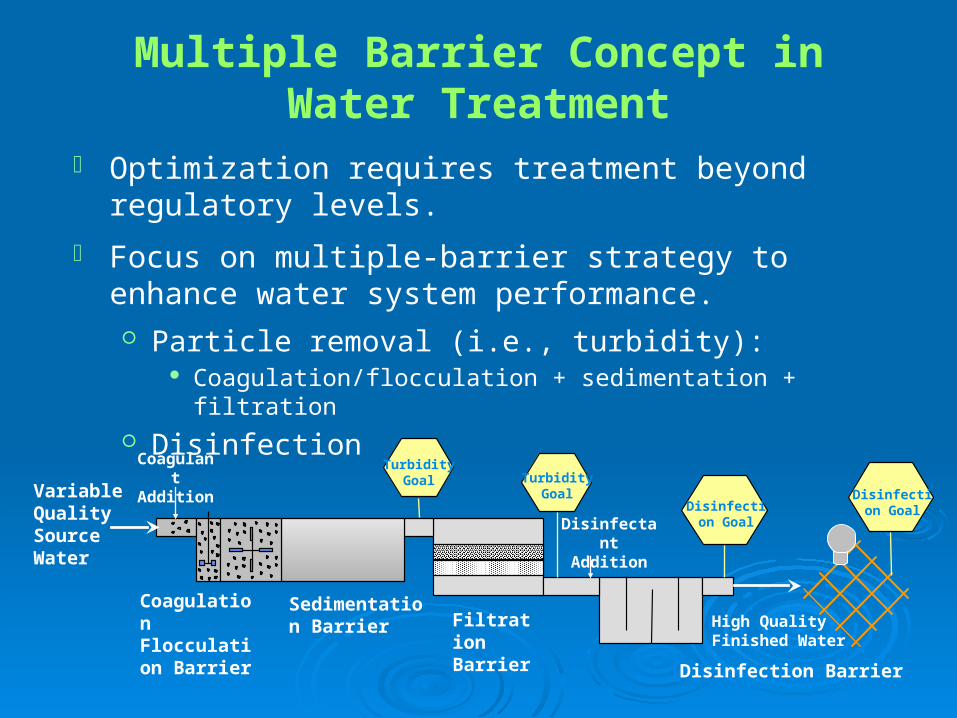
Multiple Barrier Concept in Water Treatment
Optimization requires treatment beyond regulatory levels.
Focus on multiple-barrier strategy to enhance water system performance. Particle removal (i.e., turbidity):
Coagulation/flocculation + sedimentation + filtration Disinfection
Sedimentation Barrier Filtratio
n Barrier Disinfection Barrier
Variable Quality Source Water
Turbidity Goal Turbidity
GoalDisinfectio
n Goal
Coagulant
Addition
Disinfectant Addition
Coagulation Flocculation Barrier
Disinfection Goal
High Quality Finished Water
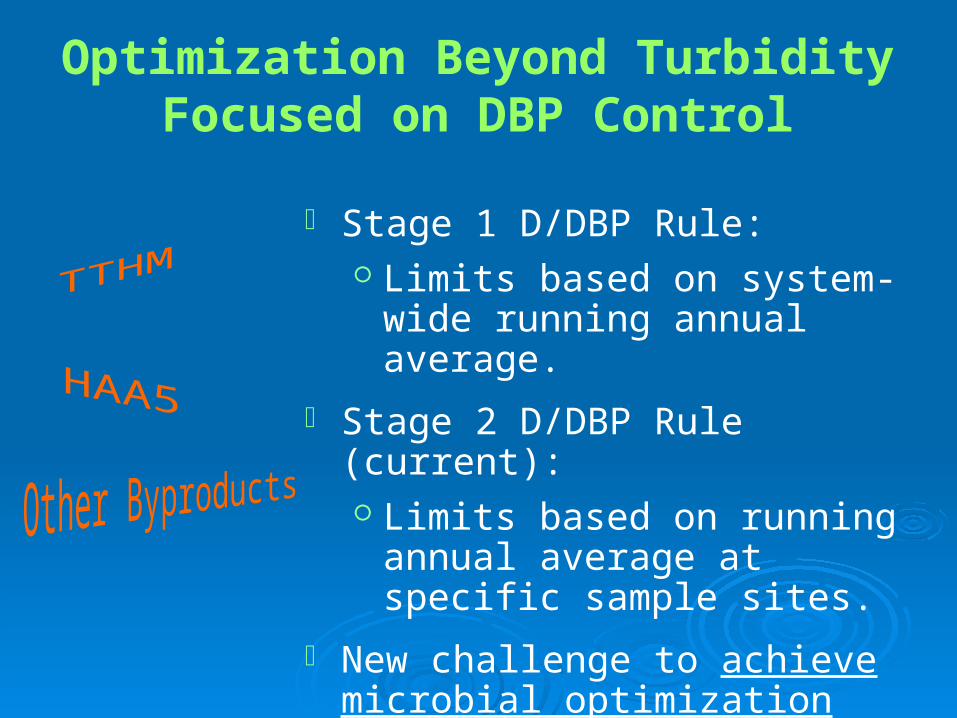
Optimization Beyond Turbidity Focused on DBP Control
Stage 1 D/DBP Rule: Limits based on system-wide
running annual average.
Stage 2 D/DBP Rule (current): Limits based on running annual
average at specific sample sites.
New challenge to achieve microbial optimization goals while minimizing DBP formation.
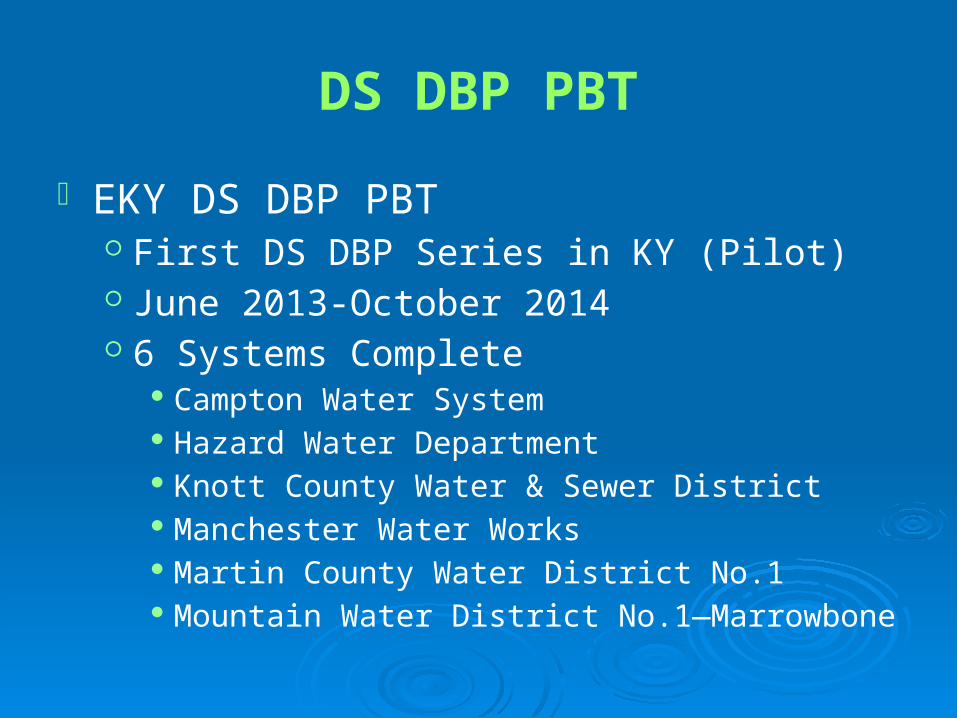
EKY DS DBP PBT First DS DBP Series in KY (Pilot) June 2013-October 2014 6 Systems Complete
Campton Water System Hazard Water Department Knott County Water & Sewer District Manchester Water Works Martin County Water District No.1 Mountain Water District No.1—Marrowbone
DS DBP PBT
DS DBP PBT
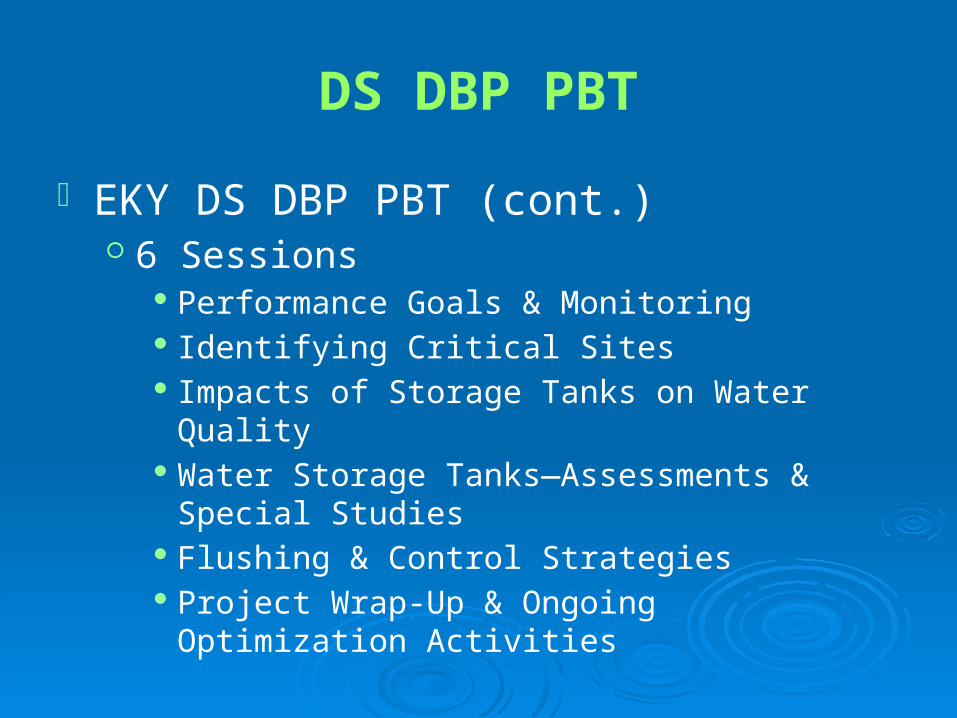
EKY DS DBP PBT (cont.) 6 Sessions
Performance Goals & Monitoring Identifying Critical Sites Impacts of Storage Tanks on Water Quality Water Storage Tanks—Assessments & Special
Studies Flushing & Control Strategies Project Wrap-Up & Ongoing Optimization Activities
DS DBP PBT
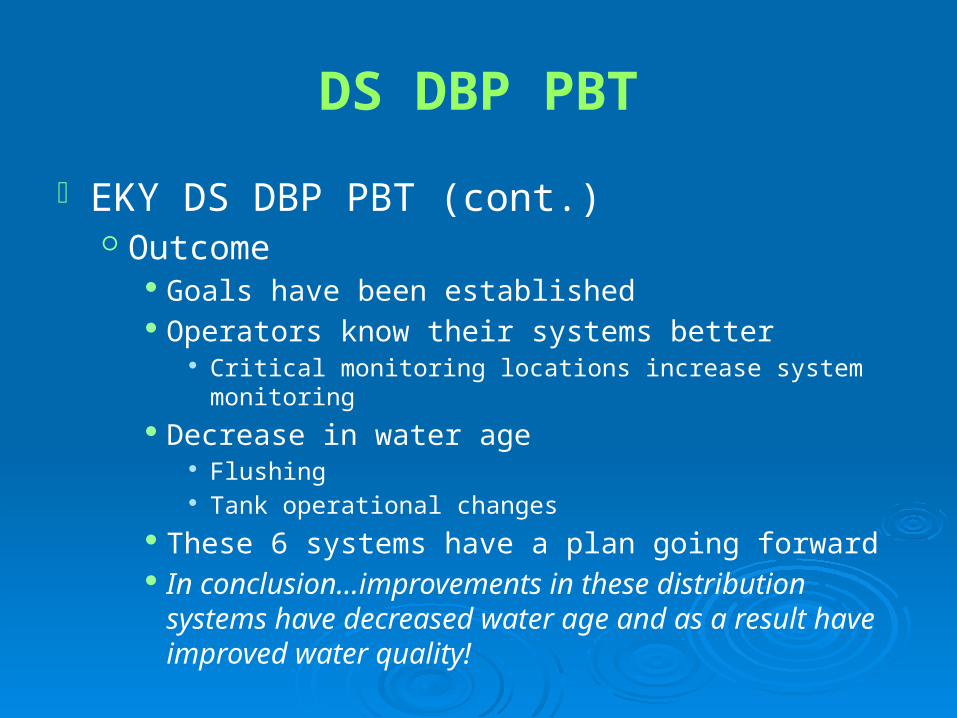
EKY DS DBP PBT (cont.) Outcome
Goals have been established Operators know their systems better
Critical monitoring locations increase system monitoring Decrease in water age
Flushing Tank operational changes
These 6 systems have a plan going forward In conclusion…improvements in these distribution
systems have decreased water age and as a result have improved water quality!
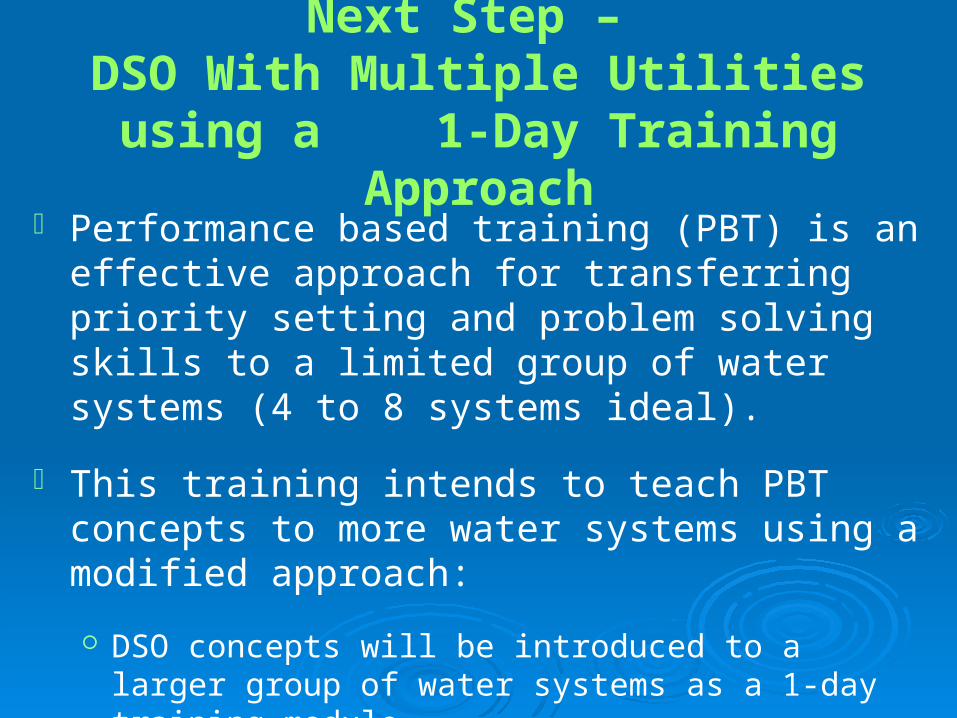
Next Step – DSO With Multiple Utilities using a
1-Day Training Approach Performance based training (PBT) is an effective
approach for transferring priority setting and problem solving skills to a limited group of water systems (4 to 8 systems ideal).
This training intends to teach PBT concepts to more water systems using a modified approach:
DSO concepts will be introduced to a larger group of water systems as a 1-day training module.
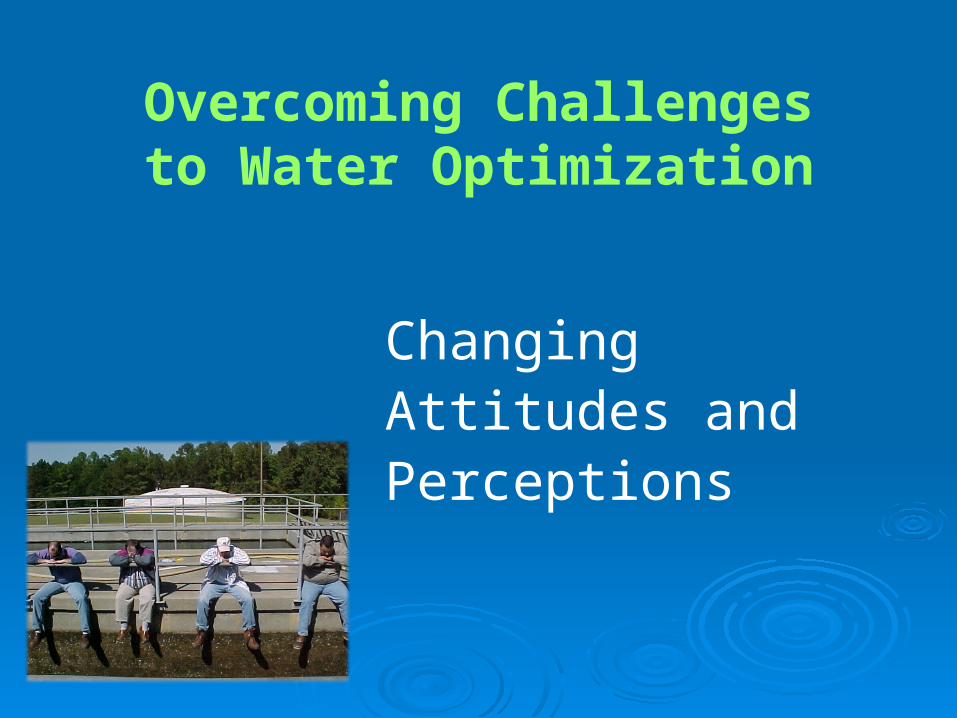
Overcoming Challenges to Water Optimization
Changing Attitudes and Perceptions
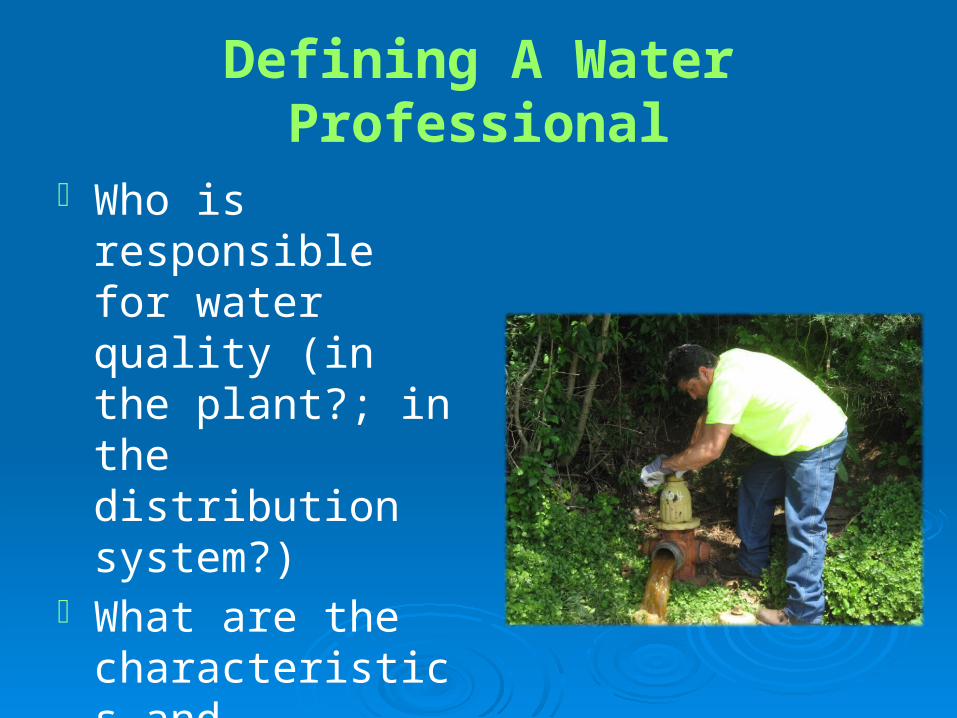
Defining A Water Professional
Who is responsible for water quality (in the plant?; in the distribution system?)
What are the characteristics and attributes of these individuals
Summary
Distribution system optimization is a new field of learning for everyone.
Initial efforts focused on working with one utility at a time.
Performance Based Training is a proven approach for applying optimization principles to a group of water utilities.
A distribution system optimization 1-day training approach is being piloted to reach more water systems.
Why Optimize in the Distribution System?
Motivation for Optimizationand Performance Goals
Presentation #1BDSO Training
April 2015
Overview
Motivation for distribution system optimization
Optimization focus on water quality
Distribution system optimization goals

WHY?
The Motivation
Why Optimize the Distribution System? Public health protection:
On average, from 1971 to 2002, a distribution-related outbreak caused 152 illnesses, with the largest causing as many as 5,000 illnesses (Craun et al., 2006).
Public health risks include: Microbial contaminants (e.g., Salmonella, E. coli, Legionella, Naegleria
fowleri)
Chemical contaminants (e.g., organic, inorganic, disinfection byproducts ~ TTHMs, HAAs)
Secondary benefits: Proactive approach to meeting compliance.
Fewer complaints, happier customers!
Why Optimize in the Distribution System?
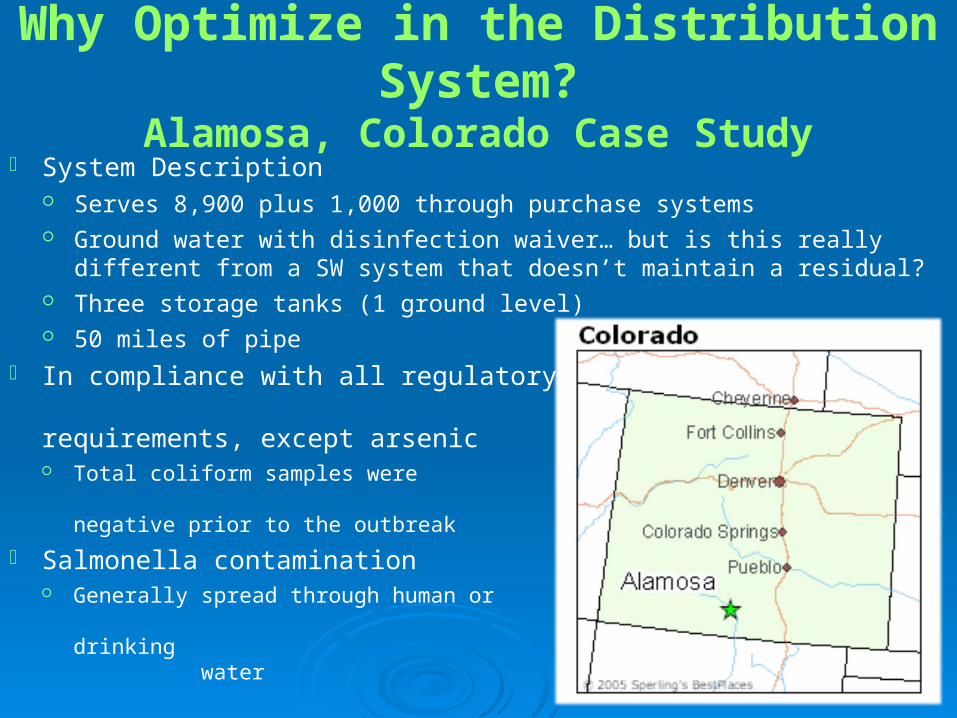
Alamosa, Colorado Case Study System Description
Serves 8,900 plus 1,000 through purchase systems Ground water with disinfection waiver… but is this really different from a
SW system that doesn’t maintain a residual? Three storage tanks (1 ground level) 50 miles of pipe
In compliance with all regulatory requirements, except arsenic Total coliform samples were
negative prior to the outbreak
Salmonella contamination Generally spread through human or
animal feces ~ rarely through drinking water
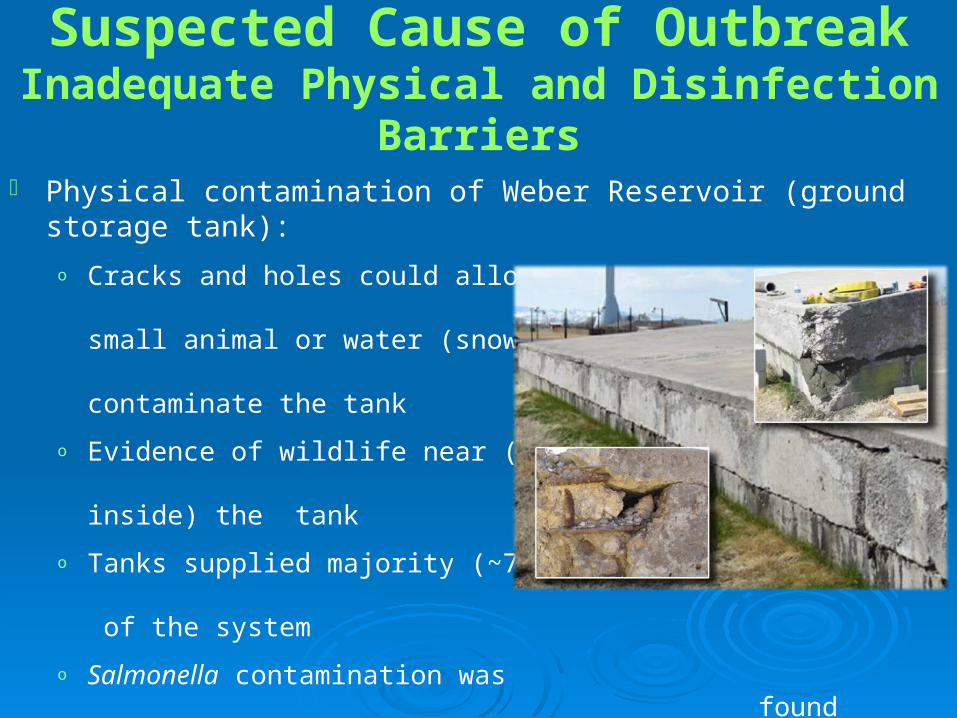
Suspected Cause of OutbreakInadequate Physical and Disinfection Barriers
Physical contamination of Weber Reservoir (ground storage tank):
o Cracks and holes could allow small animal or water (snow melt?) to contaminate the tank
o Evidence of wildlife near (but not inside) the tank
o Tanks supplied majority (~75%) of the system
o Salmonella contamination was found throughout the system
No disinfection barrier in the system!
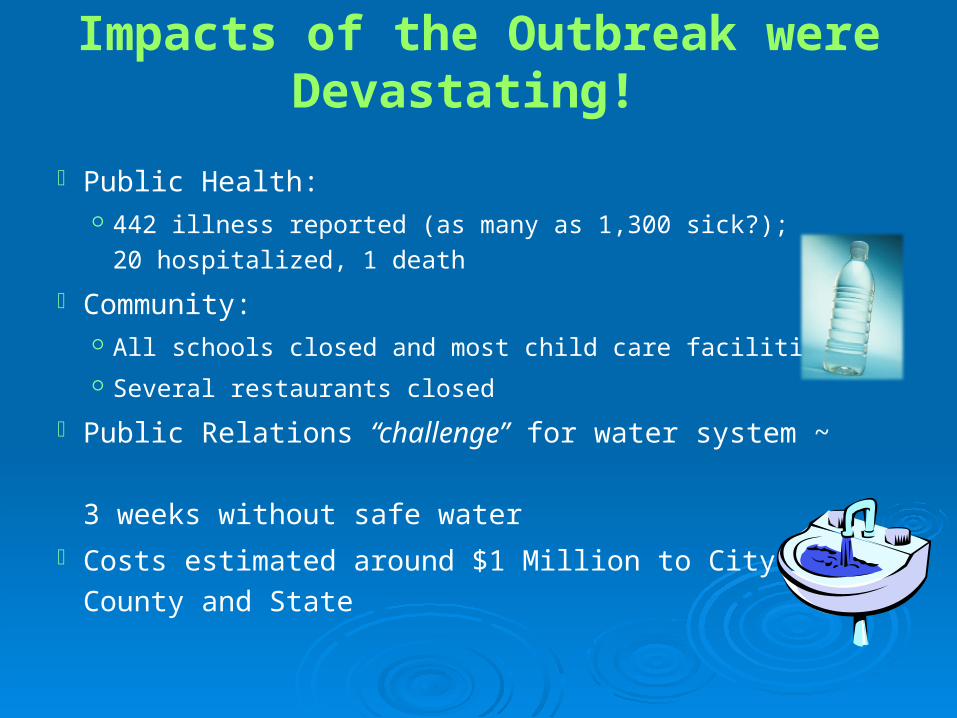
Impacts of the Outbreak were Devastating!
Public Health: 442 illness reported (as many as 1,300 sick?); 20
hospitalized, 1 death
Community: All schools closed and most child care facilities
Several restaurants closed
Public Relations “challenge” for water system ~
3 weeks without safe water
Costs estimated around $1 Million to City, County
and State
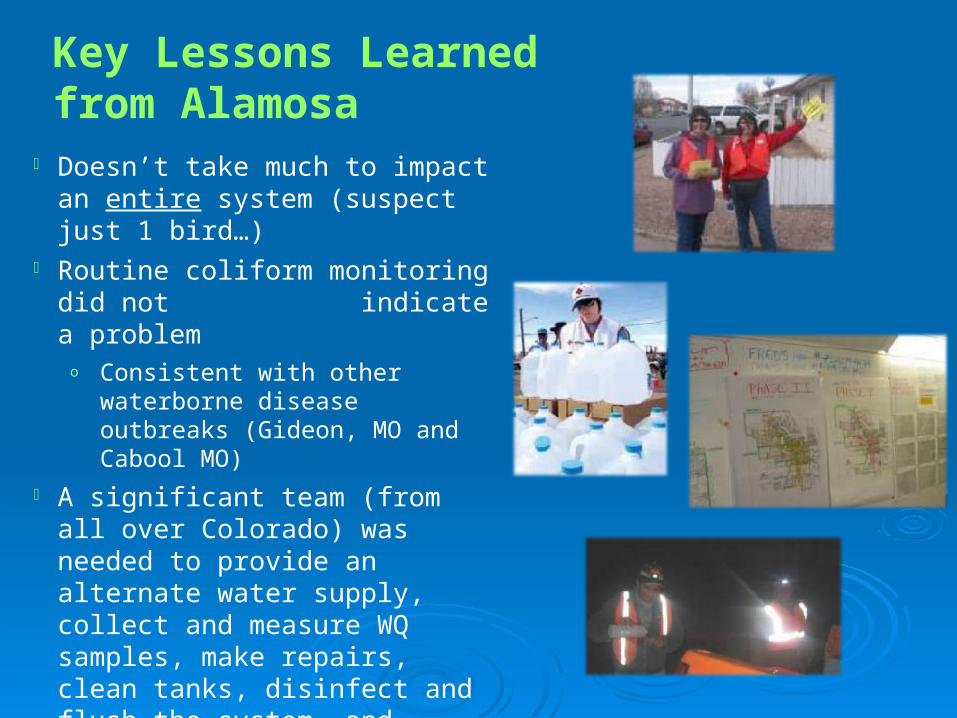
Key Lessons Learned from Alamosa Doesn’t take much to impact an
entire system (suspect just 1 bird…) Routine coliform monitoring did not
indicate a problemo Consistent with other waterborne
disease outbreaks (Gideon, MO and Cabool MO)
A significant team (from all over Colorado) was needed to provide an alternate water supply, collect and measure WQ samples, make repairs, clean tanks, disinfect and flush the system, and notify citizens
The citizens and businesses were without safe drinking water for nearly three weeks
HOW?
Protecting Water Quality and Public Health
through Optimization
Distribution System: The Last Barrier(s) to Public Health Protection
Protecting the physical barrier/ infrastructure from contamination (e.g., maintaining pressure, preventing backflow, protecting storage tanks, etc.)
Providing a disinfection barrier against contamination and water quality deterioration
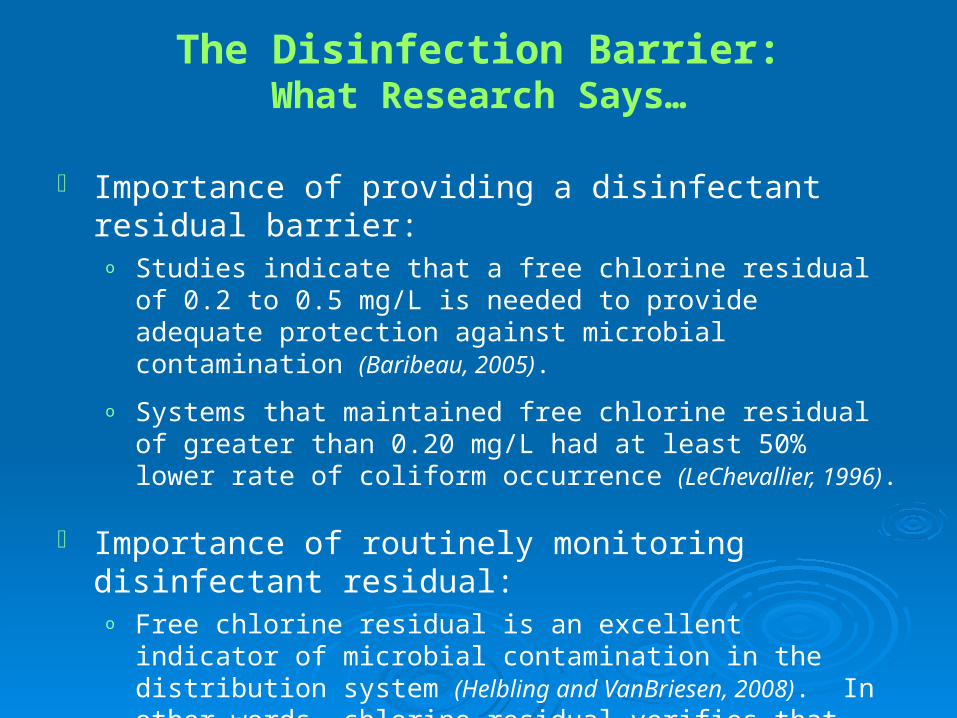
The Disinfection Barrier:What Research Says…
Importance of providing a disinfectant residual barrier: o Studies indicate that a free chlorine residual of 0.2 to 0.5 mg/L is
needed to provide adequate protection against microbial contamination (Baribeau, 2005).
o Systems that maintained free chlorine residual of greater than 0.20 mg/L had at least 50% lower rate of coliform occurrence (LeChevallier, 1996).
Importance of routinely monitoring disinfectant residual:o Free chlorine residual is an excellent indicator of microbial
contamination in the distribution system (Helbling and VanBriesen, 2008). In other words… chlorine residual verifies that the physical (and disinfection) barriers are in place.
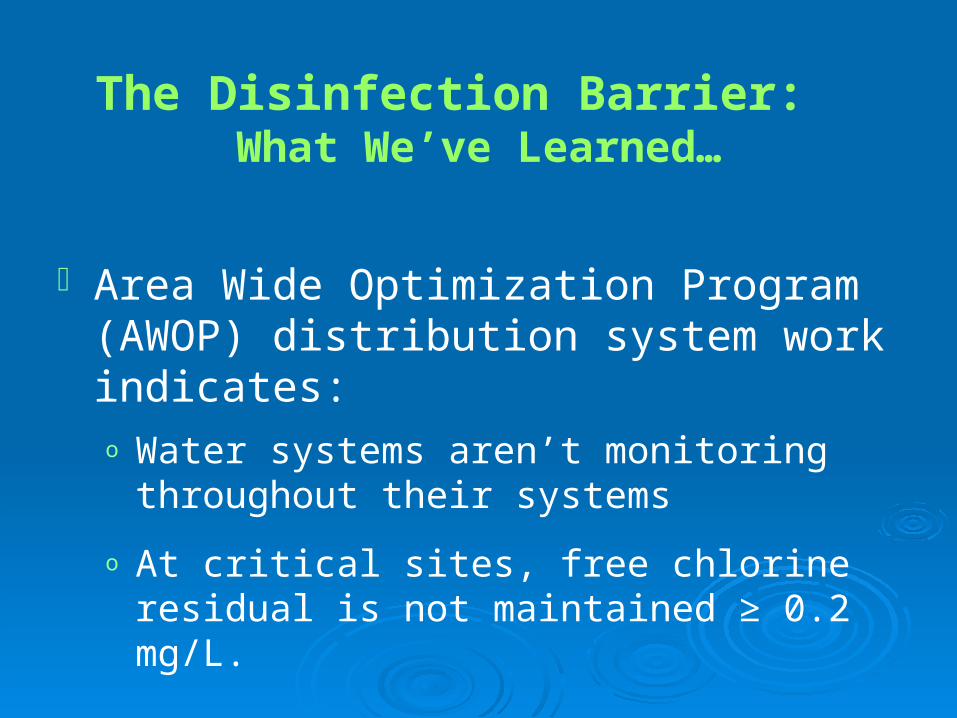
The Disinfection Barrier: What We’ve Learned…
Area Wide Optimization Program (AWOP) distribution system work indicates:o Water systems aren’t monitoring throughout
their systems
o At critical sites, free chlorine residual is not maintained ≥ 0.2 mg/L.
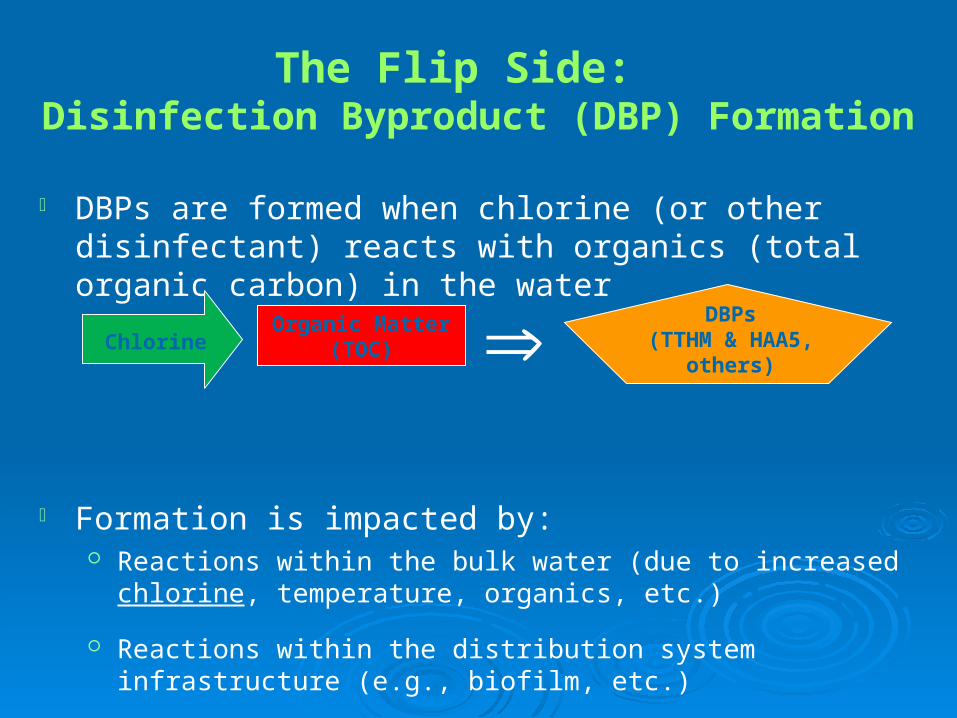
The Flip Side: Disinfection Byproduct (DBP) Formation
DBPs are formed when chlorine (or other disinfectant) reacts with organics (total organic carbon) in the water
Formation is impacted by: Reactions within the bulk water (due to increased chlorine,
temperature, organics, etc.)
Reactions within the distribution system infrastructure (e.g., biofilm, etc.)
Water age (time)
Organic Matter (TOC)Chlorine
DBPs(TTHM & HAA5,
others)
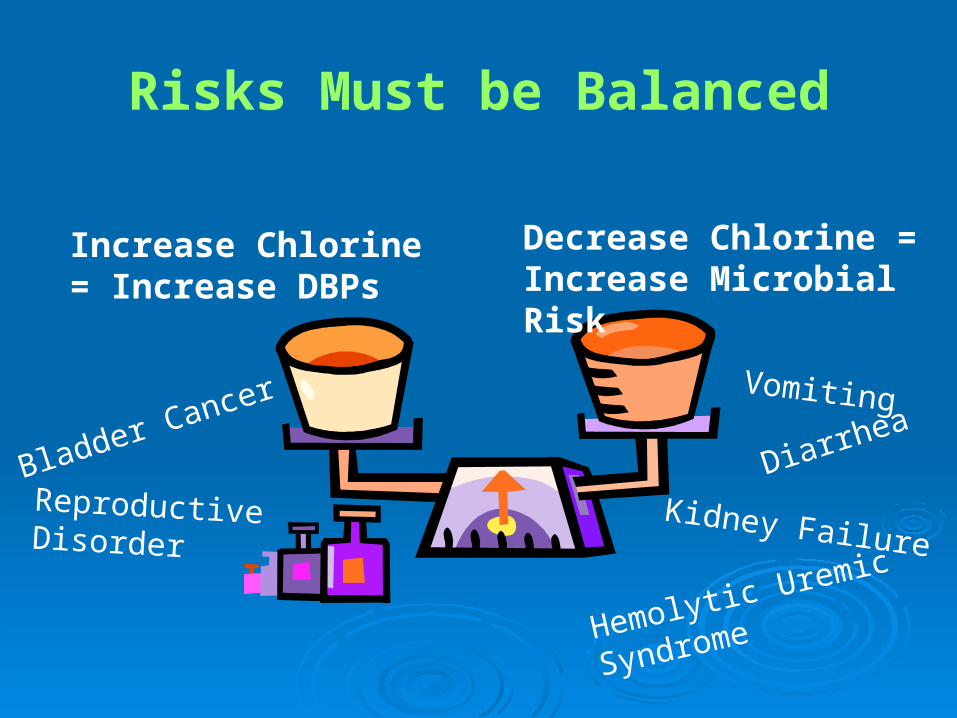
Risks Must be Balanced
Increase Chlorine = Increase DBPs
Decrease Chlorine = Increase Microbial Risk
Bladder Cancer
Reproductive Disorder
Diarrhea
Kidney Failure
Hemolytic Uremic
Syndrome
Vomiting
Optimized Performance Starts by
Setting Water Quality Goals
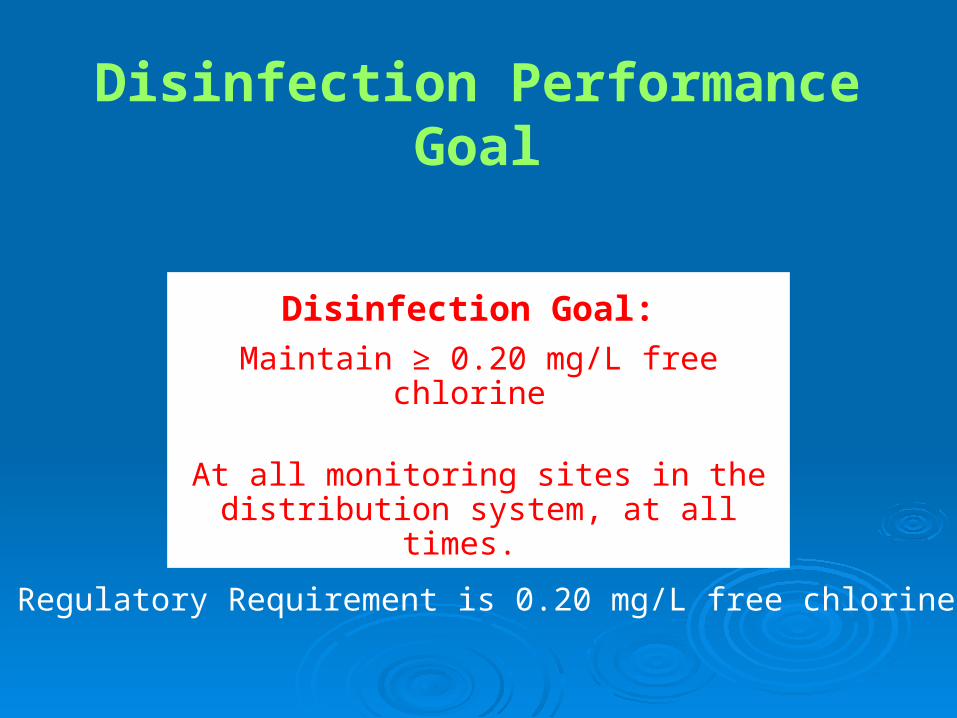
Disinfection Performance Goal
Disinfection Goal:
Maintain ≥ 0.20 mg/L free chlorine
At all monitoring sites in the distribution system, at all times.
Regulatory Requirement is 0.20 mg/L free chlorine
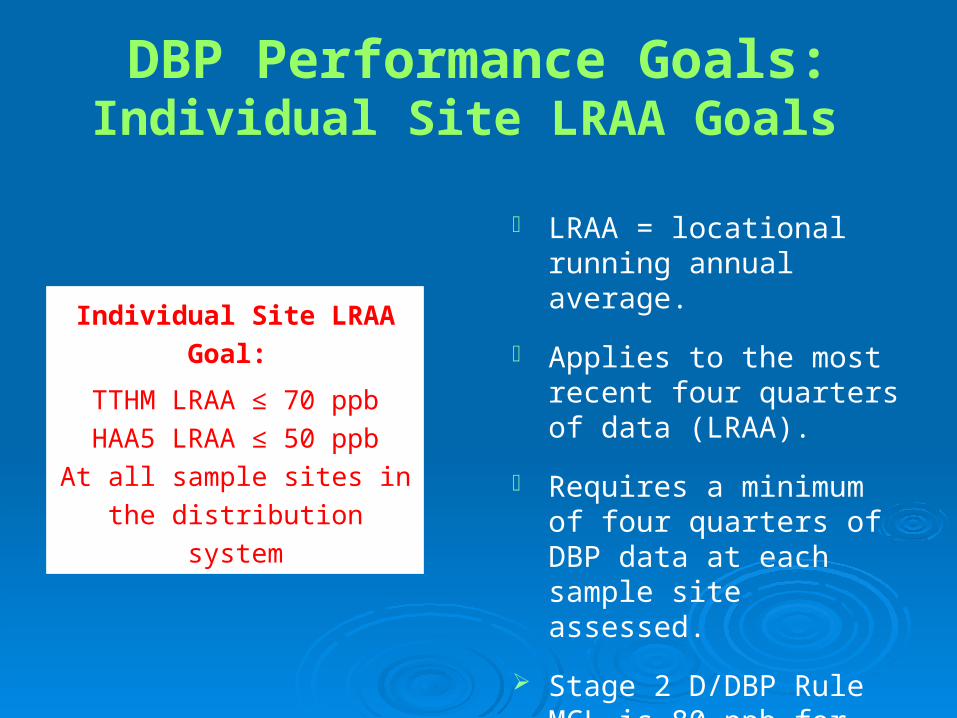
DBP Performance Goals:Individual Site LRAA Goals
LRAA = locational running annual average.
Applies to the most recent four quarters of data (LRAA).
Requires a minimum of four quarters of DBP data at each sample site assessed.
Stage 2 D/DBP Rule MCL is 80 ppb for TTHM and 60 ppb for HAA5
Individual Site LRAA Goal:
TTHM LRAA ≤ 70 ppb
HAA5 LRAA ≤ 50 ppb
At all sample sites in the
distribution system
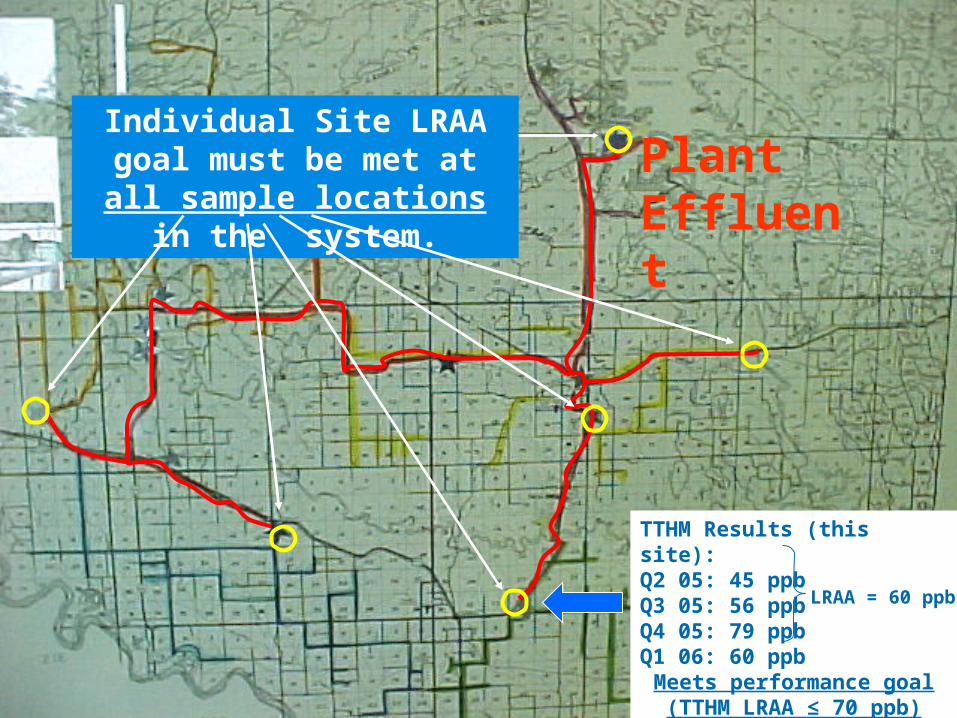
Plant Effluent
Individual Site LRAA goal must be met at all sample locations in the system.
TTHM Results (this site):Q2 05: 45 ppbQ3 05: 56 ppbQ4 05: 79 ppbQ1 06: 60 ppb
Meets performance goal (TTHM LRAA ≤ 70 ppb)
LRAA = 60 ppb
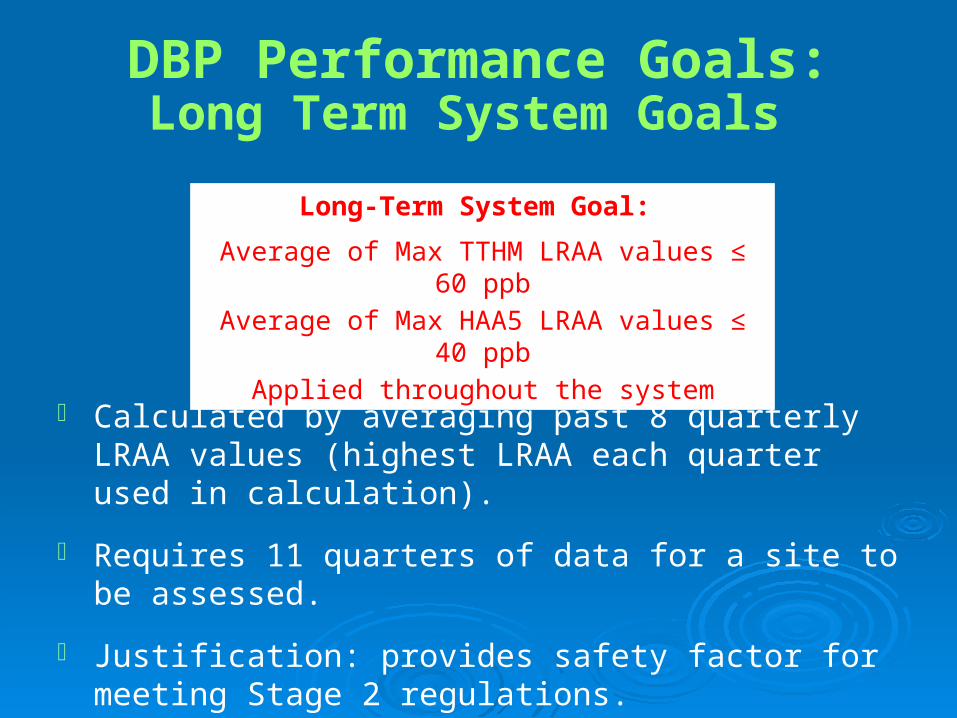
DBP Performance Goals:Long Term System Goals
Calculated by averaging past 8 quarterly LRAA values (highest LRAA each quarter used in calculation).
Requires 11 quarters of data for a site to be assessed.
Justification: provides safety factor for meeting Stage 2 regulations.
Long-Term System Goal:
Average of Max TTHM LRAA values ≤ 60 ppb
Average of Max HAA5 LRAA values ≤ 40 ppb
Applied throughout the system
Conclusions
The Alamosa outbreak and other recent water quality crises provided some valuable lessons on why optimization is important.
This training will focus on maintaining the distribution system barrier: Monitoring and maintaining the disinfection
barrier.
Monitoring DBPs (at compliance locations) to balance microbial and DBP risks.
ReferencesBaribeau, H., Gagnon, G., Hofman, R., and Warn, E. (2005). Impact of Distribution System Water Quality on Disinfection Efficacy.
AWWA Research Foundation, Denver, CO.
Centers for Disease Control and Prevention. (1991-2006). Surveillance for Waterborne Disease and Outbreaks Associated with Drinking Water and Water not Intended for Drinking. Morbidity and Mortality Weekly Report. Reports dated 1991-2006. From http://www.cdc.gov/mmWR.
Craun, M., Craun, G., Calderon, R., and Beach, M. (2006). Waterborne Disease Outbreaks in the United States. Journal of Water and Health, 04.Suppl 2, 2006. Retrieved August 14, 2009 from http://www.epa.gov/nheerl/articles/2006/waterborne_disease/waterborne_outbreaks.pdf.
Craun, G. and Calderon, R. Waterborne disease outbreaks Caused by Distribution System Deficiencies. Journal AWWA, September 2001.
U.S. EPA. 2007. Estimating the Burden of Disease Associated with Outbreaks Reported to the U.S. Waterborne Disease Outbreak Surveillance System: Identifying Limitations and Improvements. U.S. Environmental Protection Agency, National Center for Environmental Assessment, Cincinnati, OH. EPA/600/R-06/069.
Falco, R. and Williams, S. (November 2009) Waterborne Salmonella Outbreak in Alamosa, Colorado March and April 2008: Outbreak Identification, Response, and Investigation. From http://www.cdphe.state.co.us/wq/drinkingwater/pdf/AlamosaInvestRpt.pdf.
Helbling, D.E. and J.M VanBriesen, Continuous monitoring of residual chlorine concentrations in response to controlled microbial intrusions in a laboratory-scale distribution system. Water Research ,42(2008) 3162-3172.
LeChevallier, M.W., Welch, N.J, and D.B. Smith, Full-Scale Studies of Factors Related to Coliform Regrowth in Drinking Water, Applied and Environmental Microbiology, p. 2201-2211, July 1996.
National Research Council. (2006) Drinking Water Distribution Systems Assessing and Reducing Risks. Washington, DC: National Academies Press.
City of Alamosa 2008 financial report.
http://www.about-salmonella.com/salmonella_outbreaks/view/alamosa-colorado-municipal-water-system-salmonella-outbreak/).
Pueblo Chieftain article from May 2, 2008 “Cost figures for salmonella outbreak trickle in.”