Embed Size (px)
Citation preview
Department of Legislative ServicesOffice of Policy Analysis
Annapolis, Maryland
Overview of Education Fundingin Maryland
Presentation to the House Ways and Means Committee
Education Subcommittee
January 23, 2018

Principles Guiding Funding of Education in Maryland
• Thorough and efficient system of free publicschools (Article VIII of the State Constitution)
• Equity
• Adequacy
• Local Control
• Accountability1
Equity• Each Maryland child should have a substantially
similar opportunity to meet performancestandards regardless of geographical location
• Maryland has a system of shared State and localresponsibility for education funding
• Consequently, State aid for education shouldoffset local fiscal disparities
2
Wealth Equalization• To achieve funding equity, educational opportunities
should not depend on local abilities to generate revenue– In Maryland the primary sources of local tax revenues are the property tax
and income tax– For many years a significant share of State education aid has been
distributed inverse to local wealth as measured by property assessablebase and net taxable income
– Less wealthy school systems, therefore, receive more State aid per pupilthan wealthier school systems – this is known as wealth equalization
• Wealth is calculated by adding together a district’s nettaxable income and assessable base of property– This calculation is then compared to the State average to establish a
district’s relative wealth
3

Adequacy• State and local funding should be sufficient to acquire the
total resources needed to reasonably expect that allstudents can meet academic performance standards
– Prior to the Thornton Commission, sufficient funding to providean excellent fundamental education was a goal but quantifyingthe amount was elusive
– Ensuring that all students meet performance standardsrequires that students with special needs or at risk of failurereceive targeted resources or services
– Maryland counties, including Baltimore City, provide asignificant share of funding for education. Maintenance ofeffort requirements ensure that counties do not reduce theirsupport for education
4
Categories of State AidThe majority of State education aid falls into one of three categories:
1. General Education Aid• provides a minimum level of operating support for all students, driven
by total student enrollment and local wealth
2. Targeted Aid• provides additional funding based on enrollments of targeted student
populations (i.e., low-income, limited English, and special education)
3. Other Noninstructional Aid• provides school support activities that are not directly related to
instruction
5

Foundation ProgramGeneral Education Aid
• The foundation program is the main program in general educationaid and accounts for almost half of State education aid
• The foundation program ensures a base level of funding per pupil– per pupil foundation amount x local enrollment
• At the statewide level, the foundation formula is designed to havethe State pay roughly 50% of program costs; however, the State’sshare for the less wealthy jurisdictions is higher than 50% and theState’s share for more wealthy jurisdictions is lower than 50%(wealth equalization)
• The amount of State aid that a jurisdiction receives is based onFTE student enrollment and local wealth
• No jurisdiction may receive less than 15% of the base per pupilamount from the State
6
Other General Education Aid• Geographic Cost of Education Index (GCEI): GCEI is a
Maryland‐based index that adjusts the amount of State aid a localschool system receives based on regional differences in the cost ofeducational resources
– The GCEI formula does not reduce funding for jurisdictions where educationalresources are less expensive
– Unlike every other major State aid program, GCEI was not mandated untilfiscal 2017
– GCEI only applies to the foundation program and the State pays the State and localshares
• Guaranteed Tax Base: GTB provides additional funds tojurisdictions with less than 80% of the statewide wealth per pupil thatprovide local education funding above the minimum local sharerequired by the foundation program
– The State provides the funds that would have been generated locally if thejurisdiction had the wealth base that is guaranteed
– Per pupil GTB amount for any one local school system is limited to 20% of the perpupil foundation amount
7
Targeted Education Aid
8
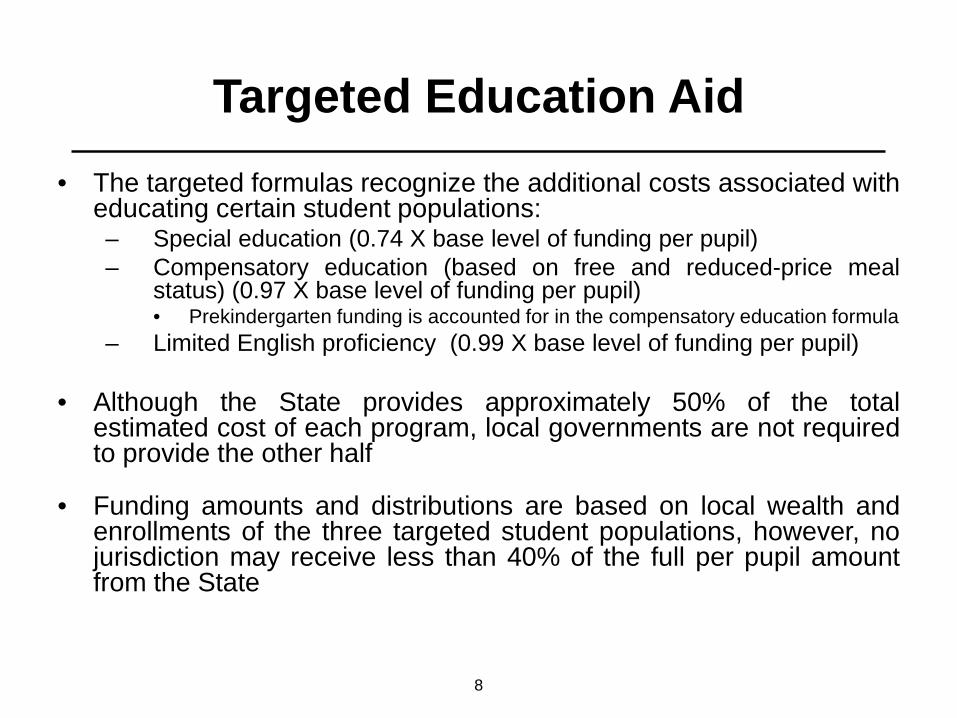
• The targeted formulas recognize the additional costs associated witheducating certain student populations:– Special education (0.74 X base level of funding per pupil)– Compensatory education (based on free and reduced-price meal
status) (0.97 X base level of funding per pupil)• Prekindergarten funding is accounted for in the compensatory education formula
– Limited English proficiency (0.99 X base level of funding per pupil)
• Although the State provides approximately 50% of the totalestimated cost of each program, local governments are not requiredto provide the other half
• Funding amounts and distributions are based on local wealth andenrollments of the three targeted student populations, however, nojurisdiction may receive less than 40% of the full per pupil amountfrom the State
Noninstructional State Aid
• Student Transportation: Each local schoolsystem is required to provide transportation toand from school for all public school students– Transportation funding consists of a base grant
that is adjusted annually and a per pupil grantbased on the number of students with specialtransportation needs
• Other Noninstructional Aid: Includes earlyeducation, food service, adult education, and avariety of innovative programs
9

Teacher Retirement Costs• Prior to 2012, the State paid 100% of retirement
costs
• In 2012, legislation required locals to share inthe cost of retirement
• Retirement aid is not wealth equalized
• In fiscal 2016, local share ranged from 25%-30%
10
County Federal State Local
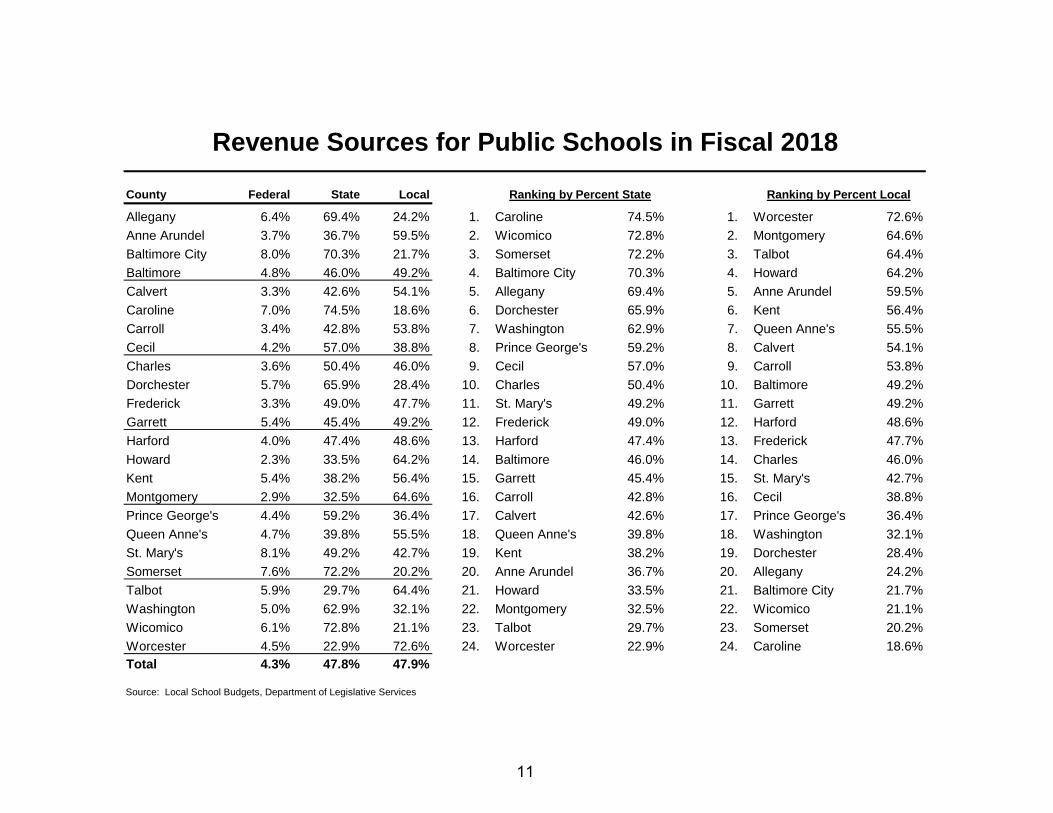
Allegany 6.4% 69.4% 24.2% 1. Caroline 74.5% 1. Worcester 72.6%Anne Arundel 3.7% 36.7% 59.5% 2. Wicomico 72.8% 2. Montgomery 64.6%Baltimore City 8.0% 70.3% 21.7% 3. Somerset 72.2% 3. Talbot 64.4%Baltimore 4.8% 46.0% 49.2% 4. Baltimore City 70.3% 4. Howard 64.2%Calvert 3.3% 42.6% 54.1% 5. Allegany 69.4% 5. Anne Arundel 59.5%Caroline 7.0% 74.5% 18.6% 6. Dorchester 65.9% 6. Kent 56.4%Carroll 3.4% 42.8% 53.8% 7. Washington 62.9% 7. Queen Anne's 55.5%Cecil 4.2% 57.0% 38.8% 8. Prince George's 59.2% 8. Calvert 54.1%Charles 3.6% 50.4% 46.0% 9. Cecil 57.0% 9. Carroll 53.8%Dorchester 5.7% 65.9% 28.4% 10. Charles 50.4% 10. Baltimore 49.2%Frederick 3.3% 49.0% 47.7% 11. St. Mary's 49.2% 11. Garrett 49.2%Garrett 5.4% 45.4% 49.2% 12. Frederick 49.0% 12. Harford 48.6%Harford 4.0% 47.4% 48.6% 13. Harford 47.4% 13. Frederick 47.7%Howard 2.3% 33.5% 64.2% 14. Baltimore 46.0% 14. Charles 46.0%Kent 5.4% 38.2% 56.4% 15. Garrett 45.4% 15. St. Mary's 42.7%Montgomery 2.9% 32.5% 64.6% 16. Carroll 42.8% 16. Cecil 38.8%Prince George's 4.4% 59.2% 36.4% 17. Calvert 42.6% 17. Prince George's 36.4%Queen Anne's 4.7% 39.8% 55.5% 18. Queen Anne's 39.8% 18. Washington 32.1%St. Mary's 8.1% 49.2% 42.7% 19. Kent 38.2% 19. Dorchester 28.4%Somerset 7.6% 72.2% 20.2% 20. Anne Arundel 36.7% 20. Allegany 24.2%Talbot 5.9% 29.7% 64.4% 21. Howard 33.5% 21. Baltimore City 21.7%Washington 5.0% 62.9% 32.1% 22. Montgomery 32.5% 22. Wicomico 21.1%Wicomico 6.1% 72.8% 21.1% 23. Talbot 29.7% 23. Somerset 20.2%Worcester 4.5% 22.9% 72.6% 24. Worcester 22.9% 24. Caroline 18.6%Total 4.3% 47.8% 47.9%
Source: Local School Budgets, Department of Legislative Services
Revenue Sources for Public Schools in Fiscal 2018
Ranking by Percent State Ranking by Percent Local
11

County Federal State Local Misc. Total
Allegany $994 $10,787 $3,714 $51 $15,546 1. Worcester $18,312Anne Arundel 530 5,231 8,431 41 14,233 2. Somerset 17,945Baltimore City 1,374 12,104 3,645 88 17,211 3. Baltimore City 17,211Baltimore 713 6,801 7,208 77 14,798 4. Kent 16,524Calvert 483 6,171 7,808 32 14,493 5. Montgomery 16,499Caroline 1,014 10,812 2,596 99 14,521 6. Prince George's 16,250Carroll 481 6,099 7,492 179 14,251 7. Howard 16,238Cecil 605 8,170 5,525 31 14,331 8. Dorchester 15,573Charles 529 7,434 6,728 54 14,746 9. Allegany 15,546Dorchester 890 10,260 4,220 203 15,573 10. Garrett 15,242Frederick 456 6,703 6,384 148 13,690 11. Baltimore 14,798Garrett 824 6,920 7,483 15 15,242 12. Charles 14,746Harford 546 6,392 6,472 88 13,498 13. Wicomico 14,543Howard 366 5,447 10,321 104 16,238 14. Caroline 14,521Kent 885 6,318 9,236 86 16,524 15. Calvert 14,493Montgomery 476 5,360 10,599 64 16,499 16. Cecil 14,331Prince George's 708 9,626 5,812 103 16,250 17. Carroll 14,251Queen Anne's 639 5,404 7,364 184 13,590 18. Anne Arundel 14,233St. Mary's 1,139 6,915 5,957 45 14,055 19. St. Mary's 14,055Somerset 1,364 12,954 3,596 31 17,945 20. Washington 13,930Talbot 794 3,984 8,621 15 13,414 21. Frederick 13,690Washington 697 8,763 4,426 43 13,930 22. Queen Anne's 13,590Wicomico 881 10,591 2,925 147 14,543 23. Harford 13,498Worcester 826 4,195 13,256 36 18,312 24. Talbot 13,414Total $671 $7,391 $7,323 $83 $15,467
Source: Local School Budgets, Department of Legislative Services
Per Pupil Revenues for Public Schools in Fiscal 2018
Ranking by Total Per Pupil Funding
12
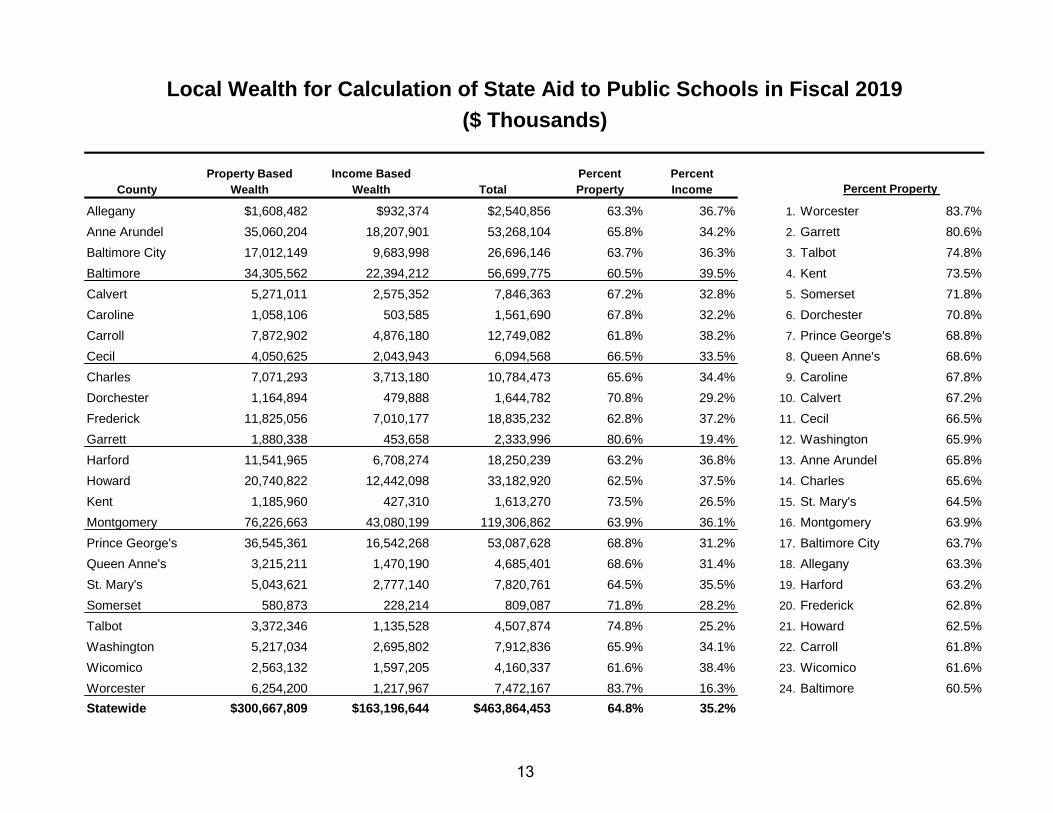
Property Based Income Based Percent PercentCounty Wealth Wealth Total Property Income
Allegany $1,608,482 $932,374 $2,540,856 63.3% 36.7% 1. Worcester 83.7%Anne Arundel 35,060,204 18,207,901 53,268,104 65.8% 34.2% 2. Garrett 80.6%Baltimore City 17,012,149 9,683,998 26,696,146 63.7% 36.3% 3. Talbot 74.8%Baltimore 34,305,562 22,394,212 56,699,775 60.5% 39.5% 4. Kent 73.5%Calvert 5,271,011 2,575,352 7,846,363 67.2% 32.8% 5. Somerset 71.8%Caroline 1,058,106 503,585 1,561,690 67.8% 32.2% 6. Dorchester 70.8%Carroll 7,872,902 4,876,180 12,749,082 61.8% 38.2% 7. Prince George's 68.8%Cecil 4,050,625 2,043,943 6,094,568 66.5% 33.5% 8. Queen Anne's 68.6%Charles 7,071,293 3,713,180 10,784,473 65.6% 34.4% 9. Caroline 67.8%Dorchester 1,164,894 479,888 1,644,782 70.8% 29.2% 10. Calvert 67.2%Frederick 11,825,056 7,010,177 18,835,232 62.8% 37.2% 11. Cecil 66.5%Garrett 1,880,338 453,658 2,333,996 80.6% 19.4% 12. Washington 65.9%Harford 11,541,965 6,708,274 18,250,239 63.2% 36.8% 13. Anne Arundel 65.8%Howard 20,740,822 12,442,098 33,182,920 62.5% 37.5% 14. Charles 65.6%Kent 1,185,960 427,310 1,613,270 73.5% 26.5% 15. St. Mary's 64.5%Montgomery 76,226,663 43,080,199 119,306,862 63.9% 36.1% 16. Montgomery 63.9%Prince George's 36,545,361 16,542,268 53,087,628 68.8% 31.2% 17. Baltimore City 63.7%Queen Anne's 3,215,211 1,470,190 4,685,401 68.6% 31.4% 18. Allegany 63.3%St. Mary's 5,043,621 2,777,140 7,820,761 64.5% 35.5% 19. Harford 63.2%Somerset 580,873 228,214 809,087 71.8% 28.2% 20. Frederick 62.8%Talbot 3,372,346 1,135,528 4,507,874 74.8% 25.2% 21. Howard 62.5%Washington 5,217,034 2,695,802 7,912,836 65.9% 34.1% 22. Carroll 61.8%Wicomico 2,563,132 1,597,205 4,160,337 61.6% 38.4% 23. Wicomico 61.6%Worcester 6,254,200 1,217,967 7,472,167 83.7% 16.3% 24. Baltimore 60.5%Statewide $300,667,809 $163,196,644 $463,864,453 64.8% 35.2%
Percent Property
Local Wealth for Calculation of State Aid to Public Schools in Fiscal 2019($ Thousands)
13
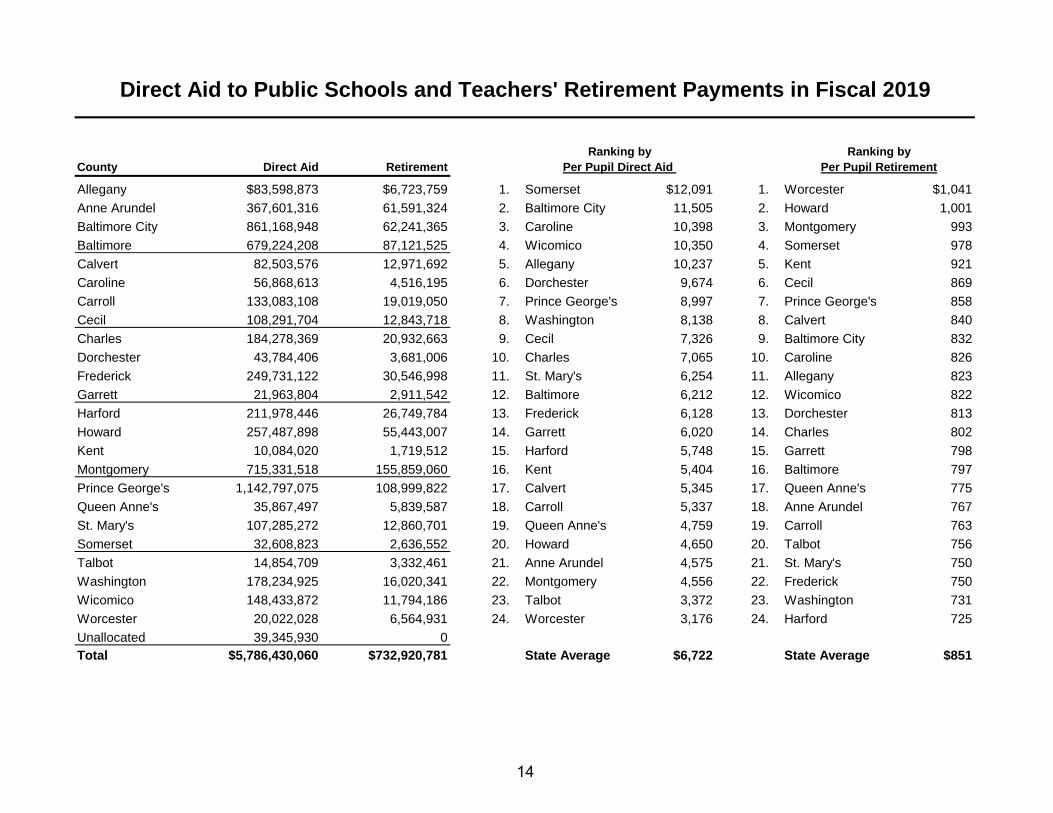
County Direct Aid Retirement
Allegany $83,598,873 $6,723,759 1. Somerset $12,091 1. Worcester $1,041Anne Arundel 367,601,316 61,591,324 2. Baltimore City 11,505 2. Howard 1,001Baltimore City 861,168,948 62,241,365 3. Caroline 10,398 3. Montgomery 993Baltimore 679,224,208 87,121,525 4. Wicomico 10,350 4. Somerset 978Calvert 82,503,576 12,971,692 5. Allegany 10,237 5. Kent 921Caroline 56,868,613 4,516,195 6. Dorchester 9,674 6. Cecil 869Carroll 133,083,108 19,019,050 7. Prince George's 8,997 7. Prince George's 858Cecil 108,291,704 12,843,718 8. Washington 8,138 8. Calvert 840Charles 184,278,369 20,932,663 9. Cecil 7,326 9. Baltimore City 832Dorchester 43,784,406 3,681,006 10. Charles 7,065 10. Caroline 826Frederick 249,731,122 30,546,998 11. St. Mary's 6,254 11. Allegany 823Garrett 21,963,804 2,911,542 12. Baltimore 6,212 12. Wicomico 822Harford 211,978,446 26,749,784 13. Frederick 6,128 13. Dorchester 813Howard 257,487,898 55,443,007 14. Garrett 6,020 14. Charles 802Kent 10,084,020 1,719,512 15. Harford 5,748 15. Garrett 798Montgomery 715,331,518 155,859,060 16. Kent 5,404 16. Baltimore 797Prince George's 1,142,797,075 108,999,822 17. Calvert 5,345 17. Queen Anne's 775Queen Anne's 35,867,497 5,839,587 18. Carroll 5,337 18. Anne Arundel 767St. Mary's 107,285,272 12,860,701 19. Queen Anne's 4,759 19. Carroll 763Somerset 32,608,823 2,636,552 20. Howard 4,650 20. Talbot 756Talbot 14,854,709 3,332,461 21. Anne Arundel 4,575 21. St. Mary's 750Washington 178,234,925 16,020,341 22. Montgomery 4,556 22. Frederick 750Wicomico 148,433,872 11,794,186 23. Talbot 3,372 23. Washington 731Worcester 20,022,028 6,564,931 24. Worcester 3,176 24. Harford 725Unallocated 39,345,930 0Total $5,786,430,060 $732,920,781 State Average $6,722 State Average $851
Direct Aid to Public Schools and Teachers' Retirement Payments in Fiscal 2019
Ranking byPer Pupil Direct Aid Per Pupil Retirement
Ranking by
14
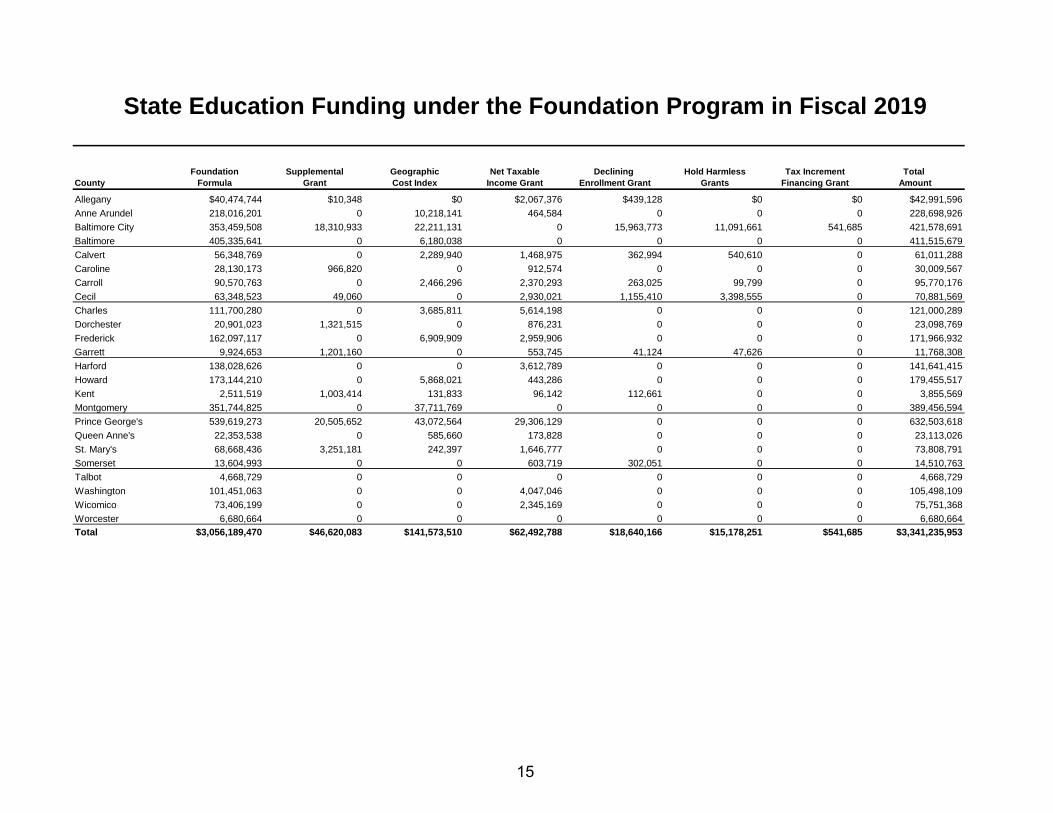
Foundation Supplemental Geographic Net Taxable Declining Hold Harmless Tax Increment Total County Formula Grant Cost Index Income Grant Enrollment Grant Grants Financing Grant Amount
Allegany $40,474,744 $10,348 $0 $2,067,376 $439,128 $0 $0 $42,991,596Anne Arundel 218,016,201 0 10,218,141 464,584 0 0 0 228,698,926Baltimore City 353,459,508 18,310,933 22,211,131 0 15,963,773 11,091,661 541,685 421,578,691Baltimore 405,335,641 0 6,180,038 0 0 0 0 411,515,679Calvert 56,348,769 0 2,289,940 1,468,975 362,994 540,610 0 61,011,288Caroline 28,130,173 966,820 0 912,574 0 0 0 30,009,567Carroll 90,570,763 0 2,466,296 2,370,293 263,025 99,799 0 95,770,176Cecil 63,348,523 49,060 0 2,930,021 1,155,410 3,398,555 0 70,881,569Charles 111,700,280 0 3,685,811 5,614,198 0 0 0 121,000,289Dorchester 20,901,023 1,321,515 0 876,231 0 0 0 23,098,769Frederick 162,097,117 0 6,909,909 2,959,906 0 0 0 171,966,932Garrett 9,924,653 1,201,160 0 553,745 41,124 47,626 0 11,768,308Harford 138,028,626 0 0 3,612,789 0 0 0 141,641,415Howard 173,144,210 0 5,868,021 443,286 0 0 0 179,455,517Kent 2,511,519 1,003,414 131,833 96,142 112,661 0 0 3,855,569Montgomery 351,744,825 0 37,711,769 0 0 0 0 389,456,594Prince George's 539,619,273 20,505,652 43,072,564 29,306,129 0 0 0 632,503,618Queen Anne's 22,353,538 0 585,660 173,828 0 0 0 23,113,026St. Mary's 68,668,436 3,251,181 242,397 1,646,777 0 0 0 73,808,791Somerset 13,604,993 0 0 603,719 302,051 0 0 14,510,763Talbot 4,668,729 0 0 0 0 0 0 4,668,729Washington 101,451,063 0 0 4,047,046 0 0 0 105,498,109Wicomico 73,406,199 0 0 2,345,169 0 0 0 75,751,368Worcester 6,680,664 0 0 0 0 0 0 6,680,664Total $3,056,189,470 $46,620,083 $141,573,510 $62,492,788 $18,640,166 $15,178,251 $541,685 $3,341,235,953
State Education Funding under the Foundation Program in Fiscal 2019
15
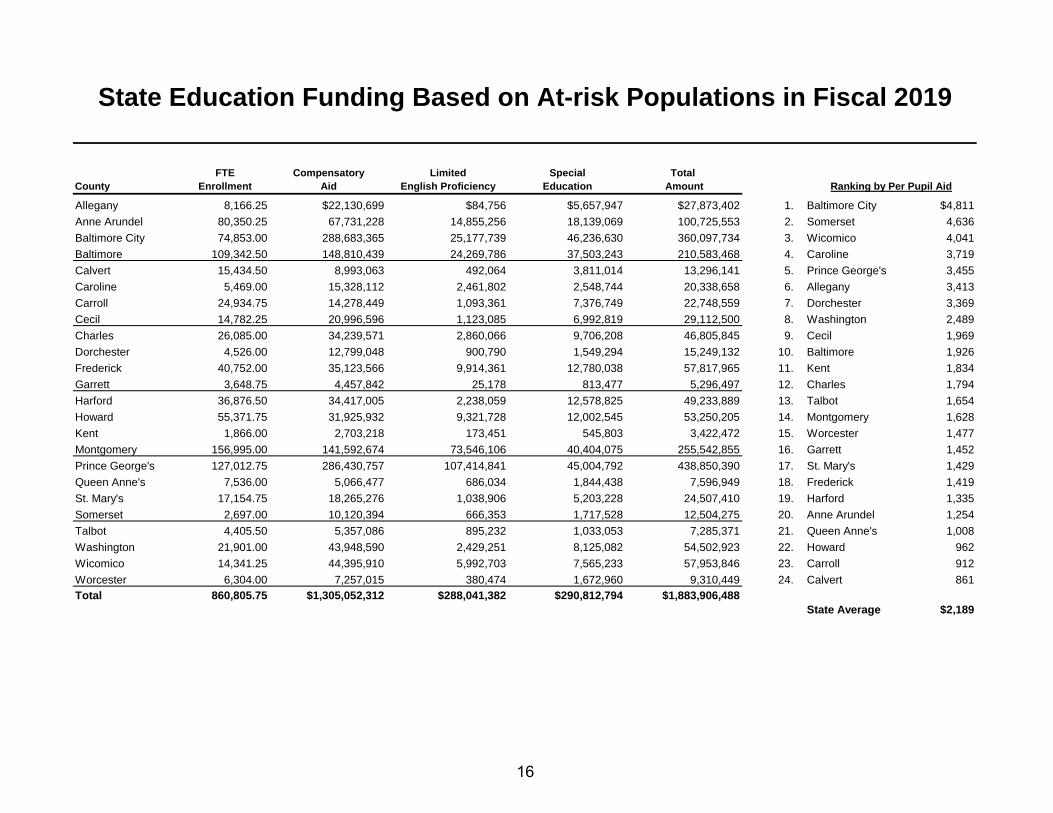
FTE Compensatory Limited Special Total County Enrollment Aid English Proficiency Education Amount
Allegany 8,166.25 $22,130,699 $84,756 $5,657,947 $27,873,402 1. Baltimore City $4,811Anne Arundel 80,350.25 67,731,228 14,855,256 18,139,069 100,725,553 2. Somerset 4,636Baltimore City 74,853.00 288,683,365 25,177,739 46,236,630 360,097,734 3. Wicomico 4,041Baltimore 109,342.50 148,810,439 24,269,786 37,503,243 210,583,468 4. Caroline 3,719Calvert 15,434.50 8,993,063 492,064 3,811,014 13,296,141 5. Prince George's 3,455Caroline 5,469.00 15,328,112 2,461,802 2,548,744 20,338,658 6. Allegany 3,413Carroll 24,934.75 14,278,449 1,093,361 7,376,749 22,748,559 7. Dorchester 3,369Cecil 14,782.25 20,996,596 1,123,085 6,992,819 29,112,500 8. Washington 2,489Charles 26,085.00 34,239,571 2,860,066 9,706,208 46,805,845 9. Cecil 1,969Dorchester 4,526.00 12,799,048 900,790 1,549,294 15,249,132 10. Baltimore 1,926Frederick 40,752.00 35,123,566 9,914,361 12,780,038 57,817,965 11. Kent 1,834Garrett 3,648.75 4,457,842 25,178 813,477 5,296,497 12. Charles 1,794Harford 36,876.50 34,417,005 2,238,059 12,578,825 49,233,889 13. Talbot 1,654Howard 55,371.75 31,925,932 9,321,728 12,002,545 53,250,205 14. Montgomery 1,628Kent 1,866.00 2,703,218 173,451 545,803 3,422,472 15. Worcester 1,477Montgomery 156,995.00 141,592,674 73,546,106 40,404,075 255,542,855 16. Garrett 1,452Prince George's 127,012.75 286,430,757 107,414,841 45,004,792 438,850,390 17. St. Mary's 1,429Queen Anne's 7,536.00 5,066,477 686,034 1,844,438 7,596,949 18. Frederick 1,419St. Mary's 17,154.75 18,265,276 1,038,906 5,203,228 24,507,410 19. Harford 1,335Somerset 2,697.00 10,120,394 666,353 1,717,528 12,504,275 20. Anne Arundel 1,254Talbot 4,405.50 5,357,086 895,232 1,033,053 7,285,371 21. Queen Anne's 1,008Washington 21,901.00 43,948,590 2,429,251 8,125,082 54,502,923 22. Howard 962Wicomico 14,341.25 44,395,910 5,992,703 7,565,233 57,953,846 23. Carroll 912Worcester 6,304.00 7,257,015 380,474 1,672,960 9,310,449 24. Calvert 861Total 860,805.75 $1,305,052,312 $288,041,382 $290,812,794 $1,883,906,488
State Average $2,189
State Education Funding Based on At-risk Populations in Fiscal 2019
Ranking by Per Pupil Aid
16
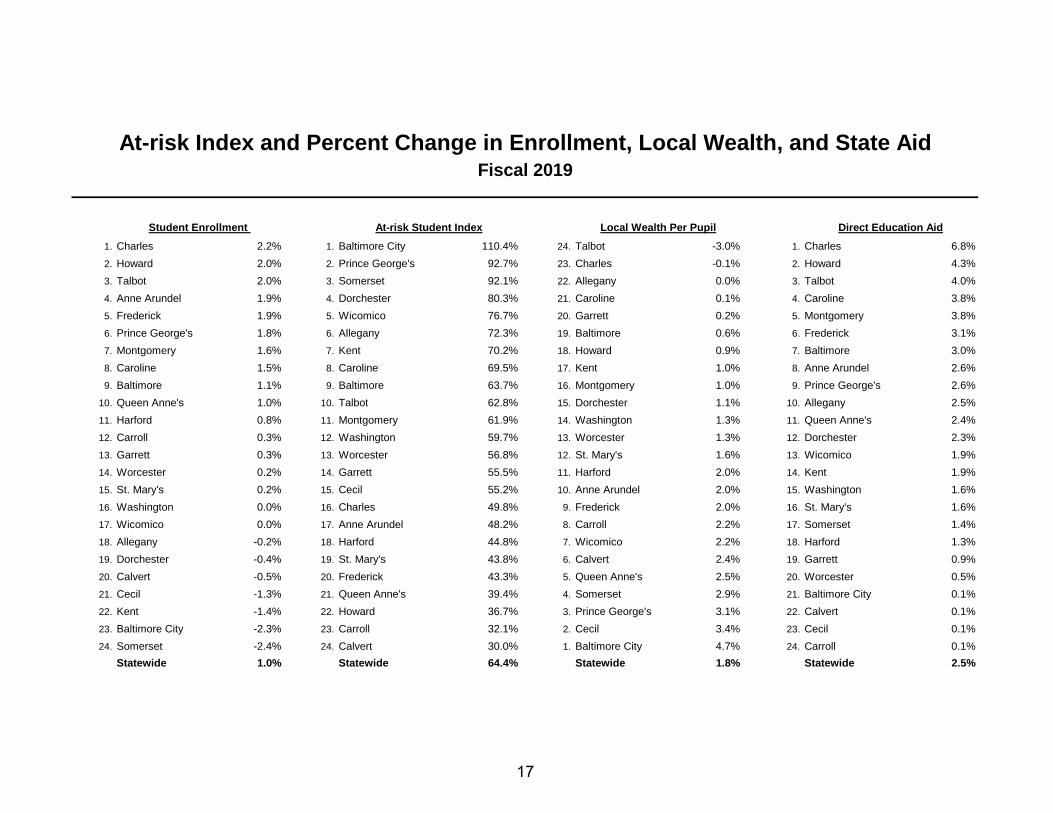
1. Charles 2.2% 1. Baltimore City 110.4% 24. Talbot -3.0% 1. Charles 6.8%2. Howard 2.0% 2. Prince George's 92.7% 23. Charles -0.1% 2. Howard 4.3%3. Talbot 2.0% 3. Somerset 92.1% 22. Allegany 0.0% 3. Talbot 4.0%4. Anne Arundel 1.9% 4. Dorchester 80.3% 21. Caroline 0.1% 4. Caroline 3.8%5. Frederick 1.9% 5. Wicomico 76.7% 20. Garrett 0.2% 5. Montgomery 3.8%6. Prince George's 1.8% 6. Allegany 72.3% 19. Baltimore 0.6% 6. Frederick 3.1%7. Montgomery 1.6% 7. Kent 70.2% 18. Howard 0.9% 7. Baltimore 3.0%8. Caroline 1.5% 8. Caroline 69.5% 17. Kent 1.0% 8. Anne Arundel 2.6%9. Baltimore 1.1% 9. Baltimore 63.7% 16. Montgomery 1.0% 9. Prince George's 2.6%
10. Queen Anne's 1.0% 10. Talbot 62.8% 15. Dorchester 1.1% 10. Allegany 2.5%11. Harford 0.8% 11. Montgomery 61.9% 14. Washington 1.3% 11. Queen Anne's 2.4%12. Carroll 0.3% 12. Washington 59.7% 13. Worcester 1.3% 12. Dorchester 2.3%13. Garrett 0.3% 13. Worcester 56.8% 12. St. Mary's 1.6% 13. Wicomico 1.9%14. Worcester 0.2% 14. Garrett 55.5% 11. Harford 2.0% 14. Kent 1.9%15. St. Mary's 0.2% 15. Cecil 55.2% 10. Anne Arundel 2.0% 15. Washington 1.6%16. Washington 0.0% 16. Charles 49.8% 9. Frederick 2.0% 16. St. Mary's 1.6%17. Wicomico 0.0% 17. Anne Arundel 48.2% 8. Carroll 2.2% 17. Somerset 1.4%18. Allegany -0.2% 18. Harford 44.8% 7. Wicomico 2.2% 18. Harford 1.3%19. Dorchester -0.4% 19. St. Mary's 43.8% 6. Calvert 2.4% 19. Garrett 0.9%20. Calvert -0.5% 20. Frederick 43.3% 5. Queen Anne's 2.5% 20. Worcester 0.5%21. Cecil -1.3% 21. Queen Anne's 39.4% 4. Somerset 2.9% 21. Baltimore City 0.1%22. Kent -1.4% 22. Howard 36.7% 3. Prince George's 3.1% 22. Calvert 0.1%23. Baltimore City -2.3% 23. Carroll 32.1% 2. Cecil 3.4% 23. Cecil 0.1%24. Somerset -2.4% 24. Calvert 30.0% 1. Baltimore City 4.7% 24. Carroll 0.1%
Statewide 1.0% Statewide 64.4% Statewide 1.8% Statewide 2.5%
Fiscal 2019
Direct Education AidLocal Wealth Per Pupil
At-risk Index and Percent Change in Enrollment, Local Wealth, and State Aid
Student Enrollment At-risk Student Index
17