Embed Size (px)
Citation preview
* Corresponding author, tel: +234 – 803 – 228 – 0981
OVERVIEW OF ENERGY GENERATION AT JEBBA HYDROPOWER
STATION (2009-2016)
A. O. Odesola1,* and T. O. Ale2 1, 2, DEPARTMENT OF ELECTRICAL AND ELECTRONICS ENGINEERING, FEDERAL UNIVERSITY OF TECHNOLOGY,
P.M.B 704 AKURE, ONDO STATE, NIGERIA
E-mail addresses: 1 [email protected], 2 [email protected]
ABSTRACT
This research was carried out to ascertain the relationship between effective reservoir management
and hydropower station performance selecting the Jebba Hydroelectric Power Station as a case
study. In order to achieve this, the daily inflow and outflow data, as well as the generated energy
were collected for the reviewed period (2009 – 2016). The hydrological data indicated that during
period under study, the reservoir is recovering at a very low rate. A further analysis was carried out
by comparing the conversion efficiency of the energy in flowing water and actual energy generated.
Thus the product of the head (metres) and the outflow was plotted against the actual energy
generated. The results satisfied a linear relationship having a correlation coefficient of 0.7059
which reinforces the knowledge of the effects of hydropower reservoir management on energy
generation.
Keywords: Conversion Efficiency, Hydroelectric Power, Inflow, Outflow, Power Station, Reservoir.
1. INTRODUCTION
Electrical energy is the most popular form of energy
due to its higher efficiency, better controllability,
easier bulk power, long distance transportation of
power using overhead transmission and underground
cables, user friendly, etc. Electricity came to Nigeria
in 1896, 15 years after it got to England [1]. Despite
its long history in Nigeria, electricity generation is still
at its low ebb with power outages being the order of
the day. The demand for electricity in the country far
outstrips the supply [2].
At present, the three hydro in the country contributes
24% of the national energy generated, while Jebba
hydropower station contributes 39% of the
hydroelectric energy production [3],this is equivalent
to 9.36% of the total energy generated both by hydro
and other sources between 2009 and 2016.
Many scholars have carried out studies on reservoir
inflow and outflow related issues on hydropower
stations, all aimed at proffering solutions to meet the
challenging increasing demand in electricity, some of
these works are discussed below:
The study in [4] examined the interaction that exist
within some reservoir elements such as minimum
inflow, storage balance, lake evaporation, average
outflow, peak inflow, peak outflow, reservoir level,
average inflow, minimum outflow and discharge. It
was identified that few elements are most relevant to
electricity generation and their level of relevance
varies from months to month. However, during low
flows the reservoir elements have negligible roles in
power generation. Also, in the flood seasons, the
output terms are dominant indam operations in order
to prevent dam failure and wastage of energy. The
study also revealed that a causal relationship exists
between hydroelectricity and reservoir elements.
The work in [5] carried out assessment of climate
variability on Kainji hydropower reservoir, Niger
State, Nigeria, using reservoir inflow data from
(1970–2003) from Kainji hydropower station. It was
found out that there is slight decrease in reservoir
inflow, which may lead to shortage of water for
hydropower generation in future.
Analysis of water resources potential and useful life
of the Shiroro hydropower reservoir was carried out
Nigerian Journal of Technology (NIJOTECH)
Vol. 38, No. 3, July 2019, pp. 744 – 749
Copyright© Faculty of Engineering, University of Nigeria, Nsukka, Print ISSN: 0331-8443, Electronic ISSN: 2467-8821
www.nijotech.com
http://dx.doi.org/10.4314/njt.v38i3.28

OVERVIEW OF ENERGY GENERATION AT JEBBA HYDROPOWER STATION (2009-2016), A. O. Odesola & T. O. Ale
Nigerian Journal of Technology, Vol. 38, No. 3, July 2019 745
by [6] with the view to assessing its current state,
operations and management. Suggestions were
given as to the other possible ways to reduce siltation
and enhance reservoir performance.
The research in [7] investigated the effect of
reservoir inflow pattern on hydroelectric power
generation in Kainji dam, Niger state, Nigeria.
Investigation was conducted using data on reservoir
inflow and the amount of power generated for the
period of thirty years (1985 - 2014) from Kainji
hydropower station. The research indicated that
reservoir inflow has a strong relationship on the
amount of power generated with a correlation
coefficient of 0.92.
In this work, the effects of hydropower water
reservoir management on electric power generation
at Jebba hydroelectric power station in Nigeria was
studied.
2. STUDY AREA
Niger River is the third longest in Africa, after Nile and
the Congo/Zaire Rivers, 4100km long and it
transverses two humid catchments separated by a
wide expanse of semi – arid environment ([8],[9]). It
has a total length of about 4200 km with a theoretical
area of about 2 million sq km. This area has reduced
to an active catchment area of just about 1.5 million
sq km thus excluding Algeria which is among the 10
countries covered by the Niger River basin. Other
countries are Benin, Burkina Faso, Cameroon, Chad,
guinea, Ivory Coast, Mali, Niger, and Nigeria. The
study area, Jebba hydropower reservoir, is located 64
miles from the Kainji dam [10]. The flow of river Niger
downstream of Jebba dam is governed by the
operations of the Kanji and Jebba hydroelectric
schemes and runoff from the catchments [11]. Jebba
reservoir depends solely on Kainji discharge during
the black flood (Dec to Mar). During white flood (rainy
season) some rivers downstream of Kainji discharge
in Jebba reservoir in addition to Kainji discharge.
Effective water management policy by the station
allow the operation of Jebba unit all year round.
3. METHODOLOGY
Hydrological data and energy generated from 2009-
2016 was collated from both National Control Centre,
Osogbo (NCC) and Jebba Hydroelectric Power
Station.
Data relating to energy production as well as
hydrological data in Jebba Hydroelectric Power
Station (JHPS) was extracted and collated for the
period between2009 and 2016. These data include;
Hydrological data (Inflow, Outflow, Head Water
Elevation, Tail Water Elevation), daily energy
produced, and daily fault occurrence at JHPS. The
collated data was studied using Time series analysis
and Correlation in Microsoft Excel Software
Environment.
The effect of water inflow and the reservoir condition
on power generation for the studied period were
related using equation (1). The initial value of the
reservoir health variable is arbitrarily set to zero for
easy analysis.
𝑅𝑛+1 = 𝑅𝑛 + 𝑄𝑖,𝑛 − 𝑄𝑜,𝑛 (1)
where 𝑅𝑛+1 is the net cummulative inflow in 𝑚3/𝑠
𝑅𝑛 is the reservoir health variable in 𝑚3/𝑠
𝑄𝑖,𝑛 is the inflow at interval 𝑛 in 𝑚3/𝑠
𝑄𝑜,𝑛 is the outflow at interval 𝑛in 𝑚3/𝑠
𝑛 is the index for the year
A spread sheet procedure in Microsoft Excel software
environment was developed for easy evaluation of
the hydropower conversion efficiency using equation
(2). This was compared with the actual power
generated for efficiency analysis.
𝑃 = 𝜂𝜌𝑔𝑄𝐻 (2)
where,𝑃 is power in watts.
ρ is the density of water (𝑘𝑔/𝑚3)
𝑔 is the acceleration due to gravity (9.81𝑚/𝑠2)
𝐻 is the effective head of water in (𝑚)
𝑄 is the rate of flow of water in (𝑚3/𝑠).
𝜂 is the turbine efficiency (%)
4. RESULTS AND DISCUSSION
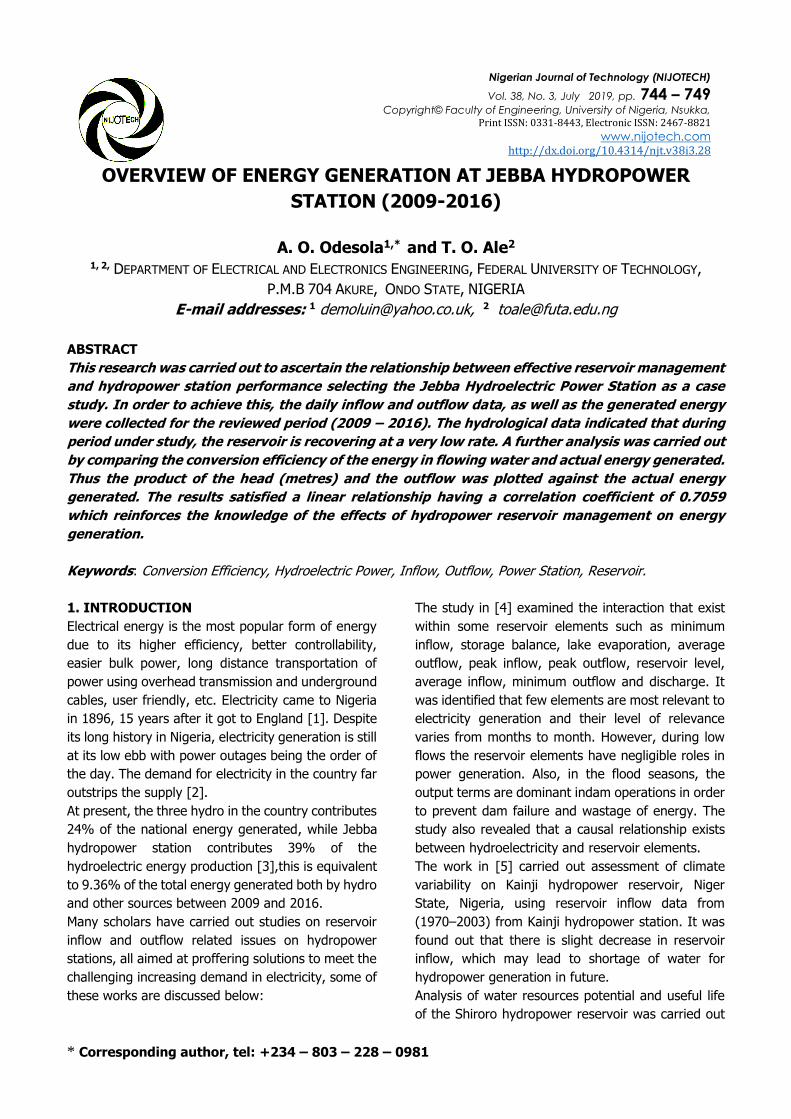
Figure 1 shows the plot of the time series of JHPS
daily inflow from January 2009 till December 2016.
The plot indicates a cyclical pattern although not too
strong, indicating two peaks occurring each year.
Seasonal flows are apparent from the time series with
twin peaks occurring annually corresponding to the
black flood and the white floods respectively. The
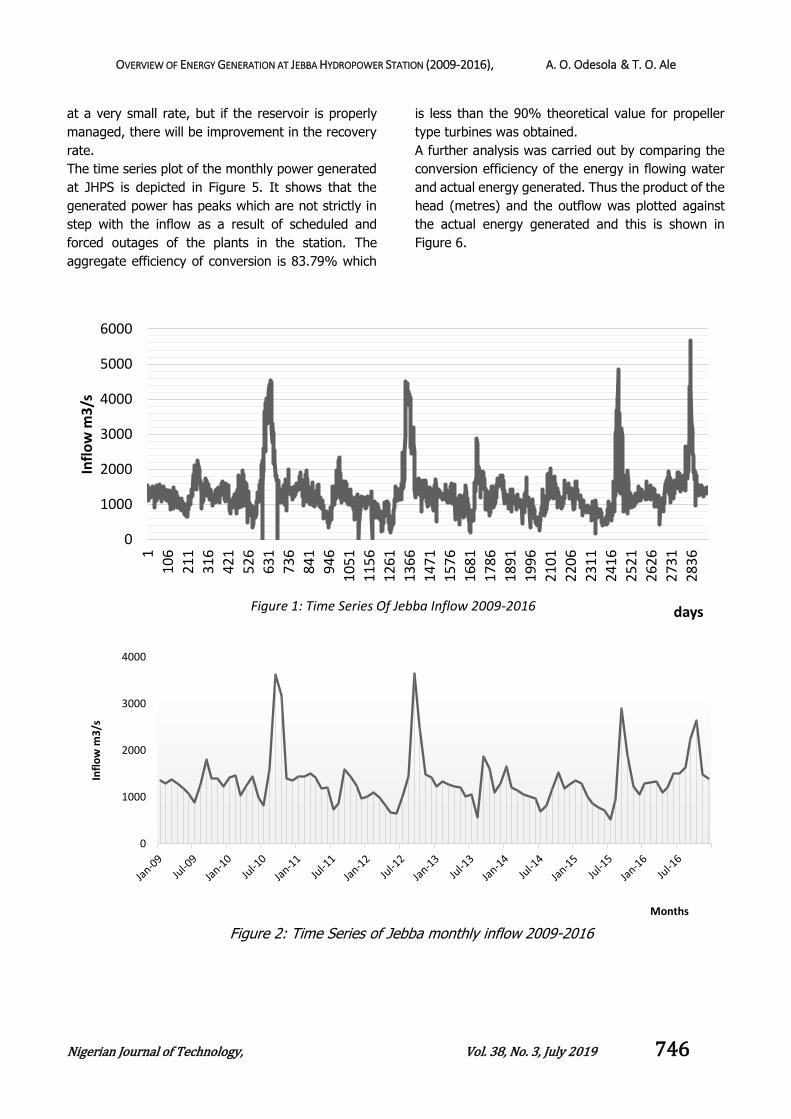
daily inflow data was later averaged into monthly
scales as shown in Figure 2.
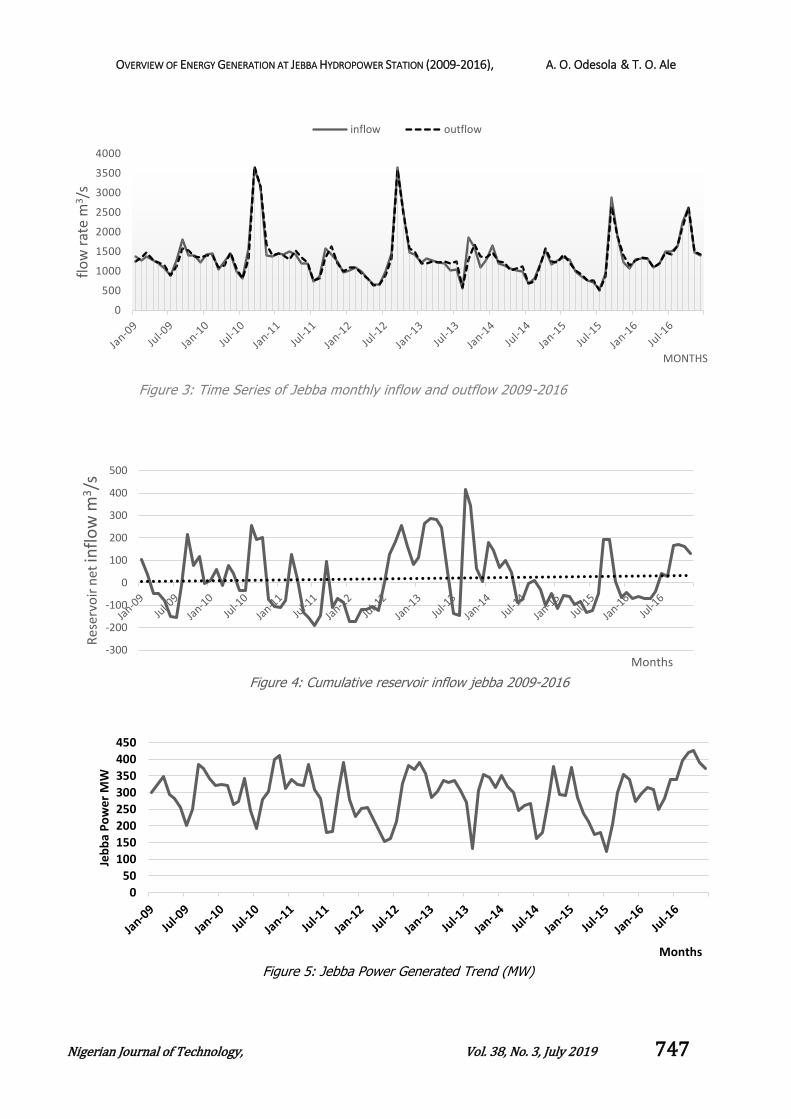
Figure 3 presents both the inflow and the outflow
observed over the period of 2009 and 2016. It shows
that the inflow and outflow seems to be consistent.
The average value of the head is around the upper
limit set by the designer – 27 metres. The difference
between the inflow and outflow were evaluated and
the cumulative value was plotted as shown in Figure
4. The figure shows that the reservoir is recovering
OVERVIEW OF ENERGY GENERATION AT JEBBA HYDROPOWER STATION (2009-2016), A. O. Odesola & T. O. Ale
Nigerian Journal of Technology, Vol. 38, No. 3, July 2019 746
at a very small rate, but if the reservoir is properly
managed, there will be improvement in the recovery
rate.
The time series plot of the monthly power generated
at JHPS is depicted in Figure 5. It shows that the
generated power has peaks which are not strictly in
step with the inflow as a result of scheduled and
forced outages of the plants in the station. The
aggregate efficiency of conversion is 83.79% which
is less than the 90% theoretical value for propeller
type turbines was obtained.
A further analysis was carried out by comparing the
conversion efficiency of the energy in flowing water
and actual energy generated. Thus the product of the
head (metres) and the outflow was plotted against
the actual energy generated and this is shown in
Figure 6.
0
1000
2000
3000
4000
5000
6000
1
10
6
21
1
31
6
42
1
52
6
63
1
73
6
84
1
94
6
10
51
11
56
12
61
13
66
14
71
15
76
16
81
17
86
18
91
19
96
21
01
22
06
23
11
24
16
25
21
26
26
27
31
28
36
Infl
ow
m3
/s
daysFigure 1: Time Series Of Jebba Inflow 2009-2016
0
1000
2000
3000
4000
Infl
ow
m3
/s
Months
Figure 2: Time Series of Jebba monthly inflow 2009-2016
OVERVIEW OF ENERGY GENERATION AT JEBBA HYDROPOWER STATION (2009-2016), A. O. Odesola & T. O. Ale
Nigerian Journal of Technology, Vol. 38, No. 3, July 2019 747
0
500
1000
1500
2000
2500
3000
3500
4000
flo
w r
ate
m3/s
MONTHS
Figure 3: Time Series of Jebba monthly inflow and outflow 2009-2016
inflow outflow
-300
-200
-100
0
100
200
300
400
500
Res
erv
oir
net
infl
ow
m3/s
Months
Figure 4: Cumulative reservoir inflow jebba 2009-2016
0
50
100
150
200
250
300
350
400
450
Jeb
ba
Po
we
r M
W
Months
Figure 5: Jebba Power Generated Trend (MW)

OVERVIEW OF ENERGY GENERATION AT JEBBA HYDROPOWER STATION (2009-2016), A. O. Odesola & T. O. Ale
Nigerian Journal of Technology, Vol. 38, No. 3, July 2019 748
The resulting scatter diagram reveals a cluster of
points almost satisfying a linear relationship but
some strong component deviate from this cluster.
This deviation was well noticed under high outflow
condition, which shows that a significant part of the
outflow was spilled (wasted) rather than used to
operate the turbines for power generation.
5. CONCLUSION
This work done has used the information to study
power generation at the dam. The hydrological data
indicated that during period under study, the
reservoir is recovering at a very low rate.
A further analysis was carried out by comparing the
conversion efficiency of the energy in flowing water
and actual energy generated. Thus the product of
the head (metres) and the outflow was plotted
against the actual energy generated.
The results satisfied a linear relationship which
reinforces the knowledge of the effects of
hydropower reservoir management on energy
generation.
6. RECOMMENDATIONS
Having carried out this research, the following were
recommended:
1. The reservoir should be properly managed
to avoid water wastage especially during the
condition of high water inflow.
2. Prompt response to faults should be
ensured.
3. Spares parts should be made readily
available so as to reduce the downtime to
the barest minimum.
7. REFERENCES
[1] Ale, T. O. and Odesola, A. O. “Effects of Distance on Transmission (Akure 33kV line a case study)”,
International Journal of Research Findings in Engineering, Science and Technology, Vol. 1,
No.1., 2013, pp 27-32.
[2] Zungeru, A. M.; Araoye, A. B.; Garegy, B. B.;
Garba, A. J. and Tola, O. J. “Reliability Evaluation of Kainji Hydro-Electric Power Station
in Nigeria”, Journal of Energy Technologies and Policy, Vol.2, No.2, 2012, pp 15-31.
[3] Annual Technical Report - ATR “Grid System Operations”, Annual Technical Report Issued by
National Control Centre Osogbo. 2015, pp 1-86.
[4] Ifabiyi, I. P. “Relationship between Power Generation and Reservoir Elements in the Jebba
Hydroelectric Reservoir, Nigeria”, Global Journal of Science Frontier Research, Vol. 11, Issue 8, 2011, pp. 1-11.
[5] Salami, A. W. and Sule, B. F. “Optimal Water
Management Modeling for Hydropower System
on River Niger in Nigeria”, International Journal of Engineering, Annals of Faculty of Engineering Hunedoara, Tome X, 2012, pp. 185-192.
[6] Adie, D. B.; Ismail, A.; Muhammad, M. M. and
Aliyu, U. B. “Analysis of the Water Resources Potential and Useful life of the Shiroro Dam,
Nigeria” Nigerian Journal of Basic and Applied Science, Vol. 20, No. 4, 2012, pp 341-348.
[7] Adegbehin, A. B, Yusuf Y. O Iguisi E. O and
Zubairu, I. “Reservoir inflow pattern and its
effects on hydroelectric power generation at the Kainji Dam, Niger State, Nigeria”, Proceeding of
0
2000
4000
6000
8000
10000
12000
ENER
GY
MW
H
HEAD*OUTFLOW
Figure 6: Energy vs Head*outflow

OVERVIEW OF ENERGY GENERATION AT JEBBA HYDROPOWER STATION (2009-2016), A. O. Odesola & T. O. Ale
Nigerian Journal of Technology, Vol. 38, No. 3, July 2019 749
the 3rd international conference on Environmental and Economic Impact on Sustainable Development (EID), Vol. 203, 2016
pp 233-244.
[8] Alayande, A. W. and Bamigboye, O. A. “Tail
water Recycling for Hydropower Generation, Niger River”, 29th WEDC International Conference Abuja Nigeria, 2003, pp 175-177.
[9] Ale, T. O., Alowolodu, K. E., Babatola, J. O. and
Olufeagba, B. J. “Inflow Forecasting for Kainji Dam Using Time Series Model”, International Journal of Mathematical Archive (IJMA), Vol. 2, No. 12, 2011, pp 2844-2851.
[10] Jimoh, O. D. “Optimized Operation of Kainji Reservoir”, Assumption University Journal of Technology (AUJ.T.), Vol. 12, No. 3, 2008, pp
34-42.
[11] Sule, B. F., Salami, A. W. and Okeola, O. G. “Operational Impact of Hydropower Generation
and Highlights on Preventive Measures in Lowland Area of River Niger, Nigeria”,
International Electronic Engineering Mathematical Society IEEMS, Vol. 7. No 1, 2009, pp. 109 -126.