Embed Size (px)
Citation preview

Christian F Christian F LenhartLenhart , , Assistant Prof, MSU Assistant Prof, MSU
Research Assoc., U of M Research Assoc., U of M BiosystemsBiosystems EngineeringEngineering
Overview of fluvial and Overview of fluvial and geotechnical processesgeotechnical processesfor TMDL assessmentfor TMDL assessment

Fluvial processes in a glaciated landscape
Rocky Mountains (Rosgen)
Martin County, MN
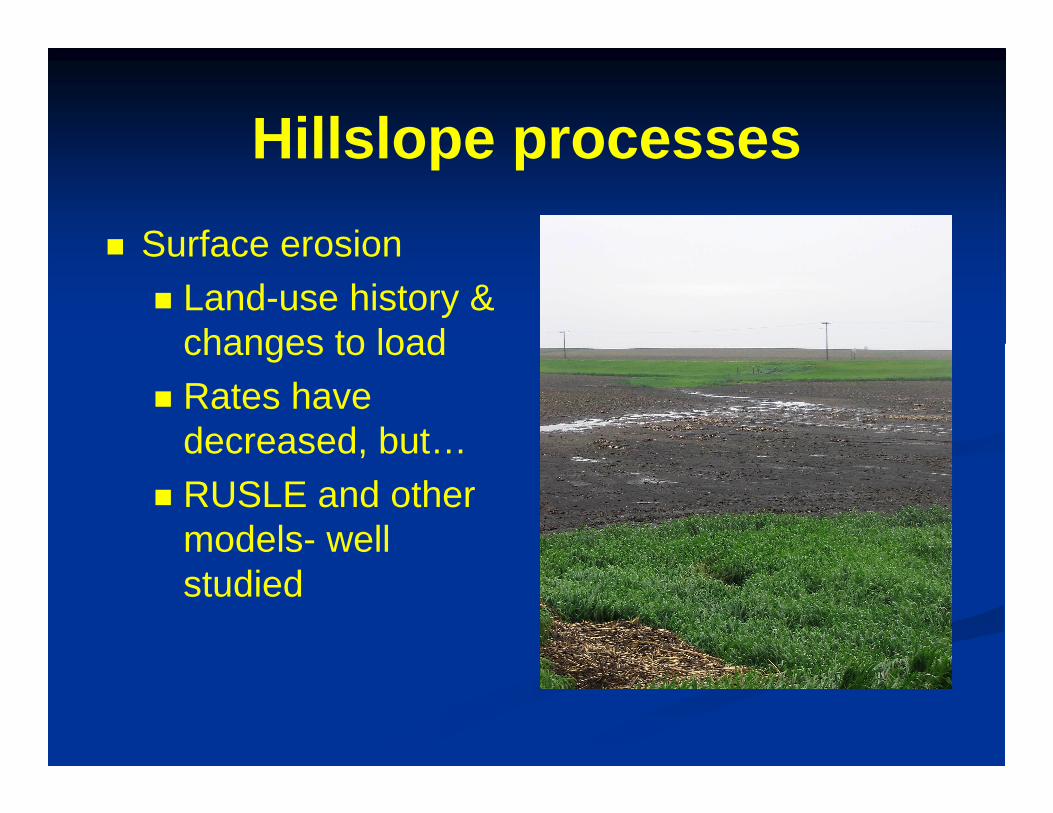
Hillslope processes
� Surface erosion
� Land-use history & changes to load
� Rates have decreased, but…
� RUSLE and other models- well studied

Sediment delivery
� Sed. delivery poorly understood
� Small % of eroded sediment is carried all the way to river mouth
� Sdr = 63 Sm0.40 Rosgen (WARSSS pg. 2 – 3)

Sed delivery by slope
Sediment delivery by slope
-0.5
0
0.5
1
1.5
2
2.5
0.0% 10.0% 20.0% 30.0% 40.0% 50.0% 60.0% 70.0% 80.0% 90.0%
Sediment delivery ratio
Slo
pe

Case studies
� Driftless area: Coon Creek, WI� 5% of sediment eroded since European
settlement carried out to Mississippi River(Trimble, 1993 - Science article).
� Rush Creek, MN – 4-8 feet on floodplain
� Elm Creek, MN� Sediment measured at gage 8-13% of
estimated annual soil erosion (Lenhart 2008)

Legacy sediment
Where is the excess sediment from the past 150 years stored?� Stream valleys
� Wetlands and lakes� Stream reaches with low velocity and slope;
Overwidened reaches (ditches) low unit stream power ( ω )

Depositional areas
� Ditches have become depositional areas
� Increased width reduces shear force, inducing deposition
� (Landwher, 200x)

Lakes and Wetlands

HillslopeHillslopeprocesses: processes: Mass soil Mass soil movementmovement
GravityGravity--driven movements:driven movements:Falls, slides, flows , soil creepFalls, slides, flows , soil creep
Bluffs are a major source of sediment by Bluffs are a major source of sediment by massmass--wasting in Minnesota River Basin wasting in Minnesota River Basin

Geomorphic categories
� Valley wall = Bluff� Streambank = Active channel boundary� Ravines = steep tributaries flowing over
the valley wall to larger rivers

Ravines

Ravines in Minnesota Basin

Hillslope Erosion: Gullies
•Sheet erosion
•Rill erosion
•Gullies

Gullies within ravines
CS2 Riffle
0
5
10
15
20
25
0 20 40 60 80 100 120 140 160
Width from River Left to Right (ft)
Ele
vatio
n (
ft)
Ravine
Gully
gully inset within larger ravine

Channel Processes
Patterns of erosion and deposition

Equilibrium Theory and Streams
� Idealized stream in equilibrium:� Sediment supply in balance with transport
� Deposition on point bars in balance with erosion on outer bend
� Are Minnesota streams in equilibrium?

Physical forces in streams� Force balance described by equation of motion
For channel with flowing water:
d(mV)/dt = F gravity + F pressure – F shear
expanded out: d(mV)/dt =( ρρρρ*g* A*∆∆∆∆x* SIN αααα S0) + (Fp1- Fp2) – ( ττττb *
wp* ∆∆∆∆x)
[where, ρ = density of water, g= gravitational constant, A= area, ∆x = change in distance over control volume, S0= channel bottom slope, Fp1 = force at point x, Fp2 = force at point x + ∆x.]

� Force balance: streams exist in a dynamic equilibrium
� Lane’s = predicts channel adjustment� Channel dimensions shaped by frequently
occurring floods – bankfull flows
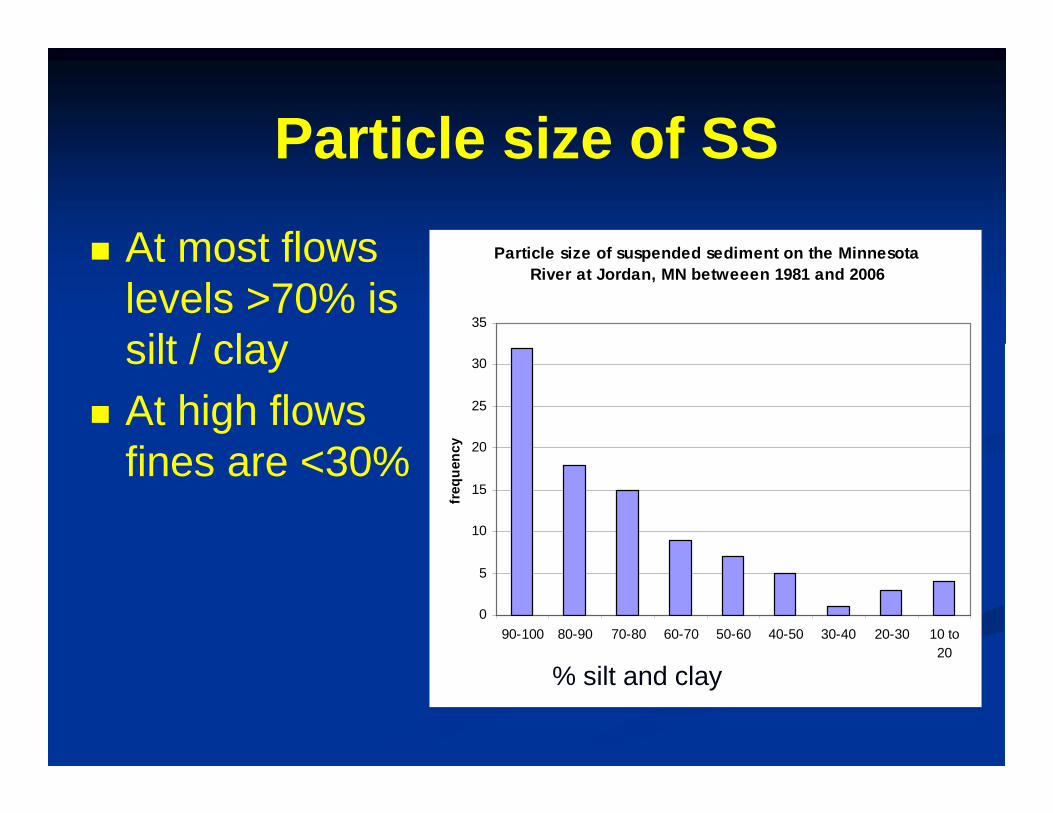
Sediment Transport in channels
� Bedload
� Suspended load� Wash load

Entrainment equations
Shield’s Equation

Suspended Sediment
� Often estimated by TSS (total suspended solids) - organic matter and sediment
� Turbidity is regulated pollutant
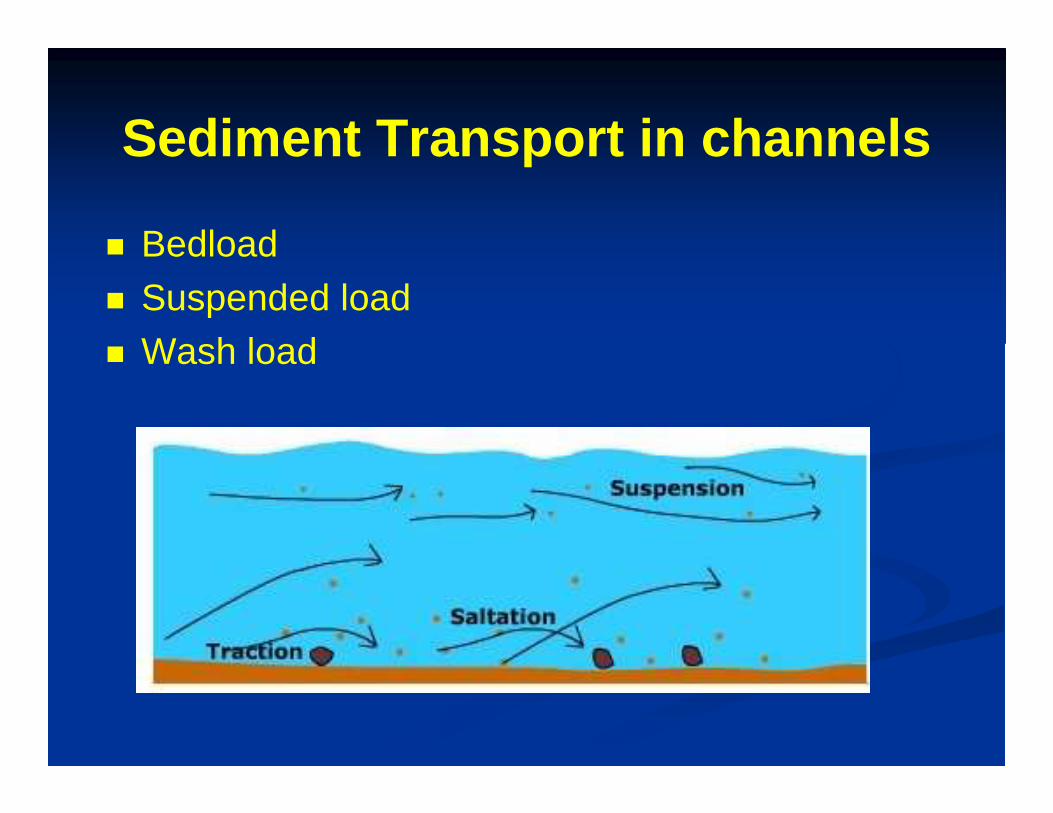
Particle size of SS
� At most flows levels >70% is silt / clay
� At high flows fines are <30%
Particle size of suspended sediment on the Minnesot a River at Jordan, MN betweeen 1981 and 2006
0
5
10
15
20
25
30
35
90-100 80-90 70-80 60-70 50-60 40-50 30-40 20-30 10 to20
% of particles finer than sand (0.063mm)
freq
uenc
y
% silt and clay

Bedload sediment
� Moves by bouncing, rolling� In MN River basin, comprised mostly of
sand� Smaller component of total load

Threshold sediment size vs. Median Particle Size in Elm Creek
0
5
10
15
20
25
30
35
40
0 5 10 15
Median Bed Particle size - D 50 (mm)
Thre
shol
d se
dim
ent s
ize
(mm
)
Threshold = D50
Deposition
Mobilization
� bed sediment easily mobilized at high flows
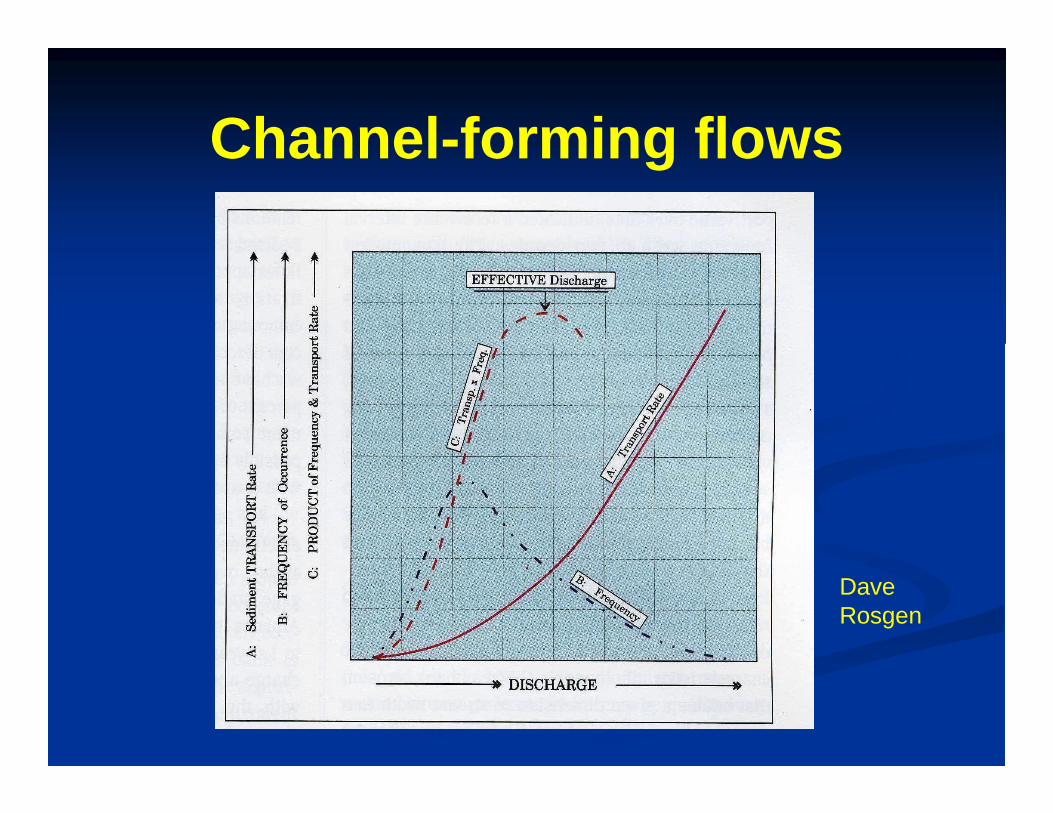
Channel-forming flows
Dave Rosgen

Hydrologic-watershed processes
� More generally, Lane’s sediment balance
qs D50 ∞∞∞∞ qSqs = sediment discharge
D50 = average diameter of bed particle sizeq = stream flowS = slope

Changes to equilibrium
Changes to watershed hydrology and streamflow cause channel adjustment
in Minnesota � Recent drainage increases
� Private tile drainage expansion < 30 years
� Precipitation high in 1990s� Result: increased low and mean flows
(Zhang and Schilling, 2007)

Simon and SchummChannel Evolution Model
� Most southern Minnesota streams are in stages 3-5, especially 4 and 5

Sources of sediment in rivers
� Streambanks� Bluffs� Ravines/gullies� Legacy sediment

Channel erosion: streambank
Photo of Elm Creek by C. Lenhart
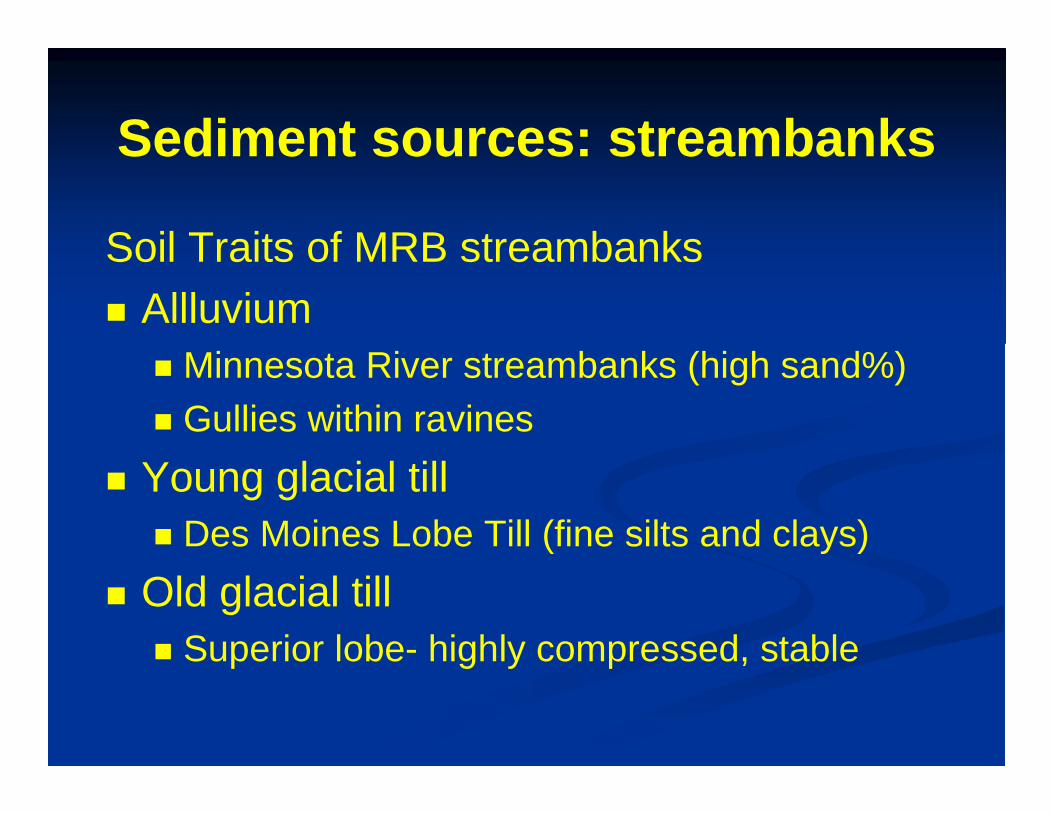
Sediment sources: streambanks
Soil Traits of MRB streambanks� Allluvium
� Minnesota River streambanks (high sand%)� Gullies within ravines
� Young glacial till� Des Moines Lobe Till (fine silts and clays)
� Old glacial till� Superior lobe- highly compressed, stable

Role of vegetation
Grazing effects on roots
Bank Erosion Hazard Index quantifies root influence
Hydraulic erosion
Hydrologic role – less mass wasting by lowering soil moisture

Grass vs. treesHeadwaters prairie
Riparian forests on larger rivers

Sediment sources: Bluffs (valley wall erosion)
� Dramatic examples of mass-wasting� High delivery ratio� Stability of denser tills?

Sediment sources: Ravines/gullies
� Hard to capture events from gullies� Active gully only a small % of ravines� Sediment delivery is lower than
streambanks and bluffs – dump out onto MN River floodplain

Sediment sources: Legacy sediment
� Mean depth of fine sediment in Elm Creek1.1 feet (n = 360)
� Little studied recently� Historically by SCS after Dust Bowl years

Current Research
� Ravine, Bluff, Streambank Erosion study in Minnesota River BasinBioproducts & Biosystems Engineering, U of M
Minnesota Pollution Control Agency
� Purpose: to quantify sediment loads from R, B and S sources; contribution to turbidity problem

Methods
� Ravines: runoff, TSS monitoring at gully outlets; geomorphic assessment� Stream classification, CEM assessment
� Physical property measurement: critical shear stress, particle size

Study sites

Bank stability and toe erosion model (BSTM)
� Critical shear stress
� Cohesive strength

Data
� Field-measured rates of bank erosion� Modeled erosion and transport using
CONCEPTS� Sediment loading from gullies/ravines� Historic rates of channel migration
estimated from photos

Preliminary findings
� Bluffs – major sources of sediment; some hard tills are stable (Gupta, Thoma, Mulla)
� Ravines (Mulla GIS work) ?� Gullies� Streambanks:
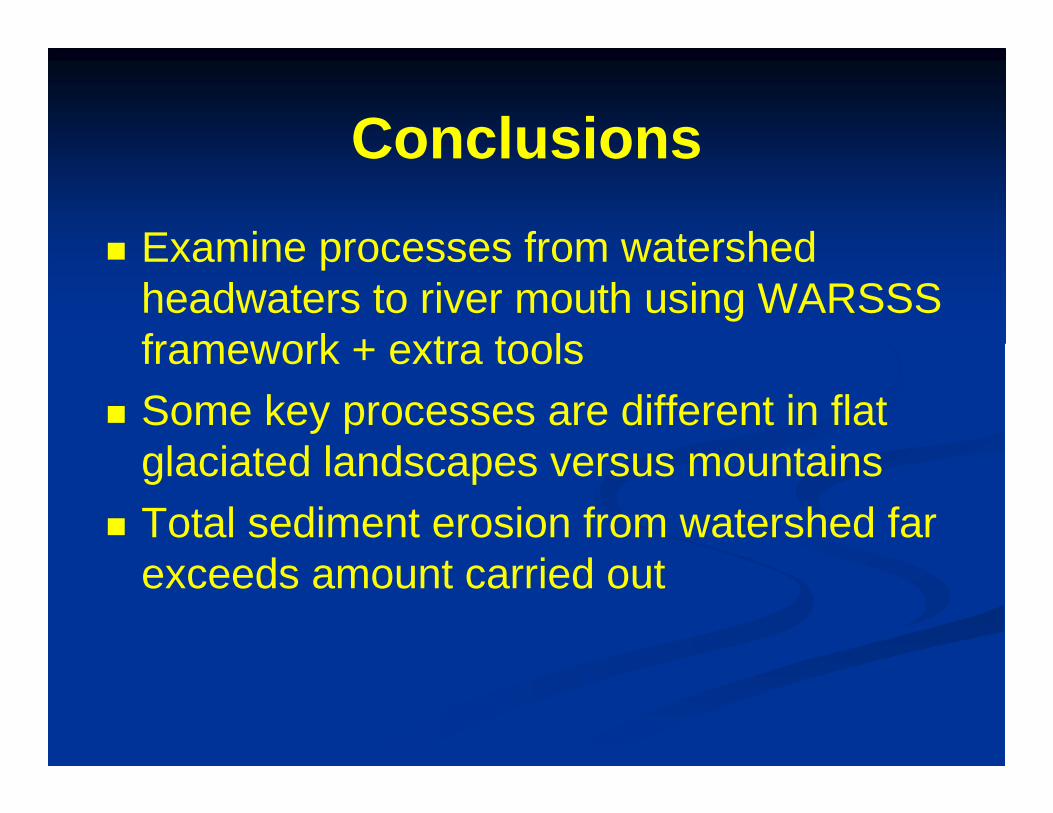
Conclusions
� Examine processes from watershed headwaters to river mouth using WARSSS framework + extra tools
� Some key processes are different in flat glaciated landscapes versus mountains
� Total sediment erosion from watershed far exceeds amount carried out
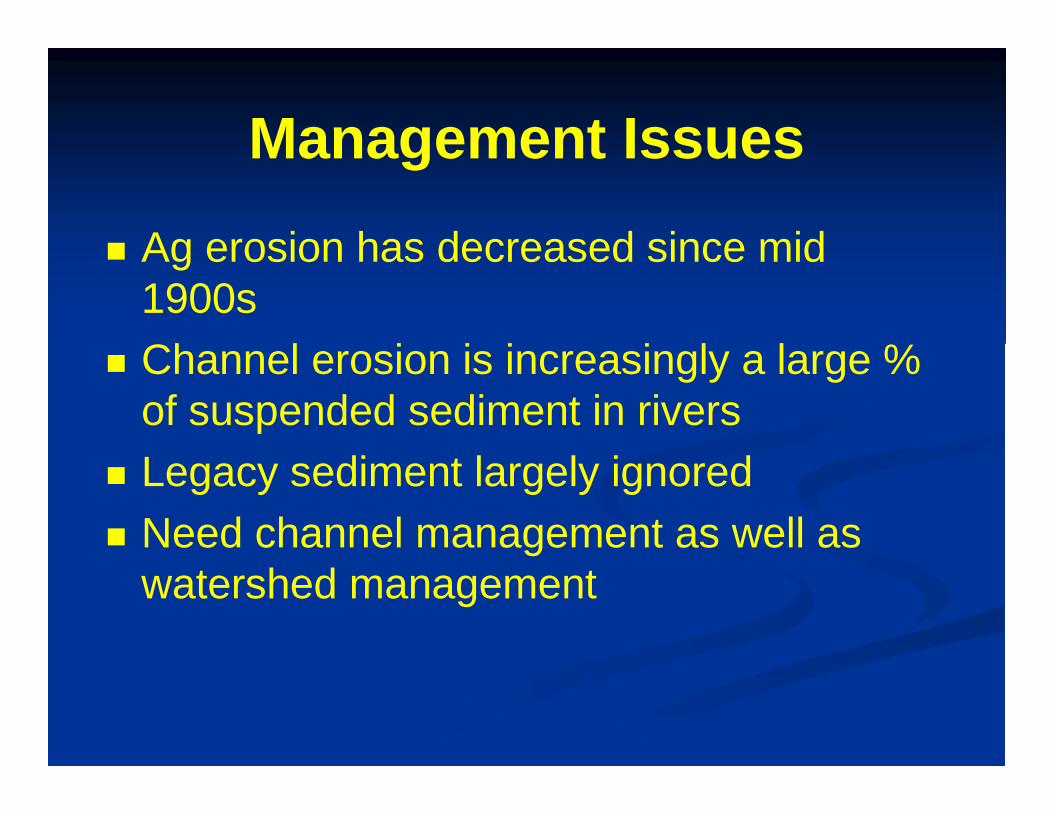
Management Issues
� Ag erosion has decreased since mid 1900s
� Channel erosion is increasingly a large % of suspended sediment in rivers
� Legacy sediment largely ignored� Need channel management as well as
watershed management