Embed Size (px)
Citation preview

Overview of Inland Connections and Logistic
System in ASEAN
SungSung--Woo Lee, DirectorWoo Lee, DirectorInternational Logistics Research Department
Contents

INTERNATIONAL LOGISTICS TRENDS

Increasing Global TradeAve. growth rate in terms of Global Merchandise Trade recorded 8.4% (2010)
Source: Drewry Maritime Advisor, 2011 4

Risk management in Int’l Logistics
5

Growth in Global Logistics Market Major economies(EU, US, China, Japan) trying to expand FTAs
NAFTANAFTA: Increasing trade: Increasing trade between USbetween US →→ North America & CaribbeanNorth America & CaribbeanPurpose is to impose preferential tariff rates to clothing and finished textiles93% of US Fiber exports : North and Central America, Caribbean
Back-to-Back C/O in Korea-ASEAN FTAAcknowledging origins of those products being Exported as original state Increase in demand for distribution bases(Singapore)
Increase in Increase in ValueValue--added exportsadded exports (by utilizing FTA agreements, provisions on origins) (by utilizing FTA agreements, provisions on origins)
Status of RTA’s in the world
# of Effected RTAs
Accumulated RTAs
Portion of FTAs in global Trade
6

Growth in Asian Logistics Industry
Asia’s T&L sector expanding rapidly, in line with the region’s stellar economic growth
Asia’s widening manufacturing base, Deeper intra-Asian trade integration, Rising household incomes, High urbanization rates and widespread government efforts to improve infrastructure have boosted demand for T&L services
9 out of 10 biggest container ports in the world were in ASIA (2009)
# of players in Asia’s T&L sector, homegrown and global, is rising
Total combined revenues: US$66.1billion (2004) →→ US$140.8 billion (2009)
Competition in Asia’s T&L sector is intensifying
Rising domestic demand in Asia will change the nature of trade in the region, creating new growth opportunities
Source: The Economist Intelligence Unit, 2012. Asia Competition Barometer. Transport and Logistics.
7
ASEAN LOGISTICS MARKET TRENDS

• CLMV(Cambodia, Lao PDR, MyanmarMyanmar, Vietnam) are the countries with low economic development among the ASEAN region
• However CLMV market shows robust economic development, Korean companies are very much interested in them
(Ex) Markets near the Thailand-Myanmar-Cambodia-Lao PDR-Vietnam-China network
Brunei Darussalam Cambodia Indonesia Lao
PDR Malaysia MyanmarMyanmar Philippines Singapore Thailand Vietnam ASEAN World
Million $ Trillion $
1981 46 1 371 1 234 13 142 488 170 7 0.1 3.9
1991 36 1 551 2 712 16 218 1,256 669 47 0.4 7.1
2001 46 28 873 11 1,616 54 652 2,380 1,272 312 0.7 12.5
2011 175 169 3,810 76 4,150 216 1,083 7,779 4,553 2,144 2.4 36.2
CAGR 4.6% 19.5% 8.1% 16.0% 10.1% 9.9% 7.0% 9.7% 11.6% 21.0% 9.8% 7.7%
Boosting Trading Volume in ASEAN
Trade volume in ASEAN countries
9

√ASEAN countries, from 1992, trying to promote FREE TRADE and Regional Integration by expanding FTAs with other various countries
Promoting Free Trade Agreement
Growth of Concluded FTAs in AsiaASEAN is emerging as the major regional hub
linking ASEAN members with the region’s larger
economies
PRC(2009), Japan(2006), and Korea(2006)
Recently implemented regional agreements with India, Australia & New Zealand jointly
FTA discussions with the EU
Unique concept of SEZ(Special Economic
Zone) used in ASEAN Region
IMT GT
GMS10

√ASEAN member states realized that Logistics Industry will improve the regional economic growth by enhancing transport infrastructures
Promoting Logistics Industry (1)
Poor transport infrastructures impede economic growth for T&L industry in
ASEAN region
South-East Asia possess poor level of transport infrastructures in all aspects
Low logistics/transport efficiency eventually leads to low economic growth in the region despite the adequate supply of natural resources and labor
Investment needed for transport/logistics infrastructure in the region (similar
to the North-East Asian Economic Model)Source: The Economist Intelligence Unit, 2012. Asia Competition Barometer. Transport and Logistics.
11

Promoting Logistics Industry (2)√ASEAN’s evolving manufacturing footprints will affect the region’s T&L
industry by shifting demand to newer markets
Several broad trends are causing a rethink of Asian manufacturing
(ex) rising wages in ChinaSuch leads to the flight of low-cost manufacturing away from the south and coastal areas of that country to inland provinces and neighboring countries such as Vietnam
T&L firms need to adapt to such rapid changing dynamics to maintain
profitability
North-East Asia: US$85 per Container/ South-East Asia: US$1,236 per Container
According to World Bank report(2008), 10% of transport cost reduction will lead to 20% increase in trade volume
12

Logistics Roadmap for Priority Integration√Logistics Roadmap was officially signed at 39th ASEAN Economic Ministers
Meeting in Manila, Philippines, August 2007
The objectives of the Logistics Roadmap are:
1. Create an ASEAN single market by 2015 by strengthening ASEAN economic integration through liberalization and facilitation measures in the area of logistics services;
2. Support the establishment and enhance the competitiveness of an ASEAN production base through the creation of an integrated ASEAN logistics environment
Source: ASEAN Secretariat, n.d. ASEAN Cooperation on Transport Facilitation and Logistics.
13

I. Encourage the Integration of the ASEAN National Logistics Systems – by increasing communications at the regional level to identify actions in the
logistics sector to support and facilitate trade flows between ASEAN Countries
II. Encourage the Progressive Liberalization of Logistics Services – to make them better able to respond to the opportunities available for ASEAN
integration and increasing competitiveness
III. Increase Trade, Logistics and Investment Facilitation– to identify the means needed to improve transport logistics facilities and the
priorities for investment
IV. Build ASEAN Logistics Capacity – by encouraging human resource development in the sector, and an environment
conducive to developing the sector
V. Promote ASEAN Logistics Service Providers by identifying them and providing channels for their greater participation in the sector
VI. Promote Multimodal Transport Capacity (especially containerized transport)
Major Policy Areas for the Roadmap
Source: ASEAN Secretariat, n.d. ASEAN Cooperation on Transport Facilitation and Logistics. 14

CONCEPT OF INTEGRATED LOGISTICS NETWORK

Definition of Integrated Logistics Network√System-wide management of entire logistics chain as a single entity, instead
of separate management of individual logistical functions
• Standardization in distribution among countries and locals
• Increase in logistics efficiency through proficient transshipment among various transport modes
• Easier and faster customs clearance with regional agreementDevelopment and Operationalization of Dry ports andIntermodal Transport Corridors (UNESCAP, 200
9)
- Economic benefits- Increase in logistics efficiency
UNESCAP Transport Sector Activities and Introduction to the corridor project (UNESCAP, 2009)
- Increase access- Systemic management in various transport measures- Economic benefits
Toward a Roadmap for Integration of the ASEAN Logistics Sector: Rapid Assessment and Concept Paper Executive Summary (ASEAN, USAID, NATHAN Association)
- Increase in national competitiveness- Composed of (1) shippers, traders & consignees; (2) public and private service providers; (3) regional and national rules, policies and institutions; and (4) transport and communication infrastructure
Intermodal Transportation and Integrated Transport System Spaces, Networks and Flows (Jean Paul Rodrigue, 2006)
- Economic benefits- Necessary to intermodal transportation- Positive effects to technology development
The East-West Corridor (Asian Development Bank)
- Increase in trade- Increase in logistics efficiency- Decrease in regional difference
Related Studies
16

Current status in ASEAN region √ ASEAN member states are planning various plans in order to integrate
transport, logistics and economic system
Source: ADB, n.d. Greater Mekong Sub-region. http://www.adb.org/countries/gms/main (Accessed 15.10.2012)
• GMS Development Plan : Promoting cooperative development in 8 economic zones
• ASEAN Highway, Train Asian Railway: Increase connectivity among ASEAN
• ASEAN Transportation Plan 2011-2015 : Integrated management in logistics system,
Green Logistics, and Logistics Efficiency
ASEAN Highway NetworkGMS development plan
17

Conditions for Efficient Integrated Logistics Network (1)√ Improved transport infrastructure needed for efficient integrated logistics
network
• Inconsistent levels in transport infrastructure among the ASEAN member countries
• Improved and better road and rail infrastructure are currently necessary in order to
replace traditionally well-used inland waterways
World Transportation Ranking (World Economic Forum)MyanmaMyanma
rrLaoLaoPDRPDR
VietnaVietnamm
CamboCambodiadia
ThailanThailandd
MalaysiMalaysiaa
IndonesIndonesi ai a
SingapSingapo r eo r e
PhilippiPhilippin e sn e s BruneiBrunei
RoadRoad 145 146 120 66 39 27 90 3 87 30
RailRail 144 N/A 68 81 65 17 51 5 94 88
TotalTotal 145 146 119 72 49 29 92 2 98 43
Source: World Economic Forum, Global Competitiveness Report 2011-201218
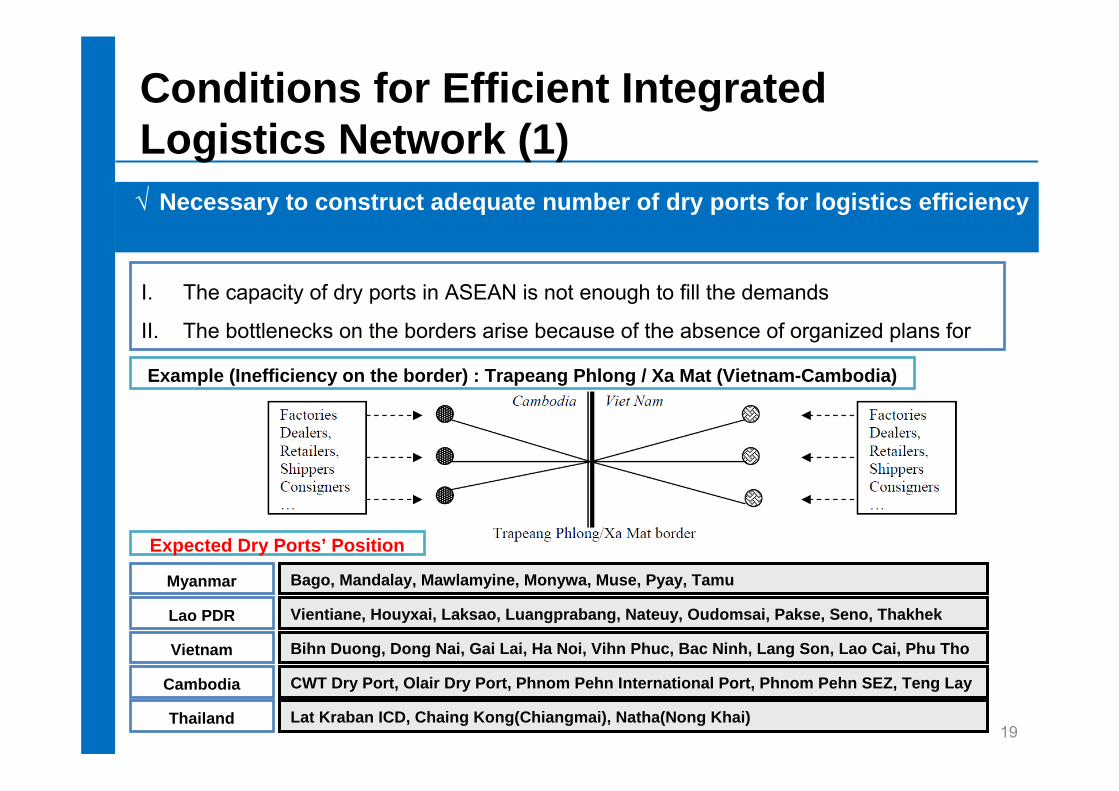
√ Necessary to construct adequate number of dry ports for logistics efficiency
I. The capacity of dry ports in ASEAN is not enough to fill the demands
II. The bottlenecks on the borders arise because of the absence of organized plans for
dry ports
Bago, Mandalay, Mawlamyine, Monywa, Muse, Pyay, TamuMyanmar
Vientiane, Houyxai, Laksao, Luangprabang, Nateuy, Oudomsai, Pakse, Seno, ThakhekLao PDR
Bihn Duong, Dong Nai, Gai Lai, Ha Noi, Vihn Phuc, Bac Ninh, Lang Son, Lao Cai, Phu ThoVietnam
CWT Dry Port, Olair Dry Port, Phnom Pehn International Port, Phnom Pehn SEZ, Teng LayCambodia
Lat Kraban ICD, Chaing Kong(Chiangmai), Natha(Nong Khai)Thailand
Expected Dry Ports’ Position
Example (Inefficiency on the border) : Trapeang Phlong / Xa Mat (Vietnam-Cambodia)
19
Conditions for Efficient Integrated Logistics Network (1)

Why need Integrated Logistics Network?√ Integrated logistics network for increasing logistic efficiency and
connectivity between the ASEAN member countries
I. Standardization and elevation of Infrastructure level/quality
II. Development and vitalization of dry ports
III. Eliminating the bottlenecks near the border with mutual agreements
External Factors Basic Requirements
• Increase in trade volume between ASEAN and China
• Bottlenecks on the borders frequently
• Inconsistent levels in transport infrastructure among the ASEAN countries
•• The standardizing and The standardizing and upgrading the quality upgrading the quality of Infrastructure of Infrastructure
•• The development and The development and vitalizing the dry ports vitalizing the dry ports
•• The elimination of the The elimination of the bottlenecks on the bottlenecks on the bordersborders
IntegrateIntegratedd
LogisticsLogisticsNetworkNetwork
ss
Expected Outcomes
• Increase the logistic efficiency between ASEAN and China
• Reduce the logistic costs in ASEAN region
• Increase the connectivity between ASEAN countries
20

CASE STUDY

EU : Pan-European Corridor
√General Information
• Total of 10 corridors
• EU including East European countries,
Russia, Germany, Italy, Austria, Switzerland
Participated
• For improved and smoother logistics between
East and West European countries
• 48,000km (Rail: 25,000km, Road: 23,000km)
• Connectivity with other logistics networks
such as Trans-European Transport Network
(TEN), TINA Network, Pan-European
Transport Areas (PETrAs), Transport Corridor
Europe Caucasus Asia (TRACECA)
Corridor Ⅰ: Trallinn-Riga-Kaunas-Warszawa Corridor Ⅱ: Berlin-Warszawa-Minsk-Moscow-Niznij NovgorodCorridor Ⅲ: Dresden-Wroclaw-Lviv-Kiev
Corridor Ⅳ: Dresden-Praha-Bratislava/Wien-Budapest-Arad
Corridor Ⅴ: Venezia-Trieste/Koper-Ljubljana-Budapest-Uzgorod-LvivCorridor Ⅵ: Gdansk-Grudziadz/Warszawa-Katowice-ZillinaCorridor Ⅶ: DanubeCorridor Ⅷ: Durres-Tirana-Skopje-Sofija-Varna/BurgasCorridor Ⅸ: Helsinki-St.Petersburg-Pskov/Moscow-Kiev-Ljubasevka-
Chisinau-Bucuresti-AlexandroupolisCorridor Ⅹ: Salzburg-Ljubljana-Zagreb-Beograd-Nis-Skopje-Veles-
ThessalonikiSource: European Commission (2003), Status of the Pan-European Transport Corridors and Transport Areas
22
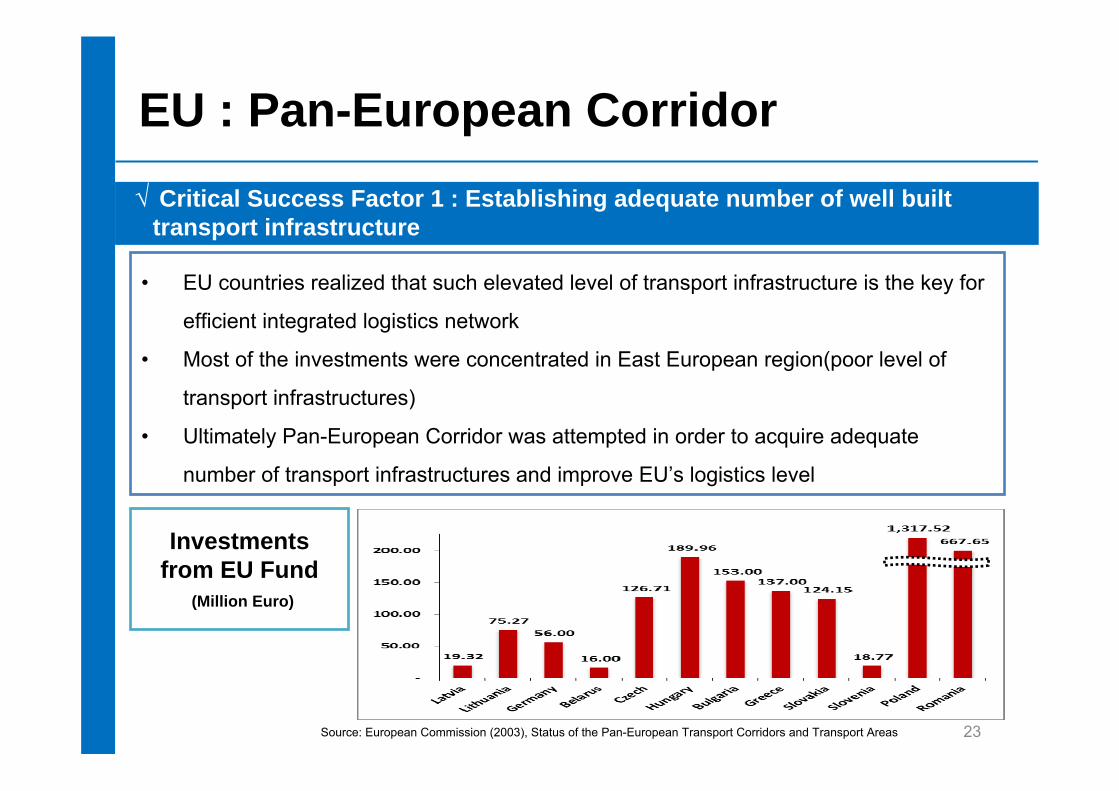
EU : Pan-European Corridor√ Critical Success Factor 1 : Establishing adequate number of well built
transport infrastructure
• EU countries realized that such elevated level of transport infrastructure is the key for
efficient integrated logistics network
• Most of the investments were concentrated in East European region(poor level of
transport infrastructures)
• Ultimately Pan-European Corridor was attempted in order to acquire adequate
number of transport infrastructures and improve EU’s logistics level
Investments from EU Fund
(Million Euro)
`
23Source: European Commission (2003), Status of the Pan-European Transport Corridors and Transport Areas

EU : Pan-European Corridor
√ Critical Success Factor 2 : Appropriate Dry port positioning and efficient management
• Proper positioning of 10 logistics axis : selecting local logistics centers in the axis
• Assumed expected quantity of good transported before positioning the dry ports and
logistics centers
• Easier and Faster customs clearance(through related Agreements between the
members)
Dry ports locations in Pan-European Corridor
Source: European Commission (2003), Status of the Pan-European Transport Corridors and Transport Areas
24

USA : Ports-to-Plain Trade Corridor
• 9 states (TX, NM, OK, CO, ND, SD, MT, NE
and WY), Canadian province (Alberta) and
Mexico are included
• Total of 3,754km
• Aimed at offering rural America, its advocates
and key trading partners a forum for
collaboration, partnership for maximizing the
potential of the region and other resources
• Produces $44.3 billion of agricultural goods, or
22.1% of the U.S. total; 6 of the top 10 farm
states
• Generates $166.7 billion in trade with Canada
and Mexico, nearly 20% of total U.S.-North
America tradeSource: AECOM, Port-to-Plain Corridor, n.d. http://www.portstoplains.com/EMMA/PTP_Our_Assets_2_Pager.pdf (Accessed 10.10.2012) 25
General Information

√ Critical Success Factor 1 : Establishing adequate number of well built logistics infrastructure
USA : Ports-to-Plain Trade Corridor
• Participated members realized that the level of transport infrastructure should be
elevated and improved
• Most of the investments were concentrated in the region with poor level of transport
infrastructure
• Ultimately Ports-to-Plain Trade Corridor was established for logistics efficiency and
security among the North American region`Amount of Investment to
selected states (Million USD)
26Source: AECOM, Port-to-Plain Corridor, n.d. http://www.portstoplains.com/EMMA/PTP_Our_Assets_2_Pager.pdf (Accessed 10.10.2012)

√ Critical Success Factor 2: Development of dry ports in main point and efficient operation
USA : Ports-to-Plain Trade Corridor
• Establishing the corridors based on its major transport mode (Trucking)
• Easier and Faster customs clearance process among NAFTA region
• Economic benefit expected: about USD $2 Million – USD $3.75 Million per Year
Expected Economic output Ports-to-Plain Trade Corridor: Dry Port
Minim
umM
aximum
27

IMPLICATIONS

ImplicationsWork together for better and improved fiduciary relations among ASEAN
countries
• Agreements , cooperation and amending institutions needed for easier and faster customs clearance will lead to decrease in Bottleneck events
• International conventions and conferences between ASEAN member states and North East Asian Countries (Korea, Japan, China) for sharing information
“Integrated Logistics Plan” needed in the ASEAN region
• By estimating and calculating logistics demand between the member countries, any related logistics and transport facilities/ infrastructure should be positioned properly
Increase in ASEAN Connectivity
• Modernize and improve transport infrastructure/facilities (AH(Asian Highway), TAR (Trans Asian Railway) )
• Improving inland logistics efficiency through developing inland ports
Establishing Green Logistics System
• Adopting Green Logistics and transport technologies for Rio+20 Summit
• Efficiency in customs and logistics process : combining with the latest technologies h RFID ICT
29