Embed Size (px)
Citation preview

Manzul K. Hazarika, Ph.D.
Associate Director, Geoinformatics Center Asian Institute of Technology (AIT)
Thailand [email protected]
Overview of JAXA’s Capacity Building Activities and Mini-Project

1. To develop in-country capacities in use of RS and GIS data 2. To make use the Japanese satellite data for disasters and environmental issues
Objectives of JAXA’s Capacity Building Activities

Structure Chart of JAXA’s RS Capacity Building Activities Six types of capacity building activities have been conducted to support using its satellite data.
Bi-lateral Multi-lateral Multi-lateral Bi-lateral Bi-lateral Multi-lateral

4
1. Sentinel Asia
2. Space Applications for Environment (SAFE) .
Mini-Projects Types

A) Sentinel Asia 1. Flood hazard and exposure mapping – Bangladesh
(Bangladesh Water Development Board) 2. Flood Hazard and exposure mapping – Myanmar
(Department of Meteorology and Hydrology) 3. Volcanic Hazard and exposure mapping – Philippines
(PHIVOLCS & NAMRIA) 4. Flood Hazard and exposure mapping – Philippines
(PAGASA & NAMRIA) 5. Flood Hazard and exposure mapping – Sri Lanka
(DMC & Survey Department) B) SAFE 1. Rice Monitoring and Mapping – Bangladesh
(Bangladesh Agri. Research Institute & BAU) 2. Rice Crop Monitoring and Yield Estimation – Cambodia
(Department of Planning and Statistics)
Mini-Projects in 2013-14

A) Sentinel Asia 1. Flood Hazard and exposure mapping – Indonesia
(LAPAN and BIG)
2. Flood Hazard and exposure mapping – Vietnam (STI and DMC)
B) SAFE 1. Rice Monitoring and Yield Estimation – Cambodia
(Department of Agriculture, Planning and Statistics Division)
2. Forest Resources Mapping with Satellite Data – Myanmar (Forest Department)
Mini-Projects in 2014-15
Phase-I: Workshop and Stakeholder Consultation ~ Oct.- Nov. 2014 Phase-II: Capacity Building Workshop and Training at AIT ~ Nov. – Dec. 2014 Phase-III: Workshop for Dissemination of Results ~ Jan.- Feb. 2015
Implementation Plan for 2014-15
Workshop • Introduction to Mini-Project • Overview of Applications of Remote Sensing and GIS Stakeholder Consultations • Objectives of the project • Data requirements • Outputs • Applications • Selection of study area(s) • Discussions and feedbacks
Phase-I: Workshop and Stakeholder Consultation

9
Mini-Projects Workshop in Myanmar - 7 Nov. 2014
10
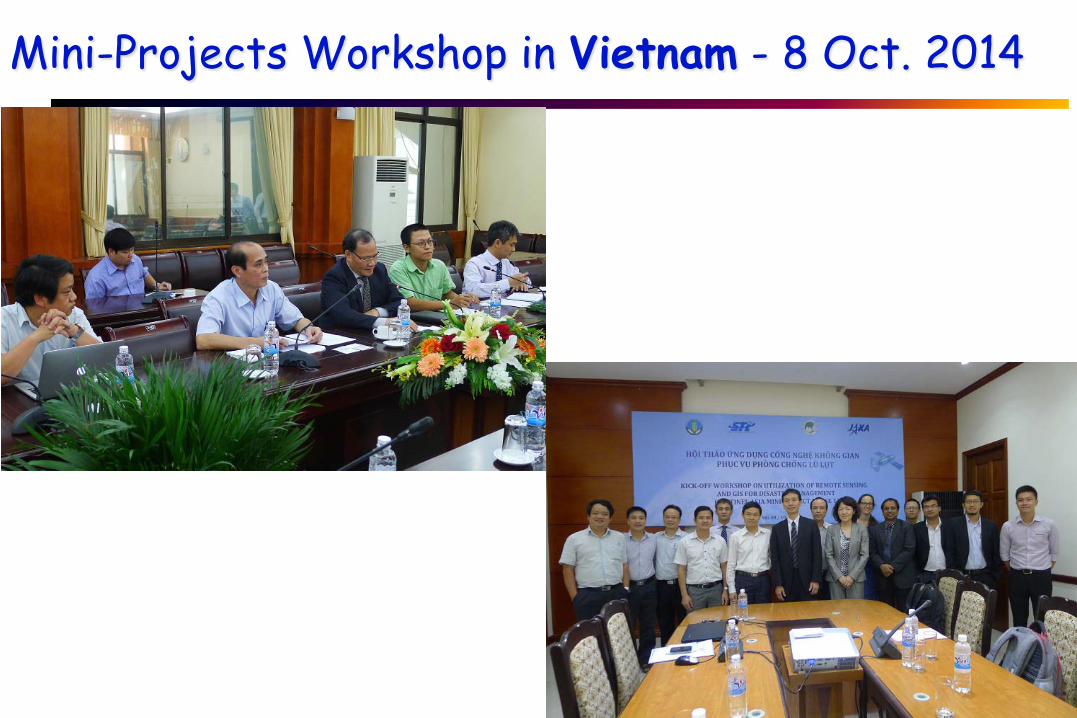
Mini-Projects Workshop in Vietnam - 8 Oct. 2014

11
Mini-Projects Workshop in Cambodia- 17 Sep. 2014

12
Mini-Projects Workshop in Indonesia- 8 Sep. 2014

• Processing of Satellite data • Integration of satellite data with of models • Validation of data products (outputs) against available secondary information • Preparation of reports
Phase-II: Capacity Building Workshop and Training at AIT

Phase-III: Field Verifications and Workshop for Dissemination of Results
Field Verifications: • Field visit of study area(s) • Fine-tune and update the data products
Workshop for Dissemination of Results: • Presentation of findings • Share the value-added data products to the stakeholders • Seeking suggestions from all stakeholders • Lessons learned • Future plans

Past Mini-Project in Myanmar with DMH
Study Area: • Homalin City in the Chindwin River Basin Objectives: • Flood hazard and vulnerability assessment in Homalin area • To use ALOS/PALSAR images in flood area delineation

Flood Hazard, Vulnerability and Risk
Risk = Hazard x Physical Vulnerability x Amount/Number
Type of hazard Intensity Duration Spatial Extent
Type of elements at risk Numbers Economic value Location
Flood Depth or Intensity
Dam
age (
%)
Vulnerability Elements-at-risk Hazard
5 1025 1005 1025 100
Overlay of hazard & element at risk
Exposure
(Probability of occurrence) (Degree of losses to elements at risk) (Quantification of exposed elements)
Modeling + GIS RS + GIS
Field Data

Risk Free
Hazard = 1/10 =0.1 Exposure = 1.2 Vulnerability = 1.0 US $ 100,000
Hazard = 1/10 =0.1 Exposure = 0.8 Vulnerability = 0.2 US $ 100,000
Hazard = 1/10 =0.1 Exposure = 1.0 Vulnerability = 0.5 US $ 100,000
10 yr. Flood
What is the cost for constructing a dam?
10 yr. Flood
What is the cost for flood-proofing?
10 yr. Flood High Risk Zone
(No Settlement permitted)
Medium Risk Zone (Restricted Settlement)
Risk Free Zone Risk Free Zone
What is the cost for risk zoning and relocation? What is the insurance premium in different risk zones?
10 yr. Flood
Importance of Hazard, Vulnerability and Risk Assessment
17
Risk = Hazard & Exposure x Vulnerability x Amount (Asset)
RiskLt = (0.1 x 1.0) x 0.5 x 100,000 = 5,000 US$ RiskMid = (0.1 x 1.2) x 1.0 x 100,000 = 12,000 US$ RiskRt = (0.1 x 0.8) x 0.2 x 100,000 = 1,600 US$ RiskTotal = 18,600 US$

Probabilistic Risk Assessment
Need at least 6-7 scenarios to develop a risk curve
18 Courtesy: ITC

Historical river discharge record was analyzed to find the frequency-magnitude relationship for flood
0
1000
2000
3000
4000
5000
6000
1.00 10.00 100.00
Disc
harg
e (cu
mec
s)
Return period (years)
Discharge vs Return Period
Modeling
Flood Hazard Assessment in Homalin Area

ALOS/PALSAR Data Acquired During Flood in 2007

Landuse Map and 100 years Flood Map of Homalin City

Field Data Collection for Exposure and Vulnerability Assessment
22

Expected Flood Damage (Risk) Map

Conclusions
• In-country capacities are being built through capacity building initiatives of JAXA and AIT.
• Countries are showing their interests in applications of satellite data.
• Many of these countries are contributing in preparing value-added products for Sentinel Asia.

Thank you for your kind attention