Embed Size (px)
Citation preview

Environmental Assessment Program
Overview of Key Monitoring Activities
Water Quality PartnershipSt. Placid’s Priory, Lacey, WA
November 19, 2009
Overview of Monitoring ◦ Freshwater/ambient◦ Stream gaging◦ Marine ambient◦ Marine sediment◦ BEACH
Outline
◦ Toxics◦ Habitat◦ Groundwater◦ Modeling & TMDLs
Effectiveness Monitoring Summary Future Direction
EAP serves as the monitoring and assessment branch of the agency
Approximately 150 staff with a biennial budget of $30 million◦ Staff located in 4 regional/field offices across the state
Conduct ambient monitoring (marine and freshwater) and directed studies◦ Surface water, groundwater, Puget Sound
Includes the Manchester Environmental Lab, Lab Accreditation Unit and Quality Assurance Program
Overview
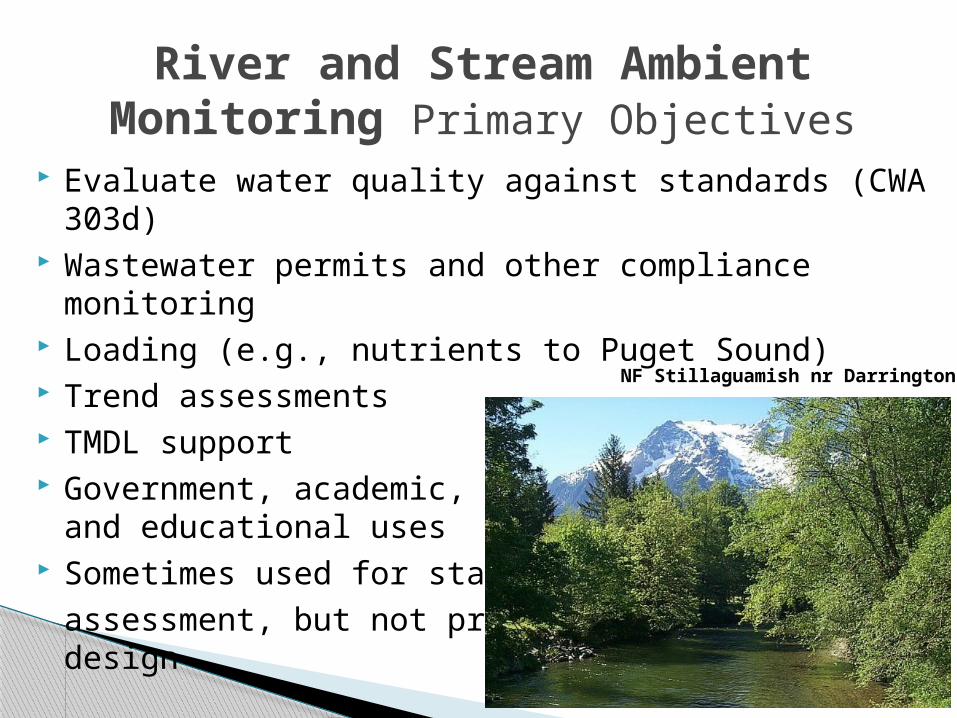
Evaluate water quality against standards (CWA 303d) Wastewater permits and other compliance monitoring Loading (e.g., nutrients to Puget Sound) Trend assessments TMDL support Government, academic,
and educational uses Sometimes used for statewide
assessment, but not probabilisticdesign
River and Stream Ambient Monitoring Primary Objectives
NF Stillaguamish nr Darrington
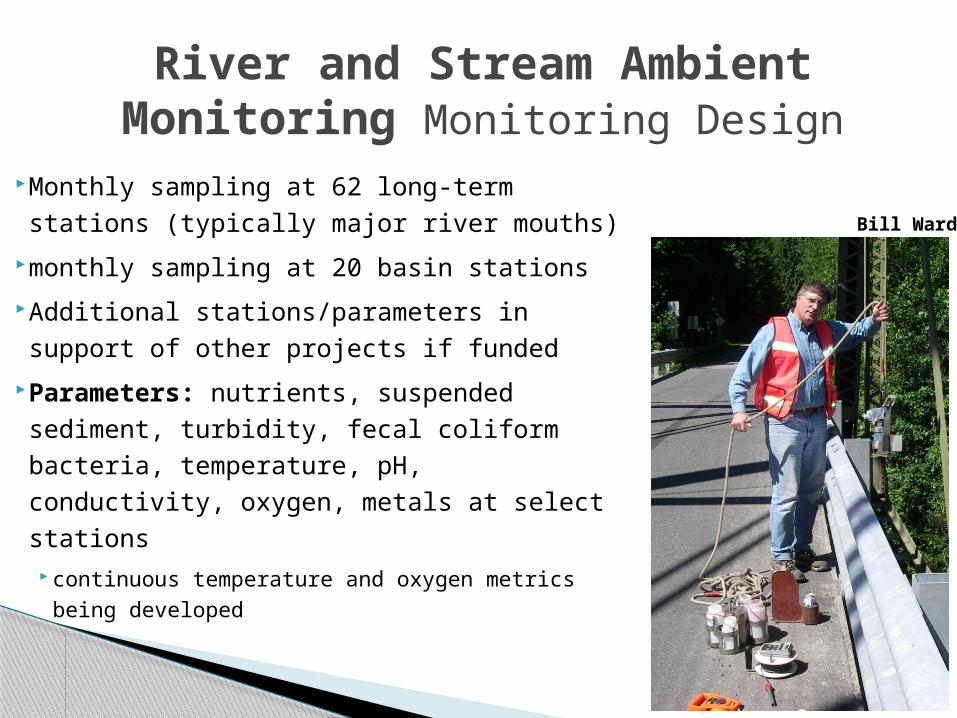
River and Stream Ambient Monitoring Monitoring Design
Bill Ward
Monthly sampling at 62 long-term stations
(typically major river mouths)
monthly sampling at 20 basin stations
Additional stations/parameters in support of
other projects if funded
Parameters: nutrients, suspended sediment,
turbidity, fecal coliform bacteria, temperature,
pH, conductivity, oxygen, metals at select
stations continuous temperature and oxygen metrics being
developed
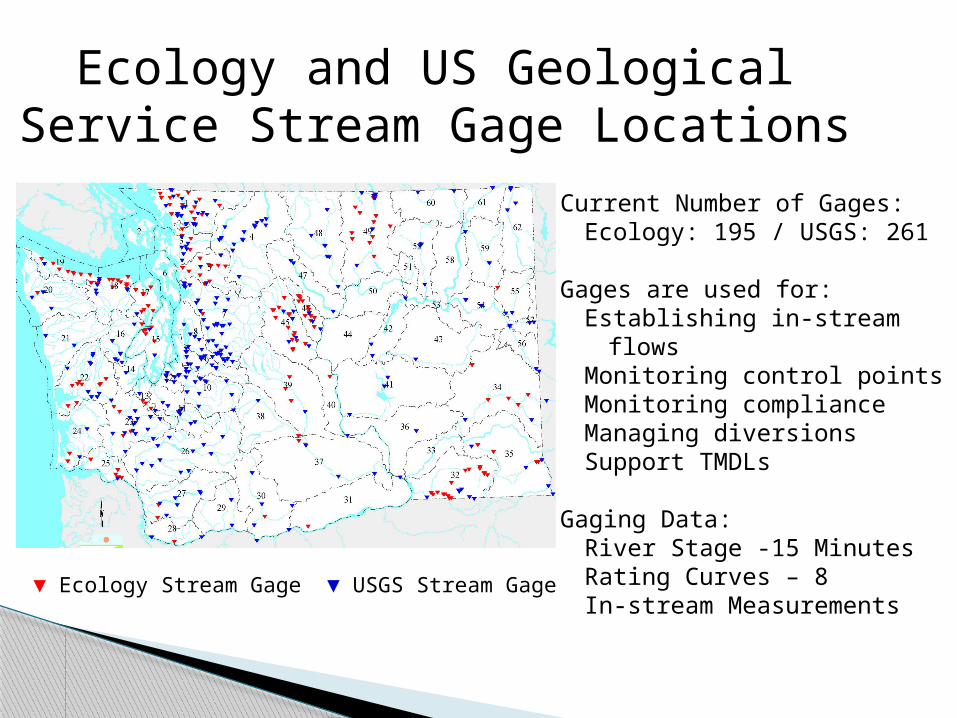
Current Number of Gages:Ecology: 195 / USGS: 261
Gages are used for:Establishing in-stream flows Monitoring control pointsMonitoring complianceManaging diversionsSupport TMDLs
Gaging Data:River Stage -15 MinutesRating Curves – 8In-stream Measurements
Ecology and US Geological Service Stream Gage Locations
▼ Ecology Stream Gage ▼ USGS Stream Gage
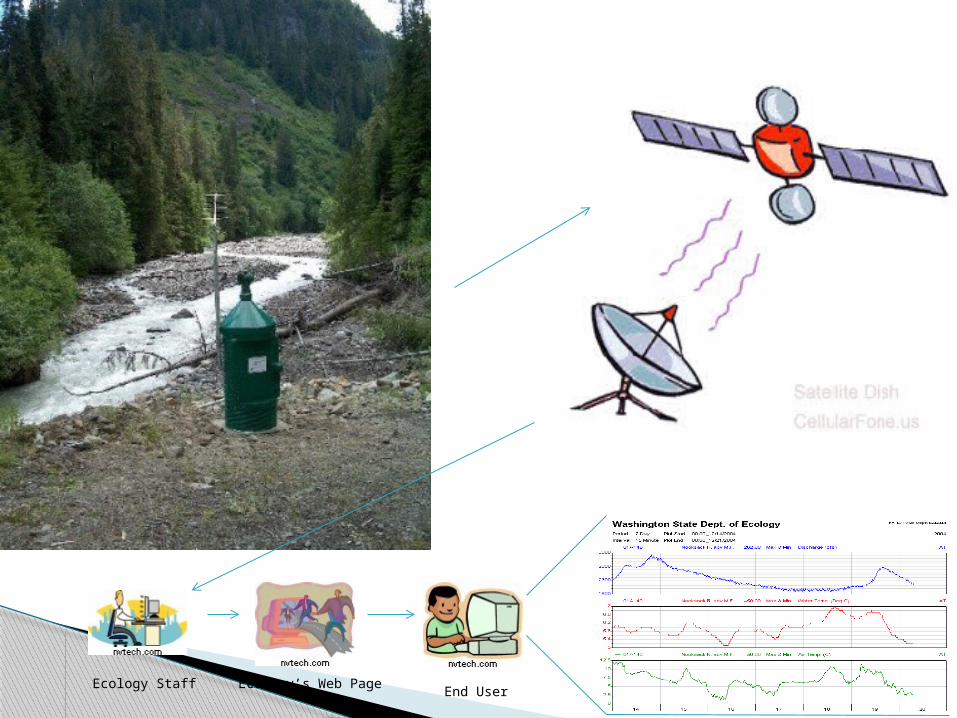
Ecology Staff Ecology’s Web PageEnd User

Ambient Marine Monitoring Program
Continuous water quality measurements using 3-5 moorings (>1998)
Focused studies with high spatial resolution E.g. South Sound
35 years of monthly sound-wide and coastal water quality samples (>1973)
21 Long-term stations 45 Rotational stations
Continuous & discrete water samples
Variables: Temperature , Salinity, Density, in situ Fluorescence, Transmissivity, pH, Oxygen, Nutrients, Chlorophyll a, Secchi, Fecal bacteria
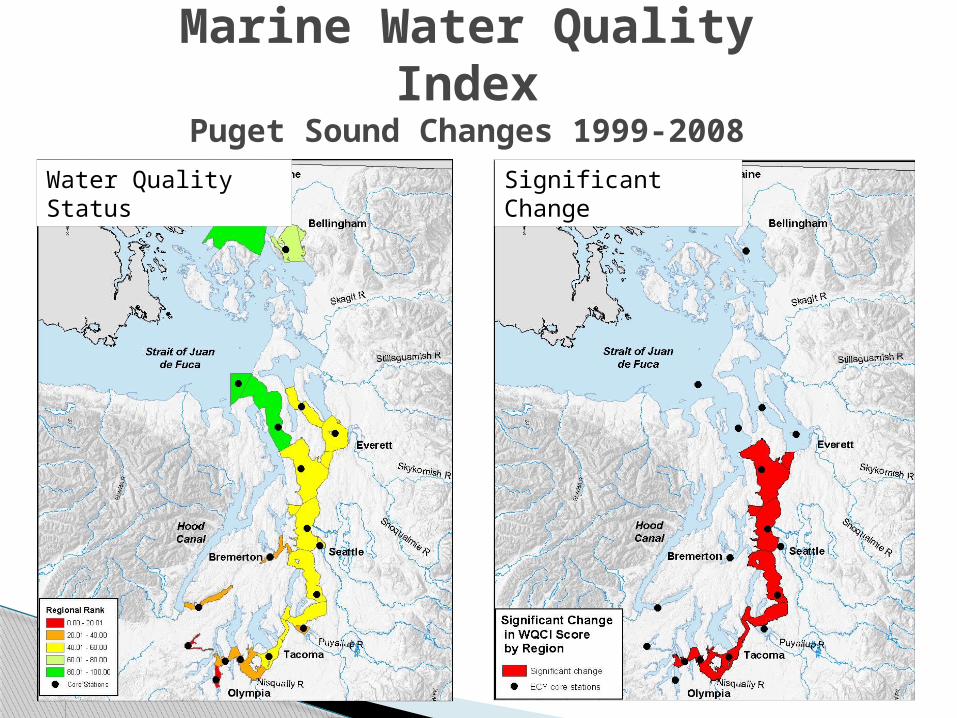
Marine Water Quality Index
Puget Sound Changes 1999-2008Water Quality Status
Significant Change
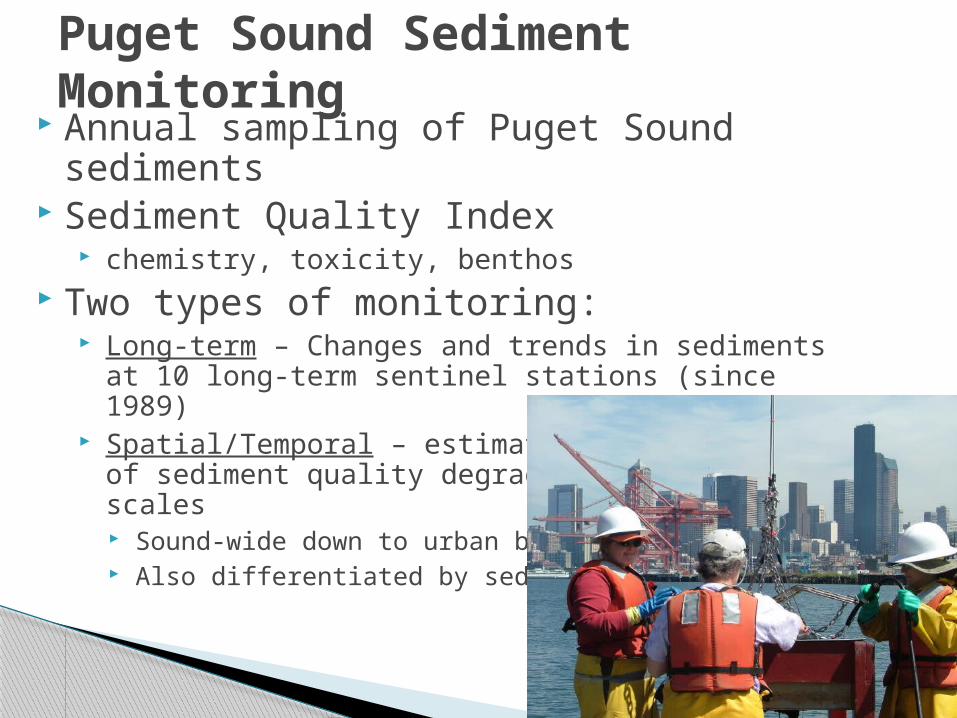
Annual sampling of Puget Sound sediments Sediment Quality Index
chemistry, toxicity, benthos Two types of monitoring:
Long-term – Changes and trends in sediments at 10 long-term sentinel stations (since 1989)
Spatial/Temporal – estimate of spatial extent of sediment quality degradation at nested scales Sound-wide down to urban bays Also differentiated by sediment type
Puget Sound Sediment Monitoring
1990 1995 2000 2005
Dis
ea
se P
reva
len
ce (
%)
0.0
10.0
20.0
30.0
40.0
PA
H M
eta
bol
ites
in B
ile
0
1000
2000
3000
4000
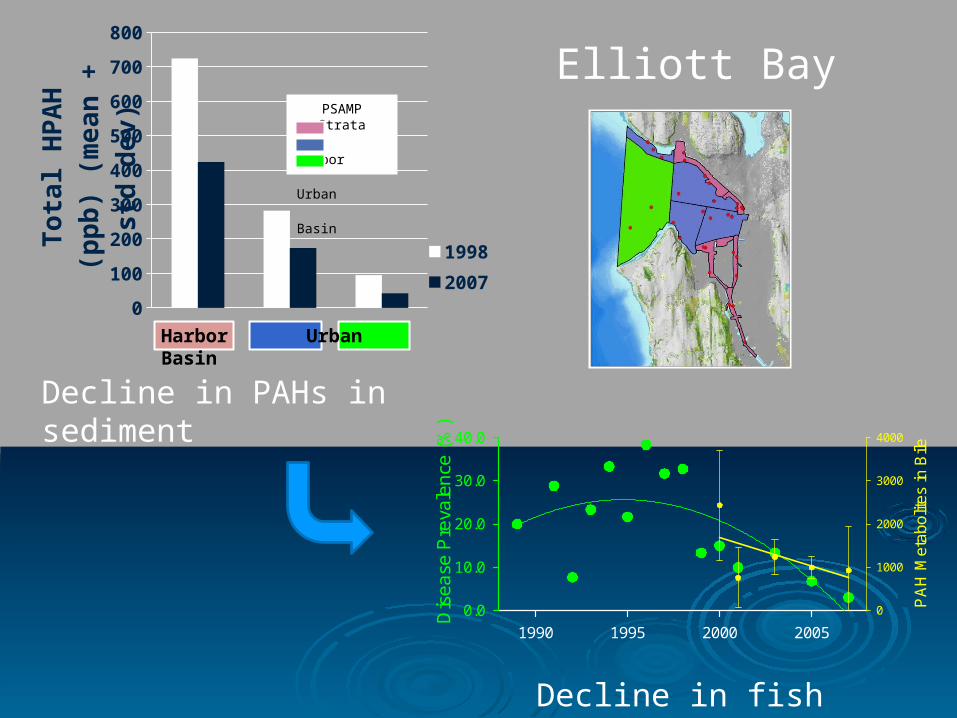
Elliott Bay
0
100
200
300
400
500
600
700
800
1998
2007To
tal
HP
AH
(p
pb
) (m
ea
n +
std
de
v)
Decline in PAHs in sediment
Decline in fish tumors
Harbor Urban Basin
PSAMP Strata
Harbor
Urban
Basin
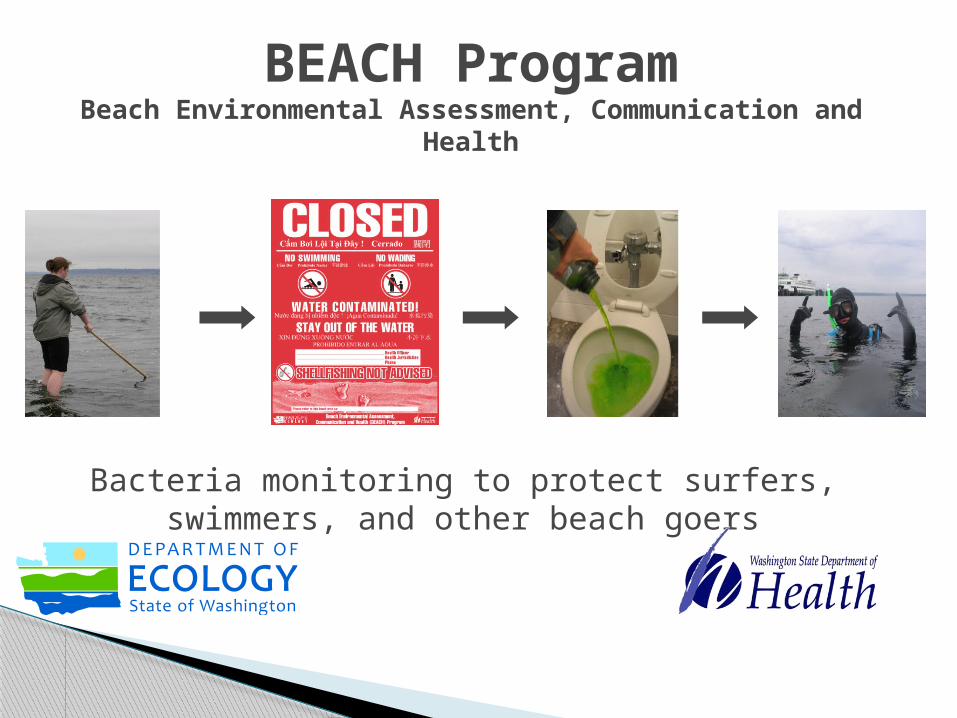
BEACH ProgramBeach Environmental Assessment, Communication and
Health
Bacteria monitoring to protect surfers, swimmers, and other beach goers
MONITOR NOTIFY REMEDIATE OPEN
02 3
6 65
21
39
0
11
4 41
6 6
0
5
10
15
20
25
30
35
40
45
2004 2005 2006 2007 2008
0
10
20
30
40
50
60
70
80
1 2 3 4 5 6 7 8 9 10
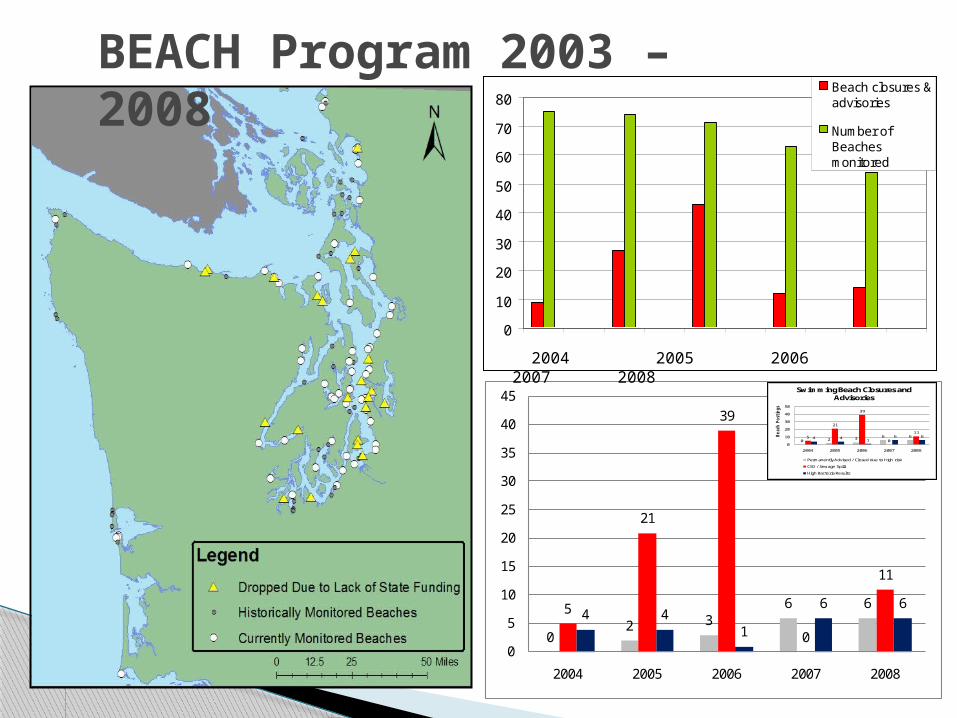
Beach closures &advisories
Number ofBeachesmonitored
2004 2005 2006 2007 2008
BEACH Program 2003 – 2008
0 2 36 65
21
39
0
114 4
16 6
0
10
20
30
40
50
2004 2005 2006 2007 2008
Be
ach
Po
stin
gs
Swimming Beach Closures and Advisories
Permanently Advised / Closed due to high risk
CSO / Sewage Spill
High Bacteria Results
Washington State Toxics/PBT Monitoring Program◦ Exploratory (15-20 sites annually)◦ PBT Trends (12 freshwater sites/2x per year)◦ Mercury Trends (6 sites/yr)◦ Contaminant Trends in Sediment Cores (3 lakes/yr)
Surface Water Monitoring for Pesticides in Salmon Bearing Streams ◦ 5 Watersheds (2 Puget Sound and 3 Eastern WA)◦ Weekly sampling from April-September◦ Interagency Agreement with WSDA
Long-term Toxics Monitoring Programs
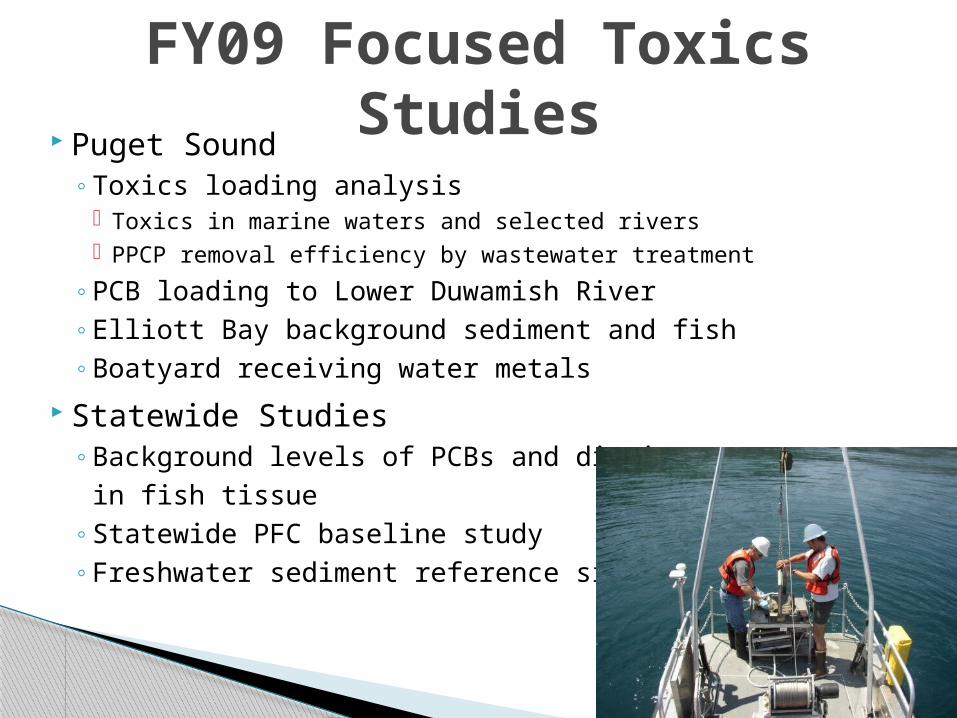
Puget Sound◦ Toxics loading analysis
Toxics in marine waters and selected rivers PPCP removal efficiency by wastewater treatment
◦ PCB loading to Lower Duwamish River◦ Elliott Bay background sediment and fish◦ Boatyard receiving water metals
Statewide Studies◦ Background levels of PCBs and dioxins
in fish tissue◦ Statewide PFC baseline study◦ Freshwater sediment reference sites
FY09 Focused Toxics Studies

Total Maximum Daily Load Studies for Toxics◦ Yakima River toxics (DDT and PCB)◦ Des Moines Creek zinc◦ West Medical Lake (PCBs and Dioxins)
Other◦ Lake Washington sediment PCBs◦ Synthetic pyrethroids in
stormwater sediments
FY09 Focused Toxics Studies
Intensively Monitored Watersheds◦ Does habitat restoration increase salmon production◦ Federal and state money thru Salmon Recovery Funding
Board
Cooperative Monitoring Evaluation and Research ◦ Committee established by the Forest Practices Board ◦ Type N studies
Effectiveness of riparian buffers on non-fish bearing streams (e.g., temperature)
◦ Extensive Riparian Status and Trends Evaluate temperature using probability based sampling frame (including
some limited habitat measures)
Habitat Monitoring
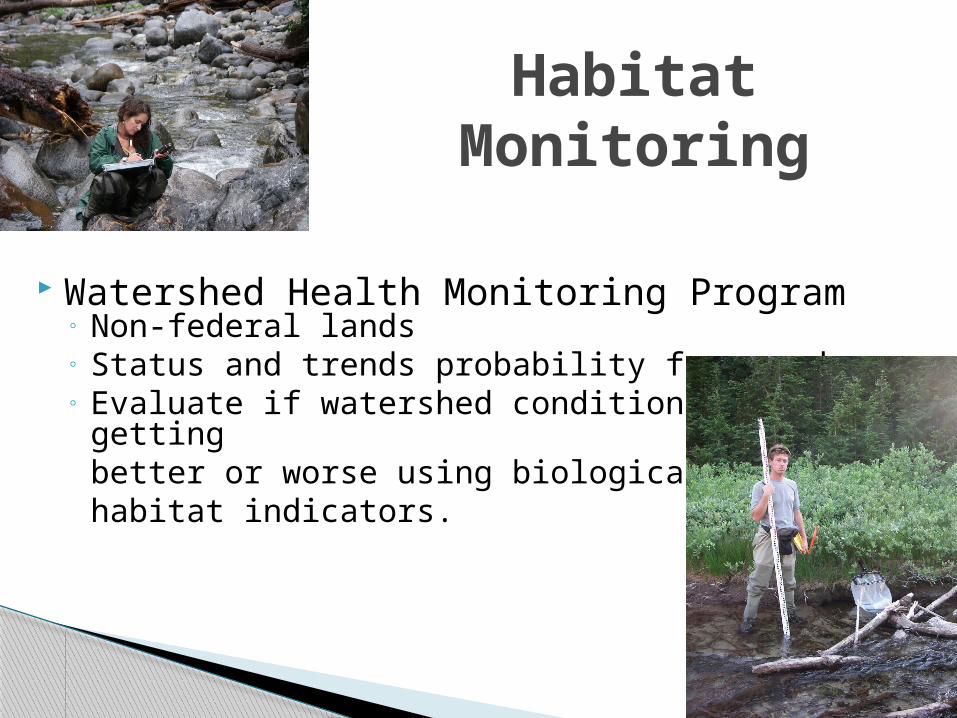
Watershed Health Monitoring Program ◦ Non-federal lands ◦ Status and trends probability framework◦ Evaluate if watershed conditions are getting
better or worse using biological and habitat indicators.
Habitat Monitoring
Regional water-level monitoring for water rights decision-making
Long-term water quality monitoring at hazardous waste cleanup sites
Support for water quality improvement plans (TMDLs)
Site-specific studies◦ Sumas-Blaine Nitrate◦ Whatcom County soil fumigants
Groundwater MonitoringCurrent Monitoring and Assessment
Groundwater MonitoringNext Steps
Inventory and capture existing data Migrate to new database Evaluate assembled monitoring data Continue and expand regional water-level monitoring Establish a state groundwater status and trends
monitoring program
Maximum amount of a pollutant that can be discharged without violating water quality standards
For 303(d) listed water bodies◦ Temp, fecal, toxics, pH, DO nutrients
Intensive data collection and modeling effort◦ Waste load allocations and load allocations
Water Quality Improvement Plan (also called a TMDL) ◦ Lays out how to reduce pollutant sources in order to meet
water quality standards
TMDL Studies Total Maximum Daily Load
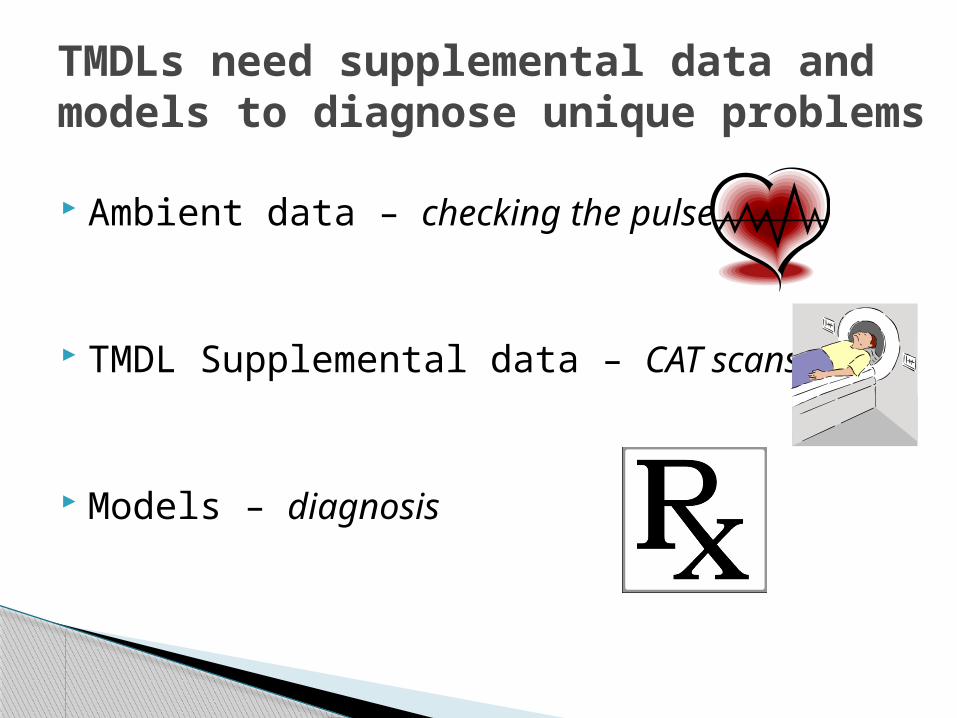
Ambient data – checking the pulse
TMDL Supplemental data – CAT scans
Models – diagnosis
TMDLs need supplemental data and models to diagnose unique problems
Sampling alone can’t get us the answers Water quality models allow us to predict how
pollutants move through a water body Even better, they show how water quality would
improve if we turn off a pollutant source Multiple models used for different purposes
◦ Nutrients - predict what the nutrient level might do to dissolved oxygen in the water.
◦ Toxics - predict how the chemical would move between the water, sediment and biota.
Models

Statewide monitoring responsibility Current staff – 5 FTEs statewide
◦ 3 FTEs lost due to budget reductions EM staff work on focused projects
◦ Skokomish River bacteria◦ Yakima River turbidity, toxics
Washington State is ahead of other states in EM program development
TMDL Effectiveness Monitoring Program
Different Types of Monitoring used for Effectiveness Evaluation (cont’d)
Characterization Monitoring – identify and determine the impacts of suspected or unknown pollution sources
Compliance Monitoring – assess compliance with a set target limit
Effectiveness Monitoring – determine whether management activities achieved the desired goal or effect
Status & Trends Monitoring – assess overall status and track change over time
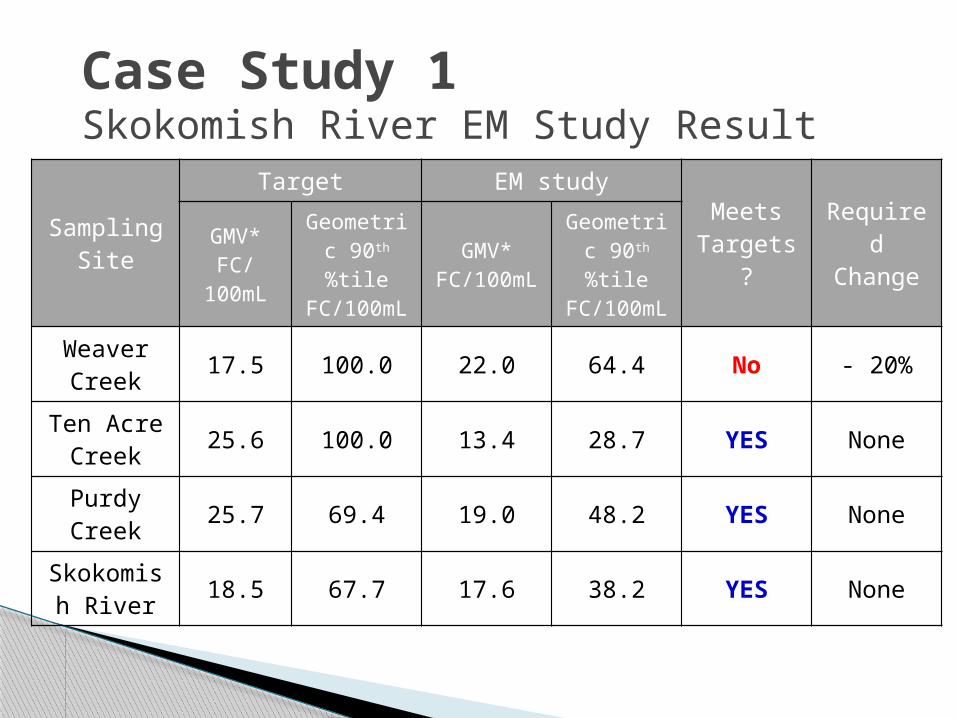
Case Study 1 Skokomish River EM Study Result
Sampling Site
Target EM study
Meets Targets?
Required Change
GMV*FC/
100mL
Geometric 90th %tile
FC/100mL
GMV*FC/100mL
Geometric 90th %tile
FC/100mL
Weaver Creek 17.5 100.0 22.0 64.4 No - 20%
Ten Acre Creek 25.6 100.0 13.4 28.7 YES None
Purdy Creek 25.7 69.4 19.0 48.2 YES None
Skokomish River 18.5 67.7 17.6 38.2 YES None
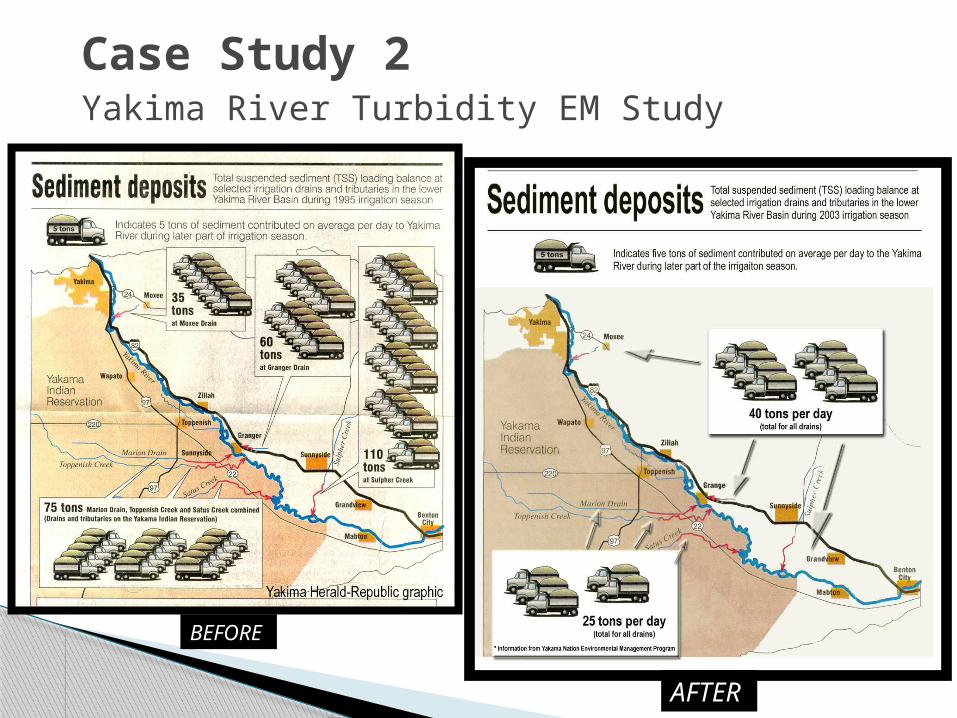
Case Study 2 Yakima River Turbidity EM Study
BEFORE
AFTER
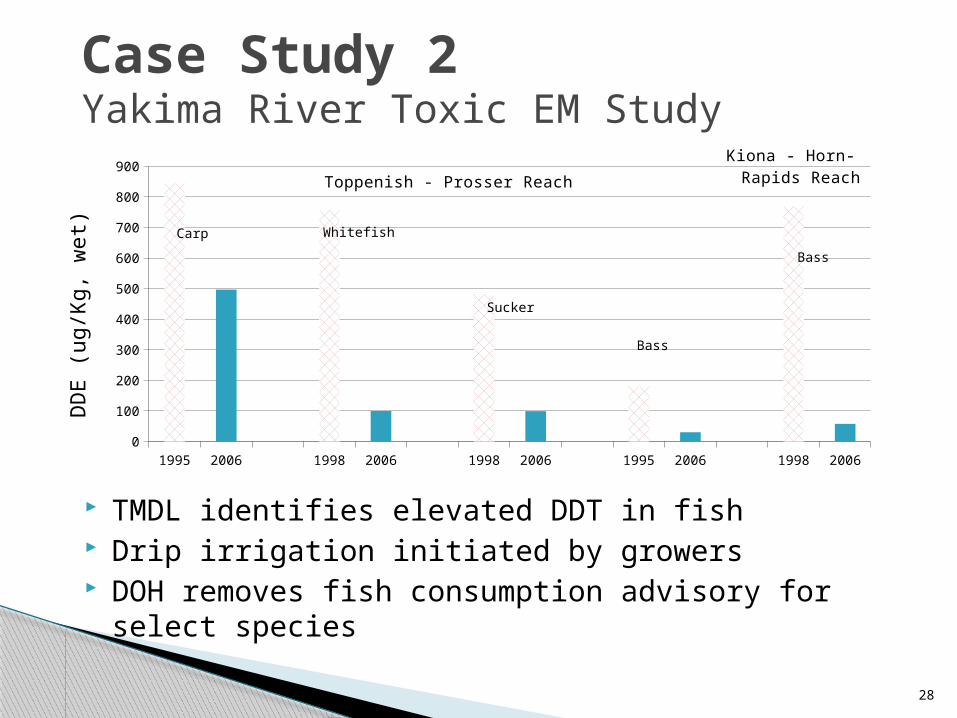
1995 2006 1998 2006 1998 2006 1995 2006 1998 20060
100
200
300
400
500
600
700
800
900
DD
E (
ug
/Kg
, w
et)
Toppenish - Prosser Reach
Kiona - Horn- Rapids Reach
Carp Whitefish
Sucker
Bass
Bass
28
TMDL identifies elevated DDT in fish Drip irrigation initiated by growers DOH removes fish consumption advisory for select
species
Case Study 2 Yakima River Toxic EM Study
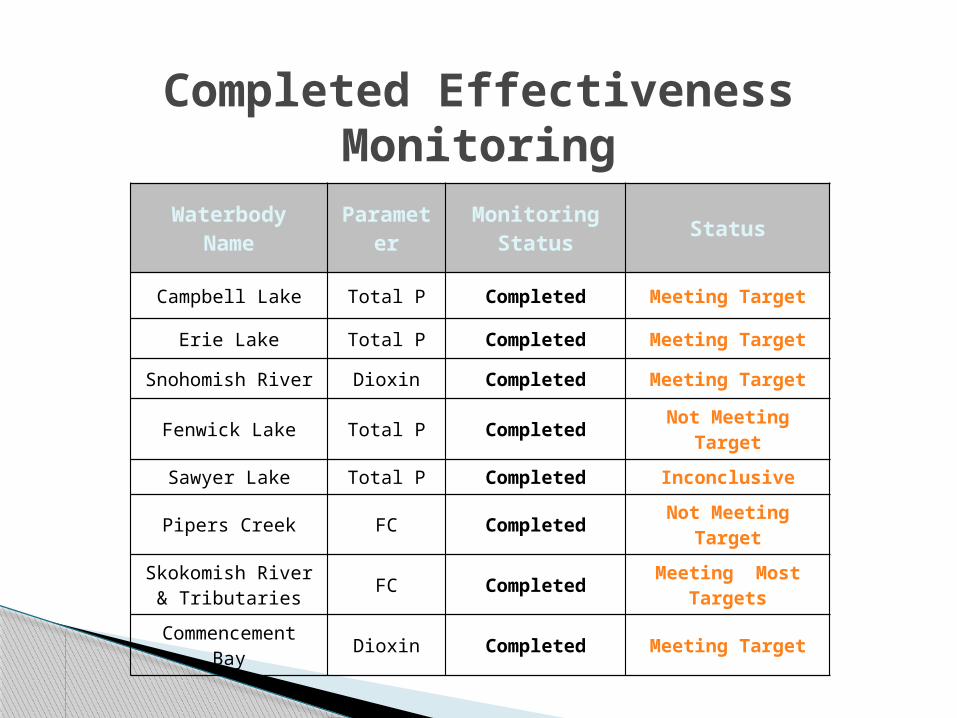
Completed Effectiveness Monitoring
Waterbody Name ParameterMonitoring
StatusStatus
Campbell Lake Total P Completed Meeting Target
Erie Lake Total P Completed Meeting Target
Snohomish River Dioxin Completed Meeting Target
Fenwick Lake Total P Completed Not Meeting Target
Sawyer Lake Total P Completed Inconclusive
Pipers Creek FC Completed Not Meeting Target
Skokomish River & Tributaries FC Completed Meeting Most Targets
Commencement Bay Dioxin Completed Meeting Target
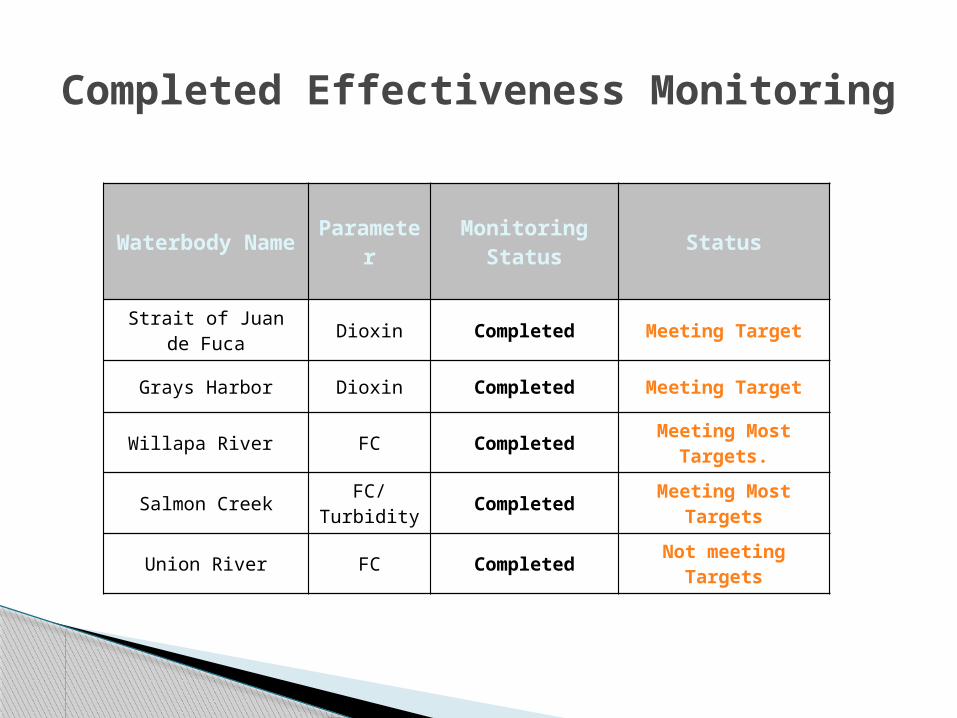
Completed Effectiveness Monitoring
Waterbody Name Parameter Monitoring Status Status
Strait of Juan de Fuca Dioxin Completed Meeting Target
Grays Harbor Dioxin Completed Meeting Target
Willapa River FC Completed Meeting Most Targets.
Salmon Creek FC/Turbidity Completed Meeting Most Targets
Union River FC Completed Not meeting Targets
Cadmus Group Report Findings
Increase funding for TMDL effectiveness monitoring
Need up to 7 FTEs and $150,000 in lab funding for TMDL EM
Use biological assessment approaches
Versatility of EAP monitoring◦ Both freshwater and marine◦ Nutrients, toxics, habitat◦ Long and short-term
Status and trends, effectiveness Quality of data
◦ Regulatory decision making Modeling capacity Data availability
◦ Databases, reports, focus sheets, press releases◦ Continuous data – gaging, water qulaity –marine and freshwater,
groundwater◦ Indices
Summary