Embed Size (px)
Citation preview

FALIA Invitational Seminar in Japan
“Risk Management Course”
Overview of Life Ins. Industryin Japan
November 9th, 2016Genjiro Saito
Chief, International AffairsThe Life Insurance Association of Japan

Contents
I Basic Information of Japan
II Japan’s Position in the World Life Insurance Market
III Overview of Life Insurance Business in Japan
IV Brief History of Japanese Life Insurance Industry
V Addressing the issues
VI The Life Insurance Association of Japan
2
I Basic Information of Japan
I Basic Information of Japan
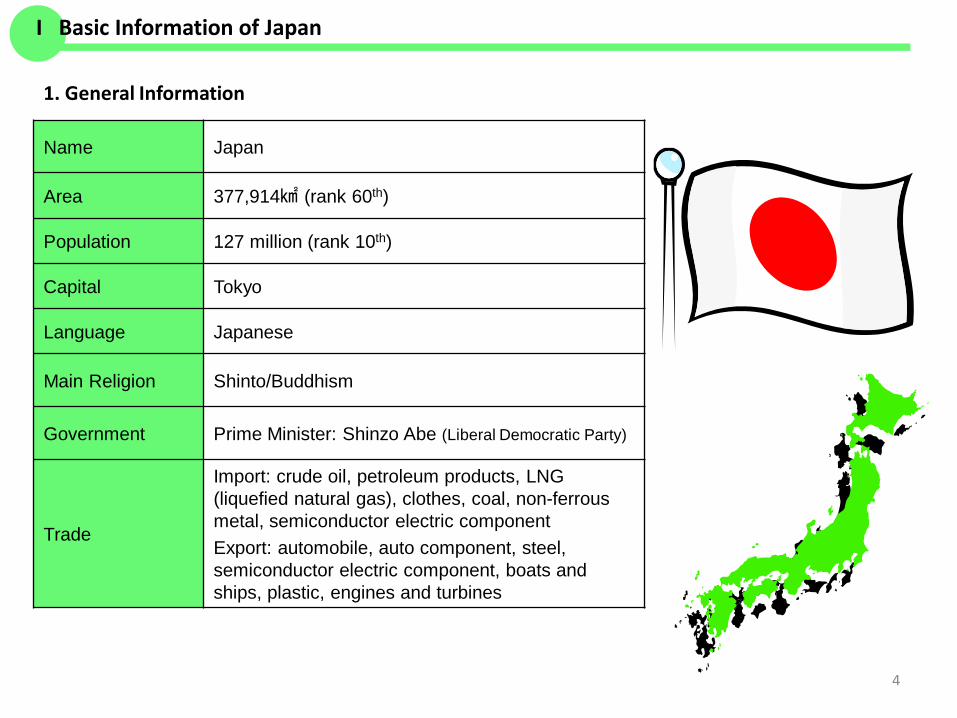
1. General Information
4
Name Japan
Area 377,914㎢ (rank 60th)
Population 127 million (rank 10th)
Capital Tokyo
Language Japanese
Main Religion Shinto/Buddhism
Government Prime Minister: Shinzo Abe (Liberal Democratic Party)
Trade
Import: crude oil, petroleum products, LNG (liquefied natural gas), clothes, coal, non-ferrous metal, semiconductor electric componentExport: automobile, auto component, steel, semiconductor electric component, boats and ships, plastic, engines and turbines
0
100
200
300
400
500
600
1980
1982
1984
1986
1988
1990
1992
1994
1996
1998
2000
2002
2004
2006
2008
2010
2012
2014
I Basic Information of Japan
5
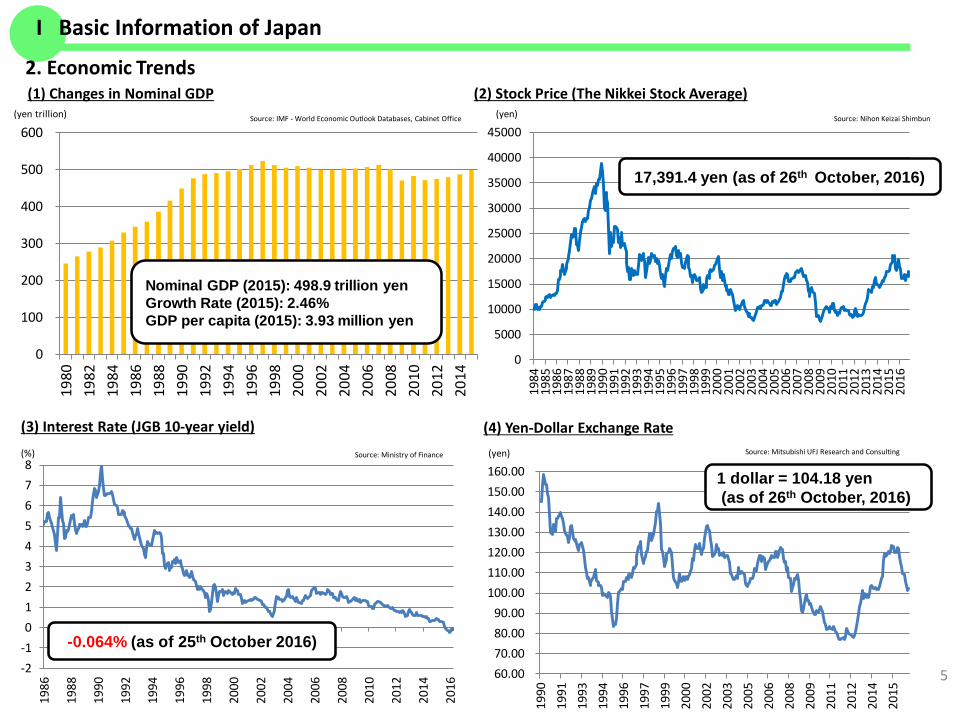
2. Economic Trends
(yen trillion)
(1) Changes in Nominal GDP (2) Stock Price (The Nikkei Stock Average)(yen)Source: IMF - World Economic Outlook Databases, Cabinet Office Source: Nihon Keizai Shimbun
(3) Interest Rate (JGB 10-year yield)
Source: Ministry of Finance(%)
(4) Yen-Dollar Exchange Rate(yen) Source: Mitsubishi UFJ Research and Consulting
Nominal GDP (2015): 498.9 trillion yenGrowth Rate (2015): 2.46%GDP per capita (2015): 3.93 million yen
0
5000
10000
15000
20000
25000
30000
35000
40000
45000
1984
1985
1986
1987
1988
1989
1990
1991
1992
1993
1994
1995
1996
1997
1998
1999
2000
2001
2002
2003
2004
2005
2006
2007
2008
2009
2010
2011
2012
2013
2014
2015
2016
17,391.4 yen (as of 26th October, 2016)
-2-1012345678
1986
1988
1990
1992
1994
1996
1998
2000
2002
2004
2006
2008
2010
2012
2014
2016
-0.064% (as of 25th October 2016)
60.0070.0080.0090.00
100.00110.00120.00130.00140.00150.00160.00
1990
1991
1993
1994
1996
1997
1999
2000
2002
2003
2005
2006
2008
2009
2011
2012
2014
2015
1 dollar = 104.18 yen(as of 26th October, 2016)
1.0
1.5
2.0
2.5
3.0
3.5
4.0
0.00% 5.00% 10.00% 15.00% 20.00% 25.00% 30.00%
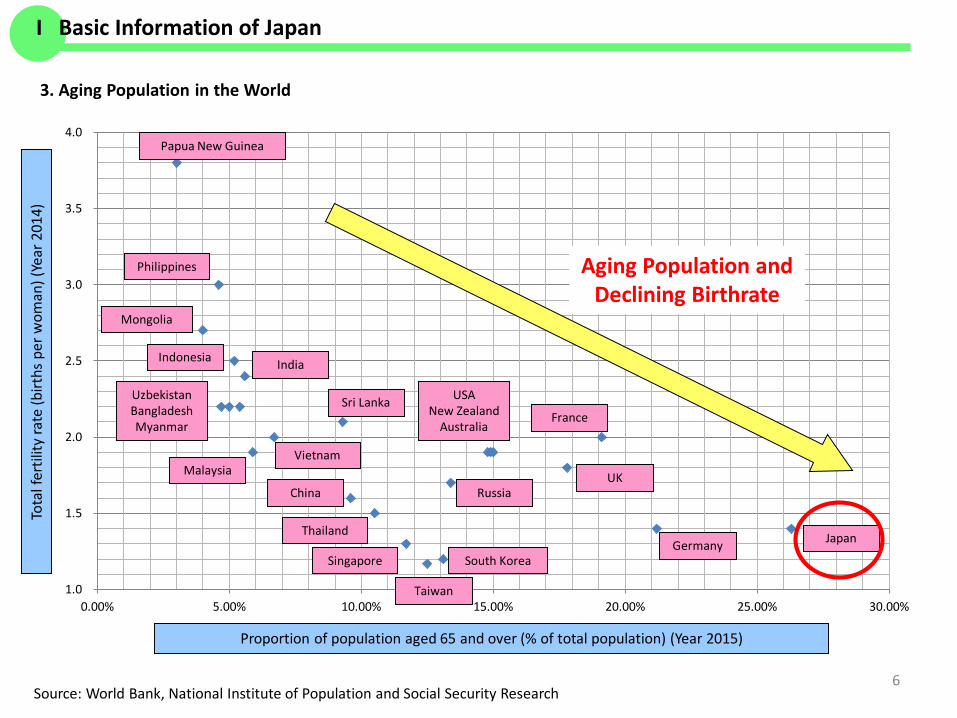
3. Aging Population in the World
Proportion of population aged 65 and over (% of total population) (Year 2015)
Tota
l fer
tility
rate
(birt
hs p
er w
oman
) (Ye
ar 2
014)
Germany
France
Japan
UK
USANew Zealand
Australia
UzbekistanBangladeshMyanmar
China
South Korea
Taiwan
India
Malaysia
Indonesia
Philippines
Singapore
Thailand
Vietnam
Aging Population and Declining Birthrate
Mongolia
Papua New Guinea
Source: World Bank, National Institute of Population and Social Security Research 6
I Basic Information of Japan
Sri Lanka
Russia
7
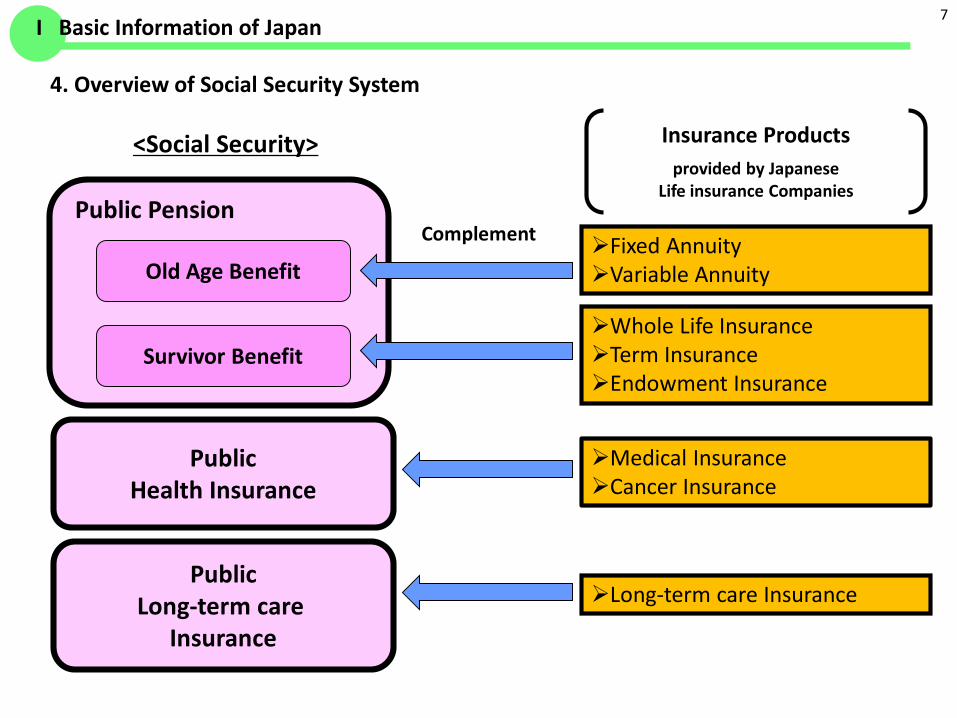
4. Overview of Social Security System
Public Pension
Old Age Benefit
Survivor Benefit
Public Health Insurance
Public Long-term care
Insurance
<Social Security>
Fixed AnnuityVariable Annuity
Whole Life InsuranceTerm InsuranceEndowment Insurance
Medical InsuranceCancer Insurance
Long-term care Insurance
Complement
Insurance Productsprovided by Japanese
Life insurance Companies
I Basic Information of Japan

Old Age Benefit Survivor Benefit
Cost National Government Subsidies Premium
• self-employed ・・・ ¥16,260/M• employee ・・・ 18.182% of salary
Public Pension can use fund (¥135 trillion) to ensure paying benefit sustainably.
Benefit Starting age
• 65 years old Some older people can receive it from 60 years old.
Amount• self-employed ・・・ ¥780,100/Y• employee ・・・ income-related amount/Y
Amount is adjusted not only for price fluctuation but also for a decrease in population.
Eligibility to receive pension benefit• premium payment for 25 years(to be10 years after Oct 2017)
CostPaid as Public Pension (Old Age Benefit)
Benefit Survivors’ Employees’ Pension
• Eligibility ・・・ Employee• Amount ・・・ 3/4 of Old Age Benefit(Pension)
Widow’s Pension• Eligibility ・・・ Self-employed
Age of widow in age 60-65• Amount ・・・ 3/4 of Old Age Benefit(Pension)
Survivors’ Basic Pension• Eligibility ・・・ Employee and Self-employed
Survivors have children• Amount ・・・ ¥780,100/Y
+ ¥224,500/Y per childLump-sum payment・ Eligibility ・・・ Not falling under abovementioned categories・ Amount ・・・ ¥120,000~320,000 proportional to the payment period
Basic Pension
(Self-employed)
Employees’ Pension Insurance
(Employee)
8
(a) Public Pension
( Self-employed ) ( Employee )
65Widow’s Pension
ORSurvivors’ Employees’
Pension
Survivors’Basic
Pension
+
Widow’s Age
60
If a survivor has a child
I Basic Information of Japan
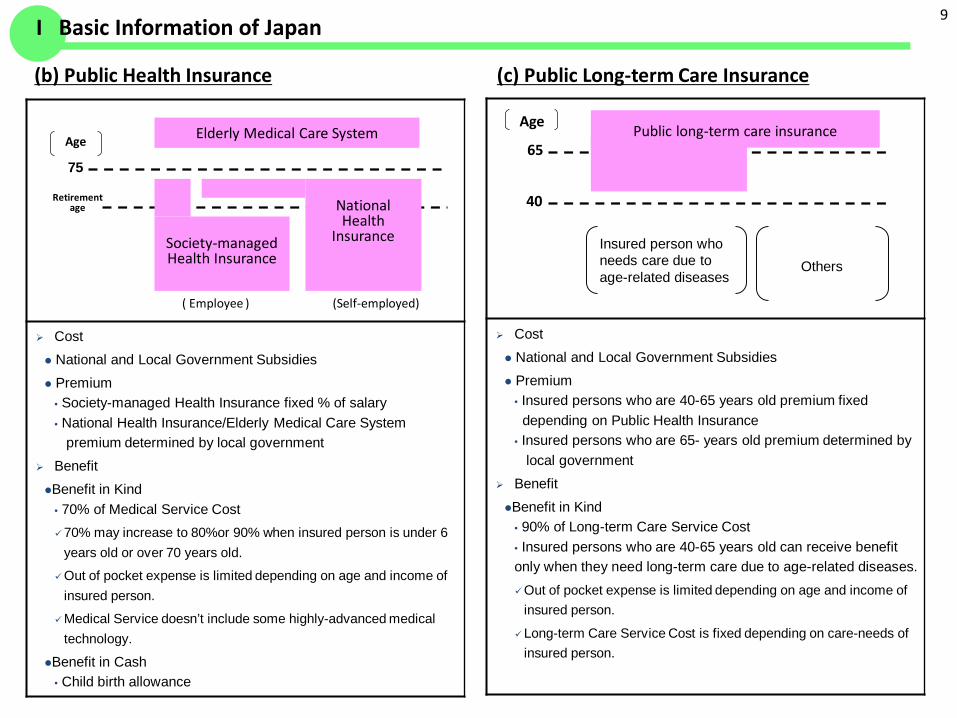
Cost National and Local Government Subsidies Premium
• Society-managed Health Insurance fixed % of salary• National Health Insurance/Elderly Medical Care System
premium determined by local government BenefitBenefit in Kind
• 70% of Medical Service Cost70% may increase to 80%or 90% when insured person is under 6
years old or over 70 years old.
Out of pocket expense is limited depending on age and income of insured person.
Medical Service doesn’t include some highly-advanced medical technology.
Benefit in Cash• Child birth allowance
9
(b) Public Health Insurance
(Self-employed) ( Employee )
75
Age Elderly Medical Care System
Retirement age
Society-managed Health Insurance
National Health
Insurance
Cost National and Local Government Subsidies Premium
• Insured persons who are 40-65 years old premium fixed depending on Public Health Insurance
• Insured persons who are 65- years old premium determined by local government
BenefitBenefit in Kind
• 90% of Long-term Care Service Cost• Insured persons who are 40-65 years old can receive benefit only when they need long-term care due to age-related diseases.Out of pocket expense is limited depending on age and income of
insured person.
Long-term Care Service Cost is fixed depending on care-needs of insured person.
65
Age
40
Public long-term care insurance
Insured person who needs care due to age-related diseases
Others
(c) Public Long-term Care Insurance
I Basic Information of Japan
II Japan’s Position in the World Life Insurance Market
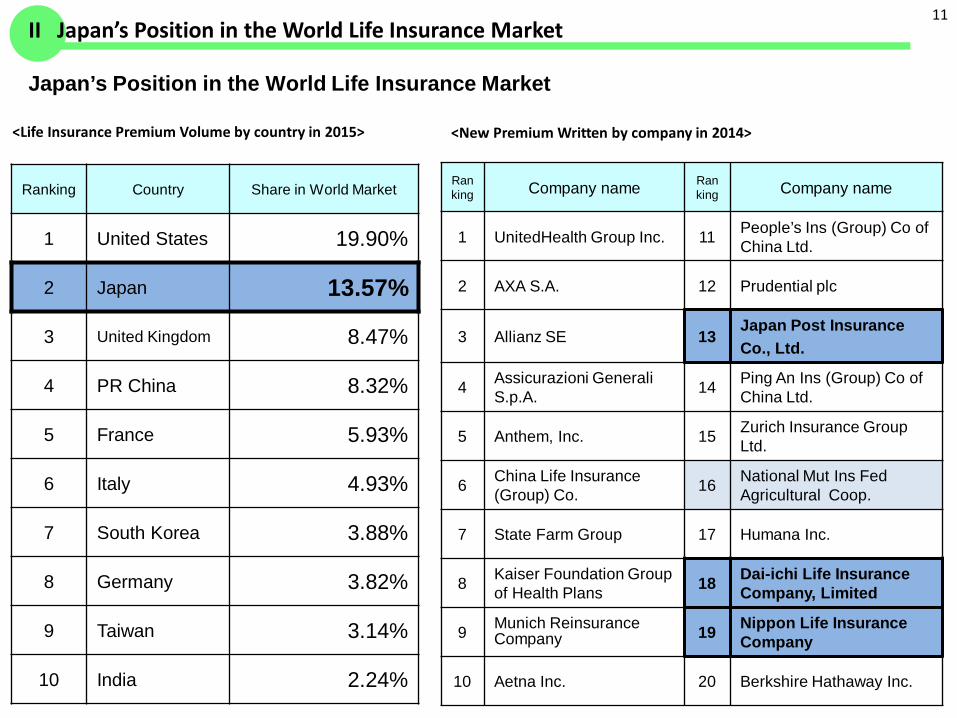
Japan’s Position in the World Life Insurance Market
<Life Insurance Premium Volume by country in 2015>
11
Ranking Country Share in World Market
1 United States 19.90%
2 Japan 13.57%
3 United Kingdom 8.47%
4 PR China 8.32%
5 France 5.93%
6 Italy 4.93%
7 South Korea 3.88%
8 Germany 3.82%
9 Taiwan 3.14%
10 India 2.24%
Ranking Company name Ran
king Company name
1 UnitedHealth Group Inc. 11 People’s Ins (Group) Co of China Ltd.
2 AXA S.A. 12 Prudential plc
3 Allianz SE 13Japan Post Insurance Co., Ltd.
4 Assicurazioni GeneraliS.p.A. 14 Ping An Ins (Group) Co of
China Ltd.
5 Anthem, Inc. 15 Zurich Insurance Group Ltd.
6 China Life Insurance (Group) Co. 16 National Mut Ins Fed
Agricultural Coop.
7 State Farm Group 17 Humana Inc.
8 Kaiser Foundation Group of Health Plans 18 Dai-ichi Life Insurance
Company, Limited
9 Munich Reinsurance Company 19 Nippon Life Insurance
Company
10 Aetna Inc. 20 Berkshire Hathaway Inc.
<New Premium Written by company in 2014>
II Japan’s Position in the World Life Insurance Market
III Overview ofLife Insurance Business in Japan

71
88 89.4 88.5 89.6 90.592.3 91.3 91.6
93.7 9593 91.8
89.687.5 86 85.8
40
50
60
70
80
90
100
1965 1968 1970 1973 1976 1979 1982 1985 1988 1991 1994 1997 2000 2003 2006 2009 201213
(1) Changes in Life Insurance Ownership Rate per Households (including Annuity)
Source: Japan Institute of Life Insurance: Consumer SurveyNote: The data includes the total of private life insurance (including Japan Post Insurance), postal insurance and JA cooperative
(%)
III Overview of Life Insurance Business in Japan
14
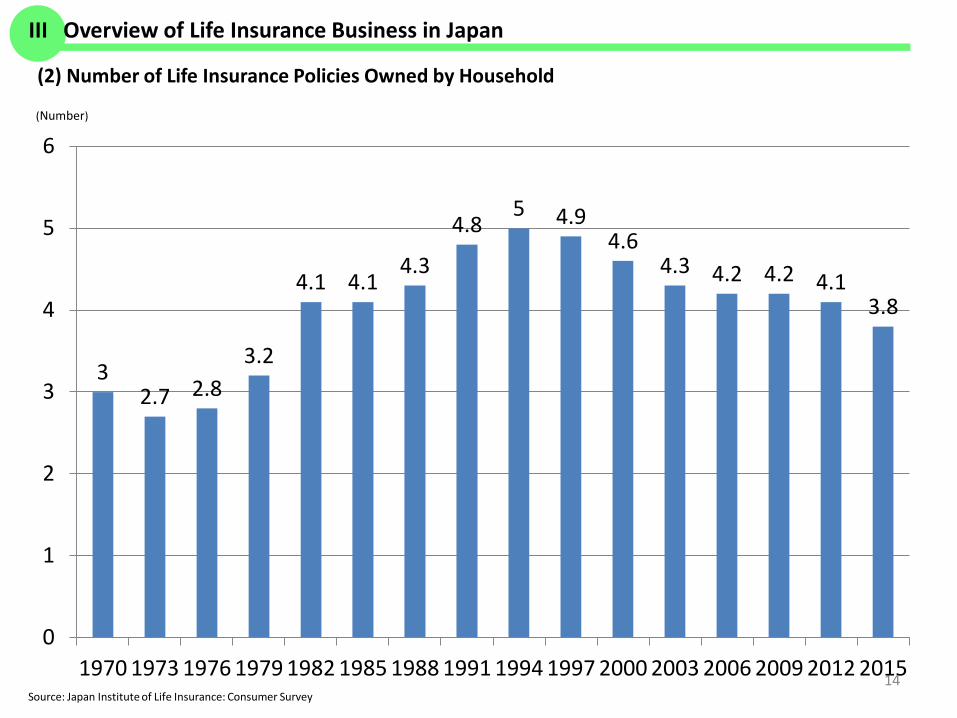
(2) Number of Life Insurance Policies Owned by Household
Source: Japan Institute of Life Insurance: Consumer Survey
(Number)
32.7 2.8
3.2
4.1 4.14.3
4.85 4.9
4.64.3 4.2 4.2 4.1
3.8
0
1
2
3
4
5
6
1970 1973 1976 1979 1982 1985 1988 1991 1994 1997 2000 2003 2006 2009 2012 2015
III Overview of Life Insurance Business in Japan
15
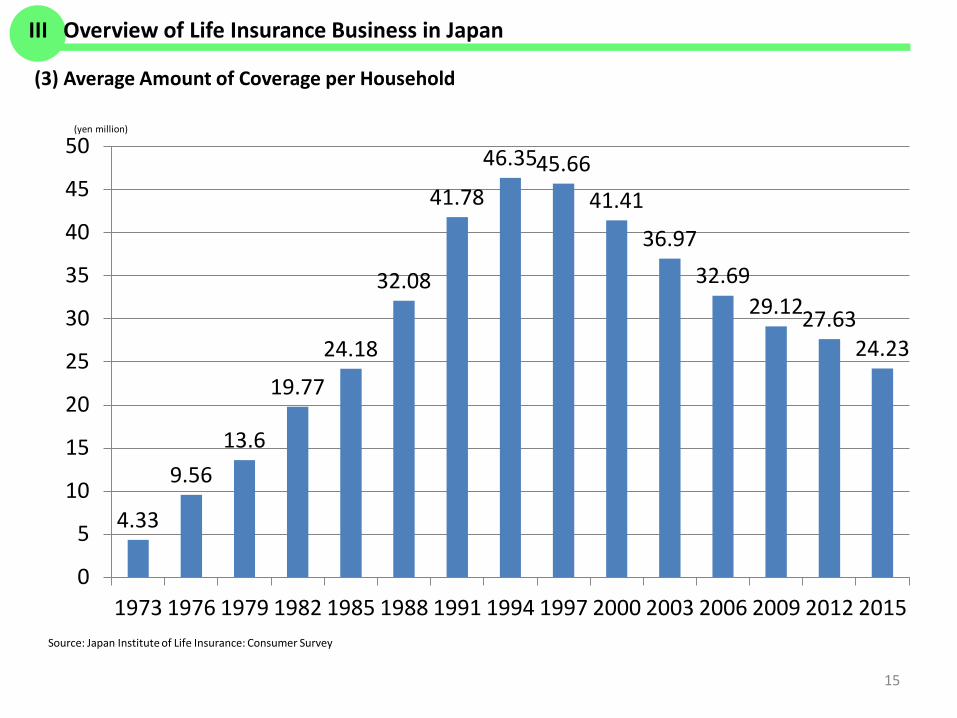
(3) Average Amount of Coverage per Household
Source: Japan Institute of Life Insurance: Consumer Survey
(yen million)
4.33
9.5613.6
19.77
24.18
32.08
41.78
46.3545.6641.41
36.9732.69
29.1227.6324.23
0
5
10
15
20
25
30
35
40
45
50
1973 1976 1979 1982 1985 1988 1991 1994 1997 2000 2003 2006 2009 2012 2015
III Overview of Life Insurance Business in Japan
252
331
400
478
574
638 676 610
531 526
455 418
385
6.9%7.4%
8.4%8.9%
9.4% 9.6%10.1% 10.0%
9.2% 9.2%8.8%
8.0%
7.4%
0
100
200
300
400
500
600
700
800
0.0%
2.0%
4.0%
6.0%
8.0%
10.0%
12.0%
1979 1982 1985 1988 1991 1994 1997 2000 2003 2006 2009 2012 201516
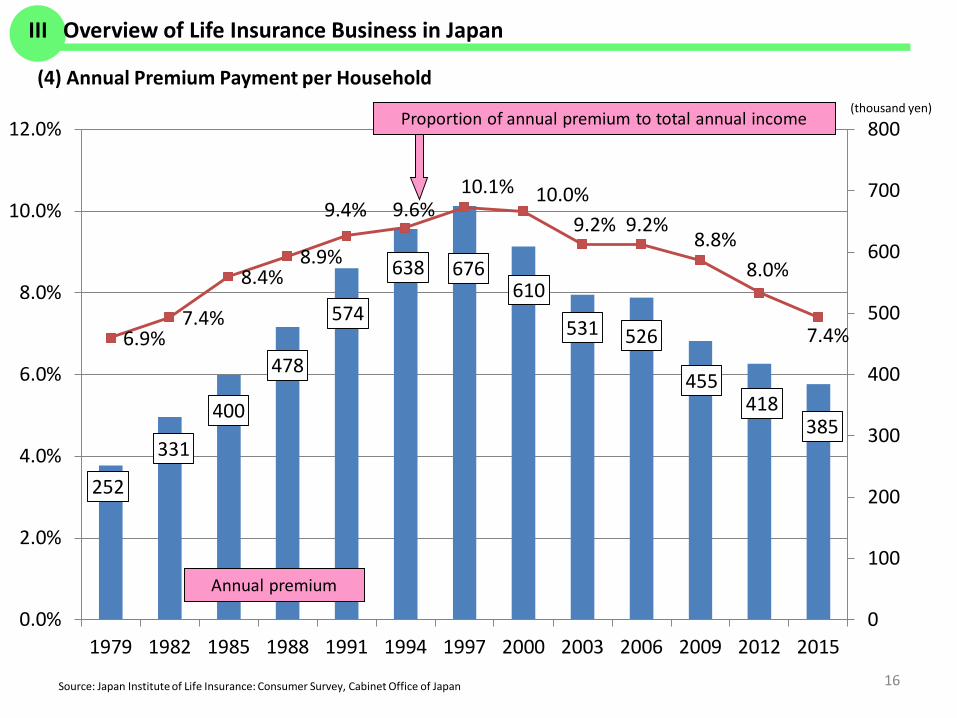
(4) Annual Premium Payment per Household
Source: Japan Institute of Life Insurance: Consumer Survey, Cabinet Office of Japan
Annual premium
Proportion of annual premium to total annual income(thousand yen)
III Overview of Life Insurance Business in Japan
17Source: Japan Institute of Life Insurance: consumer survey
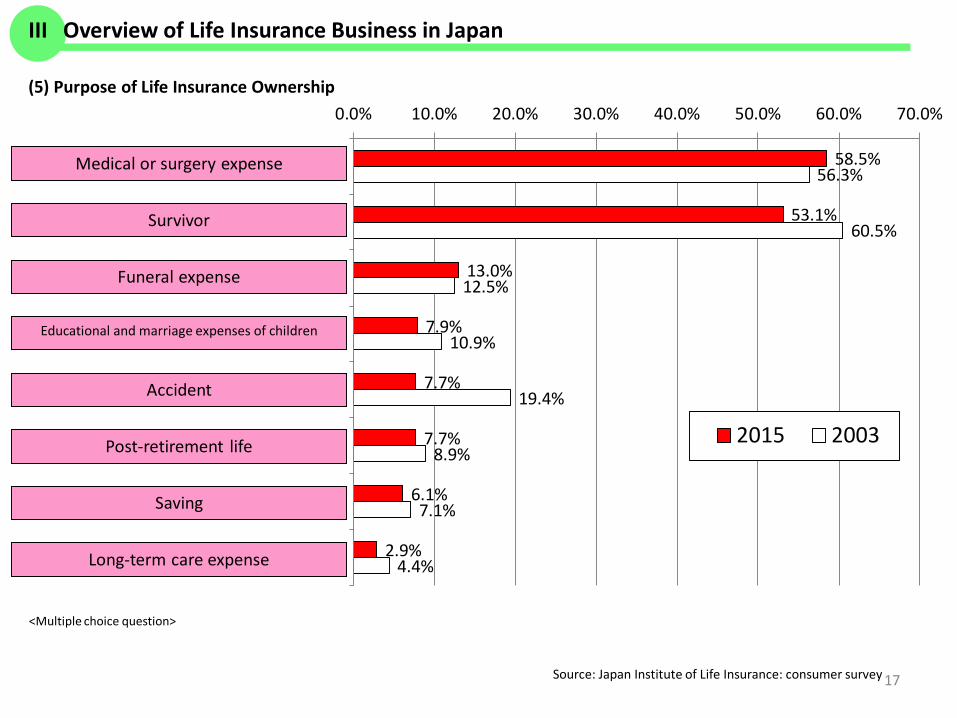
<Multiple choice question>
(5) Purpose of Life Insurance Ownership
58.5%
53.1%
13.0%
7.9%
7.7%
7.7%
6.1%
2.9%
56.3%
60.5%
12.5%
10.9%
19.4%
8.9%
7.1%
4.4%
0.0% 10.0% 20.0% 30.0% 40.0% 50.0% 60.0% 70.0%
1
2
3
4
5
6
7
8
2015 2003
Long-term care expense
Saving
Post-retirement life
Accident
Educational and marriage expenses of children
Funeral expense
Survivor
Medical or surgery expense
III Overview of Life Insurance Business in Japan
18
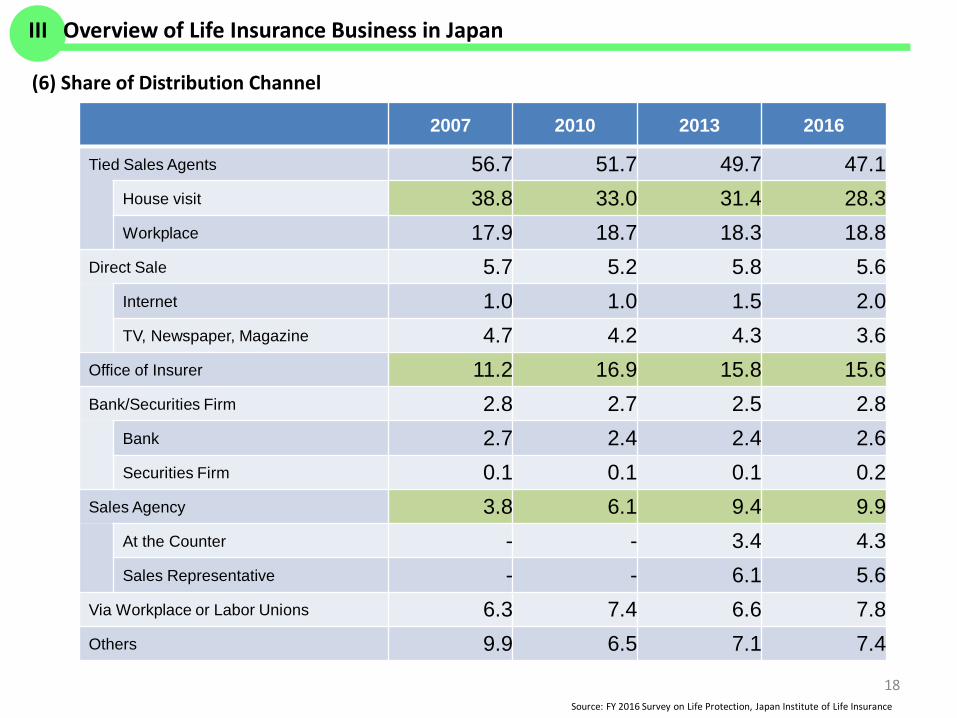
(6) Share of Distribution Channel
Source: FY 2016 Survey on Life Protection, Japan Institute of Life Insurance
2007 2010 2013 2016
Tied Sales Agents 56.7 51.7 49.7 47.1 House visit 38.8 33.0 31.4 28.3 Workplace 17.9 18.7 18.3 18.8
Direct Sale 5.7 5.2 5.8 5.6 Internet 1.0 1.0 1.5 2.0 TV, Newspaper, Magazine 4.7 4.2 4.3 3.6
Office of Insurer 11.2 16.9 15.8 15.6 Bank/Securities Firm 2.8 2.7 2.5 2.8
Bank 2.7 2.4 2.4 2.6 Securities Firm 0.1 0.1 0.1 0.2
Sales Agency 3.8 6.1 9.4 9.9 At the Counter - - 3.4 4.3 Sales Representative - - 6.1 5.6
Via Workplace or Labor Unions 6.3 7.4 6.6 7.8 Others 9.9 6.5 7.1 7.4
III Overview of Life Insurance Business in Japan
19
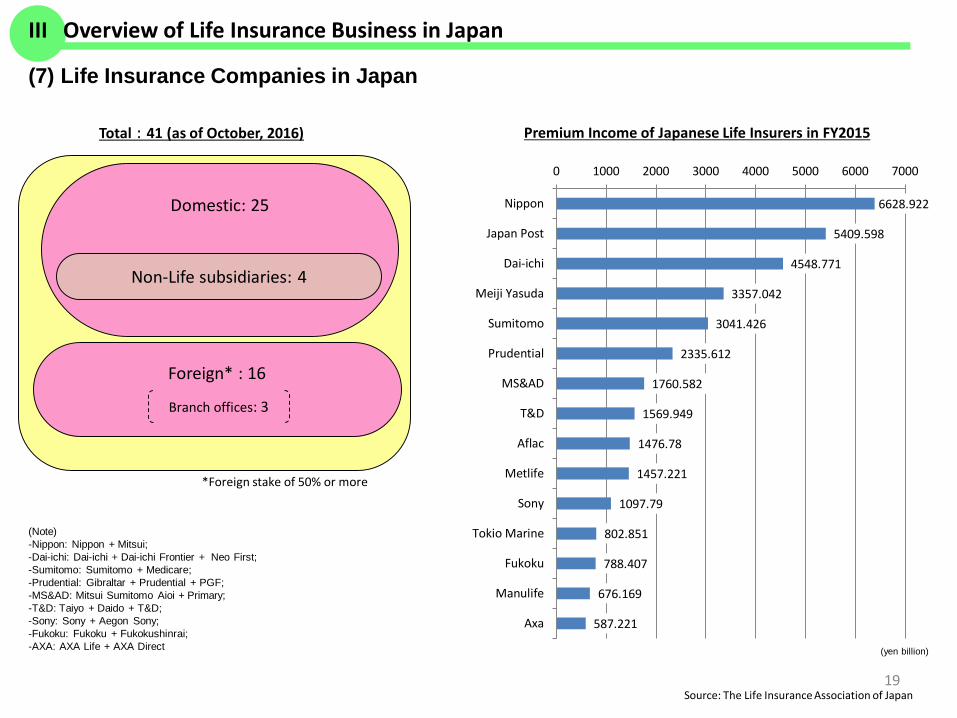
Total : 41 (as of October, 2016)
Foreign* : 16
Branch offices: 3
Domestic: 25
*Foreign stake of 50% or more
Premium Income of Japanese Life Insurers in FY2015
Source: The Life Insurance Association of Japan
(yen billion)
(7) Life Insurance Companies in Japan
Non-Life subsidiaries: 4
III Overview of Life Insurance Business in Japan
(Note) -Nippon: Nippon + Mitsui;-Dai-ichi: Dai-ichi + Dai-ichi Frontier + Neo First; -Sumitomo: Sumitomo + Medicare; -Prudential: Gibraltar + Prudential + PGF; -MS&AD: Mitsui Sumitomo Aioi + Primary; -T&D: Taiyo + Daido + T&D;-Sony: Sony + Aegon Sony; -Fukoku: Fukoku + Fukokushinrai;-AXA: AXA Life + AXA Direct
6628.922
5409.598
4548.771
3357.042
3041.426
2335.612
1760.582
1569.949
1476.78
1457.221
1097.79
802.851
788.407
676.169
587.221
0 1000 2000 3000 4000 5000 6000 7000
Nippon
Japan Post
Dai-ichi
Meiji Yasuda
Sumitomo
Prudential
MS&AD
T&D
Aflac
Metlife
Sony
Tokio Marine
Fukoku
Manulife
Axa
20
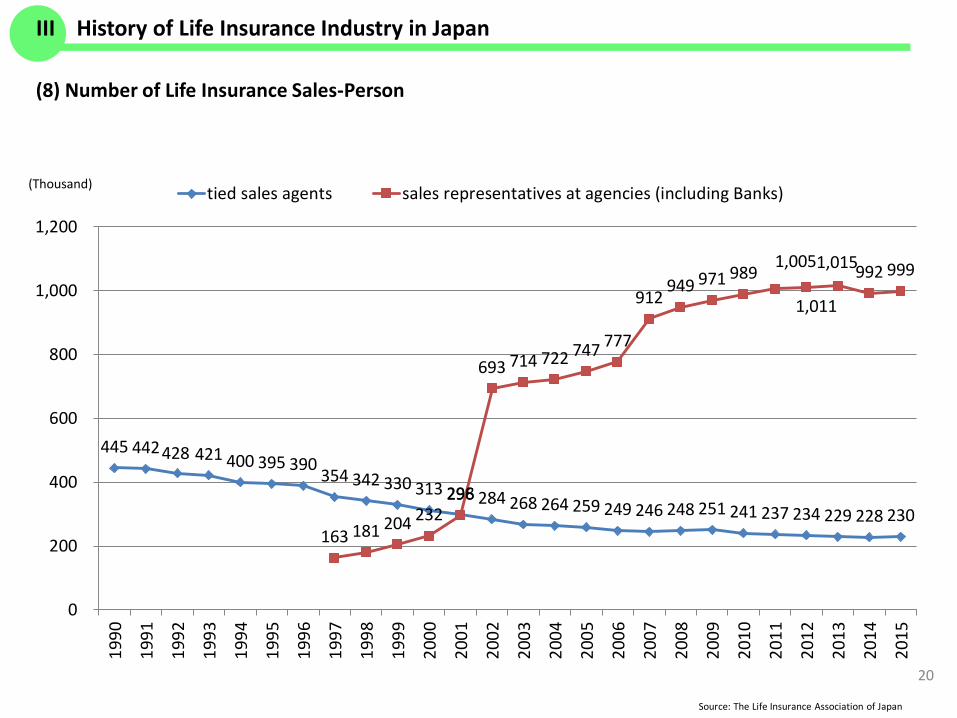
Source: The Life Insurance Association of Japan
(Thousand)
(8) Number of Life Insurance Sales-Person
III History of Life Insurance Industry in Japan
445 442 428 421 400 395 390 354 342 330 313 298 284 268 264 259 249 246 248 251 241 237 234 229 228 230 163 181 204 232
296
693 714 722 747 777
912 949 971 989 1,005
1,011
1,015 992 999
0
200
400
600
800
1,000
1,200
1990
1991
1992
1993
1994
1995
1996
1997
1998
1999
2000
2001
2002
2003
2004
2005
2006
2007
2008
2009
2010
2011
2012
2013
2014
2015
tied sales agents sales representatives at agencies (including Banks)
21
New policies
(Number; million)
Policies in Force
(Number; million)
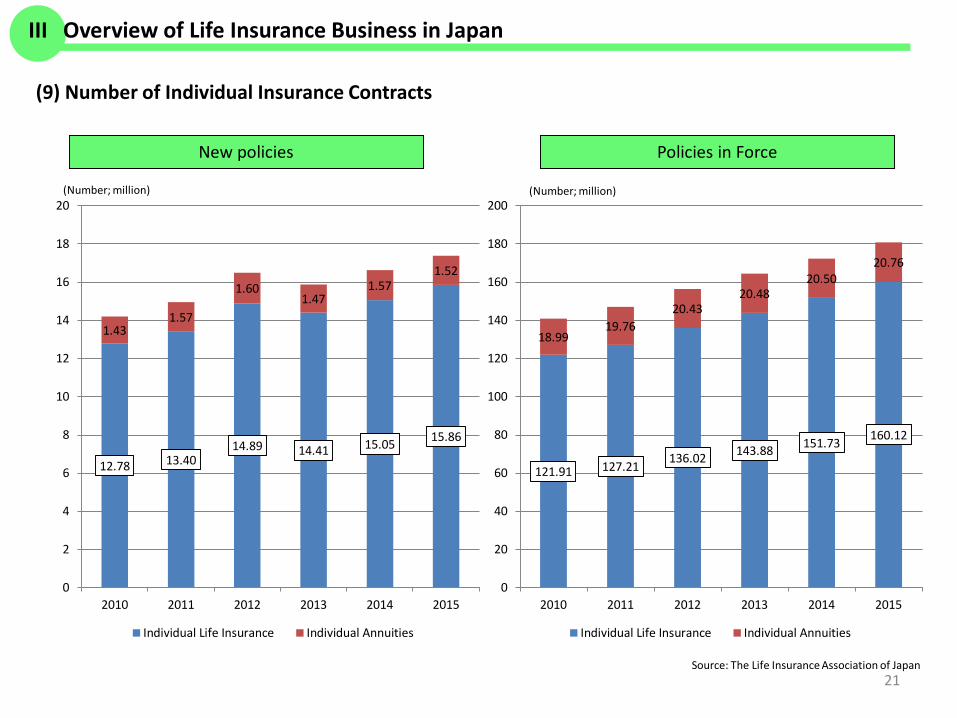
(9) Number of Individual Insurance Contracts
Source: The Life Insurance Association of Japan
III Overview of Life Insurance Business in Japan
12.78 13.40 14.89 14.41 15.05 15.86
1.43 1.57
1.60 1.47
1.57 1.52
0
2
4
6
8
10
12
14
16
18
20
2010 2011 2012 2013 2014 2015
Individual Life Insurance Individual Annuities
121.91 127.21 136.02 143.88 151.73 160.12
18.99 19.76
20.43 20.48
20.50 20.76
0
20
40
60
80
100
120
140
160
180
200
2010 2011 2012 2013 2014 2015
Individual Life Insurance Individual Annuities
22
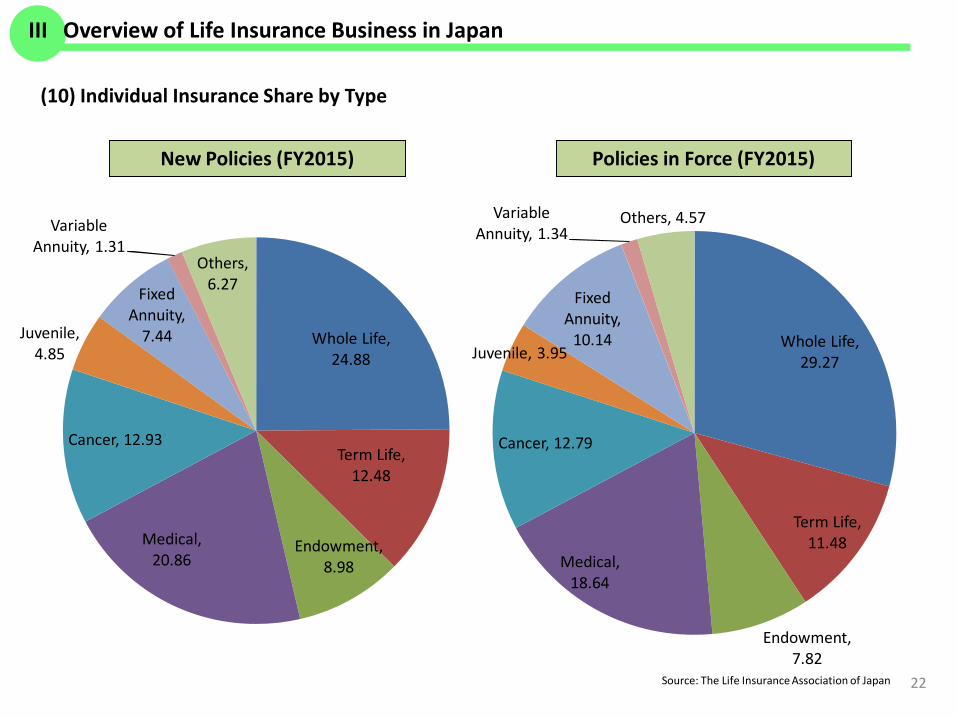
(10) Individual Insurance Share by Type
Source: The Life Insurance Association of Japan
Policies in Force (FY2015)New Policies (FY2015)
III Overview of Life Insurance Business in Japan
Whole Life, 24.88
Term Life, 12.48
Endowment, 8.98
Medical, 20.86
Cancer, 12.93
Juvenile, 4.85
Fixed Annuity,
7.44
Variable Annuity, 1.31
Others, 6.27
Whole Life, 29.27
Term Life, 11.48
Endowment, 7.82
Medical, 18.64
Cancer, 12.79
Juvenile, 3.95
Fixed Annuity,
10.14
Variable Annuity, 1.34
Others, 4.57

20,448 22,734 24,099 22,721
24,546 25,607
4,802
4,679 4,374
4,312
5,154 4,730
1,116
1,114 1,109
1,113
1,119 1,125
3,813
3,926 3,684
3,852
4,176 4,563
4,276
3,836 3,874
2,740
2,227 1,724
0
5000
10000
15000
20000
25000
30000
35000
40000
2010 2011 2012 2013 2014 2015
Individual Life Insurance Individual Annuities Group Life Insurance Group Annuities Others
23
(11) Premium Income
(yen billion)
Source: The Life Insurance Association of Japan
37,22234,454
36,289 37,14034,738
III Overview of Life Insurance Business in Japan
37,748
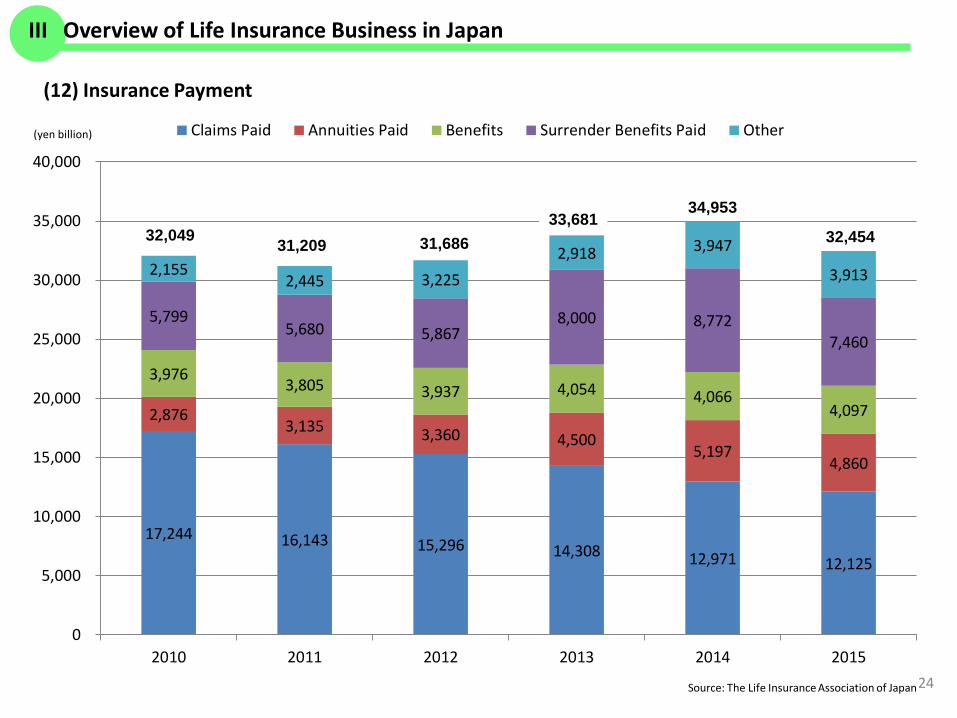
17,244 16,143 15,296 14,308 12,971 12,125
2,876 3,135 3,360 4,500
5,197 4,860
3,976 3,805 3,937 4,054 4,066
4,097
5,799 5,680 5,867
8,000 8,772 7,460
2,155 2,445 3,225
2,918 3,947
3,913
0
5,000
10,000
15,000
20,000
25,000
30,000
35,000
40,000
2010 2011 2012 2013 2014 2015
Claims Paid Annuities Paid Benefits Surrender Benefits Paid Other
24
(12) Insurance Payment
(yen billion)
Source: The Life Insurance Association of Japan
33,68131,68631,20932,049
34,953
III Overview of Life Insurance Business in Japan
32,454
25
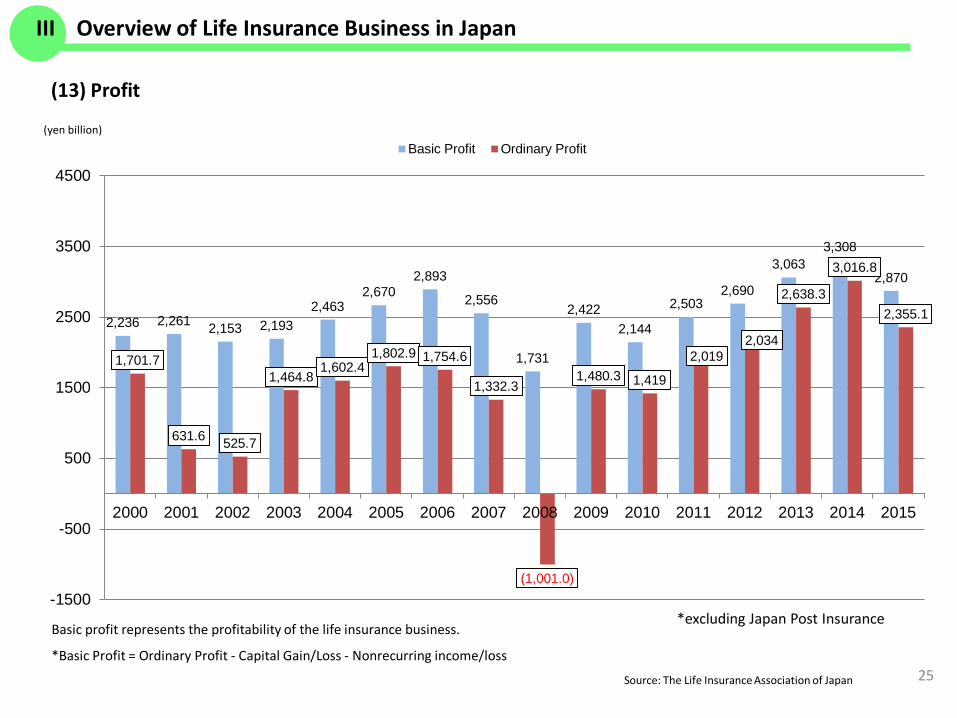
(13) Profit
(yen billion)
Source: The Life Insurance Association of Japan
Basic profit represents the profitability of the life insurance business.
*Basic Profit = Ordinary Profit - Capital Gain/Loss - Nonrecurring income/loss
III Overview of Life Insurance Business in Japan
2,236 2,261 2,153 2,1932,463
2,6702,893
2,556
1,731
2,4222,144
2,5032,690
3,0633,308
2,870
1,701.7
631.6 525.7
1,464.8 1,602.4
1,802.9 1,754.6
1,332.3
(1,001.0)
1,480.3 1,419
2,0192,034
2,638.3
3,016.8
2,355.1
-1500
-500
500
1500
2500
3500
4500
2000 2001 2002 2003 2004 2005 2006 2007 2008 2009 2010 2011 2012 2013 2014 2015
Basic Profit Ordinary Profit
*excluding Japan Post Insurance
IV Brief History ofLife Insurance Industry in Japan
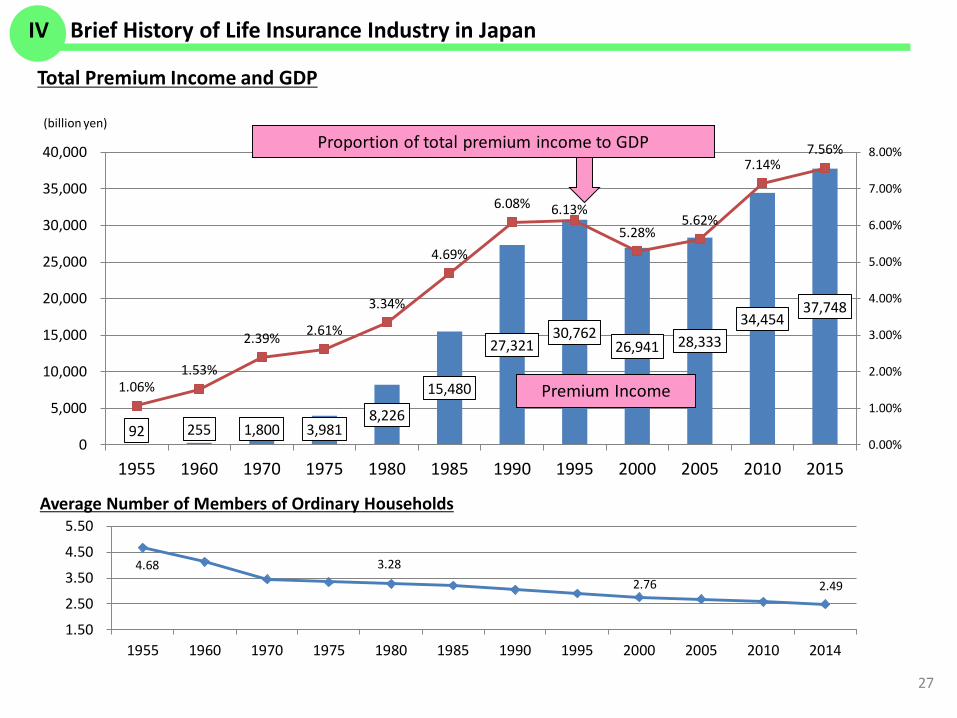
92 255 1,800 3,981 8,226
15,480
27,321 30,762
26,941 28,333 34,454
37,748
1.06%1.53%
2.39% 2.61%
3.34%
4.69%
6.08% 6.13%5.28%
5.62%
7.14%7.56%
0.00%
1.00%
2.00%
3.00%
4.00%
5.00%
6.00%
7.00%
8.00%
0
5,000
10,000
15,000
20,000
25,000
30,000
35,000
40,000
1955 1960 1970 1975 1980 1985 1990 1995 2000 2005 2010 2015
27
Total Premium Income and GDP
(billion yen)Proportion of total premium income to GDP
Premium Income
IV Brief History of Life Insurance Industry in Japan
Average Number of Members of Ordinary Households
4.68 3.28 2.76 2.49
1.50
2.50
3.50
4.50
5.50
1955 1960 1970 1975 1980 1985 1990 1995 2000 2005 2010 2014
28
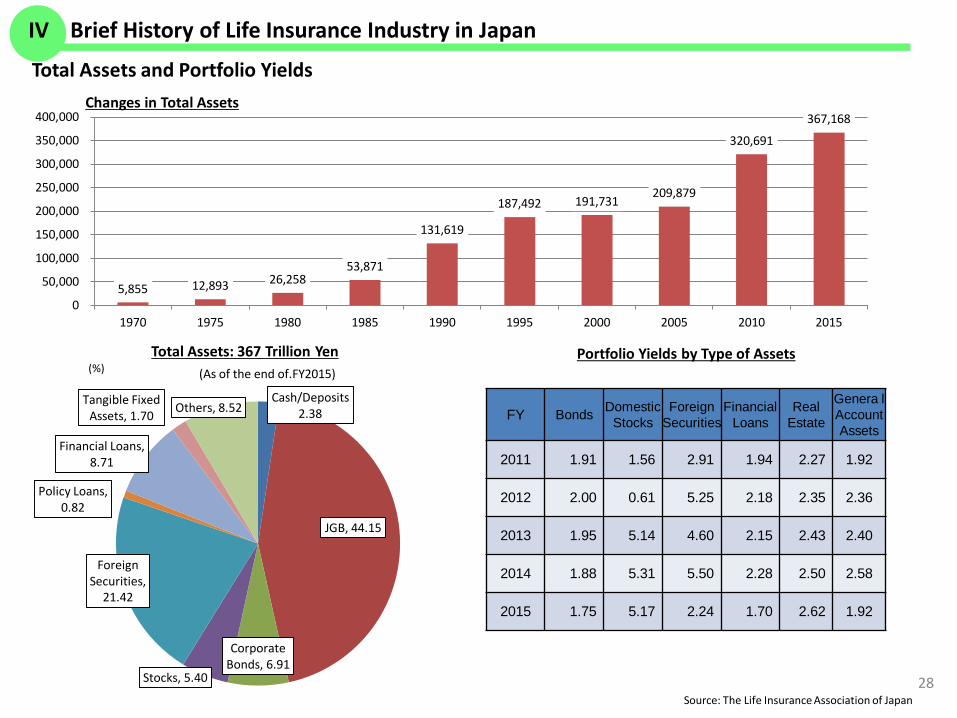
Total Assets and Portfolio Yields
(%)
Source: The Life Insurance Association of Japan
Total Assets: 367 Trillion Yen(As of the end of.FY2015)
Portfolio Yields by Type of Assets
FY Bonds Domestic Stocks
Foreign Securities
Financial Loans
Real Estate
Genera lAccount Assets
2011 1.91 1.56 2.91 1.94 2.27 1.92
2012 2.00 0.61 5.25 2.18 2.35 2.36
2013 1.95 5.14 4.60 2.15 2.43 2.40
2014 1.88 5.31 5.50 2.28 2.50 2.58
2015 1.75 5.17 2.24 1.70 2.62 1.92
Changes in Total Assets
IV Brief History of Life Insurance Industry in Japan
5,855 12,893 26,258 53,871
131,619
187,492 191,731 209,879
320,691
367,168
0
50,000
100,000
150,000
200,000
250,000
300,000
350,000
400,000
1970 1975 1980 1985 1990 1995 2000 2005 2010 2015
Cash/Deposits 2.38
JGB, 44.15
Corporate Bonds, 6.91
Stocks, 5.40
Foreign Securities,
21.42
Policy Loans, 0.82
Financial Loans, 8.71
Tangible Fixed Assets, 1.70 Others, 8.52
29
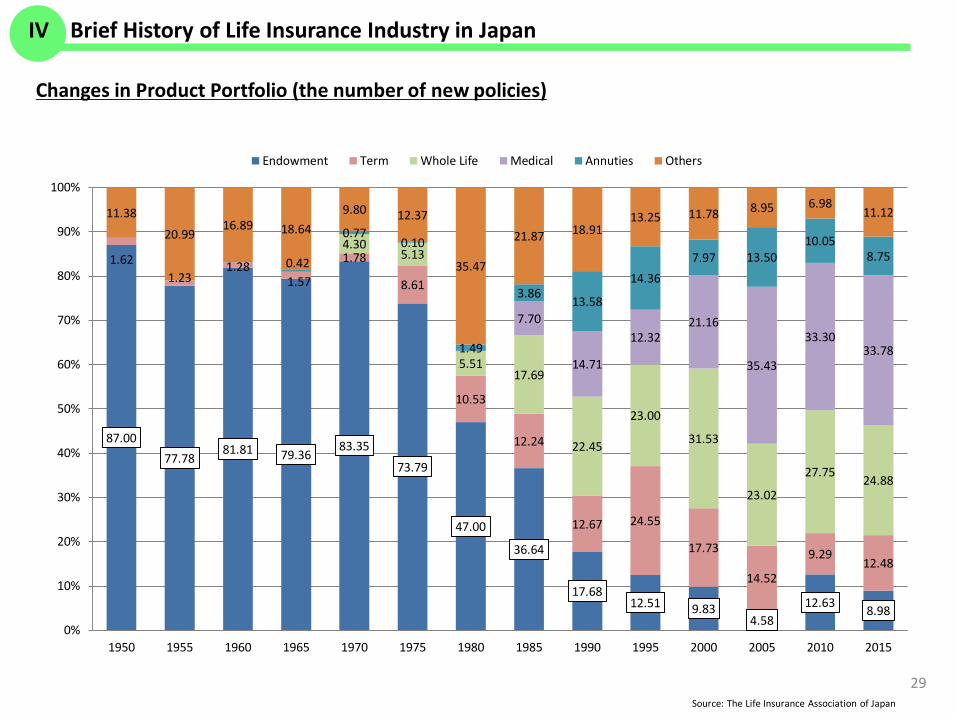
Changes in Product Portfolio (the number of new policies)
Source: The Life Insurance Association of Japan
IV Brief History of Life Insurance Industry in Japan
87.00 77.78
81.81 79.36 83.35
73.79
47.00
36.64
17.68 12.51 9.83
4.58 12.63 8.98
1.62 1.23
1.28 1.57
1.78
8.61
10.53
12.24
12.67 24.55
17.73
14.52
9.29 12.48
4.30 5.13
5.51 17.69
22.45
23.00
31.53
23.02
27.75 24.88
7.70
14.71
12.32 21.16
35.43
33.30 33.78
0.42
0.77 0.10
1.49
3.86 13.58
14.36 7.97 13.50
10.05 8.75
11.38
20.99 16.89 18.64
9.80 12.37
35.47
21.87 18.91 13.25 11.78 8.95 6.98
11.12
0%
10%
20%
30%
40%
50%
60%
70%
80%
90%
100%
1950 1955 1960 1965 1970 1975 1980 1985 1990 1995 2000 2005 2010 2015
Endowment Term Whole Life Medical Annuties Others
30
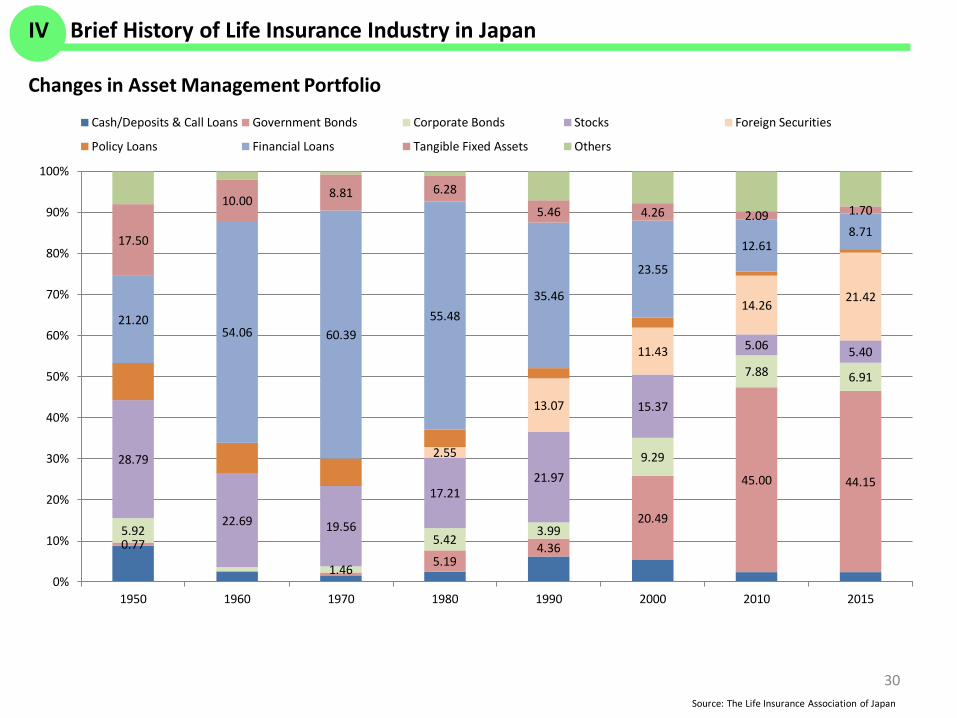
Changes in Asset Management Portfolio
Source: The Life Insurance Association of Japan
IV Brief History of Life Insurance Industry in Japan
0.77 5.19
4.36
20.49
45.00 44.15
5.92
1.46
5.42 3.99
9.29
7.88 6.91
28.79
22.69 19.56
17.21 21.97
15.37
5.06 5.40
2.55
13.07
11.43
14.26 21.42
21.20 54.06 60.39
55.48 35.46
23.55
12.61 8.71
17.50
10.00 8.81 6.28
5.46 4.26 2.09 1.70
0%
10%
20%
30%
40%
50%
60%
70%
80%
90%
100%
1950 1960 1970 1980 1990 2000 2010 2015
Cash/Deposits & Call Loans Government Bonds Corporate Bonds Stocks Foreign Securities
Policy Loans Financial Loans Tangible Fixed Assets Others

V Addressing the issues
-2-1012345678
1986
1988
1990
1992
1994
1996
1998
2000
2002
2004
2006
2008
2010
2012
2014
2016
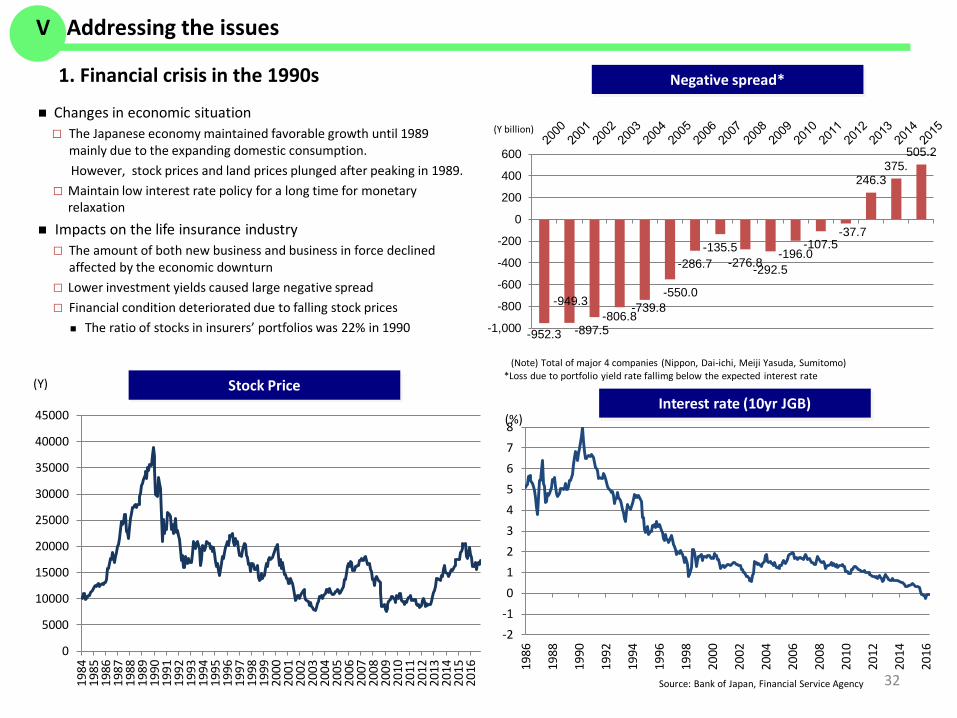
Changes in economic situation The Japanese economy maintained favorable growth until 1989
mainly due to the expanding domestic consumption. However, stock prices and land prices plunged after peaking in 1989.
Maintain low interest rate policy for a long time for monetary relaxation
Impacts on the life insurance industry The amount of both new business and business in force declined
affected by the economic downturn Lower investment yields caused large negative spread Financial condition deteriorated due to falling stock prices
The ratio of stocks in insurers’ portfolios was 22% in 1990
Stock PriceInterest rate (10yr JGB)
(Y)
(%)
Negative spread*
(Y billion)
Source: Bank of Japan, Financial Service Agency
*Loss due to portfolio yield rate fallimg below the expected interest rate
32
(Note) Total of major 4 companies (Nippon, Dai-ichi, Meiji Yasuda, Sumitomo)
V Addressing the issues
1. Financial crisis in the 1990s
0
5000
10000
15000
20000
25000
30000
35000
40000
45000
1984
1985
1986
1987
1988
1989
1990
1991
1992
1993
1994
1995
1996
1997
1998
1999
2000
2001
2002
2003
2004
2005
2006
2007
2008
2009
2010
2011
2012
2013
2014
2015
2016
-952.3
-949.3
-897.5-806.8
-739.8-550.0
-286.7-135.5
-276.8-292.5-196.0
-107.5-37.7
246.3375.
505.2
-1,000
-800
-600
-400
-200
0
200
400
600

Bankruptcy cases of life insurers
Nissan Life Toho Life Daihyaku Life Taisho Life Chiyoda Life Kyoei Life Tokyo Life Yamato Life
Procedure Administrative Administrative Administrative Administrative Judicial Judicial Judicial Judicial
Excess liabilities (a)-(b)
Approx. 302.9(April 1997)
Approx .650(June 1999)
Approx. 317.7(May 2000)
Approx. 36.5(August 2000)
Approx. 595(October 13, 2000)
Approx. 689.5(October 23, 2000)
Approx. 73.1(March 31, 2001)
Approx. 64.3(October 17, 2008)
Asset (a)(billion yen)
1,822.7 2,190 1,300 154.5 2,233 3,725 690 194.9
Liability(b)(billion yen)
2,125.6 2,840 1,617.6 191 2,828 4,414.5 763.2 259.2
Relief Insurance Company
Aoba Life(Prudential Life)
GE Edison Life(Gibraltar Life)
Manulife LifeAzami Life(PGF Life)
AIG Star Life(Gibraltar Life)
Gibraltar Life T&D Financial Life
Prudential Financial Japan
Life(PGF Life)
Aid amount by LIPPCJ (billion yen) 200 366.3 145 26.7 0 0 0 27.8
Changes in Policy
Reduction of policy reserve No reduction 10% 10% 10% 10% 8% No reduction
10%(additional
reduction for high-interest
policy)
Post-reduction expected interest rate
2.75% 1.5% 1.0% 1.0% 1.5% 1.75% 2.6% 1.0%
Date of ResolutionOctober 1, 1997
Transfer of contract
March 1, 2000Transfer of
contract
April 2, 2001Transfer of contract
March 31, 2001Transfer of contract
April 20, 2001 Conversion to a stock company
(Restart business)
April 3, 2001Restart business
October 19, 2001Conversion to a stock company
(Restart business)
June 1, 2009Restart business
33
V Addressing the issues
012345678
b) Stock Holding
34
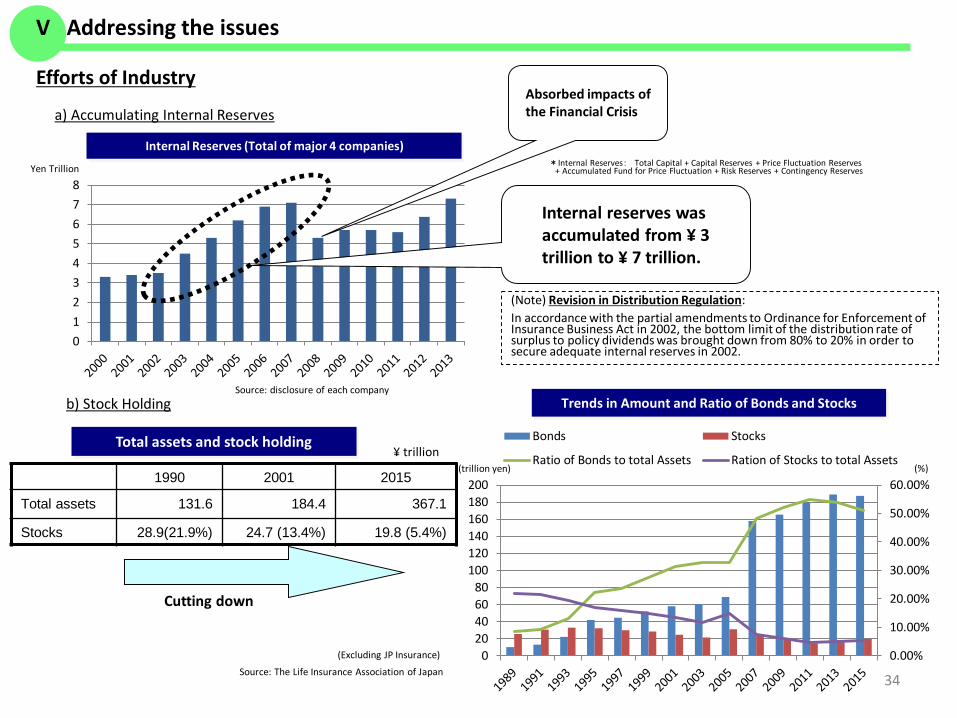
Efforts of Industry
a) Accumulating Internal Reserves
Yen Trillion
Internal Reserves (Total of major 4 companies)
Internal reserves was accumulated from ¥ 3 trillion to ¥ 7 trillion.
Source: disclosure of each company
*Internal Reserves: Total Capital + Capital Reserves + Price Fluctuation Reserves+ Accumulated Fund for Price Fluctuation + Risk Reserves + Contingency Reserves
Total assets and stock holding
1990 2001 2015
Total assets 131.6 184.4 367.1
Stocks 28.9(21.9%) 24.7 (13.4%) 19.8 (5.4%)
Cutting down
¥ trillion(%)(trillion yen)
Trends in Amount and Ratio of Bonds and Stocks
(Excluding JP Insurance)
Source: The Life Insurance Association of Japan
(Note) Revision in Distribution Regulation: In accordance with the partial amendments to Ordinance for Enforcement of Insurance Business Act in 2002, the bottom limit of the distribution rate of surplus to policy dividends was brought down from 80% to 20% in order to secure adequate internal reserves in 2002.
Absorbed impacts of the Financial Crisis
V Addressing the issues
0.00%
10.00%
20.00%
30.00%
40.00%
50.00%
60.00%
020406080
100120140160180200
Bonds Stocks
Ratio of Bonds to total Assets Ration of Stocks to total Assets
0
1
2
3
4
5
6
7
8
9
1985 1987 1989 1991 1993 1995 1997 1999 2001 2003 2005 2007 2009 2011 2013 2015
Standard Interest Rate Portfolio Yield of General Account Assets
10.00
12.00
14.00
16.00
18.00
35
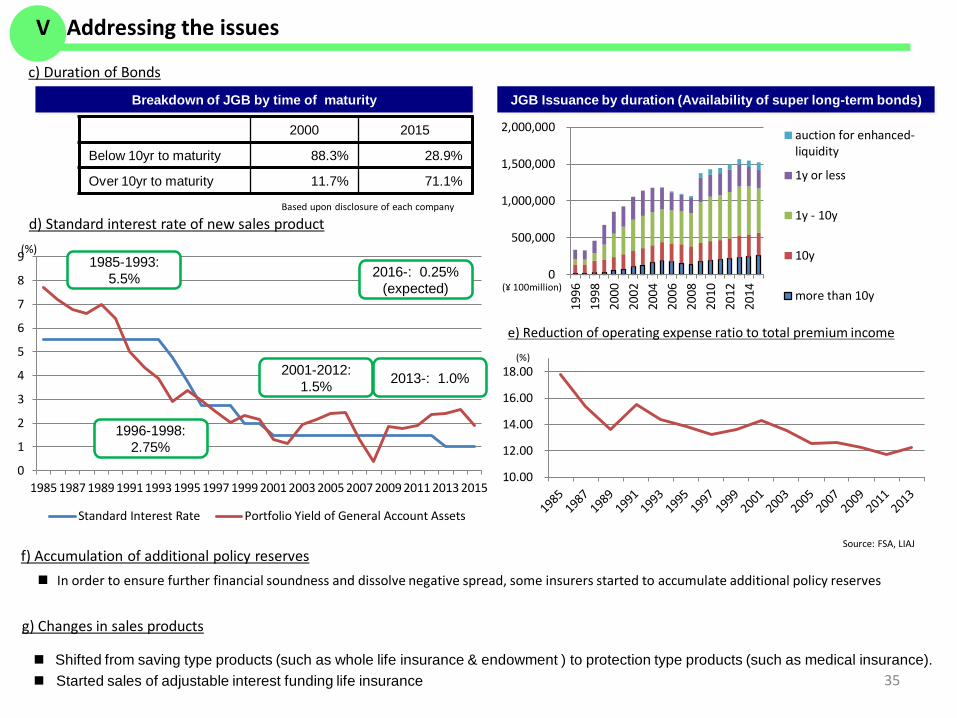
c) Duration of Bonds
Breakdown of JGB by time of maturity
2000 2015
Below 10yr to maturity 88.3% 28.9%
Over 10yr to maturity 11.7% 71.1%
Based upon disclosure of each company
d) Standard interest rate of new sales product(%)
Source: FSA, LIAJ
g) Changes in sales products
Shifted from saving type products (such as whole life insurance & endowment ) to protection type products (such as medical insurance). Started sales of adjustable interest funding life insurance
1985-1993: 5.5%
1996-1998: 2.75%
2001-2012: 1.5% 2013-: 1.0%
f) Accumulation of additional policy reserves In order to ensure further financial soundness and dissolve negative spread, some insurers started to accumulate additional policy reserves
e) Reduction of operating expense ratio to total premium income
(%)
V Addressing the issues
2016-: 0.25%(expected)
0
500,000
1,000,000
1,500,000
2,000,000
1996
1998
2000
2002
2004
2006
2008
2010
2012
2014
auction for enhanced-liquidity
1y or less
1y - 10y
10y
more than 10y(¥ 100million)
JGB Issuance by duration (Availability of super long-term bonds)
(%)
36
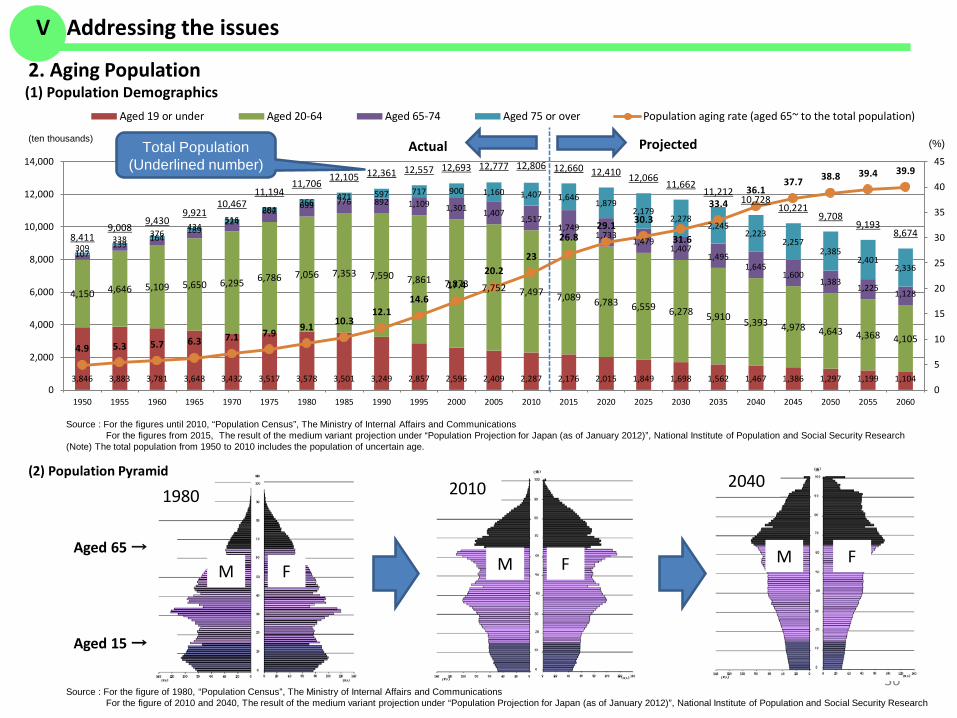
2. Aging Population
3,846 3,883 3,781 3,648 3,432 3,517 3,578 3,501 3,249 2,857 2,596 2,409 2,287 2,176 2,015 1,849 1,698 1,562 1,467 1,386 1,297 1,199 1,104
4,150 4,646 5,109 5,650 6,295 6,786 7,056 7,353 7,590 7,861 7,873 7,752 7,497 7,089 6,783 6,559 6,278 5,910 5,393 4,978 4,643 4,368 4,105
309338
376434
516602 699 776 892 1,109 1,301 1,407
1,5171,749
1,7331,479
1,4071,495
1,6451,600
1,3831,225 1,128
107139
164189
224284
366 471 597 717 900 1,160 1,407 1,6461,879
2,1792,278
2,2452,223
2,2572,385
2,4012,336
8,4119,008
9,4309,921
10,46711,194
11,706 12,105 12,361 12,557 12,693 12,777 12,806 12,660 12,410 12,066 11,66211,212
10,72810,221
9,7089,193
8,674
4.9 5.3 5.7 6.3 7.1 7.9 9.1 10.312.1
14.617.4
20.223
26.829.1 30.3
31.6
33.436.1
37.7 38.8 39.4 39.9
0
5
10
15
20
25
30
35
40
45
0
2,000
4,000
6,000
8,000
10,000
12,000
14,000
1950 1955 1960 1965 1970 1975 1980 1985 1990 1995 2000 2005 2010 2015 2020 2025 2030 2035 2040 2045 2050 2055 2060
Aged 19 or under Aged 20-64 Aged 65-74 Aged 75 or over Population aging rate (aged 65~ to the total population)
ProjectedActual(ten thousands)
(2) Population Pyramid
M F M F M F
2010 20401980
Aged 65 →
Aged 15 →
Source : For the figures until 2010, “Population Census”, The Ministry of Internal Affairs and CommunicationsFor the figures from 2015, The result of the medium variant projection under “Population Projection for Japan (as of January 2012)”, National Institute of Population and Social Security Research
(Note) The total population from 1950 to 2010 includes the population of uncertain age.
Source : For the figure of 1980, “Population Census”, The Ministry of Internal Affairs and CommunicationsFor the figure of 2010 and 2040, The result of the medium variant projection under “Population Projection for Japan (as of January 2012)”, National Institute of Population and Social Security Research
Total Population(Underlined number)
(1) Population Demographics
V Addressing the issues
37
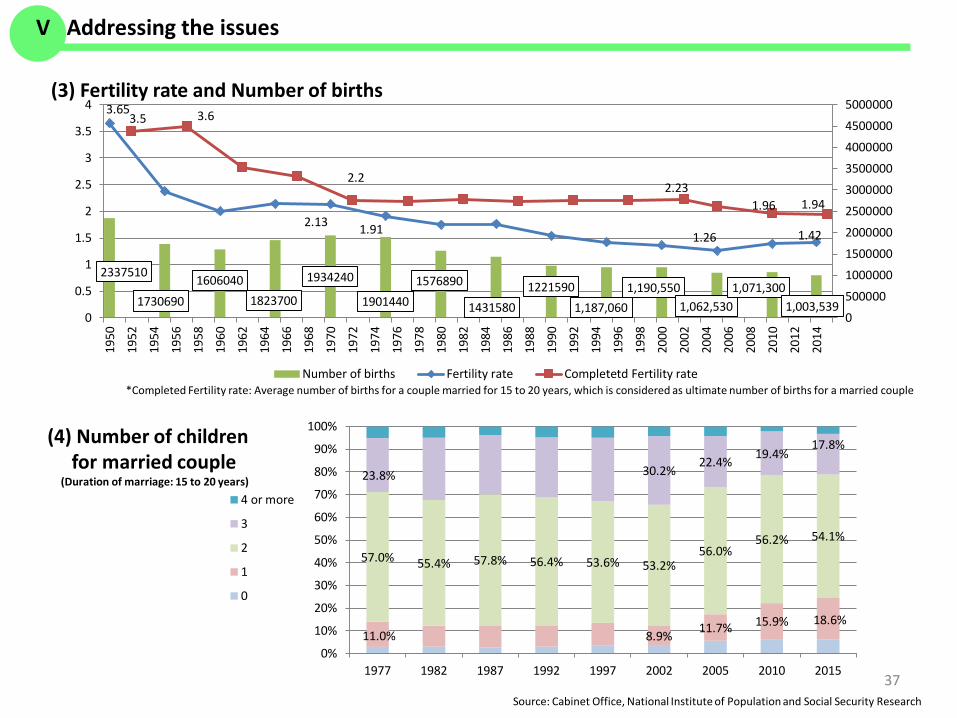
(3) Fertility rate and Number of births
Source: Cabinet Office, National Institute of Population and Social Security Research
V Addressing the issues
2337510
17306901606040
1823700
1934240
19014401576890
14315801221590
1,187,0601,190,550
1,062,5301,071,300
1,003,539
3.65
2.13 1.91 1.26 1.42
3.5 3.6
2.22.23
1.96 1.94
0
500000
1000000
1500000
2000000
2500000
3000000
3500000
4000000
4500000
5000000
0
0.5
1
1.5
2
2.5
3
3.5
419
50
1952
1954
1956
1958
1960
1962
1964
1966
1968
1970
1972
1974
1976
1978
1980
1982
1984
1986
1988
1990
1992
1994
1996
1998
2000
2002
2004
2006
2008
2010
2012
2014
Number of births Fertility rate Completetd Fertility rate
11.0% 8.9% 11.7% 15.9% 18.6%
57.0% 55.4% 57.8% 56.4% 53.6% 53.2%56.0%
56.2% 54.1%
23.8% 30.2%22.4% 19.4%
17.8%
0%
10%
20%
30%
40%
50%
60%
70%
80%
90%
100%
1977 1982 1987 1992 1997 2002 2005 2010 2015
4 or more
3
2
1
0
(4) Number of childrenfor married couple
(Duration of marriage: 15 to 20 years)
*Completed Fertility rate: Average number of births for a couple married for 15 to 20 years, which is considered as ultimate number of births for a married couple
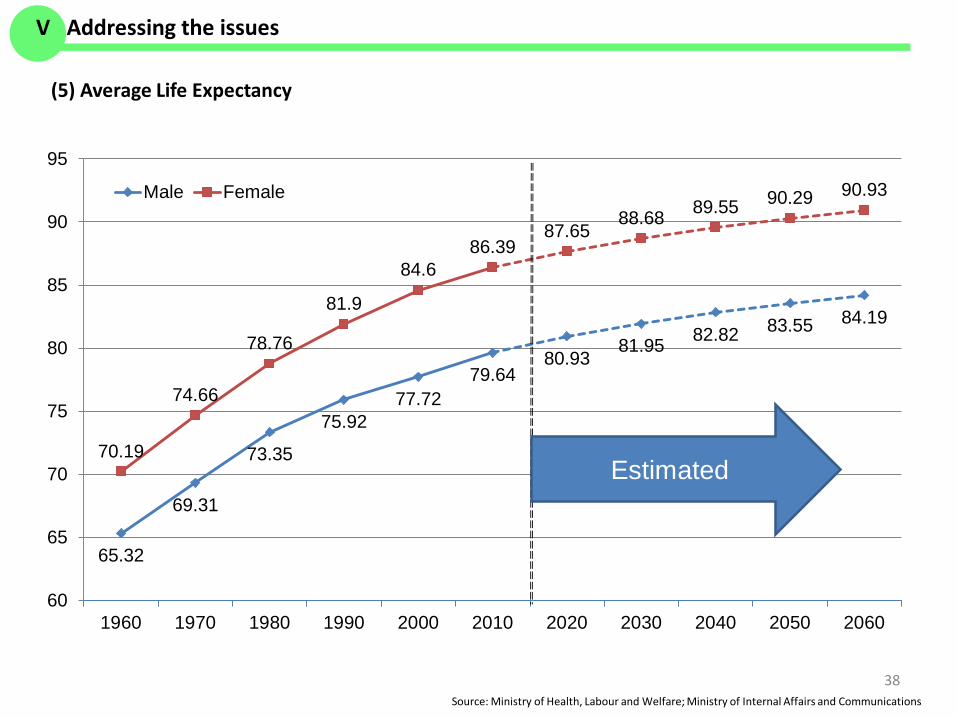
65.32
69.31
73.35
75.9277.72
79.6480.93
81.95 82.82 83.55 84.19
70.19
74.66
78.76
81.9
84.686.39
87.6588.68 89.55 90.29 90.93
60
65
70
75
80
85
90
95
1960 1970 1980 1990 2000 2010 2020 2030 2040 2050 2060
Male Female
Estimated
38
(5) Average Life Expectancy
Source: Ministry of Health, Labour and Welfare; Ministry of Internal Affairs and Communications
V Addressing the issues
0
10
20
30
40
50
60
70
80
90
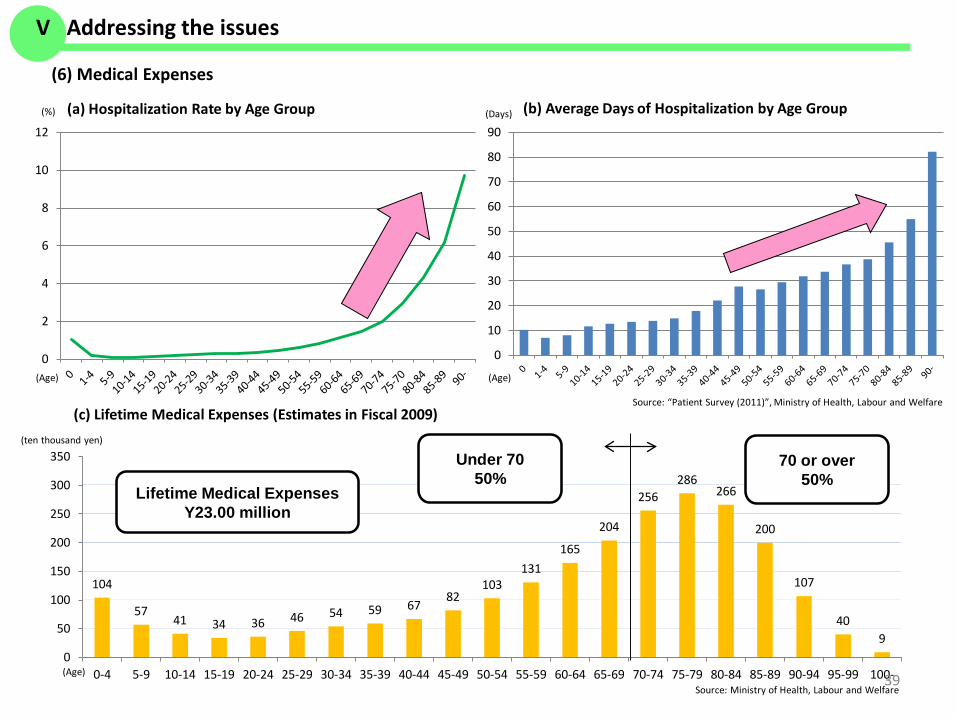
(a) Hospitalization Rate by Age Group (b) Average Days of Hospitalization by Age Group(%) (Days)
Source: “Patient Survey (2011)”, Ministry of Health, Labour and Welfare
(6) Medical Expenses
(c) Lifetime Medical Expenses (Estimates in Fiscal 2009)
104
5741 34 36 46 54 59 67
82103
131165
204
256286
266
200
107
409
0
50
100
150
200
250
300
350
0-4 5-9 10-14 15-19 20-24 25-29 30-34 35-39 40-44 45-49 50-54 55-59 60-64 65-69 70-74 75-79 80-84 85-89 90-94 95-99 100-Source: Ministry of Health, Labour and Welfare
(ten thousand yen)
Lifetime Medical ExpensesY23.00 million
Under 7050%
70 or over50%
39
(Age) (Age)
(Age)
0
2
4
6
8
10
12
V Addressing the issues
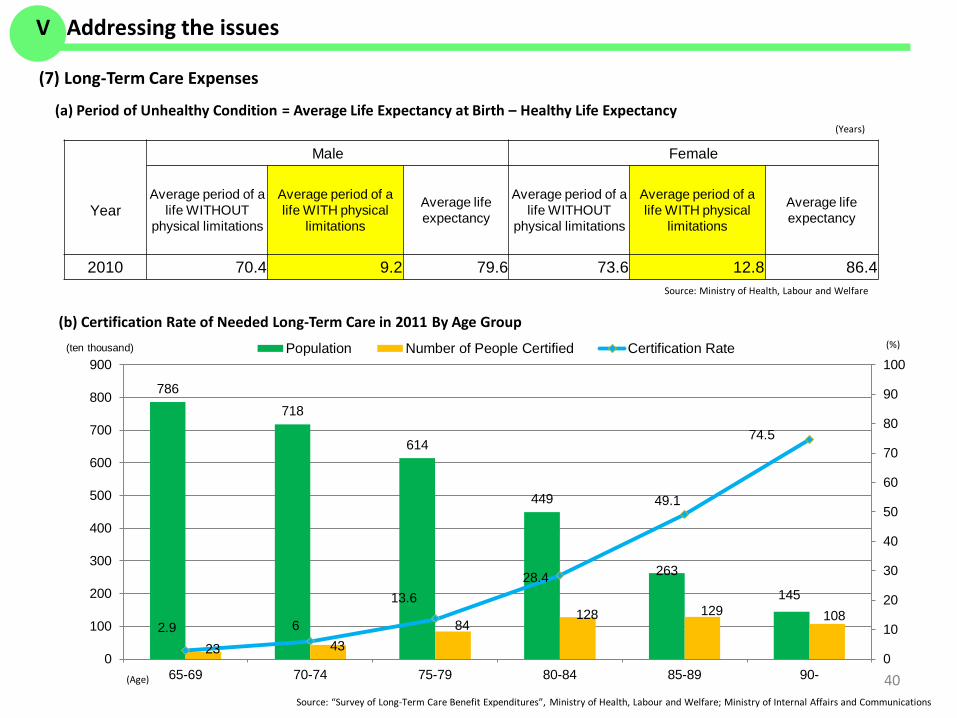
(a) Period of Unhealthy Condition = Average Life Expectancy at Birth – Healthy Life Expectancy
Male Female
YearAverage period of a
life WITHOUT physical limitations
Average period of a life WITH physical
limitations
Average life expectancy
Average period of a life WITHOUT
physical limitations
Average period of a life WITH physical
limitations
Average life expectancy
2010 70.4 9.2 79.6 73.6 12.8 86.4 Source: Ministry of Health, Labour and Welfare
(b) Certification Rate of Needed Long-Term Care in 2011 By Age Group
786718
614
449
263
145
23 4384
128 129 1082.9 6
13.628.4
49.1
74.5
0
10
20
30
40
50
60
70
80
90
100
0
100
200
300
400
500
600
700
800
900
65-69 70-74 75-79 80-84 85-89 90-
Population Number of People Certified Certification Rate(ten thousand) (%)
Source: “Survey of Long-Term Care Benefit Expenditures”, Ministry of Health, Labour and Welfare; Ministry of Internal Affairs and Communications
(7) Long-Term Care Expenses
(Age) 40
(Years)
V Addressing the issues
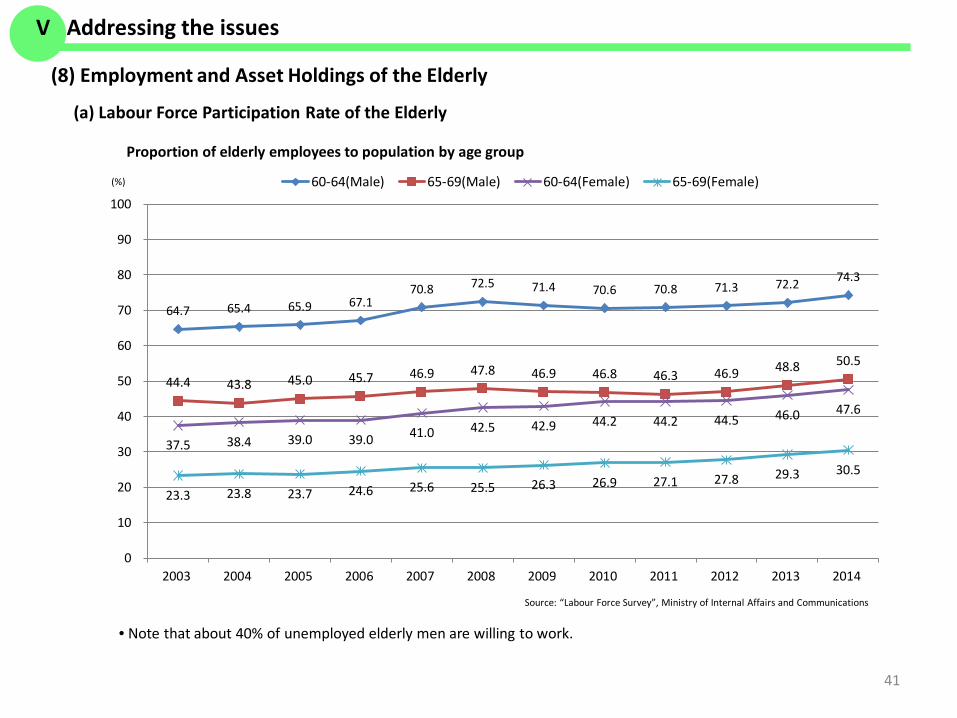
64.7 65.4 65.9 67.170.8 72.5 71.4 70.6 70.8 71.3 72.2 74.3
44.4 43.8 45.0 45.7 46.9 47.8 46.9 46.8 46.3 46.9 48.8 50.5
37.5 38.4 39.0 39.0 41.0 42.5 42.9 44.2 44.2 44.5 46.0 47.6
23.3 23.8 23.7 24.6 25.6 25.5 26.3 26.9 27.1 27.8 29.3 30.5
0
10
20
30
40
50
60
70
80
90
100
2003 2004 2005 2006 2007 2008 2009 2010 2011 2012 2013 2014
60-64(Male) 65-69(Male) 60-64(Female) 65-69(Female)
(a) Labour Force Participation Rate of the Elderly
Proportion of elderly employees to population by age group
Source: “Labour Force Survey”, Ministry of Internal Affairs and Communications
(%)
(8) Employment and Asset Holdings of the Elderly
• Note that about 40% of unemployed elderly men are willing to work.
41
V Addressing the issues

2.51
6.89
10.45
17.82
24.14 24.82
4.896.17
7.41 8.135.7
4.54
0
5
10
15
20
25
30
~29 30~39 40~49 50~59 60~69 70~
Savings(million yen)
Yearly income(million yen)
Amounts of Savings and Yearly income per Household by Age Group of Household Head
Source: “Family Income and Expenditure Survey (2013)”, Ministry of Internal Affairs and Communications
(million yen)
The Elderly
(b) Assets of the Elderly
(Age)
42
V Addressing the issues
43
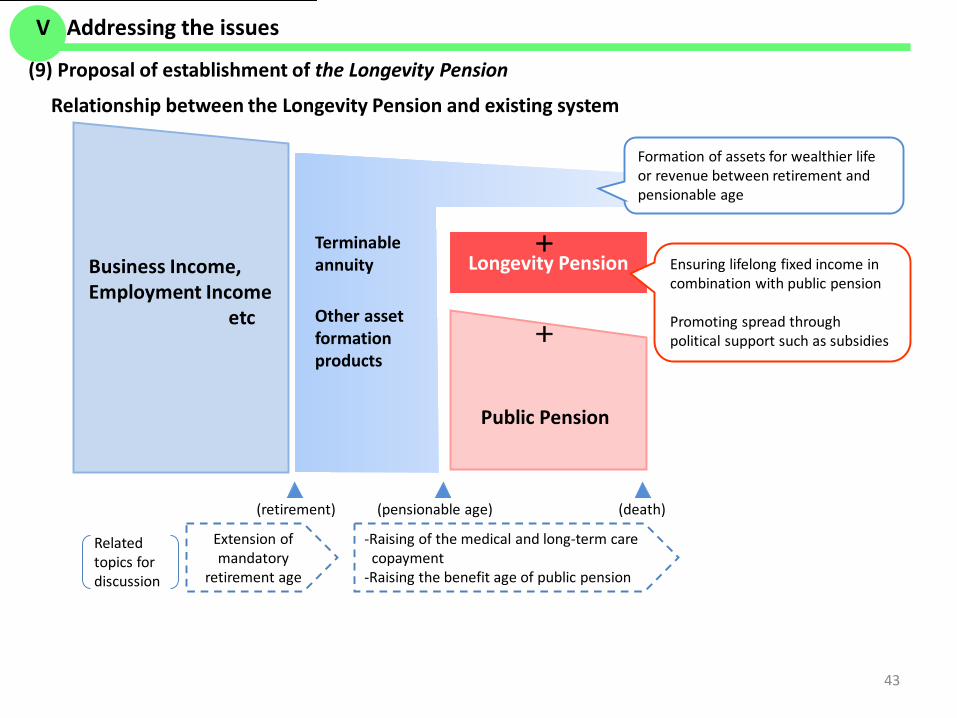
(9) Proposal of establishment of the Longevity Pension
Relationship between the Longevity Pension and existing system
Longevity Pension+
+
Public Pension
Terminable annuity
Other asset formation products
Business Income,Employment Income
etc
(retirement) (pensionable age) (death)
Formation of assets for wealthier life or revenue between retirement and pensionable age
Ensuring lifelong fixed income in combination with public pension
Promoting spread through political support such as subsidies
Related topics for discussion
Extension of mandatory
retirement age
-Raising of the medical and long-term care copayment
-Raising the benefit age of public pension
V Addressing the issues
VI The Life Insurance Association of Japan
VI The Life Insurance Association of Japan
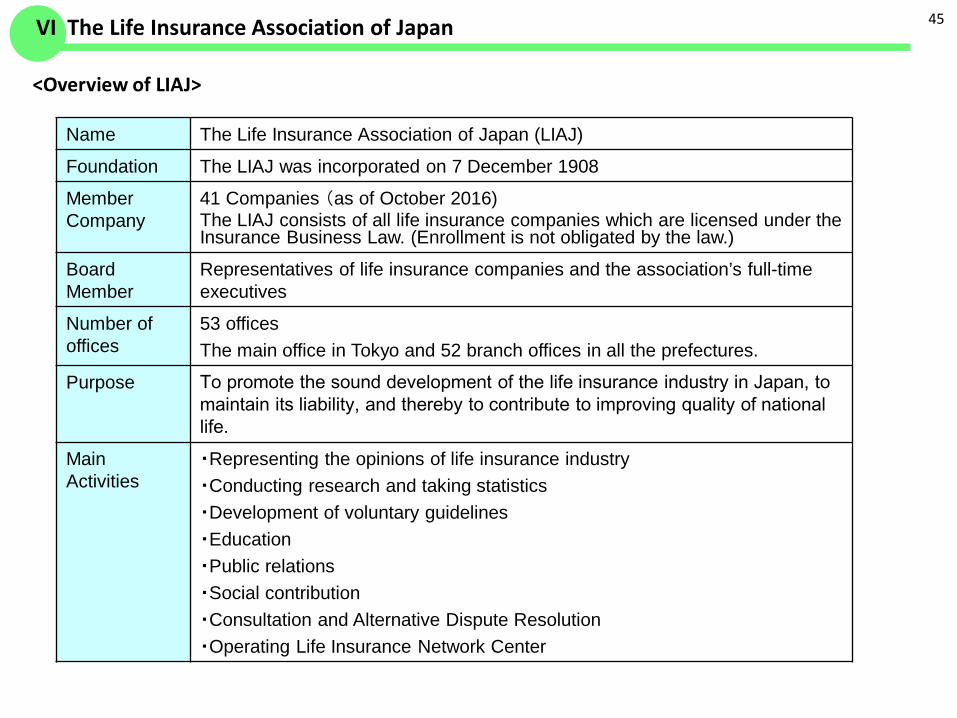
<Overview of LIAJ>
45
Name The Life Insurance Association of Japan (LIAJ)
Foundation The LIAJ was incorporated on 7 December 1908
Member Company
41 Companies (as of October 2016)The LIAJ consists of all life insurance companies which are licensed under the Insurance Business Law. (Enrollment is not obligated by the law.)
Board Member
Representatives of life insurance companies and the association’s full-time executives
Number of offices
53 officesThe main office in Tokyo and 52 branch offices in all the prefectures.
Purpose To promote the sound development of the life insurance industry in Japan, to maintain its liability, and thereby to contribute to improving quality of national life.
Main Activities
・Representing the opinions of life insurance industry・Conducting research and taking statistics・Development of voluntary guidelines・Education・Public relations・Social contribution・Consultation and Alternative Dispute Resolution ・Operating Life Insurance Network Center
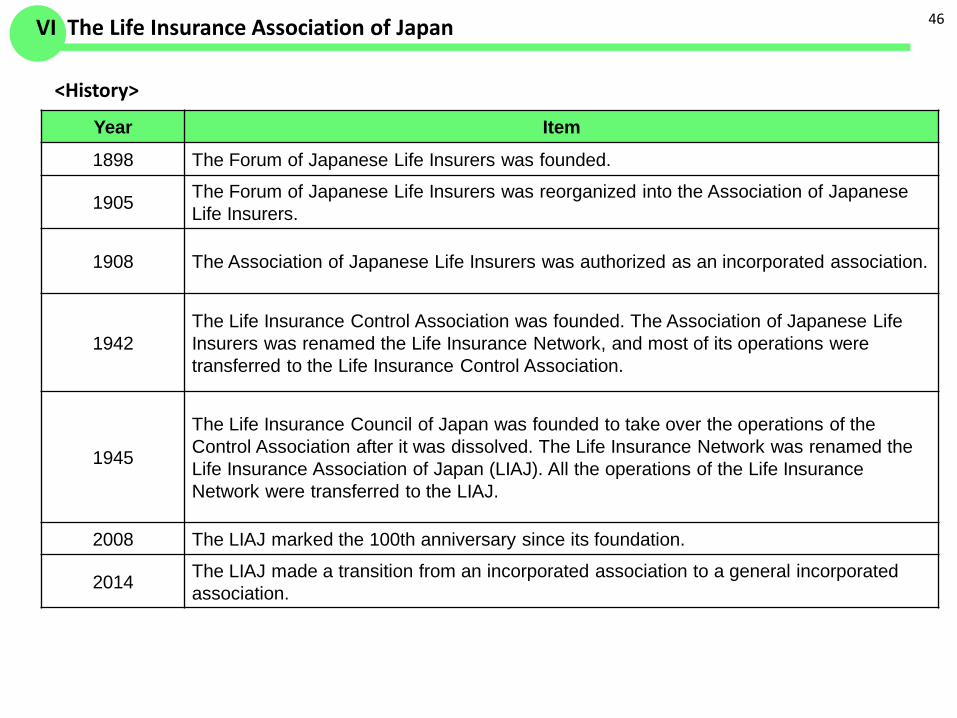
Year Item
1898 The Forum of Japanese Life Insurers was founded.
1905 The Forum of Japanese Life Insurers was reorganized into the Association of Japanese Life Insurers.
1908 The Association of Japanese Life Insurers was authorized as an incorporated association.
1942The Life Insurance Control Association was founded. The Association of Japanese Life Insurers was renamed the Life Insurance Network, and most of its operations were transferred to the Life Insurance Control Association.
1945
The Life Insurance Council of Japan was founded to take over the operations of the Control Association after it was dissolved. The Life Insurance Network was renamed the Life Insurance Association of Japan (LIAJ). All the operations of the Life Insurance Network were transferred to the LIAJ.
2008 The LIAJ marked the 100th anniversary since its foundation.
2014 The LIAJ made a transition from an incorporated association to a general incorporated association.
<History>
46VI The Life Insurance Association of Japan
Life Insurance Consultation
Center
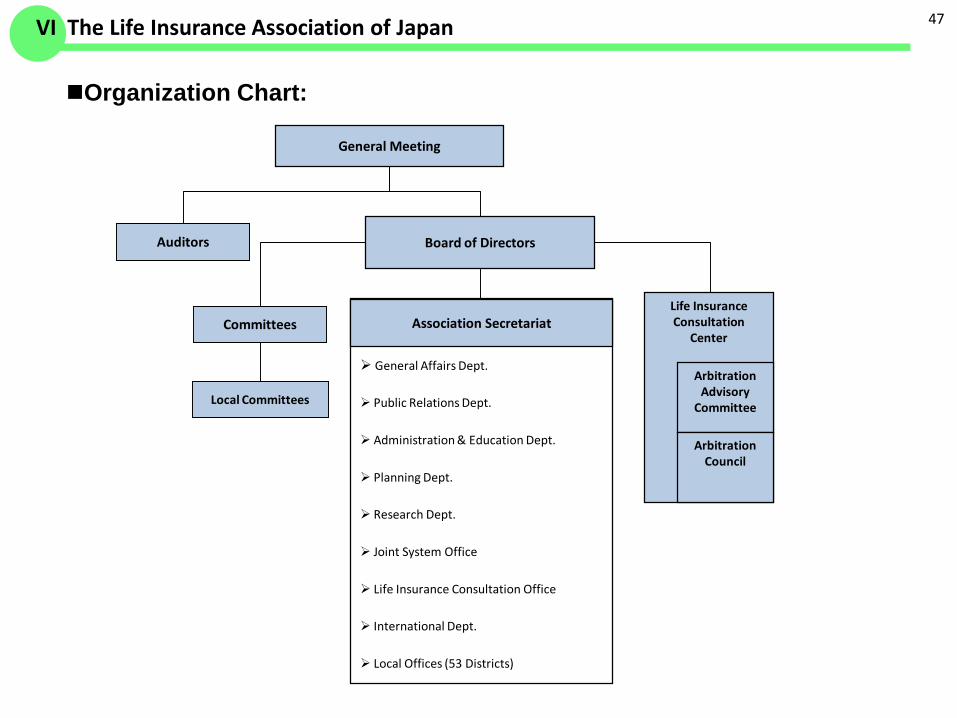
Organization Chart:
General Meeting
Board of Directors
Arbitration Advisory
Committee
ArbitrationCouncil
Auditors
Committees
Local Committees
Association Secretariat
General Affairs Dept.
Public Relations Dept.
Administration & Education Dept.
Planning Dept.
Research Dept.
Joint System Office
Life Insurance Consultation Office
International Dept.
Local Offices (53 Districts)
47VI The Life Insurance Association of Japan
48
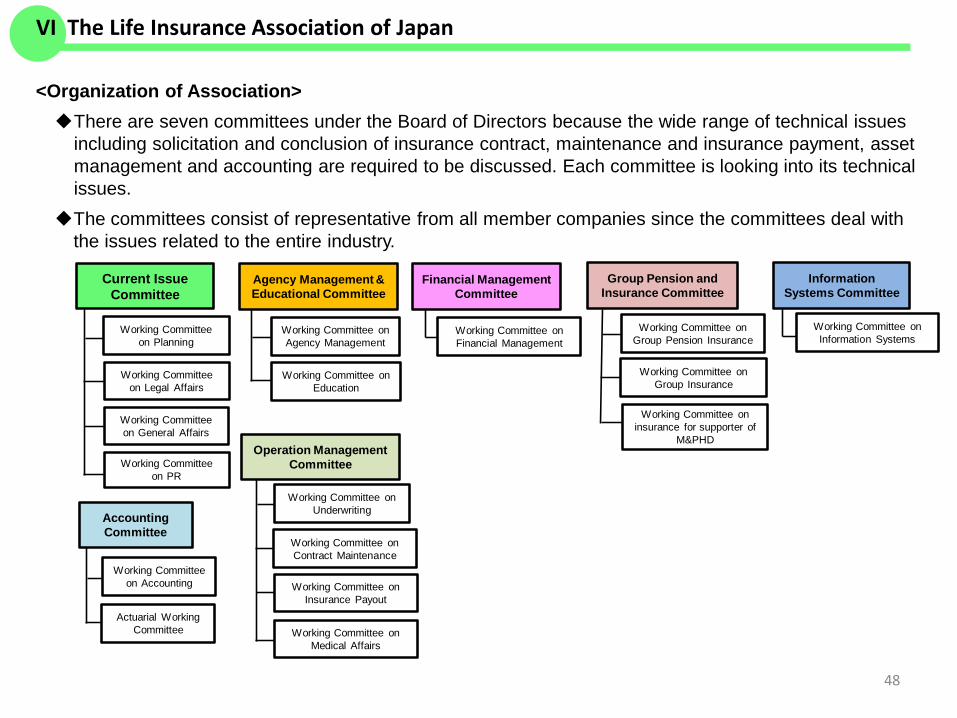
<Organization of Association>There are seven committees under the Board of Directors because the wide range of technical issues
including solicitation and conclusion of insurance contract, maintenance and insurance payment, asset management and accounting are required to be discussed. Each committee is looking into its technical issues.
The committees consist of representative from all member companies since the committees deal with the issues related to the entire industry.
Group Pension and Insurance Committee
Information Systems Committee
Accounting Committee
Operation Management Committee
Current Issue Committee
Agency Management & Educational Committee
Financial Management Committee
Working Committee on Planning
Working Committee on Legal Affairs
Working Committee on General Affairs
Working Committee on PR
Working Committee on Education
Working Committee on Agency Management
Working Committee on Financial Management
Working Committee on insurance for supporter of
M&PHD
Working Committee on Group Insurance
Working Committee on Group Pension Insurance
Working Committee on Information Systems
Actuarial Working Committee
Working Committee on Accounting
Working Committee on Medical Affairs
Working Committee on Insurance Payout
Working Committee on Contract Maintenance
Working Committee on Underwriting
VI The Life Insurance Association of Japan
49
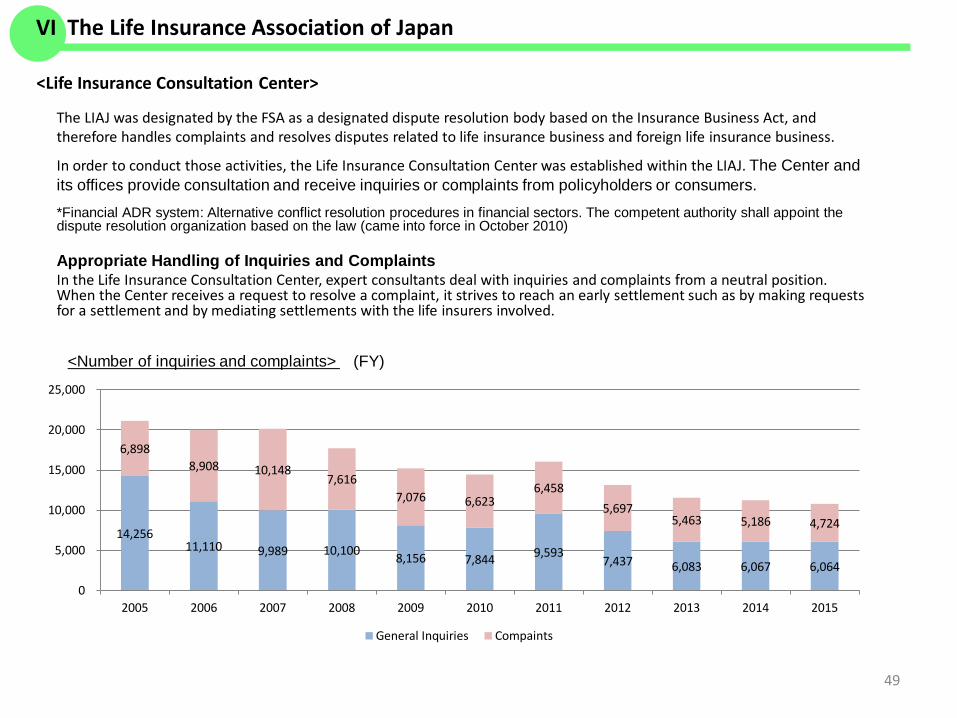
<Life Insurance Consultation Center>
The LIAJ was designated by the FSA as a designated dispute resolution body based on the Insurance Business Act, and therefore handles complaints and resolves disputes related to life insurance business and foreign life insurance business.
In order to conduct those activities, the Life Insurance Consultation Center was established within the LIAJ. The Center and its offices provide consultation and receive inquiries or complaints from policyholders or consumers.
*Financial ADR system: Alternative conflict resolution procedures in financial sectors. The competent authority shall appoint the dispute resolution organization based on the law (came into force in October 2010)
Appropriate Handling of Inquiries and ComplaintsIn the Life Insurance Consultation Center, expert consultants deal with inquiries and complaints from a neutral position. When the Center receives a request to resolve a complaint, it strives to reach an early settlement such as by making requestsfor a settlement and by mediating settlements with the life insurers involved.
<Number of inquiries and complaints> (FY)
VI The Life Insurance Association of Japan
14,256 11,110 9,989 10,100 8,156 7,844 9,593
7,437 6,083 6,067 6,064
6,898 8,908 10,148
7,616 7,076 6,623
6,458 5,697
5,463 5,186 4,724
0
5,000
10,000
15,000
20,000
25,000
2005 2006 2007 2008 2009 2010 2011 2012 2013 2014 2015
General Inquiries Compaints
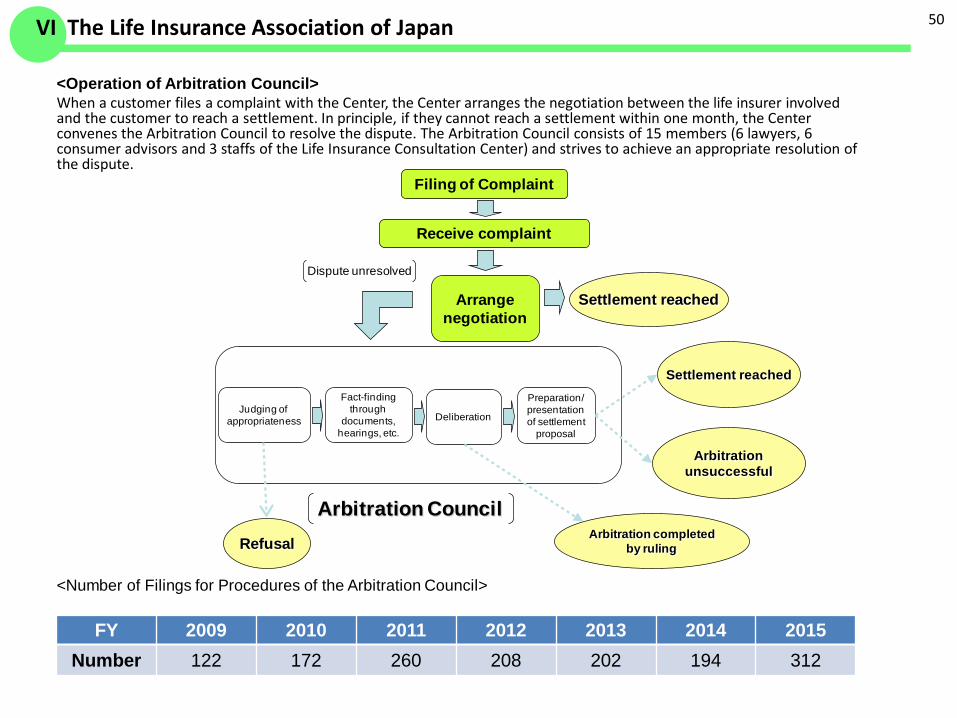
<Operation of Arbitration Council>When a customer files a complaint with the Center, the Center arranges the negotiation between the life insurer involved and the customer to reach a settlement. In principle, if they cannot reach a settlement within one month, the Center convenes the Arbitration Council to resolve the dispute. The Arbitration Council consists of 15 members (6 lawyers, 6 consumer advisors and 3 staffs of the Life Insurance Consultation Center) and strives to achieve an appropriate resolution of the dispute.
<Number of Filings for Procedures of the Arbitration Council>
50
Arbitration Council
Filing of Complaint
Judging of appropriateness
Receive complaint
Arrange negotiation
Settlement reached
Dispute unresolved
Fact-finding through
documents, hearings, etc.
Deliberation
Preparation/presentation of settlement
proposal
RefusalArbitration completed
by ruling
Settlement reached
Arbitration unsuccessful
VI The Life Insurance Association of Japan
FY 2009 2010 2011 2012 2013 2014 2015Number 122 172 260 208 202 194 312