Embed Size (px)
Citation preview

Overview of Micronutrients: Iron and Folate
Omar Dary USAID–Nutrition Division/HIDN/GH
2016 Armenian
Nutrition Conference
OD-2016-09
Yerevan, Armenia
May 30th, 2016

• I am not an expert in iron and folate, but only a professional working in public health programs, who is trying to understand the reasons and origin of current recommendations.
• If something that I say does not make sense, please tell us so, and we would discuss an appropriate compromise, as our “truths” (i.e. recommendations) are limited by the advance in the reduction of our ignorance.
• I am happy to be here for learning of the science and experience of many others, especially those working with realities.
1
Disclaimers

Outline
1. What are the consequences of iron and folate deficiency? Examples of corrections.
2. Are there adverse effects due to excesses?
3. Are there biomarkers of iron and folate status? 4. How much is too little and how much is too much?
5. Then, how to add additional amounts in a safe and efficacious manner?
6. Questions and discussion. 22

3
Causes of anemia
ANEMIA
Anemia of Disease
Nutritional Anemia
IRON DEFICIENCY
Folate Deficiency
Vit B12 Deficiency
HIV/AIDS
Other
Bacteremia
Genetic Disorders
Sickle Cell Disease
G6PD Deficiency
Other hemoglobinopathies
Schistosomiasis
Parasitic Infection
Hookworm
Malaria
Other Factors Eg. Sex
Vit A Deficiency
Others
Figure produced by LM Neufeld y B Cameron, Micronutrient Initiative

• Tiredness, lack of energy • Deterioration in
detoxifying process • Impairment of the
immunological response • Irreversible cognitive
retardation (< 2 years old)
• Anemia • Maternal mortality (when
severe)
Consequences of iron deficiency
4

5 ODM-2012-6-USAC
An example of benefit by increasing iron intake in an iron-deficient population
5
Pregnant women (96 mg Fe/day; 400 µg Folic Acid/day)
Placebo + Iron
Placebo - 24 % - 29 %
+ Iron - 16 % - 19 %
Source: Angulo Barroso et al., Pediatrics 2016; 137: e20153547.
Percent of low scores of motor development at 9 months under different scenarios of iron supplementation (Hebei, China)
Infa
nts
(1 m
g Fe
/kg
from
6 w
eeks
)

6 ODM-2012-6-USAC
Iron homeostasis during pregnancy
6
Source: Cao & O’Brien, Nutr Rev 2013; 7135-51.
• Women should start pregnancy with 500 mg of stored iron • During pregnancy: + 480-1150 mg Fe • Transfer to fetus during the last 10 weeks of gestation; 270 mg Fe; 5.6 mg
Fe/day • Delayed cord clamping: until cord stops pulsing: 30% more blood volume;
60 % more iron in RBC; 75 mg iron • During third trimester of pregnancy: 3-8 mg Fe/day • Iron intake during third trimester of pregnancy? 5% bioavailability: 60 – 160 mg Fe/day 10 % bioavailability: 30 – 80 mg Fe/day 20 % bioavailability: 15 – 40 mg Fe/day • One iron receptor in human placenta (hemochromial; depend on transferrin-
bound Fe), the proton-coupled folate transporter (PCFT), shows two orders of magnitude higher affinity for folate.

Roles of folate (and other vitamins)
FA
DHF
10-CHO-THF
Purinas-CH2-
dUMP
DNA & RNA
CH3-dTMP
DNA
Homocysteine
Methionine-CH3
SA-Hcys
SAM-CH3
DIET
Proteins
DNA, RNA Lipids, hormones proteins DNA, RNA Lipids, hormones Proteins - CH3
Ser-CH2OH
Gly
Cystathionine Cysteine Ser-CH2OH
THF
5,10-CH2-THF
5-CH3-THF
Niacin
Niacin
B2 B12
B2
B6
B6
B6
Adenosine
7

Neural tube defects within 28 days after conception. Incapacities: • Leg paralysis • Hydrocephaly • Bad control of bladder and intestinal evacuations • Learning difficulties
Modified from Jorge Rosenthal
Consequences of folate (and/or B12 deficiencies)
8 8
Other consequences: • Fetal growth retardation • Low birth weight • Pre-term delivery • Macrocytic anemia • Risk to cancers: leukemia, lymphoma, colorectal, breast, prostate

Country Year Control + Min. & Vit. No Folic Acid
+ Min. & Vit. + Folic Acid
+ Folic Acid Reference
U.K. 1976 and before 470 - 70
[360 µg/d] - 1
Inter-country
1983-91 423 272 117 [4000 µg/d]
78 [4000 µg/d]
2
Ireland 1981-88 291 112 0 [360 µg/d]
0 [360 µg/d]
3
References: 1. Smithells et al., Lancet 1983; i:1027-1031. 2. MRC. Lancet 1991; 338:131-137. 3. Kirke et al., Arch Dis Child 1992; 1442-1446
Folic acid reduces recurrence of NTDs
NTD/10,000 pregnancies
9

0
10
20
30
40
50
60
70
0 200 400 600 800 1000
Additional Folic Acid (micrograms/day)
NTD/
10,0
00
0, 29
800, 0
Hungary
400,7
0, 67
North China
0,10
400,6South China
“We suggest that the trial of prevention now underway in China should be modified to contain … a low-dose arm of 400 µg or 200 µg of folic acid.” *
References: Hungary: Czeizel and Dudás N Engl J Med 1992;327:1832. China: Berry et al. N Engl J Med 1999;341:1485. * Scott JM et al. Lancet 1991;338:505.
n ∼ 2000
n ∼ 8,000 n ∼ 50,000
Prevention of first occurrence of NTDs
10

11
Impact of folic acid (2 mg/kg) through wheat flour in Chile (200 g/day of flour intake)
02468
101214161820
NTD
/10.
000
birth
s Taken from Eva Hertrampf, INTA, Chile

What other changes occurred in the Chilean population?
12
Source: Hirsch et al., J Nutr 2011.
0
5
10
15
20
25
30
35
40
4 6 8 10 12 14 16 18 20
before
after
Serum folate (µg/L*)
* µg/L x 2.266 = nmol/L
%
Def. Risk NTD Excess

Association between blood-folate and NTDs
0
10
20
30
40
0 5 10 15 20 25 30 35 40 45
Plasma folate (nmol/L)
NT
D In
cid
ence
/10,
000
Reference: Daly LE et al.,J Am Med Sci 1995;274:1698-1762.
Data from Ireland.
0
20
40
60
80
0 500 1000 1500 2000
RBC folate (nmol/L)
NT
D In
cid
ence
/10,
000
13

Serum-folate changes in USA and Chile
Adapted from Pfeiffer et al., Am J Clin Nutr 2005; 82:442-50; and Hertrampf et al., J Nutr 2003; 133:3166-69.
* Kelly et al. Am J Clin Nutr 1997;65:1790.
0
20
40
60
80
100
120
0 20 40 60 80
[plasma folate] (nmol/L)
% C
umul
ated
USA-before
USA-after
Chile-before
Chile-after
MedianMinimum Excessive
Minimum: 15.9 nmol/L Median: 25.0 nmol/L
Excessive: 45.3 nmol/L
Metabolic limit for folic acid:
266 µg/dose *
14

15
Median of serum folate (nmol/L) before and after flour fortification with folic acid
Countries Chile USA C.Rica W.Bank Ecuador Before 9 10 22 18.5-23.8
14 After 38 22 25 -
Women of child-bearing age
However, folic acid is being promoted in addition to the provision of dietary folate, as well as it is incorporated into MNP for children. Do we know that these additional amount are needed? Do we know if those are safe*?
Countries Ecuador Before
25.4 After
Children 1-5 years old Reference: National Survey of Nutrition of
Ecuador, 2013.
See: Oppenheimer & Cashin. Transactions of the Royal Society of Tropical Medicine and Hygiene 1986; 80, 169–171; Metz J. Food Nutr Bull 2007; 28(4 Suppl):S540-549.

Meta-Analysis of Trials of Iron +/- Folic Acid for Prevention or Treatment of Anemia
• All malaria settings RR 95% CI – Any parasitemia 1.13 1.01 - 1.26
• Settings with no routine malaria surveillance
– Clinical Malaria RR 95% CI Pemba 1.16 1.00 - 1.34 Five other trials 1.16 0.43 - 1.45 Total 1.16 1.03 - 1.31
Source: Ojukwu, et al, Cochrane 2009
Slide from: Robert Black, JHU, 2015
16

Adverse negative consequence of supplying iron: Severity of diarrhea in
pre-schoolers from Pakistan
17
Source: Soofi et al., Lancet 2013; 382:29-40.
Age (6-18 months)
Control MNP without zinc MNP with zinc
Incidence* RR Incidence* RR Incidence RR
Any type 3.73 1.0 4.16 1.05 (0.04-1.17)
4.16 1.05 (0.04-1.17)
Diarrhea with blood 0.08 1.0 0.16 1.63 (1.12-2.39)
0.17 1.88 ( 1.29-2.74)
Severe diarrhea (>6/d) 1.31 1.0 1.94 1.28
(1.03-1.57) 1.69 1.17
(0.95-1.45)
Persistent diarrhea 0.06 1.0 0.10 1.41 (0.87-2.28)
0.09 1.33 (0.82-2.16)
* Incidence per children-years

18 ODM-2012-6-USAC
Excessive iron supply favor pathogenic intestinal bacteria in Kenyan children
Source: Jaeggi et al., doi:10.1136/gutjnl-2014-307720 18

Probable adverse effects due to excess of folic acid
1996-1998
1997-2000
Reference: Mason J, Dickstein A, Jacques P, Haggarty P, Selhub J, Dallale G, Rosemberg I. Cancer Epidemiol Biomarkers Prev 2007; 16(7).
Other potential risks: • Masking of megaloblastic
anemia, but not other consequences of vitamin B-12 deficiency.
• Antagonist of some anti-malaria drugs (probable high levels of folic acid are required)
• Antagonist of anti-cancer medications, and eczema treatment.
• Prostate cancer.
19

The risk of unbalances
Serum folate <7 nmol/L Deficiency
Serum folate >46 nmol/L
Supra-physiological
Vit B-12 <148 pmol/L
Deficiency
B-12<148pmol/l SF>46nmol/L
Sanchez et al. Rev Med Chil 2010;938:44-52
0
5
10
15
20
25
(%
)
6.1
15.9
0.1 1.0
Risk?
Taken from Eva Hertrampf, INTA, Chile
20

Understanding biomarkers associated to nutrients
21
Amount consumed x [Nutrient] = Additional intake
FUNCTION (Tissues)
STATUS (Metabolic biomarkers)
EXPOSURE (Biomarkers of intake)
EFFECTS (Physiology changes)
Total bio-form Basal bio-form Additional bio-form
Impact requires: Need + Additional micronutrient intake + Coverage
[BIOAVAILABILITY
NUTRIENT BIOEFFICACY → &
BIOCONVERSION]

Iron Folate
IQ, endurance NTD
Anemia Anemia,
p-homocysteine
Serum- Ferritin Soluble-TfR
RBC-folate
- Serum-folate
Sens
itivi
ty
Con
foun
ding
Fac
tors
Spec
ifici
ty
FUNCTION (Tissues)
STATUS (Metabolic biomarkers)
EXPOSURE (Biomarkers of intake)
EFFECT (Physiology changes)
Micronutrient indicators: Assessing needs and impact
22
What of these are being used?

23 ODM-2012-6-USAC
Prevalence of iron deficiency in pre-schoolers using two biomarkers
Source: Namaste et al. (SPRING/USAID) Unpublished data of the BRINDA project.
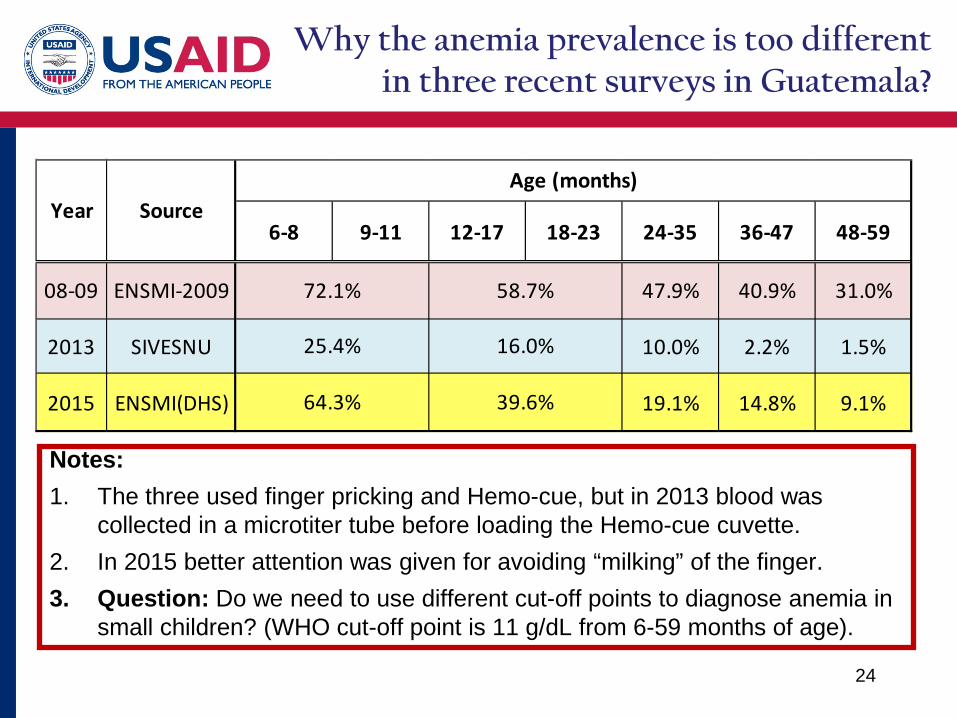
Why the anemia prevalence is too different in three recent surveys in Guatemala?
24
6-8 9-11 12-17 18-23 24-35 36-47 48-59
08-09 ENSMI-2009 47.9% 40.9% 31.0%
2013 SIVESNU 10.0% 2.2% 1.5%
2015 ENSMI(DHS) 19.1% 14.8% 9.1%
Year SourceAge (months)
72.1% 58.7%
16.0%
64.3% 39.6%
25.4%
Notes: 1. The three used finger pricking and Hemo-cue, but in 2013 blood was
collected in a microtiter tube before loading the Hemo-cue cuvette. 2. In 2015 better attention was given for avoiding “milking” of the finger. 3. Question: Do we need to use different cut-off points to diagnose anemia in
small children? (WHO cut-off point is 11 g/dL from 6-59 months of age).

Cut-off of serum/plasma and RBC folate
See: Dary O. Nutritional interpretations of folic acid interventions. Nutr Rev 2009; 67:235-244.
Variable
Negative balance
(megaloblastic anemia)
Increment of homocysteine
Occurrence of NTDs
Supra-physiological
Serum Folate (nmol/L)* < 7.0 < 10.0 < 15.9 ≥ 45.3
RBC folate (nmol/L)* < 305 < 340 < 906 ?
DFE (µg/day) < 205 < 294 < 474 ≥ 1370
Folic Acid (µg/day)** < 120 < 173 < 279 ≥ 806
** Folic acid = DFE/ 1.7 25
* µg/L = nmol/L / 2.266

Variation of serum folate along the life course (years) in USA*
26
Source: Bailey et al. From NHANES, 2003-2006. J Nutr 2015; doi: 10.3945/jn.114.206599.. nmol/L = µg/L x 2.226
______ Females
------ Males

27 Figure modified from Institute of Medicine, the Academies of Science, USA..
Population minimum
Individual average
Population safety
How much is too little, and how much is too much? (adults)

28 Figure modified from Institute of Medicine, the Academies of Science, USA.. EAR, RDA/RNI,
UL values are a combination from WHO and IOM.
320, 188
420, 247
1000 Folate or folic acid: µg/d
Dietary reference intakes (DRI) of iron and folate for healthy adult females
Iron (mg/day)
Bioav. EAR RDA
5 % 25.5 58.8
10 % 13.2 29.4
20 % 6.6 14.7
UL 45 mg/day

29
Population coverage
Micronutrient content per serving size
Target fortification: Complementary foods, RUTF, RUSF, LNS
Mass fortification: flours, oil, sugar, milk, salt, rice
Supplementation: including MNP for home “fortification”
Dietary Diversity (“Nutrition”-Sensitive) – Including breast-feeding
Strategies for increasing micronutrient intakes
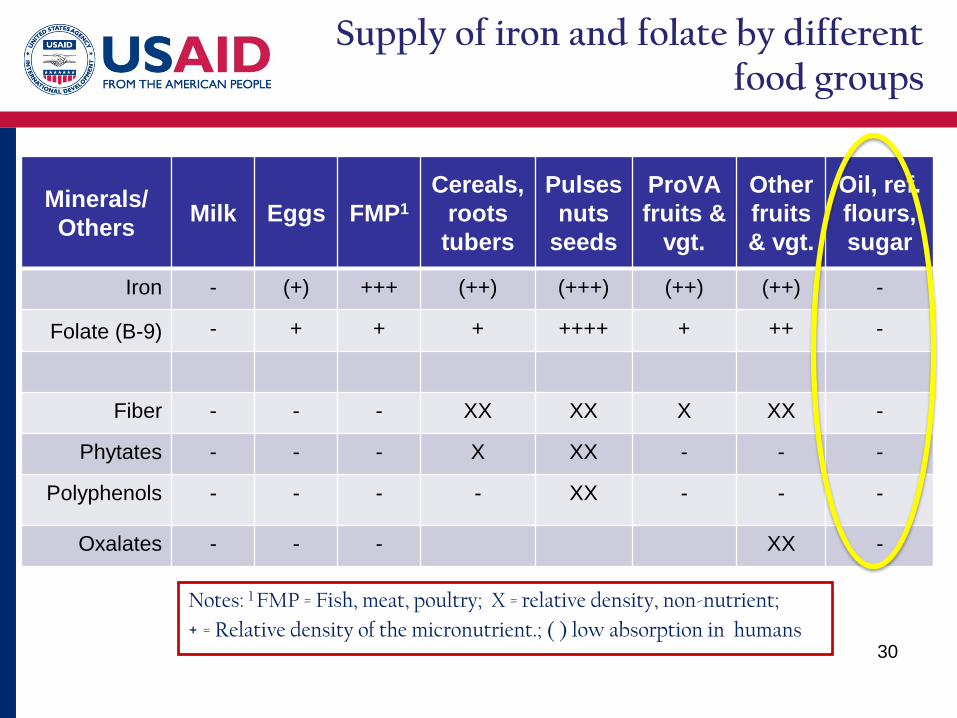
Supply of iron and folate by different food groups
Minerals/ Others Milk Eggs FMP1
Cereals, roots
tubers
Pulses nuts
seeds
ProVA fruits &
vgt.
Other fruits & vgt.
Oil, ref. flours, sugar
Iron - (+) +++ (++) (+++) (++) (++) -
Folate (B-9) - + + + ++++ + ++ -
Fiber - - - XX XX X XX -
Phytates - - - X XX - - -
Polyphenols - - - - XX - - -
Oxalates - - - XX -
30
Notes: 1 FMP = Fish, meat, poultry; X = relative density, non-nutrient; + = Relative density of the micronutrient.; ( ) low absorption in humans

Comparison of micronutrient- delivering strategies
31
Characteristic Diet Food Fortification Supplementation
Principle Increase nutrient content through selection and appropriate combination of foods
Incorporation of micronutrients to the edible vehicles during the manufacturing process
Syrups/tablets/powders of micronutrients consumed with/without foods (home- “fortification”)
Impact Additional quantity and quality of the supplied micronutrients (very little to do with the mechanism of delivery)
PROGRAMMATIC EFFICIENCY (Sustainability)
Feasible √ √√ √√√
Easy to deliver √√ √√√ √
Accessed by consumers √√ √√√ √
Practical to monitor √ √√ √√√
Viable total cost. √√√ √√ √


![Prevalence of Iron Deficiency and Iron Deficiency Anemia in … · 2017. 8. 30. · At that mee[6] t-ing, a new method to provide micronutrients (including iron) to populations at](https://img.pdfslide.net/doc/110x75/6130d0f81ecc5158694456a6/prevalence-of-iron-deficiency-and-iron-deficiency-anemia-in-2017-8-30-at-that.jpg)