Embed Size (px)
Citation preview

Overview of P6 release 8Risk Register
DRMcNatty & Associates, Inc.T E C H N O L O G Y F O R M A N A G I N G P R O J E C T S
Risk Register
By
Brian Criss, PSP
DRMcNatty & Associates, Inc.

Agenda
• Overview of P6 r8 Risk Module
• Functionality of Risk Register
• Administration of Risk Data
DRMcNatty & Associates, Inc.T E C H N O L O G Y F O R M A N A G I N G P R O J E C T S
• Risk Scoring Overview
• Questions

Overview of P6 Risk Module
• P6 release 8 provides for a robust risk register
with the EPPM solution (web)
– Not a risk simulator, but a RISK REGISTER
– Targeted for use in identifying, prioritizing and
DRMcNatty & Associates, Inc.T E C H N O L O G Y F O R M A N A G I N G P R O J E C T S
– Targeted for use in identifying, prioritizing and
tracking risks associated with Projects.
– Provides text fields for detailed descriptions of
elements associated with Risks.
– Contains features and functions for calculating
individual Risk Score.

Risks in
P6 v7
DRMcNatty & Associates, Inc.T E C H N O L O G Y F O R M A N A G I N G P R O J E C T S
Limited Features and Functions

Project Risks in P6
DRMcNatty & Associates, Inc.T E C H N O L O G Y F O R M A N A G I N G P R O J E C T S

Not To Be Confused with Primavera Risk Analysis
•Risk Simulation
•Full Life Cycle Risk
Analytics
•Robust Reporting
DRMcNatty & Associates, Inc.T E C H N O L O G Y F O R M A N A G I N G P R O J E C T S
•Robust Reporting
•Create “Risk
Adjusted” Schedules
P6 Risk Details
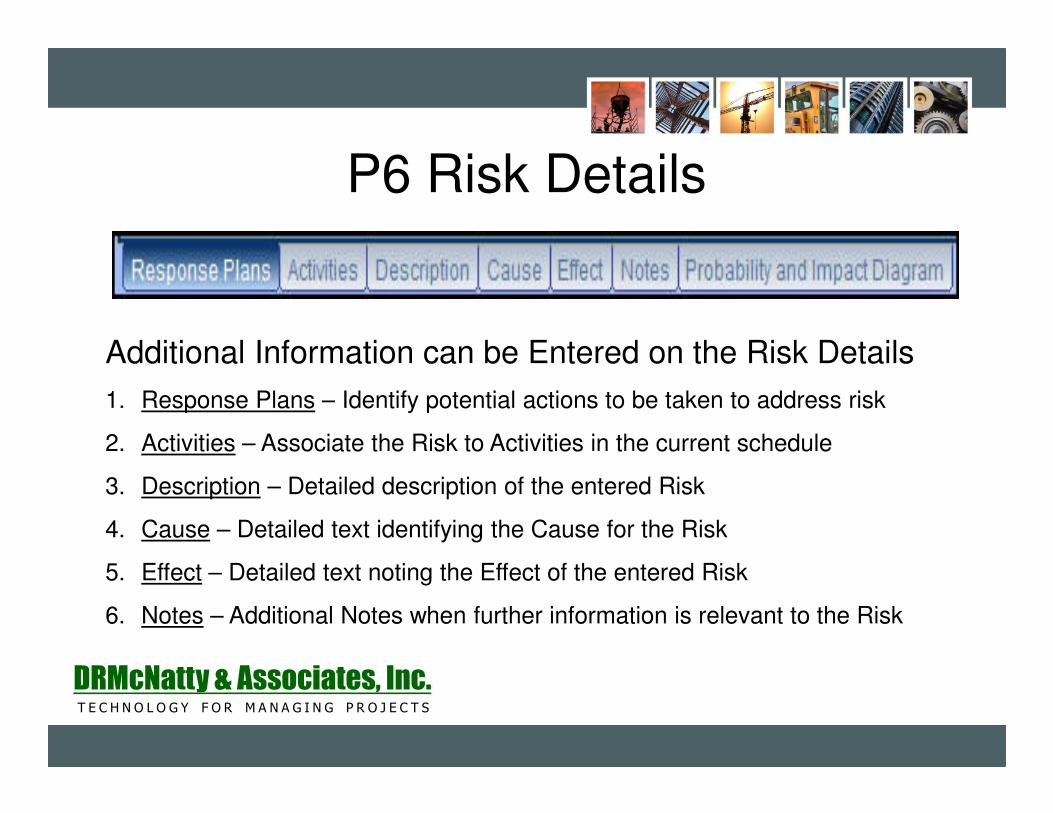
Additional Information can be Entered on the Risk Details
1. Response Plans – Identify potential actions to be taken to address risk
DRMcNatty & Associates, Inc.T E C H N O L O G Y F O R M A N A G I N G P R O J E C T S
1. Response Plans – Identify potential actions to be taken to address risk
2. Activities – Associate the Risk to Activities in the current schedule
3. Description – Detailed description of the entered Risk
4. Cause – Detailed text identifying the Cause for the Risk
5. Effect – Detailed text noting the Effect of the entered Risk
6. Notes – Additional Notes when further information is relevant to the Risk

Example of available columns for Risk Data
DRMcNatty & Associates, Inc.T E C H N O L O G Y F O R M A N A G I N G P R O J E C T S

Steps for Setup - Administration
• Under “Enterprise Data”– Create required Risk
Categories
– Create Risk Thresholds
DRMcNatty & Associates, Inc.T E C H N O L O G Y F O R M A N A G I N G P R O J E C T S
– Create Risk Thresholds
– Create Risk Scoring Matrices
– Create any necessary Risk
User Defined Fields

Risk Categories
1. Risk Categories allow for Organizations to develop custom definitions for classifying types of Risks.
2. Heirarchical Data Structure which can be
DRMcNatty & Associates, Inc.T E C H N O L O G Y F O R M A N A G I N G P R O J E C T S
Structure which can be used for grouping identified risks and can be used across multiple projects when all are open or in a portfolio dashboard.

Create Risk Thresholds
within P6.
Risk Thresholds
are used in the
DRMcNatty & Associates, Inc.T E C H N O L O G Y F O R M A N A G I N G P R O J E C T S
are used in the calculation of a Risk Score

Risk Thresholds
• Risk Thresholds establish the value criteria for quantifying the risk element. Set the following Risk Thresholds for scoring purposes:
– Cost Thresholds - The cost impact if a risk occurs, defined as either a percentage of the project's planned cost (by percentage) or as a monetary value.
DRMcNatty & Associates, Inc.T E C H N O L O G Y F O R M A N A G I N G P R O J E C T S
– Time Thresholds - The amount of time the risk will increase or decrease the project schedule, defined as either a percentage of the project's planned duration (by percentage) or as a duration value (by value).
– Probability - The likelihood of a risk occurring.
– Tolerance - The acceptability or manageability of a risk on a project.
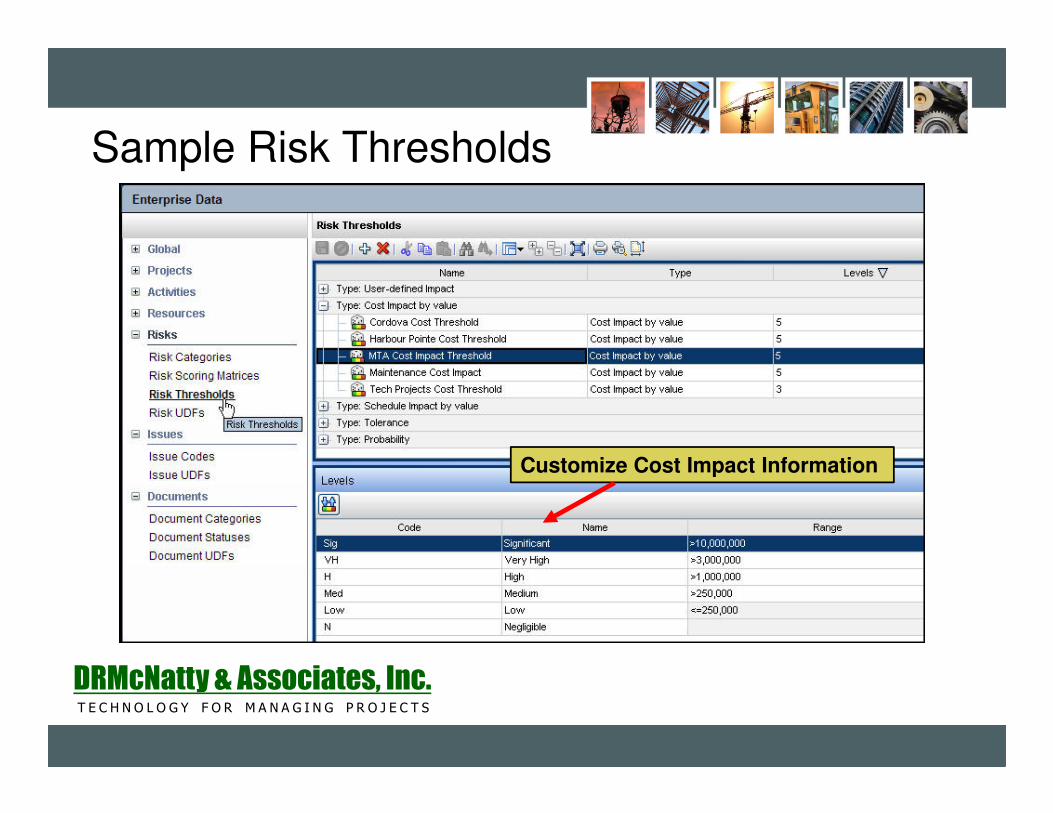
Sample Risk Thresholds
DRMcNatty & Associates, Inc.T E C H N O L O G Y F O R M A N A G I N G P R O J E C T S
Customize Cost Impact Information

Threshold Levels� Use the Threshold
Levels to determine
the number of
potential values for a
Probability, Impact, or
Tolerance.
� Values for Levels
DRMcNatty & Associates, Inc.T E C H N O L O G Y F O R M A N A G I N G P R O J E C T S
� Values for Levels
may be within range
of 2 – 9
� Threshold Levels will
be used in
conjunction with the
Risk Scoring Martix.

Risk Scoring MatrixA Risk Scoring Matrix is a qualitative analysis tool used to calculate the impact of the Risk.
1. Matrix Name and Size (5x5, 4x4, 3x3)
2. Assign Thresholds for Probability, Tolerance, and Impact
3. Determine a Risk Scoring Method
DRMcNatty & Associates, Inc.T E C H N O L O G Y F O R M A N A G I N G P R O J E C T S

Creating Risk
Matrix Size
DRMcNatty & Associates, Inc.T E C H N O L O G Y F O R M A N A G I N G P R O J E C T S

P6 will display only those Probability or Impacts which align with the Matrix size.
DRMcNatty & Associates, Inc.T E C H N O L O G Y F O R M A N A G I N G P R O J E C T S
For example, only Probability
Thresholds developed as Level 2
will be available for a Matrix size
of 2x3 (probability x impact).
Similarly, only Impacts created
as 3 Level will be available for
this TESTING…matrix.

Use Tolerance
Threshold to
determine color
values on PID
DRMcNatty & Associates, Inc.T E C H N O L O G Y F O R M A N A G I N G P R O J E C T S

Add Risks to Projects
• Project Risks can be added in 1 of 2 locations within P6 EPPM– EPS View – Enter Risk data directly from the project
details. Projects do not need to be open and basic
DRMcNatty & Associates, Inc.T E C H N O L O G Y F O R M A N A G I N G P R O J E C T S
information is available for entry (no risk details)
– Risk View – For open projects only enter risk
information and have access to additional details
such as Response Plans.

Enter Risk from EPS View
DRMcNatty & Associates, Inc.T E C H N O L O G Y F O R M A N A G I N G P R O J E C T S

Enter data from Risk View
DRMcNatty & Associates, Inc.T E C H N O L O G Y F O R M A N A G I N G P R O J E C T S
Adding Risk with Project Open provides access to the Risk Details

Risk Response Plans
1. Once you have identified a risk for your project, you can then create a risk response plan to help manage the project risk.
2. A risk response plan includes a name for the plan and response plan action items. You can create multiple risk response plans for a
DRMcNatty & Associates, Inc.T E C H N O L O G Y F O R M A N A G I N G P R O J E C T S
plan action items. You can create multiple risk response plans for a risk each with multiple response action items.
3. When you determine which plan will best meet the project needs, select the Active option next to the appropriate response plan. One response plan must always be active.

Sample Risk Response Plans
DRMcNatty & Associates, Inc.T E C H N O L O G Y F O R M A N A G I N G P R O J E C T S
Include additional information for the listed response plans such as start
and finish dates for items, thresholds (if applicable) or link the response plan to an activity in the project schedule (see next slide)

Associate Response Plan Actions to Scheduled Activities in the P6 Schedule
DRMcNatty & Associates, Inc.T E C H N O L O G Y F O R M A N A G I N G P R O J E C T S

Associate Risks with P6 Schedule Activities
DRMcNatty & Associates, Inc.T E C H N O L O G Y F O R M A N A G I N G P R O J E C T S
When a single project risk has a potential impact on multiple activities in the P6
schedule, use the “Activities” tab to link all scheduled activities which are or could
potentially be impacted by the identified risk.

Risk Scoring Methods• Highest Impact - The overall impact for a risk is set to the highest
of all the impacts assigned to the risk based on the probability of the risk.
• Average Impact - The overall impact is determined by calculating
the average of all impact values. This calculation will use the values
DRMcNatty & Associates, Inc.T E C H N O L O G Y F O R M A N A G I N G P R O J E C T S
the average of all impact values. This calculation will use the values of the Impact Levels in the Probability Impact Diagram (PID).
• Average Individual Impact - The overall impact is determined by
combining the value of each impact individually with the probability from the Probability and Impact Diagram. The total of all impact scores is then divided by the number of impacts.

Risk Score Example (Using Highest Impact)
Low=1 Medium=2 High=3 Very High=4 Sig=5
DRMcNatty & Associates, Inc.T E C H N O L O G Y F O R M A N A G I N G P R O J E C T S
Risk ID 375 – Significant Probability / Low Schedule Risk (6) / Significant Cost Risk (72)
New Risk – Medium Probability / High Schedule Risk (6) / Significant Cost Risk (24)

Risk Score Example (Using Average Impact)
Low=1 Medium=2 High=3 Very High=4 Sig=5
DRMcNatty & Associates, Inc.T E C H N O L O G Y F O R M A N A G I N G P R O J E C T S
Risk ID 375 – Low Sched. Imp. (1) / Sig. Cost Impact (5) = 6 divided by 2 (number of
impacts) = 3 / Severity 3 with Significant Probability = 18
New Risk – High Sched. Imp. (3) / Sig. Cost Impact (5) = 8 divided by 2 (number of
impacts) = 4 / Severity 4 with Medium Probability = 12

Risk Score Example (Using Average Individual Impact)
Low=1 Medium=2 High=3 Very High=4 Sig=5
DRMcNatty & Associates, Inc.T E C H N O L O G Y F O R M A N A G I N G P R O J E C T S
Risk ID 375 – Significant Probability & Low Schedule Risk = 6 / Significant Probability &
Significant Cost Risk = 72 / Total 78 and divide by 2 (number of Impacts) = 39
New Risk – Medium Probability & High Schedule Risk = 6 / Medium Probability &
Significant Cost Risk = 24 / Total 30 and divide by 2 (number of Impacts) = 15

Customize the PID to suit your
Organization
DRMcNatty & Associates, Inc.T E C H N O L O G Y F O R M A N A G I N G P R O J E C T S

Customize the Probability
Impact Diagram to satisfy
unique organizational
needs.
DRMcNatty & Associates, Inc.T E C H N O L O G Y F O R M A N A G I N G P R O J E C T S

Want to keep it simple?Users have full capability to add Risks to projects and track the text information for Cause,
Effect, Details, and Notes. Create Risk User Defined Fields to graphically indicate emphasis
and easy viewing of information. Use of the P6 Risk module does not require the use of the
scoring Thresholds and Matrix.
DRMcNatty & Associates, Inc.T E C H N O L O G Y F O R M A N A G I N G P R O J E C T S

In Summary1. P6 Risk module provides a simple and effective means
of tracking and prioritizing project Risks
2. Access to Risk functionality is available to EPPM (P6
Web).
3. Setup Risk Thresholds and create a Risk Scoring
DRMcNatty & Associates, Inc.T E C H N O L O G Y F O R M A N A G I N G P R O J E C T S
3. Setup Risk Thresholds and create a Risk Scoring
Matrix for the project.
4. View and communicate Risk information effectively for
all project stakeholders.
Start Simple…..Build Knowledge…..Create Solutions!

Questions?
DRMcNatty & Associates, Inc.T E C H N O L O G Y F O R M A N A G I N G P R O J E C T S
Questions?