Embed Size (px)
Citation preview
Transport
• Overview of policy instruments in the transport sector
• Samantha Morgan-Price, Ricardo Energy & Environment
1
© Ricardo plc 2017
© Ricardo plc 2017
Overview of transport policyOverview of Transport Sector, 15/10/2019
Samantha Morgan-Price
3October 2019Public © Ricardo plc 2019
• Transport and GHG emissions
• EU policy (EU car regs etc.)
• What can be done at national and regional level?
• Impacts of national policies (SULTAN modelling)
– Types of measures
– Effects of different policies
– Examples from MS
Introduction

4October 2019Public © Ricardo plc 2019
Transport
• Transport is a major contributor to the economy
• More than 9% of EU gross value added (the
contribution to
the economy).
• Transport services employ around 11 million people
• Major challenges in transport:
– Congestion: both road and air traffic
– Sustainability: transport still depends on oil for most
of its energy needs, which is environmentally and
economically untenable
– Air quality: transport is main driver of poor air quality
in the EU
– Infrastructure: the quality of transport infrastructure is
uneven across the EU
– Competition: the EU’s transport sector faces growing
competition from fast-developing transport markets in
other regions

5October 2019Public © Ricardo plc 2019
• Why transport’s impact is important (e.g. levels of emissions in EU)
– Transport represents almost a quarter of Europe's greenhouse gas emissions
Transport Emissions EU
Source: https://www.eea.europa.eu/data-and-maps/daviz/ghg-emissions-by-sector-in#tab-chart_1

6October 2019Public © Ricardo plc 2019
GHG Emissions by Transport Mode
Source: https://www.eea.europa.eu/data-and-maps/indicators/transport-emissions-of-
greenhouse-gases/transport-emissions-of-greenhouse-gases-11#tab-related-briefings

© Ricardo plc 2017
© Ricardo plc 2017
EU transport policy

8October 2019Public © Ricardo plc 2019
• Roadmap to a Single European Transport Area - Towards a
competitive and resource efficient transport system
• Targets:
– Emissions from transport sector (excluding shipping)
• By 2030 – reduce GHG emission by 20% compared with 2008
levels (+8 % compared with 1990 levels.)
• By 2050 – reduce GHG emissions by 60 % below levels of
1990
– Shipping:
• By 2050 – reduce GHG emissions by 40 %
Transport White Paper
• 10 % reduction compared with 2005 levels by 2020,
and a 30 % reduction by 2030.
Effort Sharing targets
Transport White paper 2011
9October 2019Public © Ricardo plc 2019
EU level measures
• Priority areas for action at EU-level:
– Increasing the efficiency of the transport system
– Speeding up the deployment of low-emission alternative energy for
transport,
– Moving towards zero-emission vehicles.
• Technical measures focusing on energy and fuel efficiencies:
– Performance Standards for Light-duty vehicles
– Car Labelling Directive
– Targets for Light-duty vehicles manufactures
– CO2 emission standards for heavy-duty vehicles
– Fuel Quality Directive

10October 2019Public © Ricardo plc 2019
• Cars and light commercial vehicles
• ~15% of the 2016 EU emissions
• EU legislation sets binding CO2 emission targets for the new car and van fleets.
– Applies to the EU fleet-wide average emission of these vehicles.
2015 car target:
– 130 g CO2/km (~5.6 litres per 100 km (l/100 km) of petrol or 4.9 l/100 km of diesel)
– Target was already reached in 2013
• 2021 car target:
– Cars: 95 g CO2/km (~4.1 l/100 km of petrol or 3.6 l/100 km of diesel)
• 2017 van target
– 175 grams of CO2 per kilometre (~ 6.6 l/100 km of diesel fuel)
• 2020 target
– 147 grams of CO2 per kilometre (47 g CO2/km correspond to around 5.5 l/100 km of
diesel)
If the average CO2 emissions of a manufacturer's fleet exceed its target in a
given year, the manufacturer has to pay an excess emissions premium for
each car or van registered.
Light-duty vehicles
11October 2019Public © Ricardo plc 2019
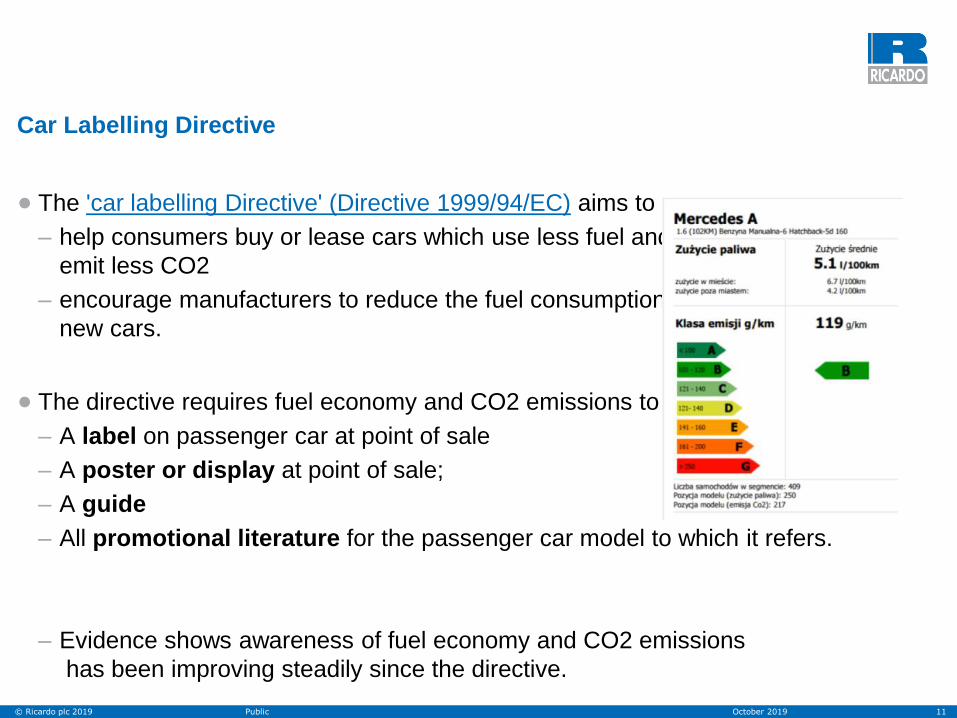
• The 'car labelling Directive' (Directive 1999/94/EC) aims to
– help consumers buy or lease cars which use less fuel and thereby
emit less CO2
– encourage manufacturers to reduce the fuel consumption of
new cars.
• The directive requires fuel economy and CO2 emissions to be displayed in:
– A label on passenger car at point of sale
– A poster or display at point of sale;
– A guide
– All promotional literature for the passenger car model to which it refers.
– Evidence shows awareness of fuel economy and CO2 emissions
has been improving steadily since the directive.
Car Labelling Directive

12October 2019Public © Ricardo plc 2019
• Specific emission targets for manufacturers
• Based on the EU fleet-wide targets, accounts for the average test mass of a
manufacturer's newly registered vehicles.
• If the average CO2 emissions of a manufacturer's fleet exceed its target in a given
year, the manufacturer has to pay an excess emissions premium for each car or
van registered.
• Incentives for Zero- and low-emission vehicles (ZLEV)
• 2014 to 2017:
– 'super-credits' system for vehicles emitting less than 50 g/km
• 2025 onwards:
– CO2 emission target of a manufacturer reduced if meets follow targets:
• Cars: 15% ZLEV from 2025 on and 35% ZLEV from 2030 on
• Vans: 15% ZLEV from 2025 on and 30% ZLEV from 2030 on
Light-duty vehicles Manufacturers
13October 2019Public © Ricardo plc 2019
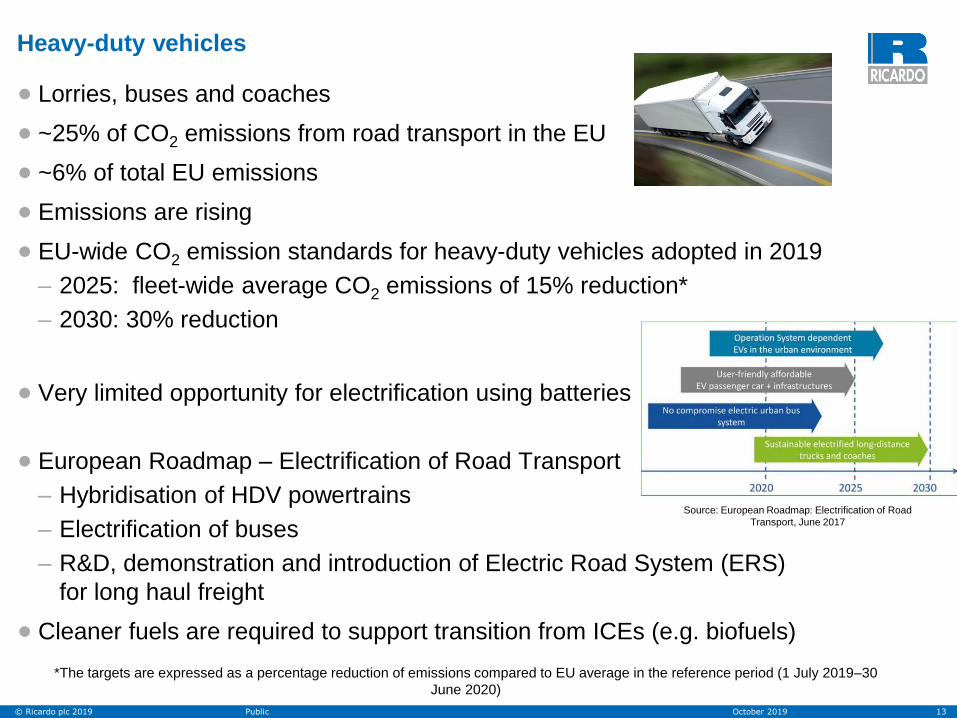
• Lorries, buses and coaches
• ~25% of CO2 emissions from road transport in the EU
• ~6% of total EU emissions
• Emissions are rising
• EU-wide CO2 emission standards for heavy-duty vehicles adopted in 2019
– 2025: fleet-wide average CO2 emissions of 15% reduction*
– 2030: 30% reduction
• Very limited opportunity for electrification using batteries
• European Roadmap – Electrification of Road Transport
– Hybridisation of HDV powertrains
– Electrification of buses
– R&D, demonstration and introduction of Electric Road System (ERS)
for long haul freight
• Cleaner fuels are required to support transition from ICEs (e.g. biofuels)
Heavy-duty vehicles
*The targets are expressed as a percentage reduction of emissions compared to EU average in the reference period (1 July 2019–30
June 2020)
Source: European Roadmap: Electrification of Road
Transport, June 2017
14October 2019Public © Ricardo plc 2019
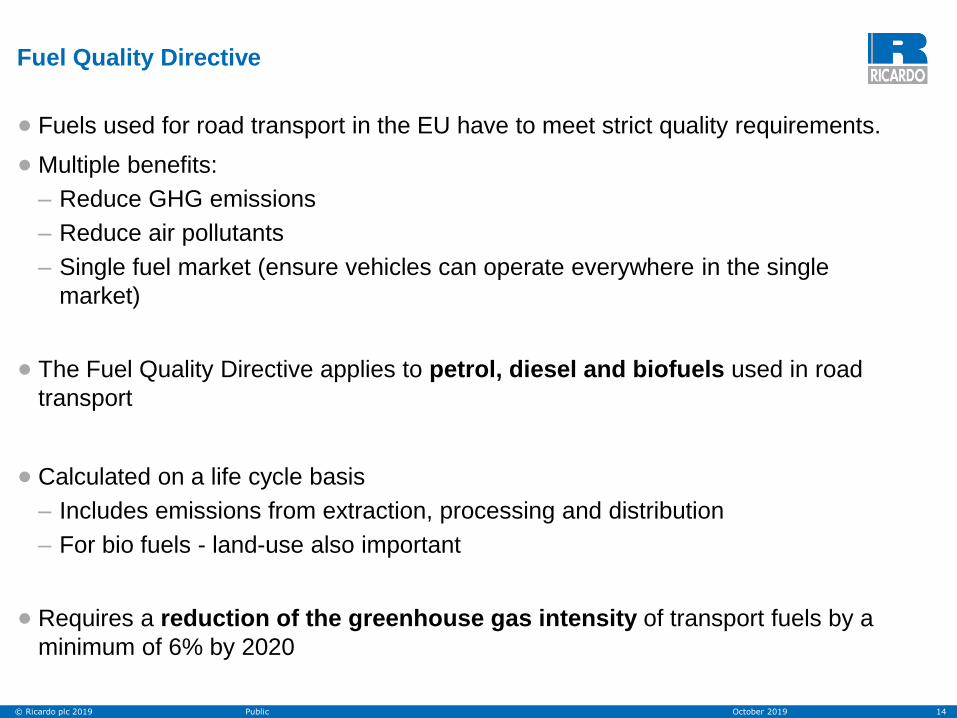
• Fuels used for road transport in the EU have to meet strict quality requirements.
• Multiple benefits:
– Reduce GHG emissions
– Reduce air pollutants
– Single fuel market (ensure vehicles can operate everywhere in the single
market)
• The Fuel Quality Directive applies to petrol, diesel and biofuels used in road
transport
• Calculated on a life cycle basis
– Includes emissions from extraction, processing and distribution
– For bio fuels - land-use also important
• Requires a reduction of the greenhouse gas intensity of transport fuels by a
minimum of 6% by 2020
Fuel Quality Directive
15October 2019Public © Ricardo plc 2019
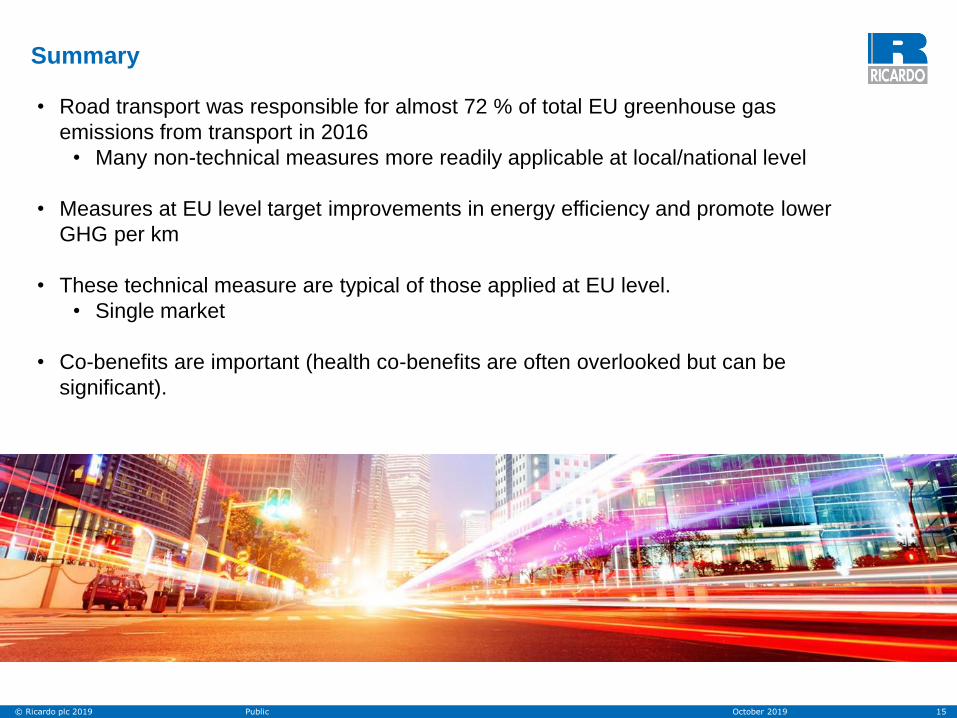
Summary
• Road transport was responsible for almost 72 % of total EU greenhouse gas
emissions from transport in 2016
• Many non-technical measures more readily applicable at local/national level
• Measures at EU level target improvements in energy efficiency and promote lower
GHG per km
• These technical measure are typical of those applied at EU level.
• Single market
• Co-benefits are important (health co-benefits are often overlooked but can be
significant).

16October 2019Public © Ricardo plc 2019
• COM(2011) 144 Roadmap to a Single European Transport Area – Towards a
competitive and resource efficient transport systemPREPARING THE
EUROPEAN TRANSPORT AREA FOR THE FUTURE
• COMMISSION REGULATION (EC) No 166/2005COMMISSION
REGULATION (EC) No 166/2005 of 31 January 2005 fixing the rates of the
refunds applicable to certain cereal and rice products exported in the form of
goods not covered by Annex I to the Treaty
• DIRECTIVE 1999/62/ECDIRECTIVE 1999/62/EC OF THE EUROPEAN
PARLIAMENT AND OF THE COUNCIL of 17 June 1999 on the charging of
heavy goods vehicles for the use of certain infrastructures
• Directive 2003/30/EC, use of biofuels and renewable fuelsPromotion of the
use of biofuels and other renewable fuels for transport. Directive 2003/30/EC
of the European Parliament and of the Council of 8 May 2003 on the
promotion of the use of biofuels and other renewable fuels for transport.
• DIRECTIVE 2004/49/ECDIRECTIVE 2004/49/EC OF THE EUROPEAN
PARLIAMENT AND OF THE COUNCIL of 29 April 2004 on safety on the
Community’s railways and amending Council Directive 95/18/EC on the
licensing of railway undertakings and Directive 2001/14/EC on the allocation
of railway infrastructure capacity and the levying of charges for the use of
railway infrastructure and safety certification
• DIRECTIVE 2004/50/ECDIRECTIVE 2004/50/EC OF THE EUROPEAN
PARLIAMENT AND OF THE COUNCIL of 29 April 2004 amending Council
Directive 96/48/EC on the interoperability of the trans-European high-speed
rail system and Directive 2001/16/EC of the European Parliament and of the
Council on the interoperability of the trans-European conventional rail system
Related policy documents
• Directive 2006/40/ECDirective 2006/40/EC of the European Parliament
and of the Council of 17 May 2006 relating to emissions from air-
conditioning systems in motor vehicles and amending Council Directive
70/156/EEC
• DIRECTIVE 2007/58/ECDIRECTIVE 2007/58/EC OF THE EUROPEAN
PARLIAMENT AND OF THE COUNCIL of 23 October 2007 amending
Council Directive 91/440/EEC on the development of the Community’s
railways and Directive 2001/14/EC on the allocation of railway
infrastructure capacity and the levying of charges for the use of railway
infrastructure
• DIRECTIVE 2008/101/ECDIRECTIVE 2008/101/EC OF THE EUROPEAN
PARLIAMENT AND OF THE COUNCIL of 19 November 2008 amending
Directive 2003/87/EC so as to include aviation activities in the scheme for
greenhouse gas emission allowance trading within the Community
• Greenhouse gas monitoring mechanism DecisionDecision No
280/2004/EC of the European Parliament and of the Council of 11
February 2004 concerning a mechanism for monitoring Community
greenhouse gas emissions and for implementing the Kyoto Protocol
• Kyoto Protocol to the UN Framework Convention on Climate ChangeKyoto
Protocol to the United Nations Framework Convention on Climate Change;
adopted at COP3 in Kyoto, Japan, on 11 December 1997
• Monitoring Mechanism Regulation 525/2013REGULATION (EU) No
525/2013 OF THE EUROPEAN PARLIAMENT AND OF THE COUNCIL of
21 May 2013 on a mechanism for monitoring and reporting greenhouse
gas emissions and for reporting other information at national and Union
level relevant to climate change and repealing Decision No 280/2004/EC

© Ricardo plc 2017
© Ricardo plc 2017
National transport policy
18October 2019Public © Ricardo plc 2019
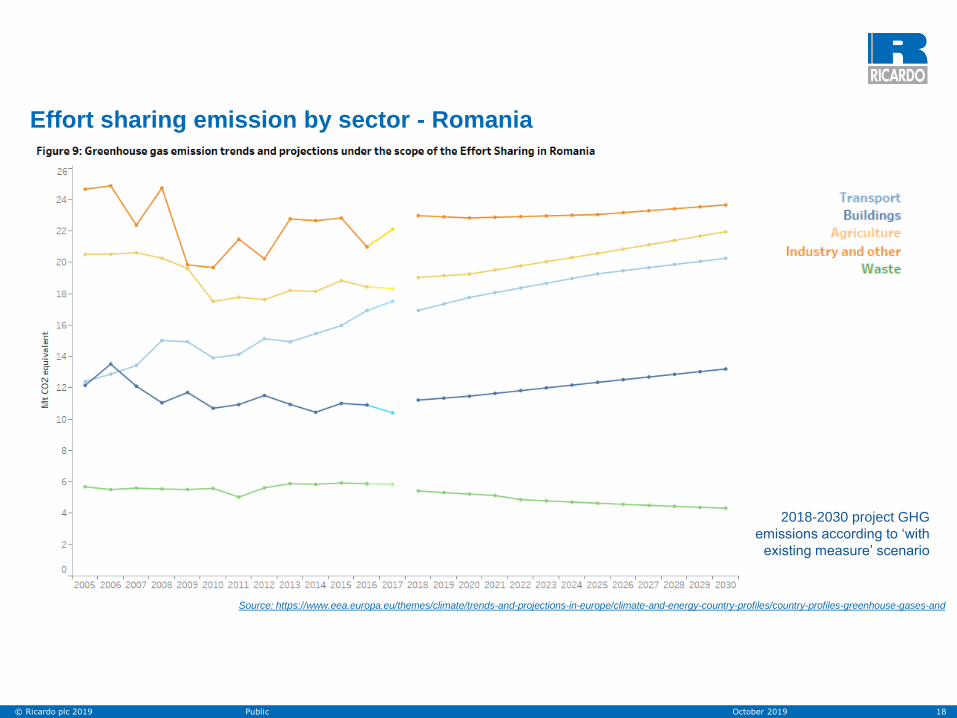
Source: https://www.eea.europa.eu/themes/climate/trends-and-projections-in-europe/climate-and-energy-country-profiles/country-profiles-greenhouse-gases-and
Effort sharing emission by sector - Romania
2018-2030 project GHG
emissions according to ‘with
existing measure’ scenario

19October 2019Public © Ricardo plc 2019
Source: https://www.eea.europa.eu/themes/climate/trends-and-projections-in-europe/climate-and-energy-country-profiles/country-profiles-greenhouse-gases-and
Effort sharing emission by sector
Bulgaria Poland
CroatiaHungary

20October 2019Public © Ricardo plc 2019
• ‘Non-technical’ at national and local level:
– Reduce the need to travel (e.g. e-commerce, e-government;
teleworking)
– Encourage shift of modes (e.g. planning and management of transport
system; pricing; modal choice)
– Encourage to be more efficient (e.g. speed limits)
Types of Measures

21October 2019Public © Ricardo plc 2019
SULTAN Modelling
• Ricardo conducted modelling to explore the potential impacts of transport GHG
reduction policies using the SULTAN Illustrative Scenarios Tool
• The types of policy measures used by Member States were grouped into following
areas:
• Package of cycling and walking improvement measures (cycling and walking)
• Improved spatial planning (road and rail)
• Package of mobility management measures incl. improved public transport
• Improved freight inter-modality (road, rail and inland shipping)
• Improved road speed enforcement (road)
• Harmonised EU motorway speed limit (road)
• Fuel-efficient driver training (road, rail)
• Company car tax reform (cars)
• CO2 price tax (all modes, based on central/low/high CO2 costs))
• Non-CO2 price tax (road, internalise cost of NOx, PM and energy security)
• Rapid deployment of C-ITS (all modes)

22October 2019Public © Ricardo plc 2019
SULTAN Modelling
Scenarios from SULTANDescription Action level
Package of cycling and walking
improvement measures (cycling and
walking)
Potential impacts of (mainly urban) modal shift to walking and cycling as a result of improvements to
cycling planning, promotion and infrastructure.
MS
Improved spatial planning (road and rail) Potential for improved spatial planning of urban environments to minimise travel distances and improving
access to public transport, as well as improving interurban transport links.
Mixed/MS
Package of mobility management
measures incl. improved public transport
Emissions reductions due to modal shift in passenger transport from passenger cars to various public
transport modes, and also cycling and walking.
MS
Improved freight inter-modality (road, rail
and inland shipping)
Non-urban freight efficiency and modal shift achievable by improvements to the interphases between
freight modes and removal of barriers for non-road modes.
Mixed/MS
Improved road speed enforcement (road) Impacts of efficiency improvements in road transport resulting from improved speed limit enforcement,
resulting in reduced average speeds (mainly on non-urban roads).
MS
Harmonised EU motorway speed limit
(road)
Efficiency improvements in road transport resulting from harmonisation and reduction in overall speed
limits on motorways across the EU.
Mixed/MS
Fuel-efficient driver training (road, rail) This scenario explored the potential impacts of an ongoing programme of fuel-efficient driver training for
passenger and freight transport across the EU on the real-world fuel efficiency of vehicles.
MS
Company car tax reform (cars) Potential impacts of company car tax reform, resulting in a reduction in vehicle activity, ownership, and
improvements in new vehicle efficiency.
Mixed/MS
CO2 price tax (all modes, based on
central/low/high CO2 costs))
Estimated external costs of CO2 emissions into the fuel duty, resulting in a combination of a shift to more
efficient vehicles/driving, and reduced activity.
Mixed/MS
Non-CO2 price tax (road, internalise cost
of NOx, PM and energy security)
External costs of NOx, PM emissions into the fuel duty, resulting in a combination of a shift to more
efficient vehicles/driving, and reduced activity.
Mixed/MS
Rapid deployment of C-ITS (all modes) Deployment of Co-operative Intelligent Transport Systems (C-ITS), and the effect on fleet efficiencies and
activity.
MS

23October 2019Public © Ricardo plc 2019
SULTAN Modelling
0.00%
5.00%
10.00%
15.00%
20.00%
25.00%
Direct BAU
WTW BAU
Reductions in direct GHG emissions
Reductions in GHG emissions (measured on a Well-to-Wheel basis)
Direct BAU
WTW BAU
Source: https://europeanclimate.org/wp-content/uploads/2016/02/ECF-Transport-GHG-
reduction-for-2030_Final_Issue21.pdf
SULTAN results: Predicted reductions in GHG emissions from non-ETS transport by 2030,
compared with 2005, under different scenario options

24October 2019Public © Ricardo plc 2019
SULTAN Modelling – key results
0.00%
5.00%
10.00%
15.00%
20.00%
25.00%
Reductions in direct GHG emissions
Reductions in GHG emissions (measured on aWell-to-Wheel basis)
Source: https://europeanclimate.org/wp-content/uploads/2016/02/ECF-Transport-GHG-
reduction-for-2030_Final_Issue21.pdf
SULTAN results: Predicted reductions in GHG
emissions from non-ETS transport by 2030,
compared with 2005, under different scenario
options
Highest levels of GHG reduction (both direct and
WTW GHG emissions)
• Fuel taxation based costs of CO2 (21.9%)
• Improved spatial planning (19.2%).
• The BAU baseline predicts direct GHG emissions
by 15.3% by 2030 compared to 2005.
• Equivalent to 4.7% towards the overall objective
of a 30% reduction in emissions from all non-ETS
sectors by 2030
• Marginal savings delivered from remining
measures are important. Especially when part of
a policy package.
25October 2019Public © Ricardo plc 2019
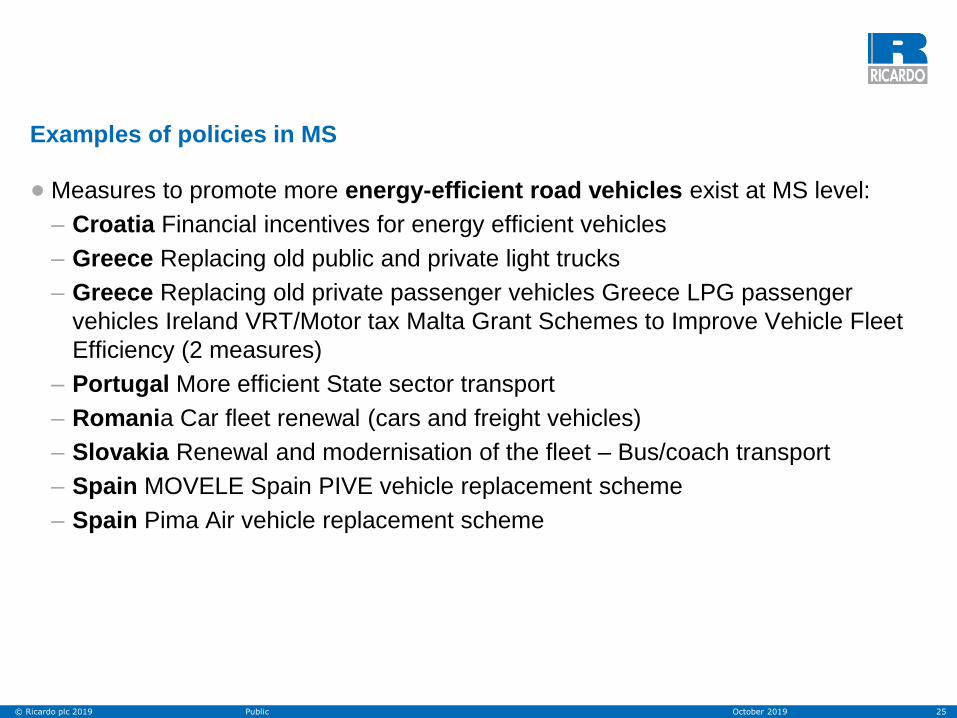
Examples of policies in MS
• Measures to promote more energy-efficient road vehicles exist at MS level:
– Croatia Financial incentives for energy efficient vehicles
– Greece Replacing old public and private light trucks
– Greece Replacing old private passenger vehicles Greece LPG passenger
vehicles Ireland VRT/Motor tax Malta Grant Schemes to Improve Vehicle Fleet
Efficiency (2 measures)
– Portugal More efficient State sector transport
– Romania Car fleet renewal (cars and freight vehicles)
– Slovakia Renewal and modernisation of the fleet – Bus/coach transport
– Spain MOVELE Spain PIVE vehicle replacement scheme
– Spain Pima Air vehicle replacement scheme

26October 2019Public © Ricardo plc 2019
Examples of policies in MS
•Case study – Promotion of electric vehicles
– Includes both promotion of energy efficient vehicles and CO2 taxes.
•A number of different measures are included, aimed at combatting:
– High upfront costs
– Attractiveness/ease of ownership
•MS covered:
– Norway
– Netherlands
– France
27October 2019Public © Ricardo plc 2019
Examples of policies in MS
• Case study – Promotion of electric vehicles
– Includes both promotion of energy efficient vehicles and CO2 taxes.
• A number of different measures are included, aimed at combatting:
– High upfront costs
– Attractiveness/ease of ownership
• MS covered:
– Norway
– Netherlands
– France – ???
Would anyone here like to contribute their experience of EV
promotion to the case study?