Embed Size (px)
Citation preview
www.eia.govU.S. Energy Information Administration Independent Statistics & Analysis
Overview of renewable technologies in the National
Energy Modeling System (NEMS)
For
Workshop:
March 7, 2017 | Washington, D.C.
By
Cara Marcy
Renewable Electricity Analyst
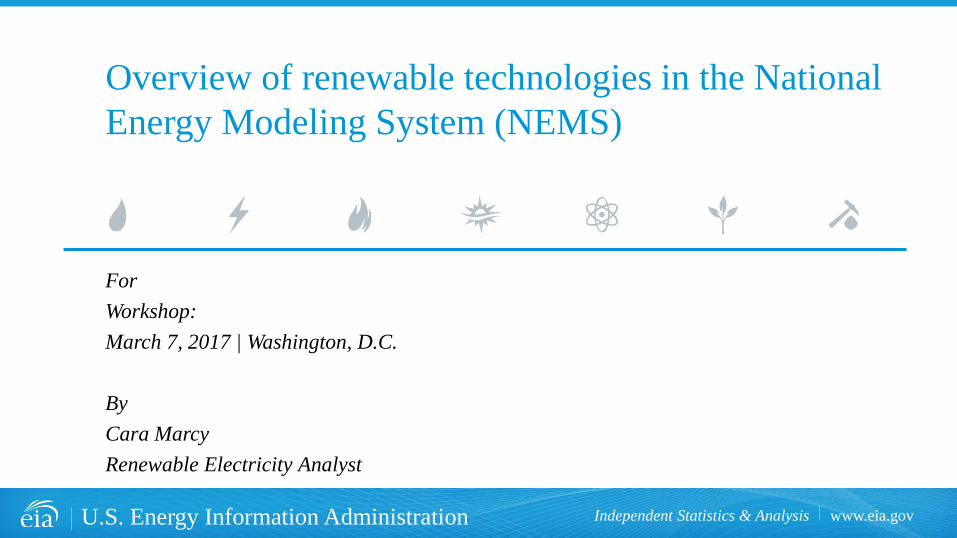
• Renewable electricity technologies
represented in NEMS include:
– Biomass-Wood
– Biomass-Municipal solid waste/
Landfill gas
– Geothermal
– Conventional hydropower
– Solar‐thermal
– Solar‐photovoltaic
– Wind-onshore
– Wind-offshore
Eight different utility-scale renewable electricity technologies are
represented in the model
Cara Marcy, Washington D.C.
March 7, 2017 2
non-dispatchable,
e.g. intermittent
or variable
seasonal/
energy limited
• Can be used in dedicated, direct-fired biomass plants or cofired with coal
– Much biomass generation comes from the pulp/paper industry
– This cogeneration is accounted for in the industrial sector
• Previous AEOs saw a lot of cofiring, but several factors make this less
attractive now, including lower cost alternatives and pressure on existing coal
plants
• Fuel derived from urban wood waste, forestry residues, agricultural residues,
and energy crops
– Urban wastes and forestry are the lowest-cost resources
• MSW/LFG model is dated and currently under revision
Biomass
Cara Marcy, Washington D.C.
March 7, 2017 3
Conventional Hydropower• Provides available supply of new conventional hydroelectric generating capacity
that can be built at known and well-characterized sites
– > 1 MW, < $0.10/kWh
– Based on list of known conventional hydro sites – 1299 sites, 22 GW potential
– 3-step supply function – by year, region
• Average cost
• Performance characteristics
• Aggregate capacity
• Hydro is dispatched on an energy-constrained basis– Dispatches at full capacity into the highest-value period within a season– Dispatches into the next highest-value period until seasonal energy is exhausted
Cara Marcy, Washington D.C.
March 7, 2017 4
Geothermal• Like hydro, geothermal supply is described by a list of specific, known sites
– Least-cost sites are high-quality hydrothermal resources using dual flash or binary turbines
– “Near-field” sites are extensions of existing resource areas that may require engineering of
rock to stimulate flow (such as through hydraulic fracturing)
• Based on historic experience, the build-out of any given site is limited to 25
MW per year
– Helps developers better manage the resource
– Results in slow build-out, despite sometimes favorable economics
• With high availability and low variable cost, geothermal is dispatched as
baseload
Cara Marcy, Washington D.C.
March 7, 2017 5
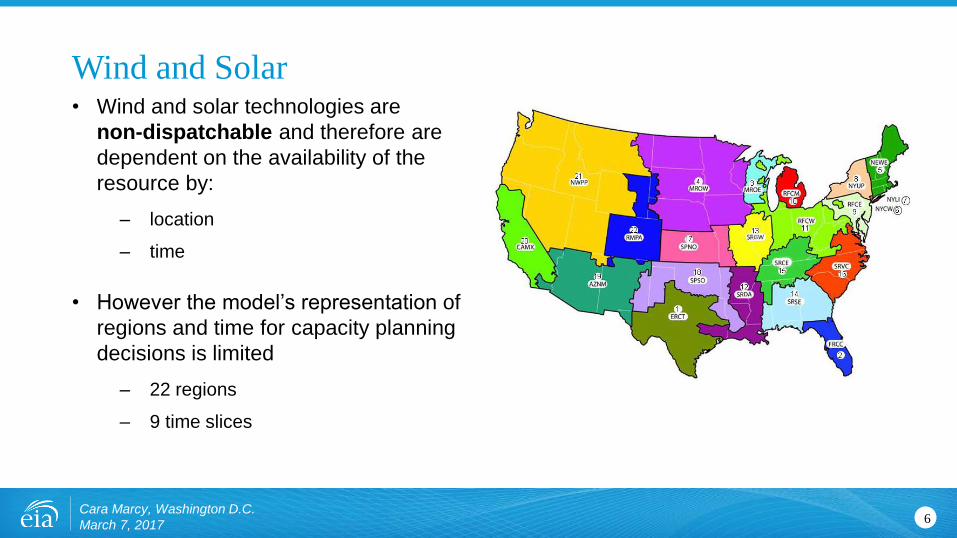
• Wind and solar technologies are
non-dispatchable and therefore are
dependent on the availability of the
resource by:
– location
– time
• However the model’s representation of
regions and time for capacity planning
decisions is limited
– 22 regions
– 9 time slices
Wind and Solar
Cara Marcy, Washington D.C.
March 7, 2017 6
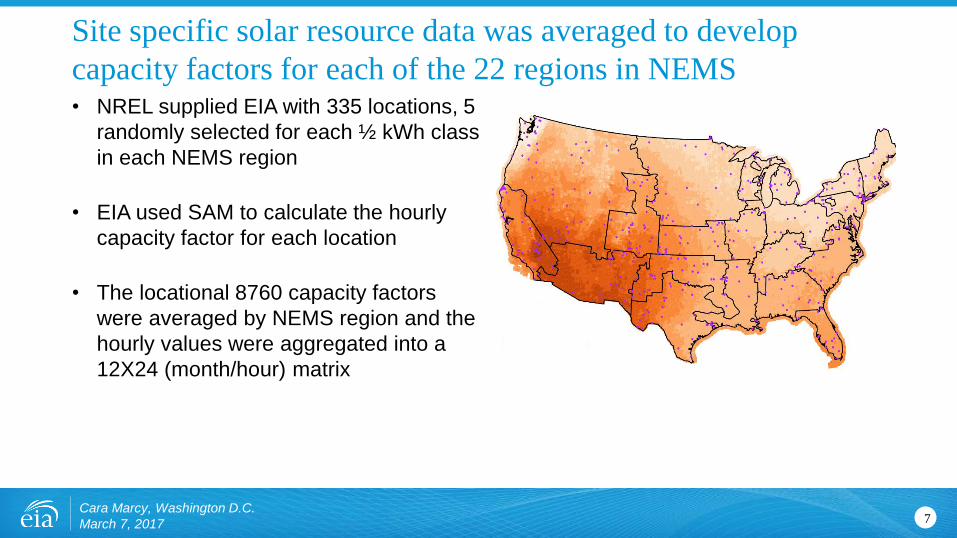
• NREL supplied EIA with 335 locations, 5
randomly selected for each ½ kWh class
in each NEMS region
• EIA used SAM to calculate the hourly
capacity factor for each location
• The locational 8760 capacity factors
were averaged by NEMS region and the
hourly values were aggregated into a
12X24 (month/hour) matrix
Site specific solar resource data was averaged to develop
capacity factors for each of the 22 regions in NEMS
Cara Marcy, Washington D.C.
March 7, 2017 7
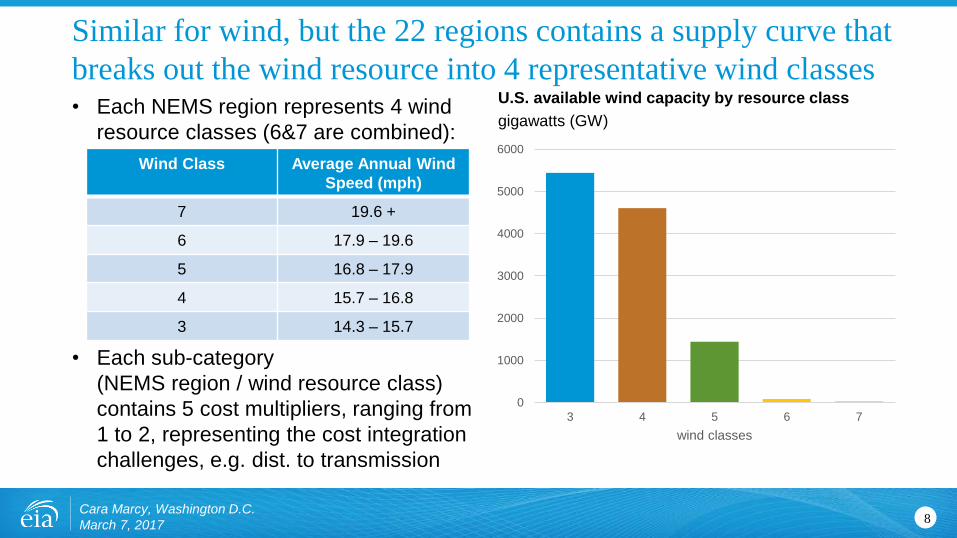
• Each NEMS region represents 4 wind
resource classes (6&7 are combined):
• Each sub-category
(NEMS region / wind resource class)
contains 5 cost multipliers, ranging from
1 to 2, representing the cost integration
challenges, e.g. dist. to transmission
U.S. available wind capacity by resource class
gigawatts (GW)
Similar for wind, but the 22 regions contains a supply curve that
breaks out the wind resource into 4 representative wind classes
Cara Marcy, Washington D.C.
March 7, 2017
0
1000
2000
3000
4000
5000
6000
3 4 5 6 7
wind classes
Wind Class Average Annual Wind
Speed (mph)
7 19.6 +
6 17.9 – 19.6
5 16.8 – 17.9
4 15.7 – 16.8
3 14.3 – 15.7
8
• Loads is computed for 864 time slices
(24 hours X 12 months X 3 day types)
• PV and wind capacity factors are
provided by 24 hours X 12 months
• A minimum level of generation from
nuclear and coal is established
• Excess solar generation is evaluated
counts against future planning decisions0
10
20
30
40
50
60
70
80
0 6 12 18 0 6 12 18 0 6 12 18
hours (3 day types in June)
load
solar
coal and nuclear
generation profile for estimated curtailments, example
gigawatthours (GWh)
Cara Marcy, Washington D.C.
March 7, 2017
Curtailments are estimated based on hourly load, non-dispatchable
generation, and minimum generation levels from coal and nuclear
9
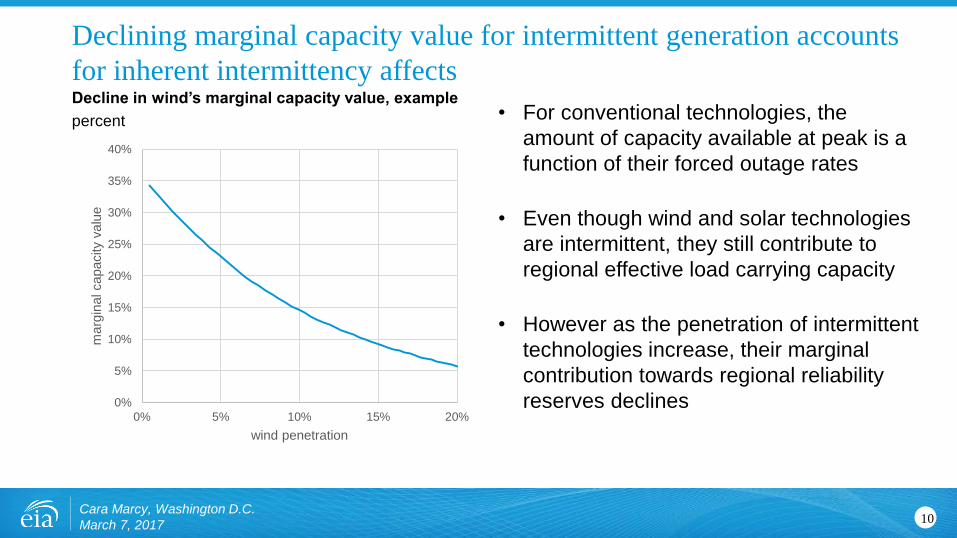
• For conventional technologies, the
amount of capacity available at peak is a
function of their forced outage rates
• Even though wind and solar technologies
are intermittent, they still contribute to
regional effective load carrying capacity
• However as the penetration of intermittent
technologies increase, their marginal
contribution towards regional reliability
reserves declines
Decline in wind’s marginal capacity value, example
percent
Cara Marcy, Washington D.C.
March 7, 2017
Declining marginal capacity value for intermittent generation accounts
for inherent intermittency affects
10
0%
5%
10%
15%
20%
25%
30%
35%
40%
0% 5% 10% 15% 20%
marg
inal capacity
valu
e
wind penetration
Looking forward• Other enhancements for the model that address intermittency of renewable
technologies include:
– Developing curtailment using 864 time slides for wind
– Integrating energy storage
– Estimating the marginal capacity value using 864 time slices
Cara Marcy, Washington D.C.
March 7, 2017 11
For more information
Assumptions Document | http://www.eia.gov/forecasts/aeo/assumptions/
Model Documentation | http://www.eia.gov/outlooks/aeo/nems/documentation/
Annual Energy Outlook | www.eia.gov/aeo
Cara Marcy, Washington D.C.
March 7, 2017 12
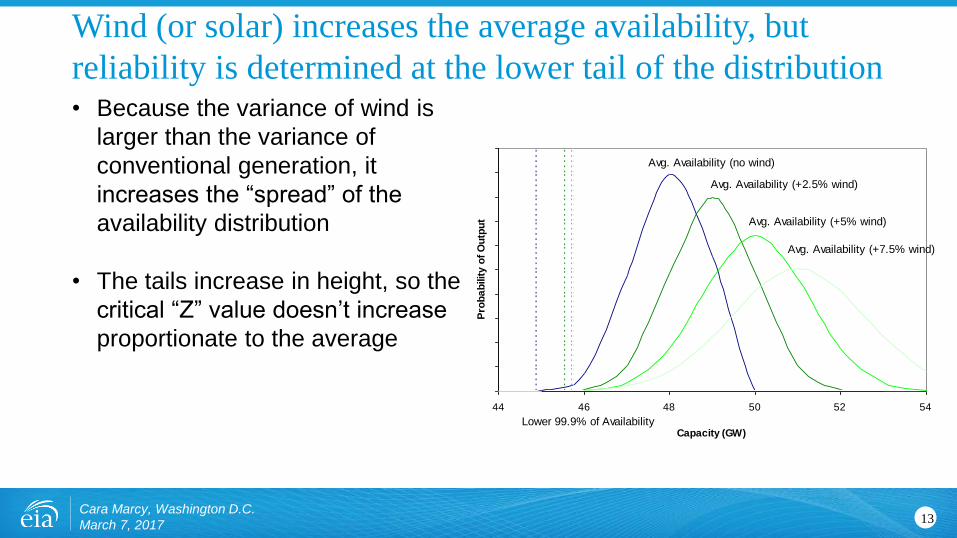
• Because the variance of wind is
larger than the variance of
conventional generation, it
increases the “spread” of the
availability distribution
• The tails increase in height, so the
critical “Z” value doesn’t increase
proportionate to the average
Wind (or solar) increases the average availability, but
reliability is determined at the lower tail of the distribution
Cara Marcy, Washington D.C.
March 7, 2017 13
44 46 48 50 52 54
Capacity (GW)
Pro
ba
bilit
y o
f O
utp
ut
Lower 99.9% of Availability
Avg. Availability (no wind)
Avg. Availability (+2.5% wind)
Avg. Availability (+5% wind)
Avg. Availability (+7.5% wind)