Embed Size (px)
Citation preview
Overview of Split Sentencing Research
October 25, 2006Mark Rubin

Presentations given to subcommittee
• Exploring the Relationship between Split Sentences and Probation Recidivism in Maine - July 27, 2006
• Who gets a Split Sentence in Maine? - August 2, 2006
• Who is getting revoked on probation? - September 21, 2006

Study Parameters/Methodology
• Examined 2004 and 2005 populations of individuals entering probation via :
– Split Sentence (spent some time in jail or prison just before entering probation
– Straight Probation (received a sentence of probation without any jail or prison time

Exploring the relationship between sentence type, risk, recidivism, and
revocations
Examined the following variables in the analysis:– Risk Level (LSI-R scores)– Crime type (MEJIS index and Class)– Region– Jail/Prison split– Number of Priors– Demographic variables (gender, age, education, race,et
al.)– Criminogenic factors, including criminal histories
(number of priors)– Shock Sentence– Probation revocations by type of offense (new crime vs.
technical)– Revocations by risk level– Revocation information by sentence type

Who gets a Split Sentence?

Twice as many split sentenced offenders entered probation in 2004 and 2005 as those with a
straight probation sentence

The likelihood of a split sentence correlates with LSI Rating
LSI RatingStraight Probation
Split Sentence
Administrative 44.9% 55.1%Moderate 35.8% 64.2%
High/Maximum 20.6% 79.4%

Split sentences are the majority of sentences whether the crime is a Felony or a Misdemeanor
Split SentenceStraight Probation
Felony
Administrative 71.7% 28.3%
Moderate 84.5% 15.5%
High/Maximum 92.2% 7.8%
Total 83.7% 16.3%
Misdemeanor
Administrative 48.2% 51.8%
Moderate 52.9% 47.1%
High/Maximum 55.3% 44.7%
Total 52.0% 48.0%

There appear to be regional differences in sentencing practices
Straight Probation Split Sentence
Region 1
Administrative 51.4% 48.6%
Moderate 40.6% 59.4%
High/Maximum 26.1% 73.9%
Total 40.8% 59.2%
Region 2Administrative 48.2% 51.8%
Moderate 44.8% 55.2%
High/Maximum 20.3% 79.7%
Total 43.0% 57.0%
Region 3Administrative 43.7% 56.3%
Moderate 31.4% 68.6%
High/Maximum 12.0% 88.0%
Total 33.2% 66.8%
Region 4Administrative 36.4% 63.6%
Moderate 27.8% 72.2%
High/Maximum 18.5% 81.5%
Total 28.5% 71.5%

Most offenders receive a split sentence of less than 45 days
Risk Level
Less than
45 days
45-270
days
More than
270 days
Administrative 73.0% 19.4% 7.6%
Moderate 59.9% 28.3% 11.8%
High/Maximum 27.7% 33.6% 38.7%
Total 58.3% 27.4% 14.3%
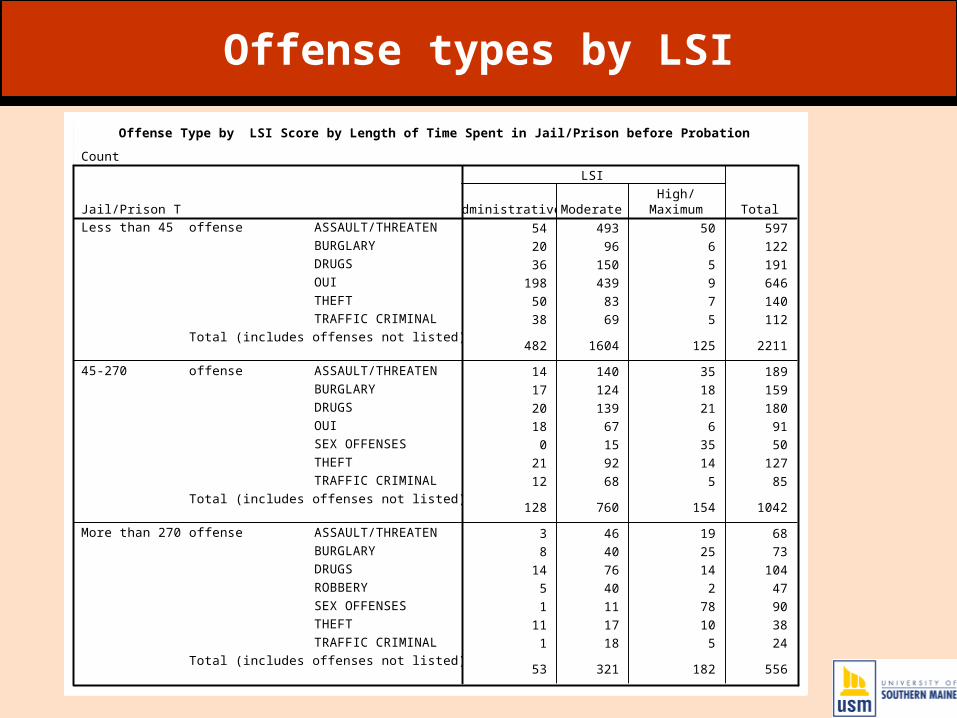
Offense types by LSI
Offense Type by LSI Score by Length of Time Spent in Jail/Prison before Probation
Count
54 493 50 597
20 96 6 122
36 150 5 191
198 439 9 646
50 83 7 140
38 69 5 112
482 1604 125 2211
14 140 35 189
17 124 18 159
20 139 21 180
18 67 6 91
0 15 35 50
21 92 14 127
12 68 5 85
128 760 154 1042
3 46 19 68
8 40 25 73
14 76 14 104
5 40 2 47
1 11 78 90
11 17 10 38
1 18 5 24
53 321 182 556
ASSAULT/THREATEN
BURGLARY
DRUGS
OUI
THEFT
TRAFFIC CRIMINAL
offense
Total (includes offenses not listed)
ASSAULT/THREATEN
BURGLARY
DRUGS
OUI
SEX OFFENSES
THEFT
TRAFFIC CRIMINAL
offense
Total (includes offenses not listed)
ASSAULT/THREATEN
BURGLARY
DRUGS
ROBBERY
SEX OFFENSES
THEFT
TRAFFIC CRIMINAL
offense
Total (includes offenses not listed)
Jail/Prison TimeLess than 45
45-270
More than 270
Administrative ModerateHigh/
Maximum
LSI
Total

Exploring the Relationship between Split Sentences and
Probation Recidivism

Sentence Type Recidivism Rate
Split Sentence 30.4%
Straight Probation
20.5%
Overall 26.9%*=Statistically significant difference between
recidivism rates
Split Sentenced probationers have higher recidivism rates than probationers receiving a
straight sentence
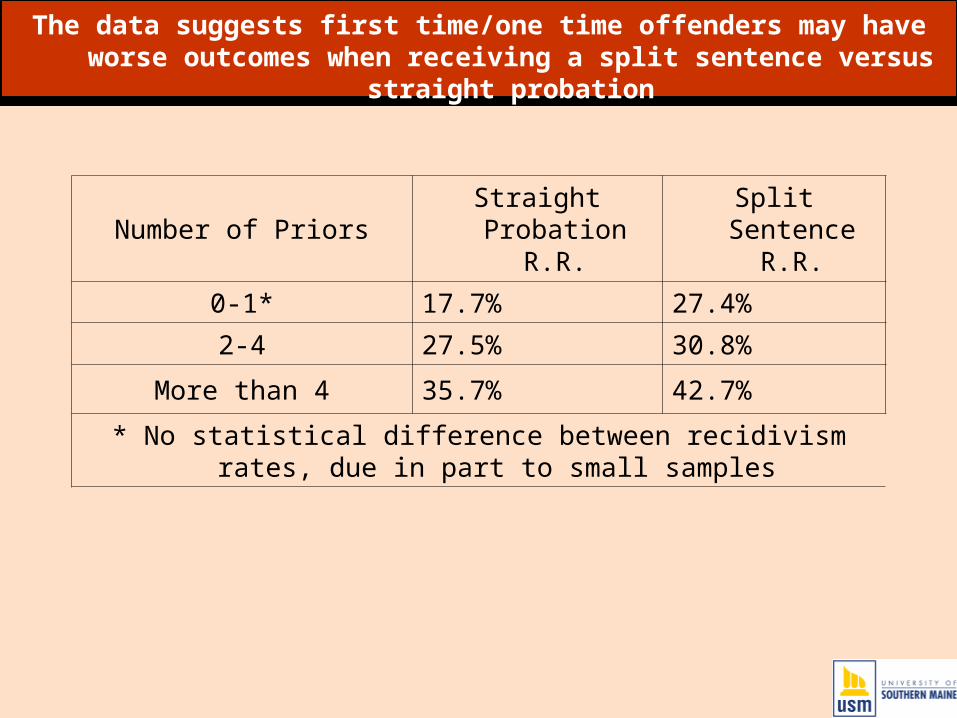
The data suggests first time/one time offenders may have worse outcomes when receiving a split sentence versus
straight probation
Number of PriorsStraight
Probation R.R.Split Sentence
R.R.
0-1* 17.7% 27.4%
2-4 27.5% 30.8%
More than 4 35.7% 42.7%
* No statistical difference between recidivism rates, due in part to small samples
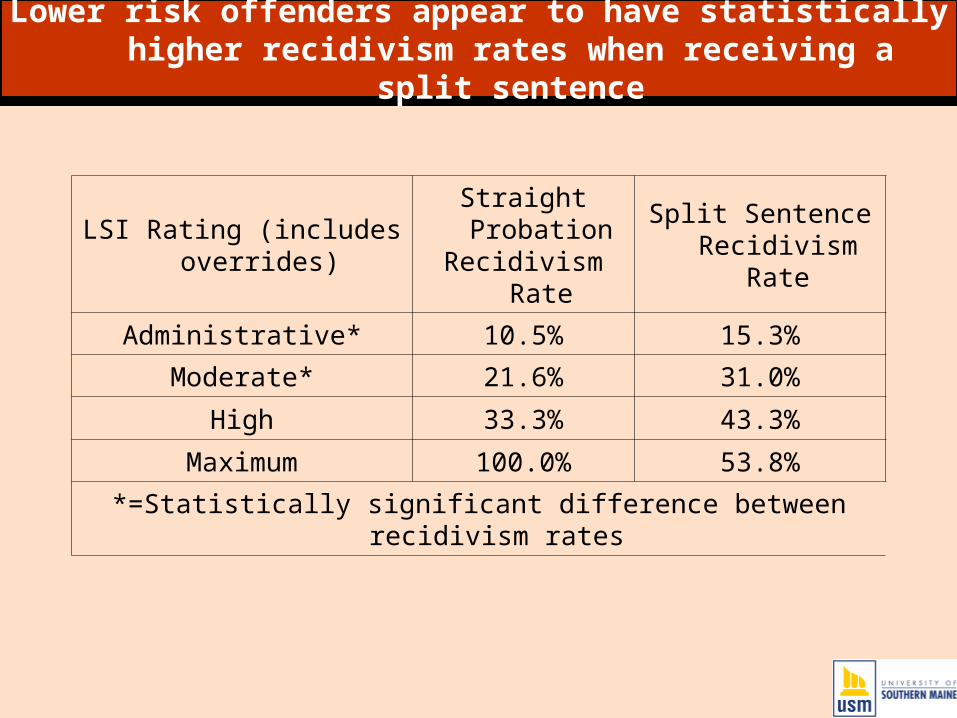
Lower risk offenders appear to have statistically higher recidivism rates when receiving a split
sentence
LSI Rating (includes overrides)
Straight Probation
Recidivism Rate
Split Sentence Recidivism
Rate
Administrative* 10.5% 15.3%
Moderate* 21.6% 31.0%
High 33.3% 43.3%
Maximum 100.0% 53.8%
*=Statistically significant difference between recidivism rates

Offenders convicted of certain crimes appear to have statistically higher recidivism rates when
receiving a split sentence
Crime (from MEJIS Index)
Straight Probation R.R.
Split Sentence R.R.
Assault/Threatening* 21.7% 30.8%
Burglary 37.1% 44.0%
Drugs* 19.9% 29.6%
OUI 19.4% 18.4%
Sex offenses* 13.5% 27.0%
Theft* 21.3% 36.5%
Traffic Criminal* 6.5% 29.8%
*=Statistically significant difference between recidivism rates

Recidivism rates are higher for shock sentences than straight probation,
especially after 30 days.
Sentence Type Recidivism Rates
Straight Probation 20.5%
Split - 7 and less 27.9%
Split - 8-14 days 21.0%
Split -15-30 26.9%
Split -31-60 35.8%
Split -61-90 33.7%
Split of 90+ days 34.8%

Concluding Thoughts
• Split Sentence probationers appear to have higher recidivism rates than straight probationers even after accounting for specific characteristics.
• However, sentencing practices are at best weakly related to a recidivist outcome. Other factors play a role, such as AFA, Priors, Current Age, Education, Married.
• It appears that split sentencing has a more profound impact on lower risk offenders as to whether they recidivate.

Who is getting revoked?

Revocations rise dramatically as risk levels rise
LSI Rating (includes overrides)
Revocation Rate
Administrative 14.4%
Moderate 36.4%
High 56.0%
Maximum 82.4%
Total 33.6%
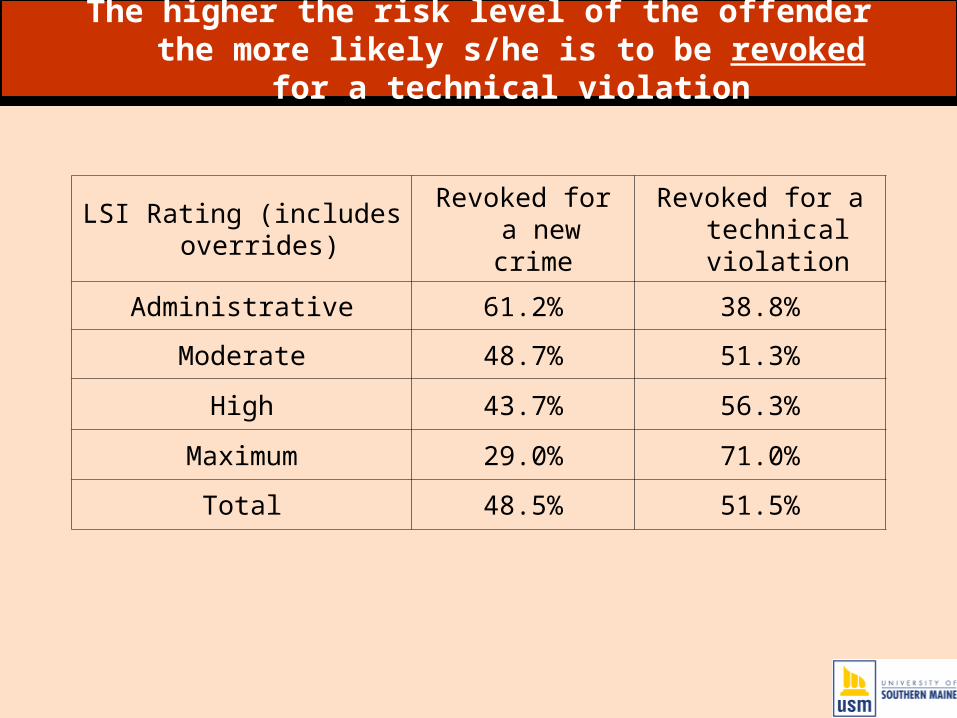
The higher the risk level of the offender the more likely s/he is to be revoked for a
technical violation
LSI Rating (includes overrides)
Revoked for a new crime
Revoked for a technical violation
Administrative 61.2% 38.8%
Moderate 48.7% 51.3%
High 43.7% 56.3%
Maximum 29.0% 71.0%
Total 48.5% 51.5%

Split sentenced probationers have higher revocation rates
Sentence Type
Revocation Rate
Straight Probation
27.3%
Split Sentence
39.7%
- Split Prison 43.8%
- Split Jail 39.0%
Total 35.3%
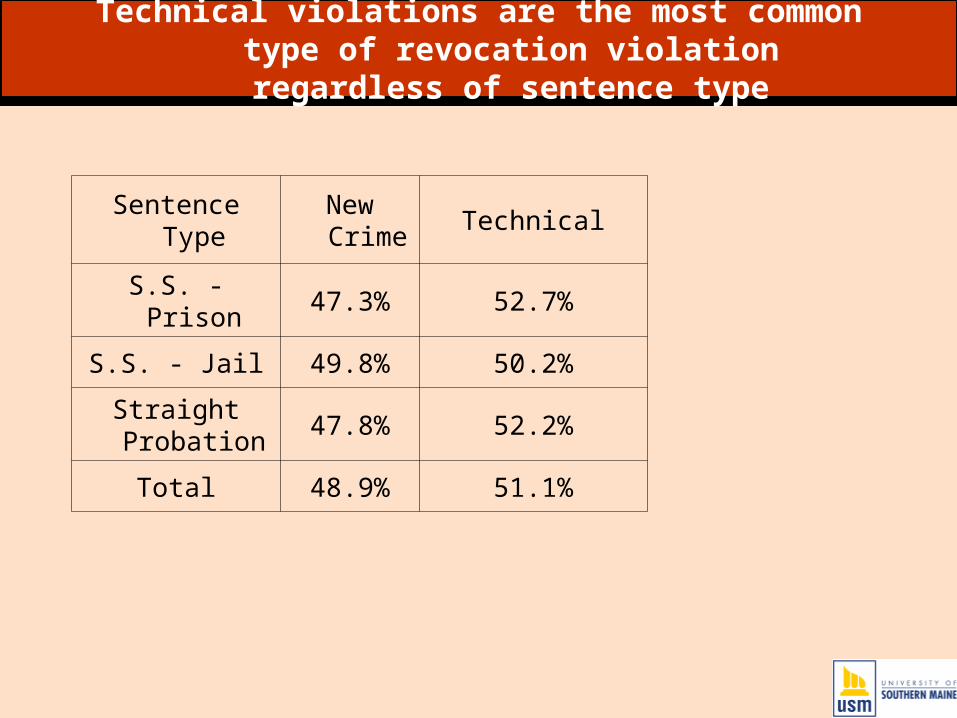
Technical violations are the most common type of revocation violation regardless
of sentence type
Sentence Type
New Crime
Technical
S.S. - Prison 47.3% 52.7%
S.S. - Jail 49.8% 50.2%
Straight Probation
47.8% 52.2%
Total 48.9% 51.1%
Take away points on revocations
• Half of the revocations are for technical violations
• Administrative cases are 50% less likely to be revoked than moderate cases
• Split Sentences have higher revocation rates than straight probation cases