Embed Size (px)
Citation preview
Overview of the Bureau of Economic Analysis
Regional Accounts at the BEA
Robert L. BrownMonitoring Mississippi: Data & Tools for Understanding Our
State and Local EconomiesJackson, Mississippi
April 3, 2008

www.bea.gov
BEA Mission
To promote a better understanding of the U.S. economy by providing the most timely, relevant, and accurate economic accounts data in an objective and cost-effective manner The nation’s economic accountant:
comprehensive double-entry accounts and economics
www.bea.gov
What Do We Produce?
National Economic Accounts Gross Domestic Product (GDP) Personal Income Price Measures
International Economic Accounts International transactions Direct investments Operations of US and foreign multinational
companies Industry Accounts
Input-output accounts GDP by industry Travel and tourism satellite account
www.bea.gov
What do we produce?
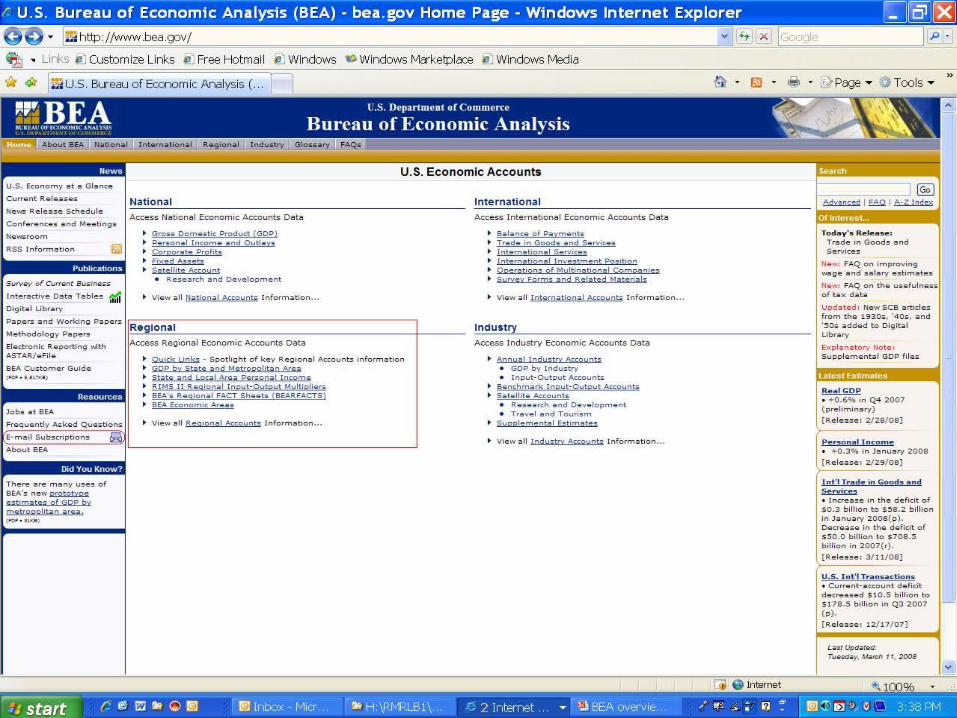
Regional economic accounts Gross domestic product (GDP) by
state Prototype estimates of GDP for
metropolitan areas
Personal income for states and local areas
Regional economic multipliers—RIMS II
www.bea.gov
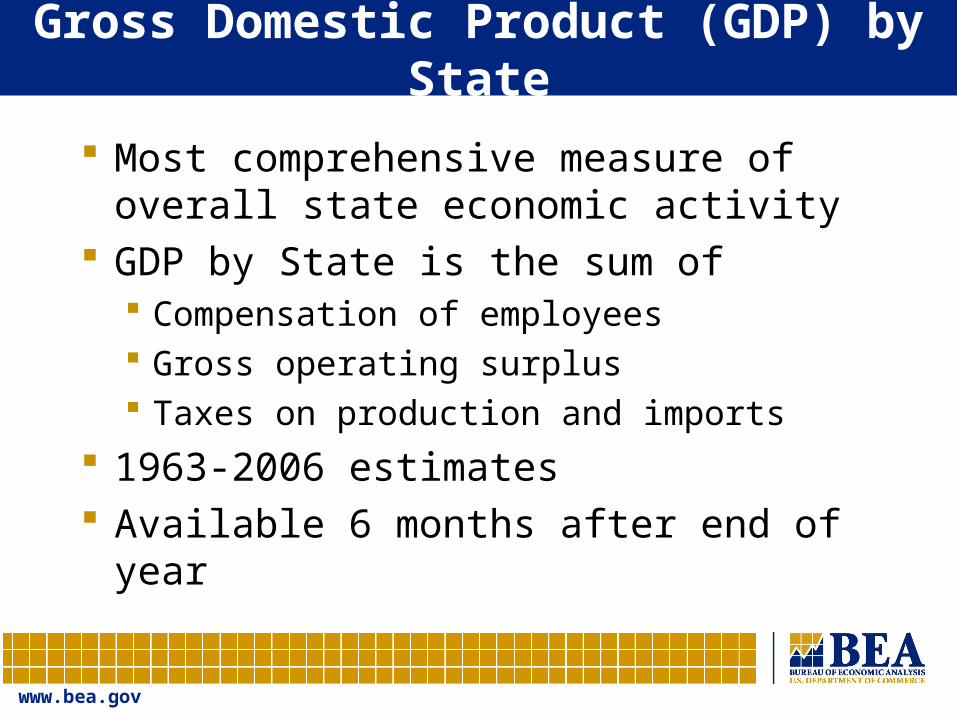
Gross Domestic Product (GDP) by State
Most comprehensive measure of overall state economic activity
GDP by State is the sum of Compensation of employees Gross operating surplus Taxes on production and imports
1963-2006 estimates Available 6 months after end of year
www.bea.gov
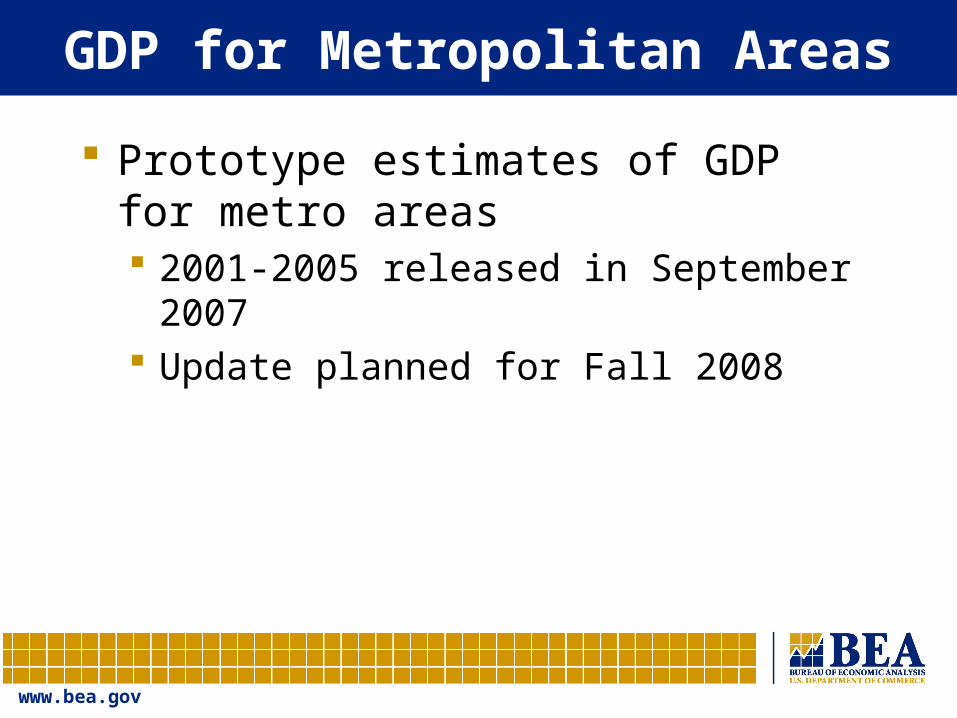
GDP for Metropolitan Areas
Prototype estimates of GDP for metro areas 2001-2005 released in September
2007 Update planned for Fall 2008
www.bea.gov
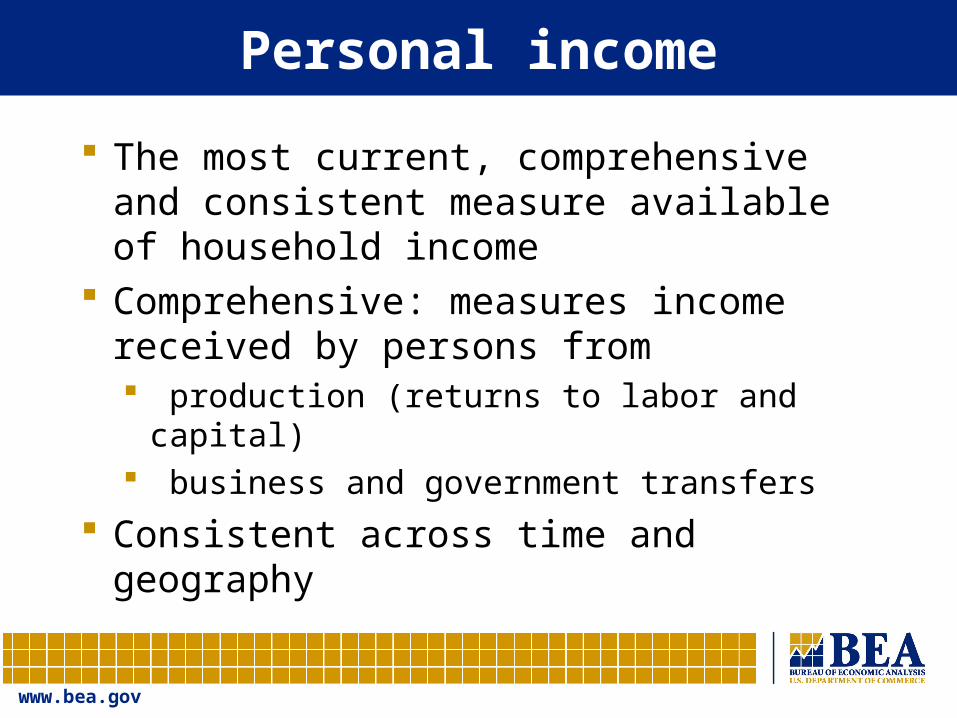
Personal income
The most current, comprehensive and consistent measure available of household income
Comprehensive: measures income received by persons from production (returns to labor and capital) business and government transfers
Consistent across time and geography
www.bea.gov
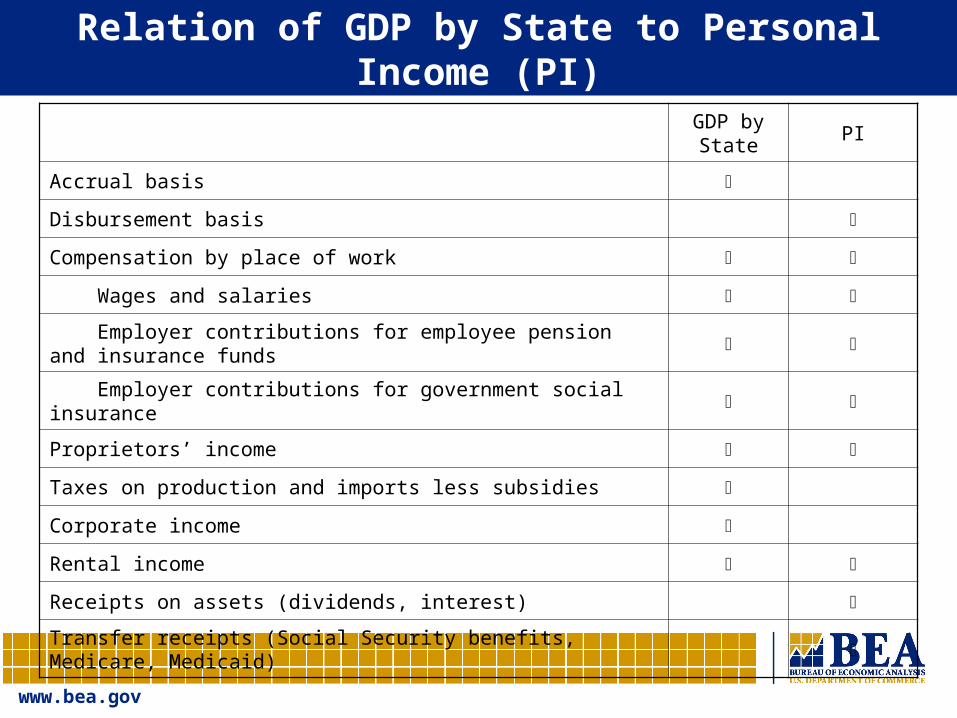
Relation of GDP by State to Personal Income (PI)
GDP by State
PI
Accrual basis
Disbursement basis
Compensation by place of work
Wages and salaries
Employer contributions for employee pension and insurance funds
Employer contributions for government social insurance
Proprietors’ income
Taxes on production and imports less subsidies
Corporate income
Rental income
Receipts on assets (dividends, interest)
Transfer receipts (Social Security benefits, Medicare, Medicaid)
www.bea.gov
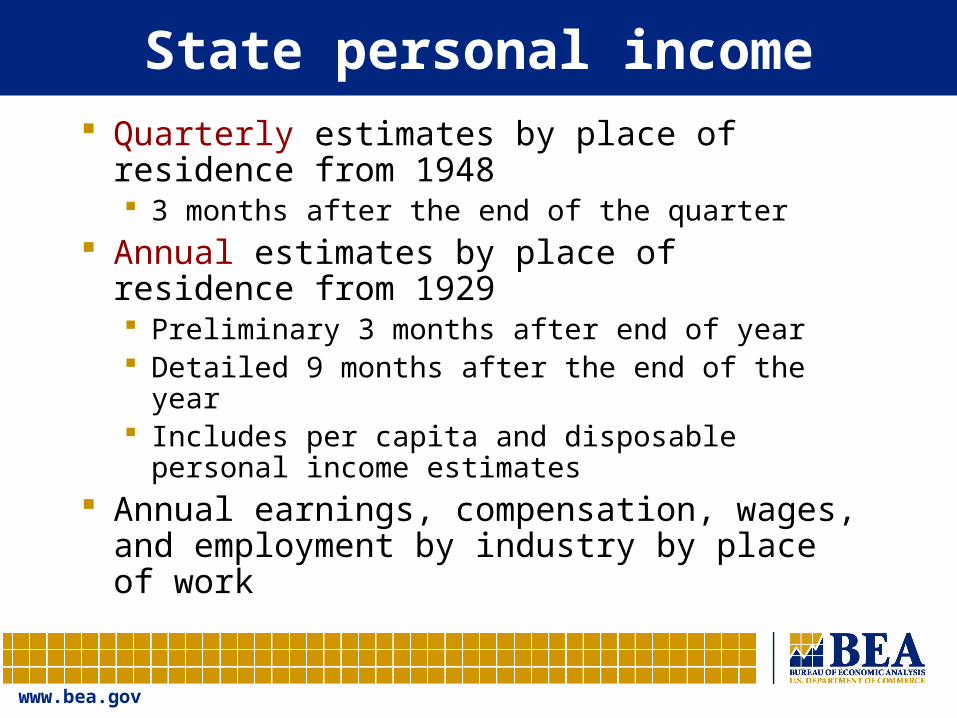
State personal income Quarterly estimates by place of
residence from 1948 3 months after the end of the quarter
Annual estimates by place of residence from 1929 Preliminary 3 months after end of year Detailed 9 months after the end of the year Includes per capita and disposable personal
income estimates Annual earnings, compensation, wages,
and employment by industry by place of work
www.bea.gov
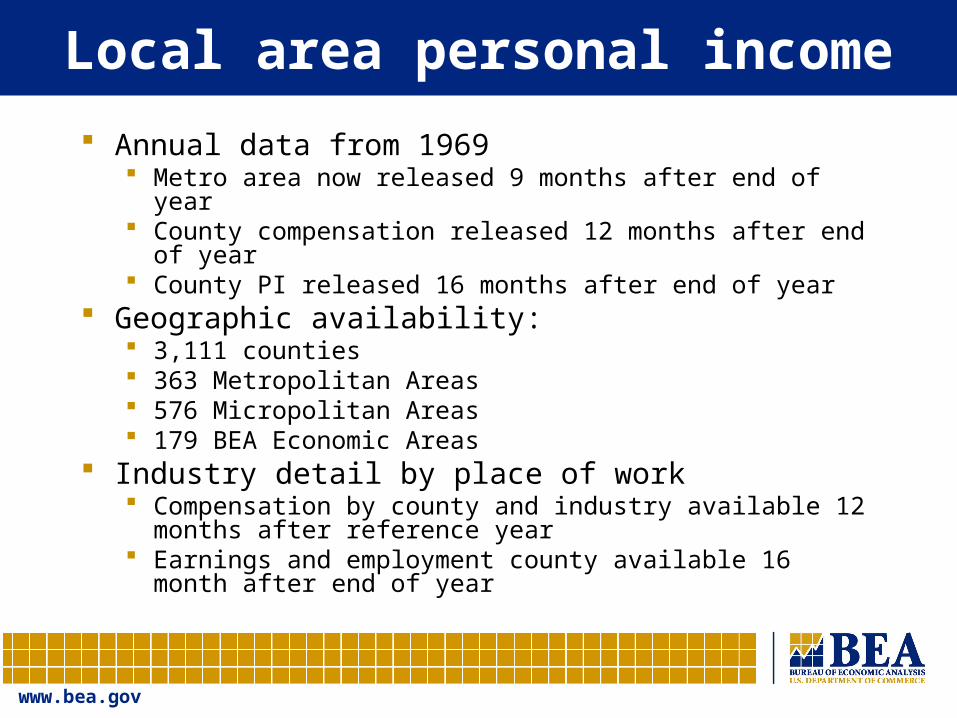
Local area personal income
Annual data from 1969 Metro area now released 9 months after end of year County compensation released 12 months after end
of year County PI released 16 months after end of year
Geographic availability: 3,111 counties 363 Metropolitan Areas 576 Micropolitan Areas 179 BEA Economic Areas
Industry detail by place of work Compensation by county and industry available 12
months after reference year Earnings and employment county available 16 month
after end of year
www.bea.gov
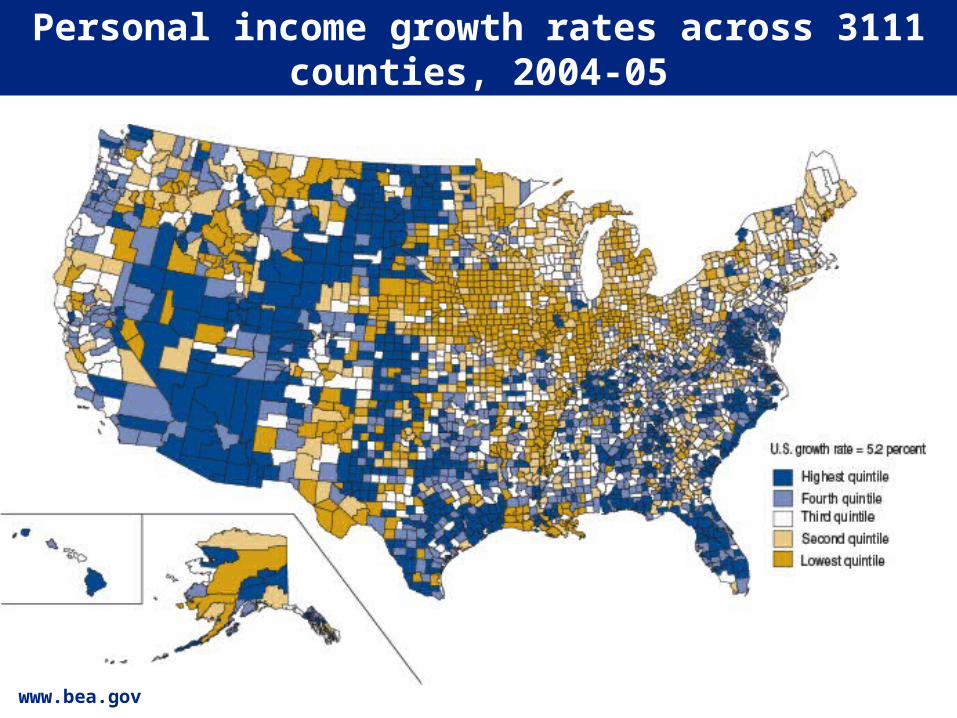
Personal income growth rates across 3111 counties, 2004-05
www.bea.gov
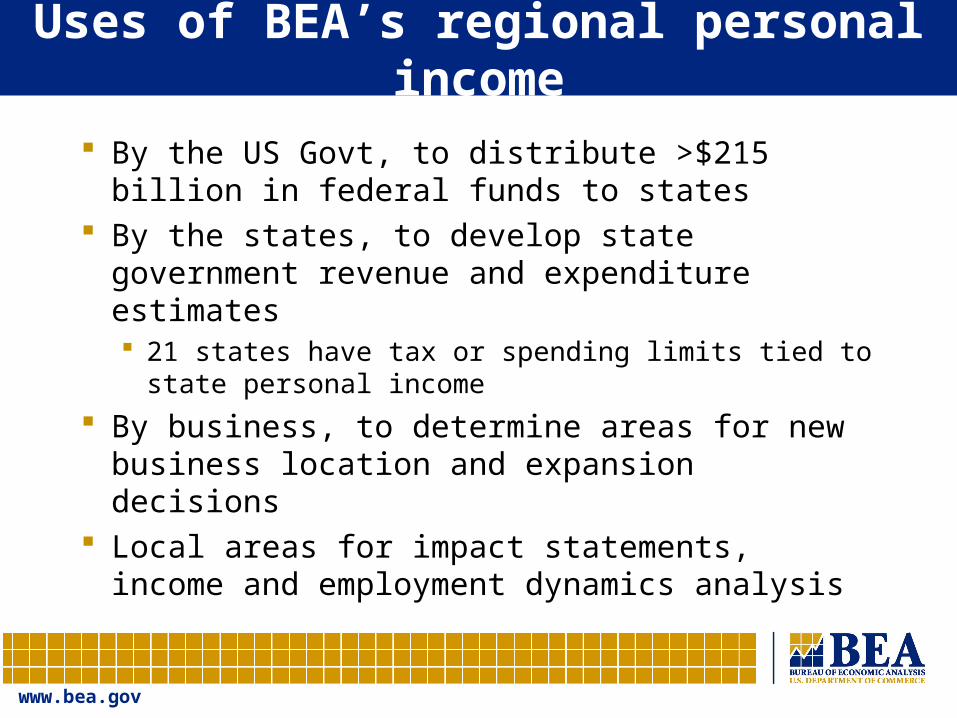
Uses of BEA’s regional personal income
By the US Govt, to distribute >$215 billion in federal funds to states
By the states, to develop state government revenue and expenditure estimates 21 states have tax or spending limits tied to
state personal income
By business, to determine areas for new business location and expansion decisions
Local areas for impact statements, income and employment dynamics analysis
www.bea.gov
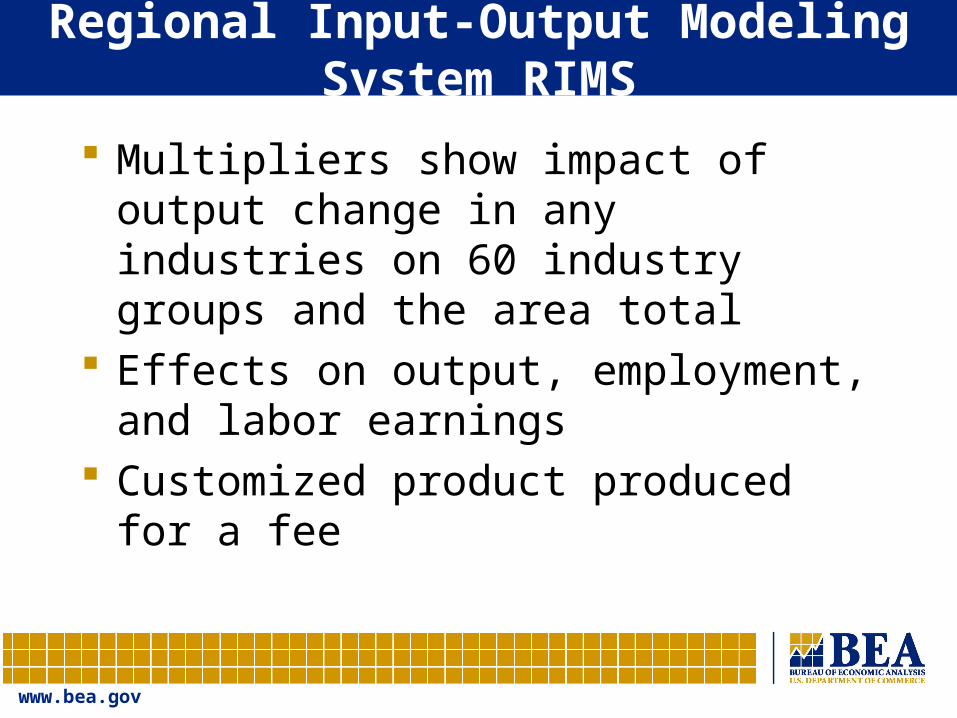
Regional Input-Output Modeling System RIMS
Multipliers show impact of output change in any industries on 60 industry groups and the area total
Effects on output, employment, and labor earnings
Customized product produced for a fee
www.bea.gov
www.bea.gov
What’s Behind the Regional Personal Income Statistics, And What Lies Ahead
www.bea.gov
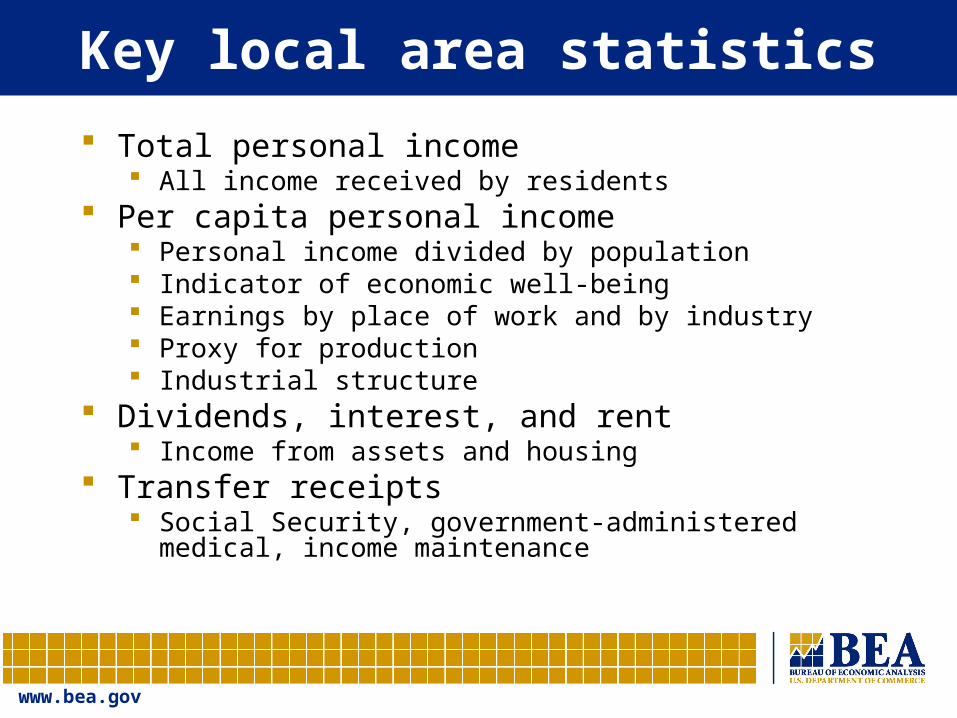
Key local area statistics
Total personal income All income received by residents
Per capita personal income Personal income divided by population Indicator of economic well-being Earnings by place of work and by industry Proxy for production Industrial structure
Dividends, interest, and rent Income from assets and housing
Transfer receipts Social Security, government-administered medical,
income maintenance
www.bea.gov
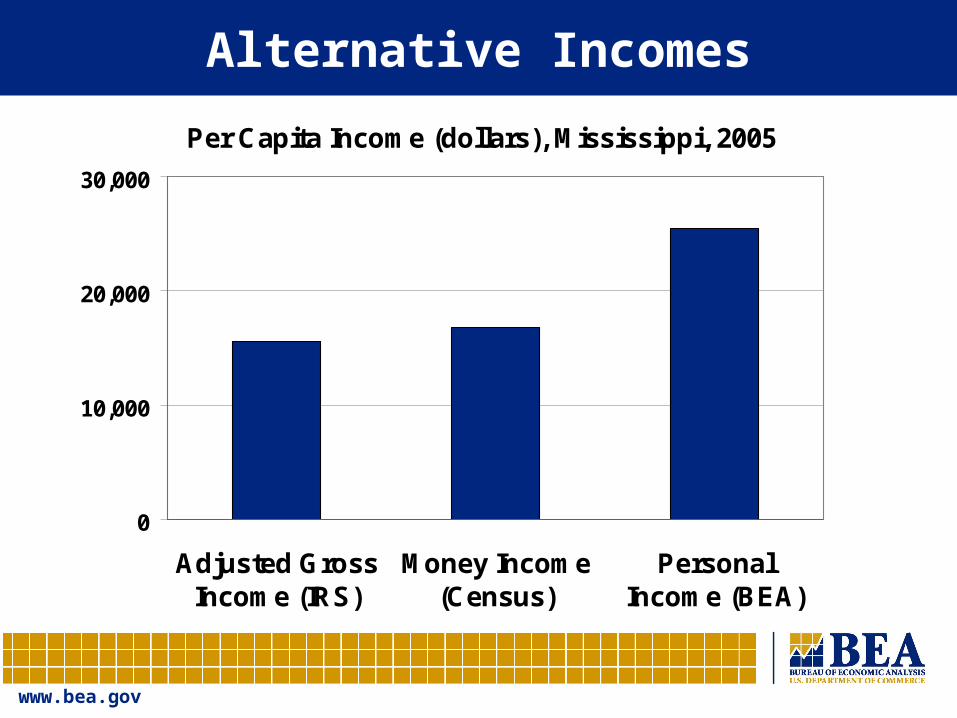
Per Capita Income (dollars), Mississippi, 2005
0
10,000
20,000
30,000
Adjusted GrossIncome (IRS)
Money Income(Census)
PersonalIncome (BEA)
Alternative Incomes
www.bea.gov
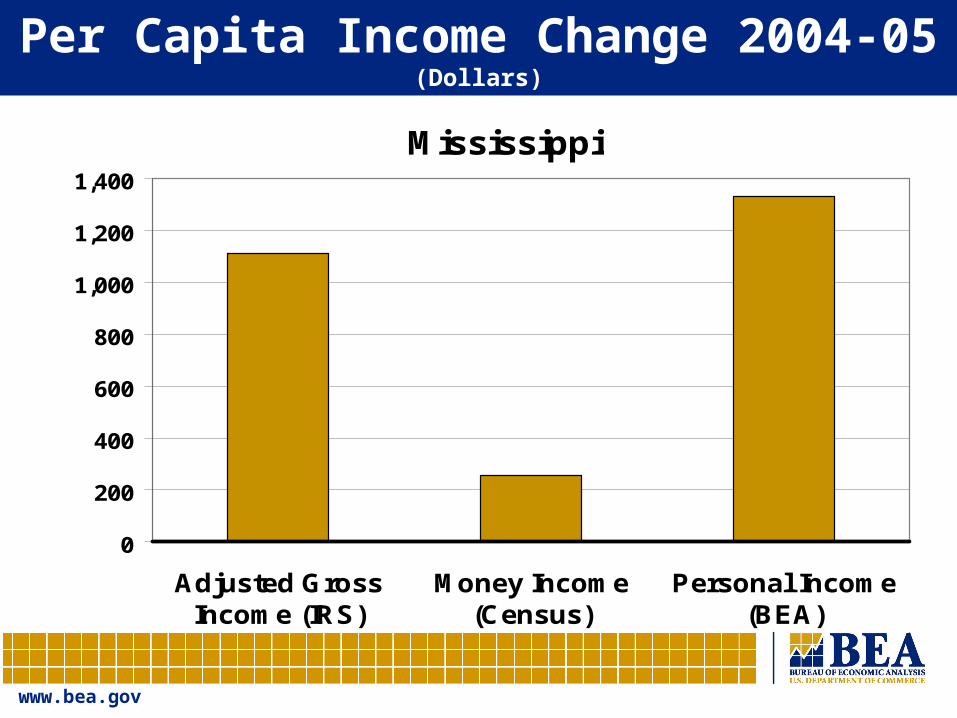
Mississippi
0
200
400
600
800
1,000
1,200
1,400
Adjusted GrossIncome (IRS)
Money Income(Census)
Personal Income(BEA)
Per Capita Income Change 2004-05
(Dollars)
www.bea.gov
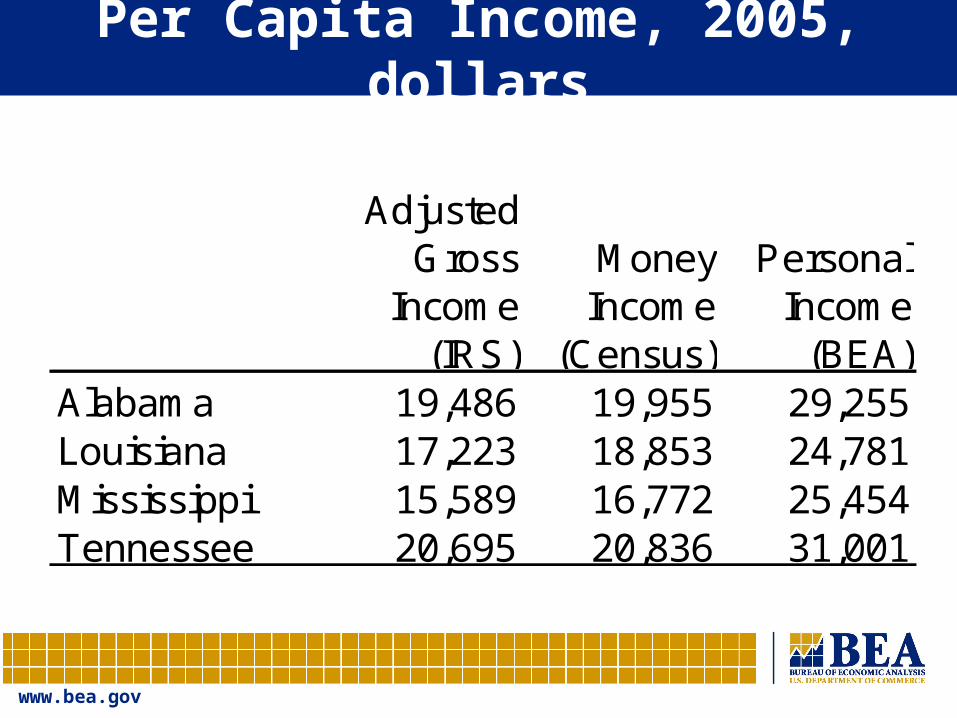
Adjusted Gross
Income (IRS)
Money Income
(Census)
Personal Income
(BEA)Alabama 19,486 19,955 29,255Louisiana 17,223 18,853 24,781Mississippi 15,589 16,772 25,454Tennessee 20,695 20,836 31,001
Per Capita Income, 2005, dollars
www.bea.gov
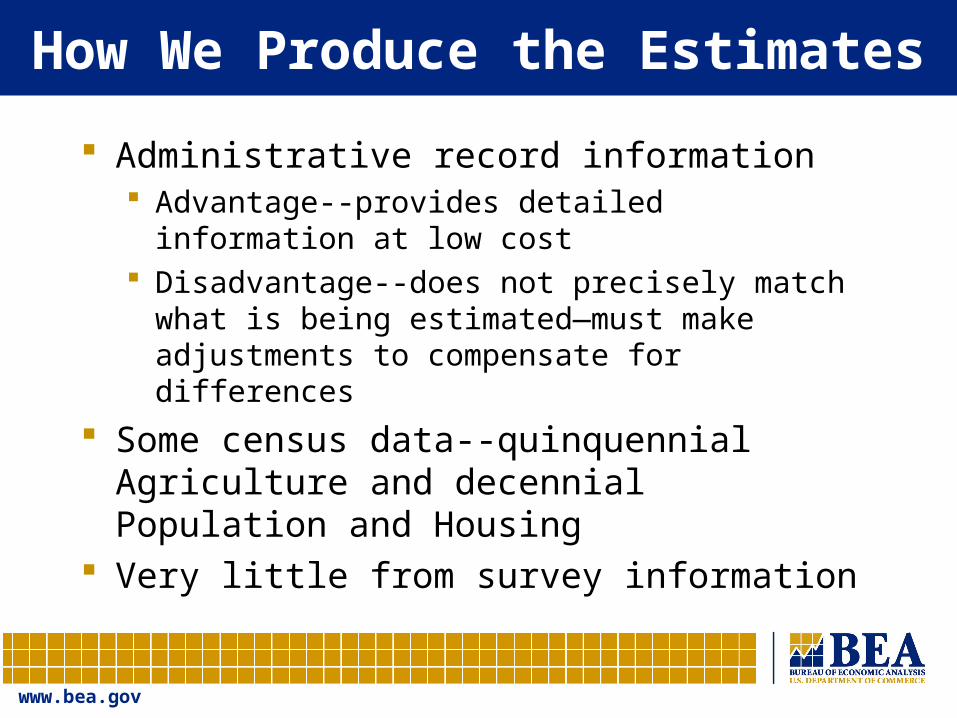
How We Produce the Estimates
Administrative record information Advantage--provides detailed information at
low cost Disadvantage--does not precisely match
what is being estimated—must make adjustments to compensate for differences
Some census data--quinquennial Agriculture and decennial Population and Housing
Very little from survey information
www.bea.gov
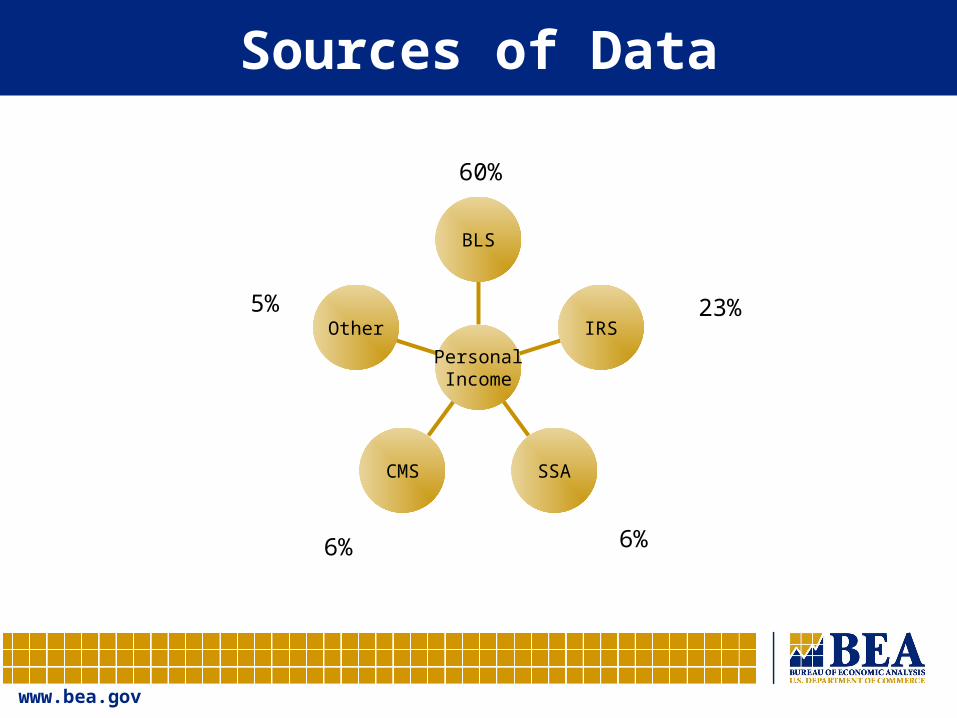
Sources of Data
Other
CMS SSA
IRS
BLS
PersonalIncome
60%
23%
6%6%
5%
www.bea.gov
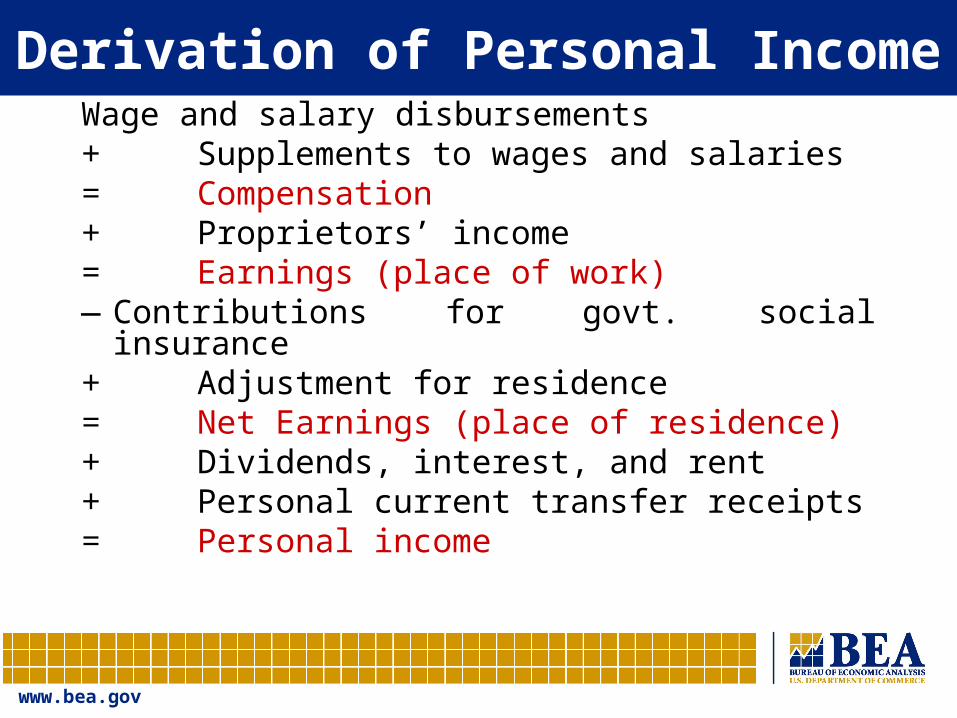
Derivation of Personal IncomeWage and salary disbursements+ Supplements to wages and salaries= Compensation+ Proprietors’ income= Earnings (place of work) — Contributions for govt. social
insurance+ Adjustment for residence= Net Earnings (place of
residence)+ Dividends, interest, and rent+ Personal current transfer receipts= Personal income
www.bea.gov
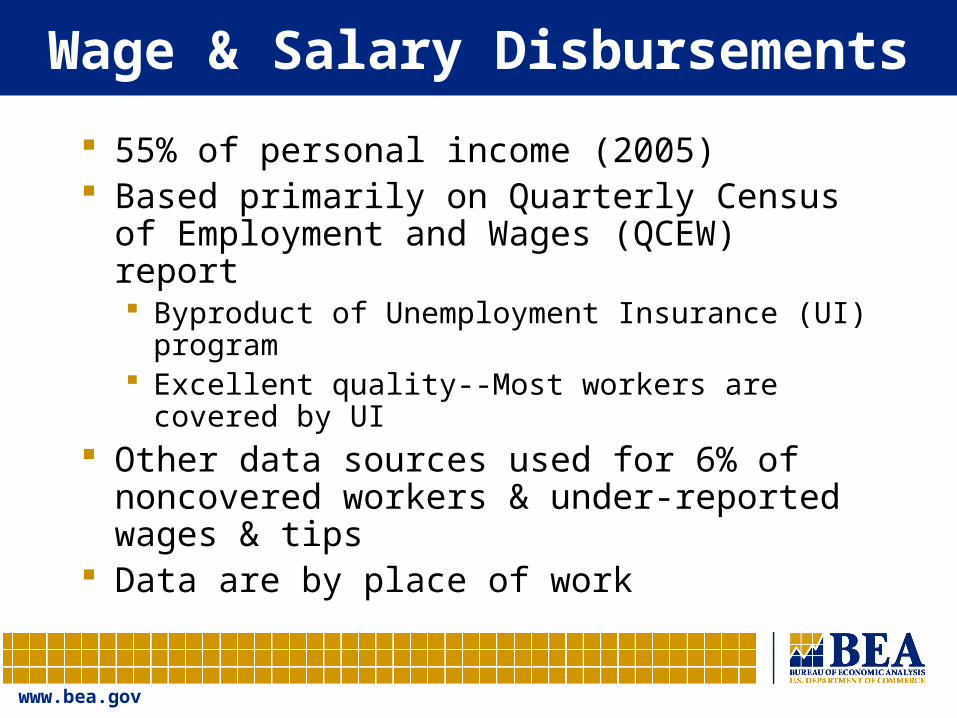
Wage & Salary Disbursements
55% of personal income (2005) Based primarily on Quarterly Census of
Employment and Wages (QCEW) report Byproduct of Unemployment Insurance (UI)
program Excellent quality--Most workers are covered
by UI Other data sources used for 6% of
noncovered workers & under-reported wages & tips
Data are by place of work

www.bea.gov
Supplements to Wages & Salaries
13% of personal income Employer contributions to:
Pension & private insurance funds (9%)
Govt. social insurance funds (4%)
www.bea.gov
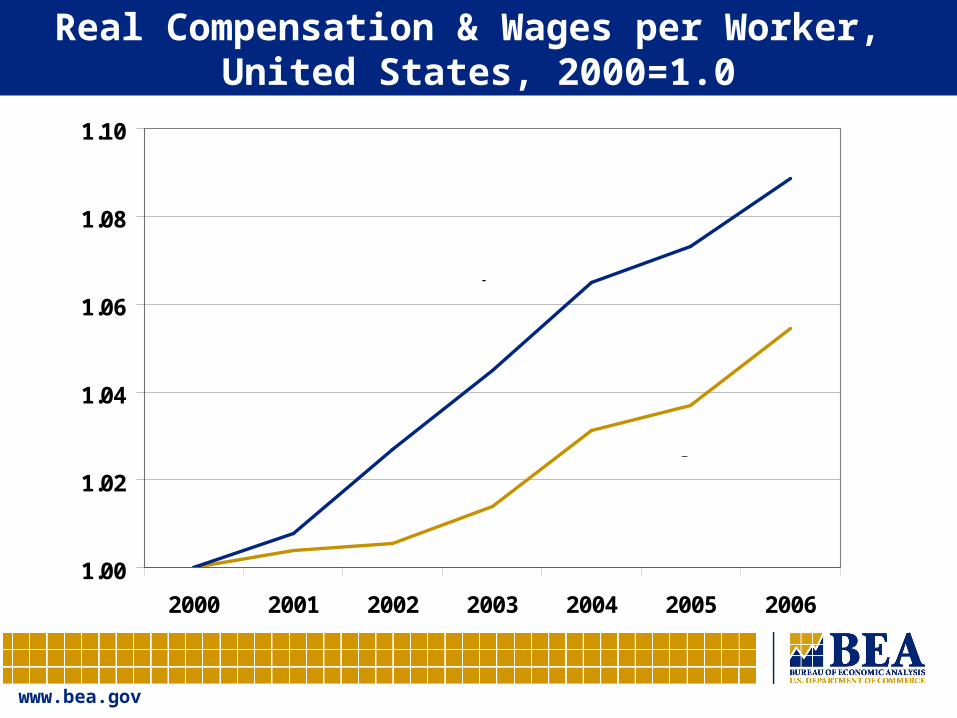
1.00
1.02
1.04
1.06
1.08
1.10
2000 2001 2002 2003 2004 2005 2006
Compensation
Wages
Real Compensation & Wages per Worker, United States, 2000=1.0
www.bea.gov
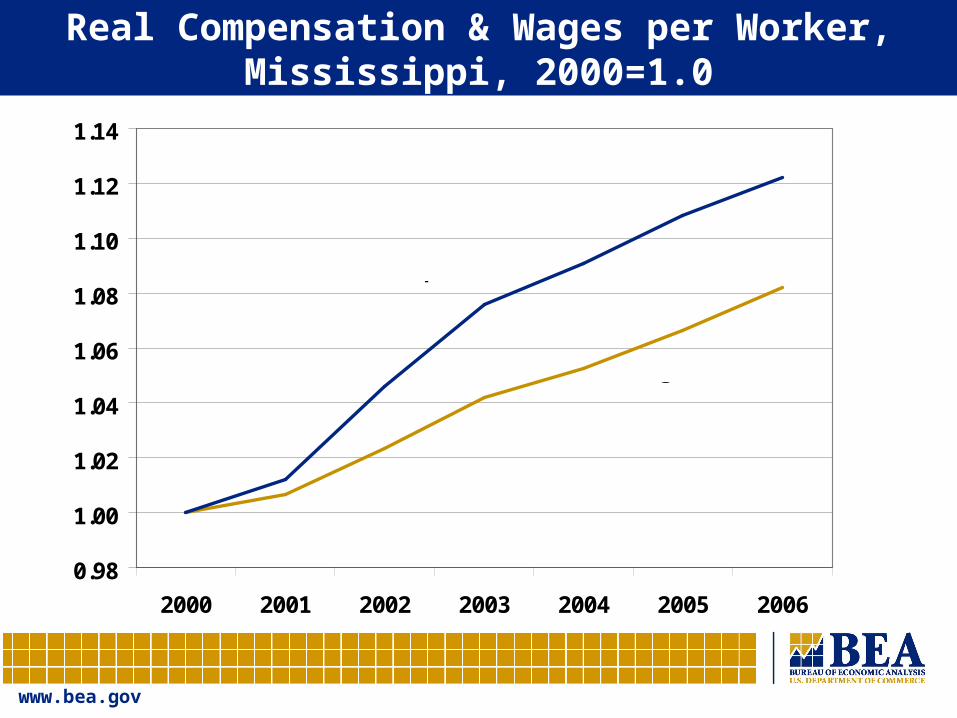
0.98
1.00
1.02
1.04
1.06
1.08
1.10
1.12
1.14
2000 2001 2002 2003 2004 2005 2006
Compensation
Wages
Real Compensation & Wages per Worker, Mississippi, 2000=1.0
www.bea.gov
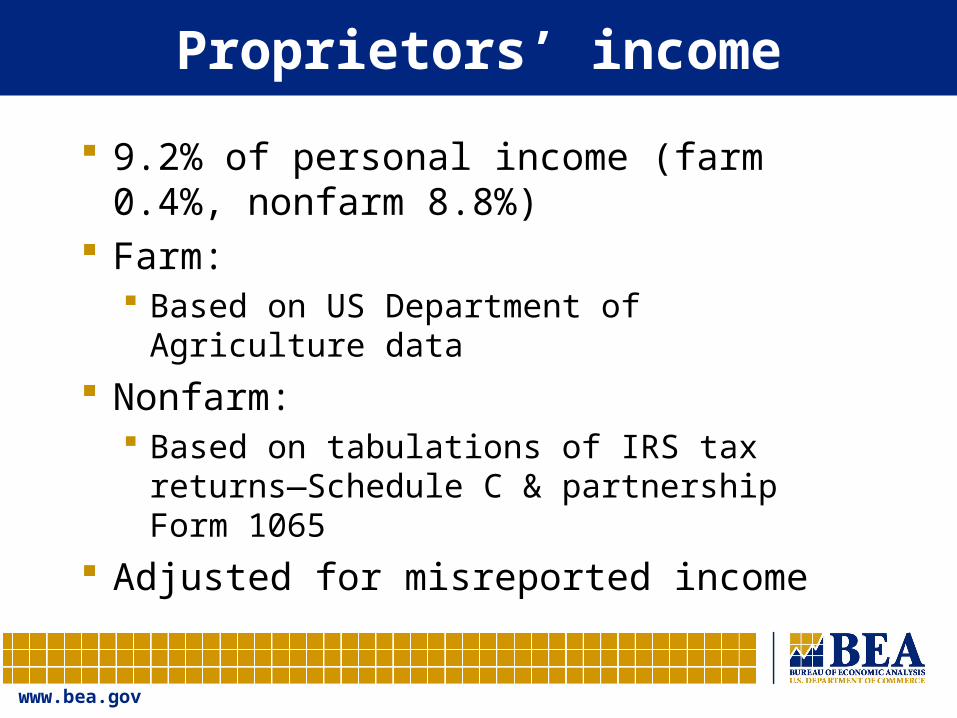
Proprietors’ income
9.2% of personal income (farm 0.4%, nonfarm 8.8%)
Farm: Based on US Department of Agriculture
data Nonfarm:
Based on tabulations of IRS tax returns—Schedule C & partnership Form 1065
Adjusted for misreported income

www.bea.gov
Contributions for Govt. Social Insurance
8% of personal income This is a deduction in the
derivation of personal income Mostly contributions for Social
Security & Medicare Contributions from Employers,
Employees, & the Self-Employed
www.bea.gov
Adjustment for Residence
Place of work compensation and earnings Shows location of production Used as proxy for current production
Place of residence income Indicator of economic well-being Shows where income is available for
tax planning and for spending analyses
www.bea.gov
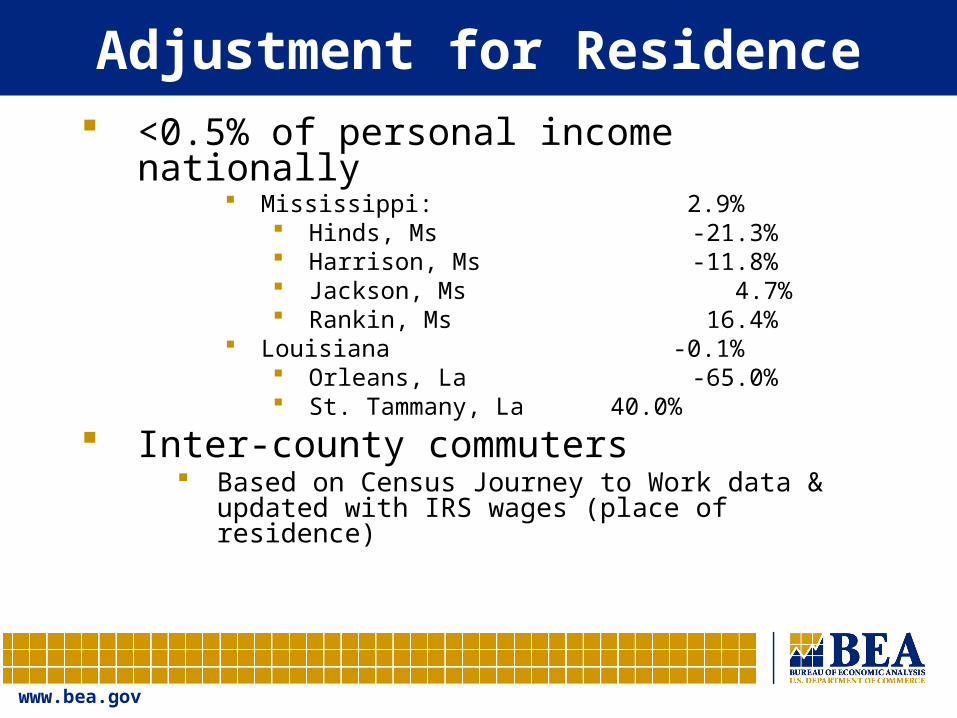
Adjustment for Residence <0.5% of personal income nationally
Mississippi: 2.9% Hinds, Ms -21.3% Harrison, Ms -11.8% Jackson, Ms 4.7% Rankin, Ms 16.4%
Louisiana -0.1% Orleans, La -65.0% St. Tammany, La 40.0%
Inter-county commuters Based on Census Journey to Work data &
updated with IRS wages (place of residence)
www.bea.gov
Dividends, Interest, & Rent
16% of personal income Nearly 1/2 of interest is received
by pension funds and life insurance carriers on behalf of persons
Local estimates based on tabulations of income tax returns and Census housing statistics
www.bea.gov
Personal Current Transfer Receipts
15% of personal income Social Security accounts for 1/3 Includes in-kind transfers such as
Medicare & Medicaid—45% of transfers
Income maintenance, unemployment benefits, veterans’ benefits, etc.
Based on primary data tabulated by state or county
www.bea.gov
Future Improvements: Personal Income
Accelerate the release of county estimates of personal income 10 months after end of year FY 2008 budget initiative to
investigate the feasibility of producing this
www.bea.gov
Future Improvements: GDP Metro
Gross domestic product for metropolitan areas Prototype estimates released in 2007 FY 2008 budget initiative to make this
permanent
www.bea.gov
And Finally: Comprehensive Revision
Spring 2010—every 5 years Definitional revisions Statistical and methodological
revisions Presentational revisions

www.bea.gov
Contact Information
Robert L. BrownChief, Regional Economic Measurement
Division202-606-9246