Embed Size (px)
Citation preview
Overview of the
GOVERNOR’SRECOMMENDED BUDGET
FOR THEFY 2018 ‐ FY 2019 BIENNIUM
Paul Potamianos, Executive Budget OfficerOffice of Policy and Management
April 20, 2017

Introduction
The Governor’s budget proposal for the biennium is balanced
Primarily through structural spending changes
Without increasing major tax rates
2
Budget Overview
3

Governor Malloy’s Recommended Budget
4

Baseline vs. Proposed Budget
Baseline represents prior year plus growth in fixed costs and entitlements The baseline budget for FY 2018, including updated consensus revenue
estimates, had a gap of $1.683 billion The Governor’s recommended budget closes that gap with $1.364 billion in
expenditure reductions and $321 million in revenue adjustments Those changes roll forward with some adjustments to produce balance in FY
2019 as well This budget builds upon $850 million in spending reductions implemented
in FY 2017
5
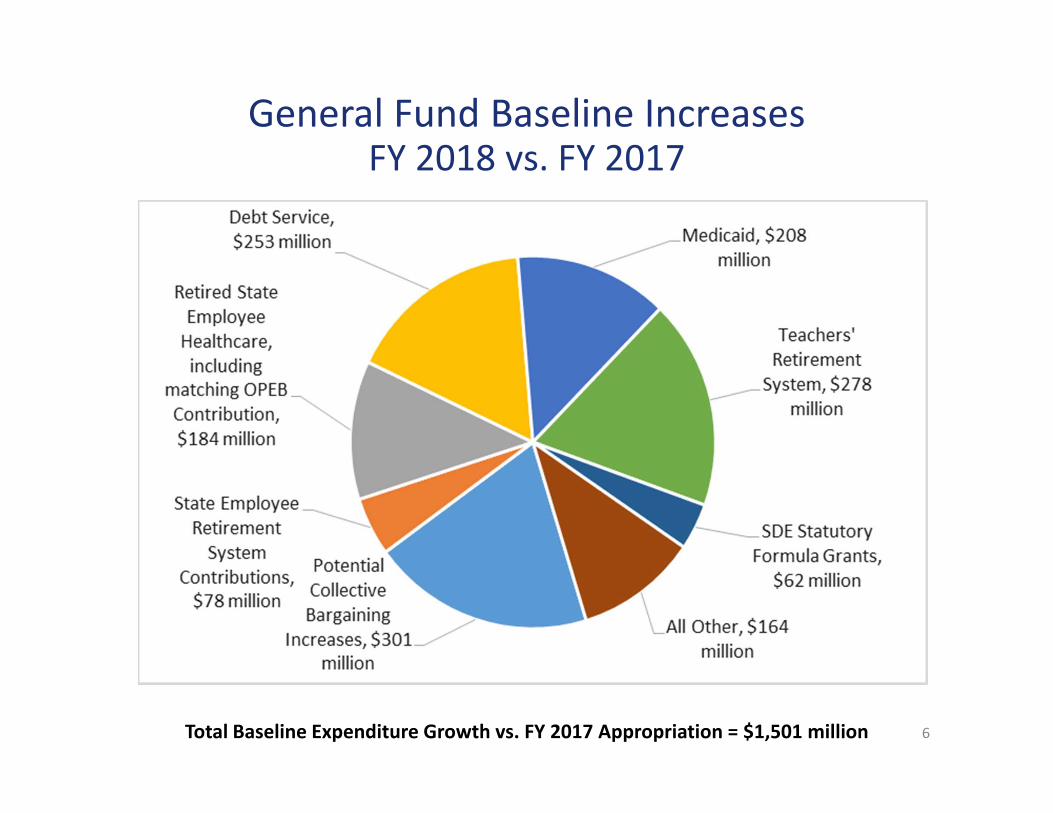
General Fund Baseline IncreasesFY 2018 vs. FY 2017
Total Baseline Expenditure Growth vs. FY 2017 Appropriation = $1,501 million 6
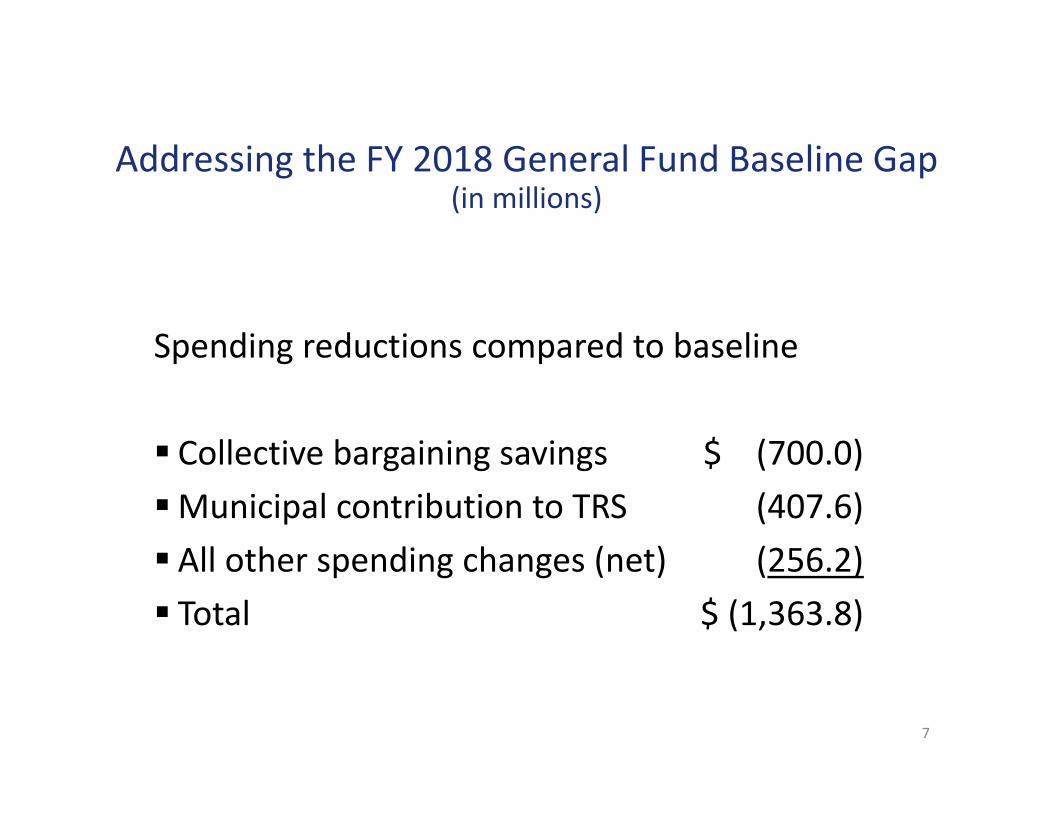
Addressing the FY 2018 General Fund Baseline Gap(in millions)
Spending reductions compared to baseline
Collective bargaining savings $ (700.0)Municipal contribution to TRS (407.6) All other spending changes (net) (256.2) Total $ (1,363.8)
7
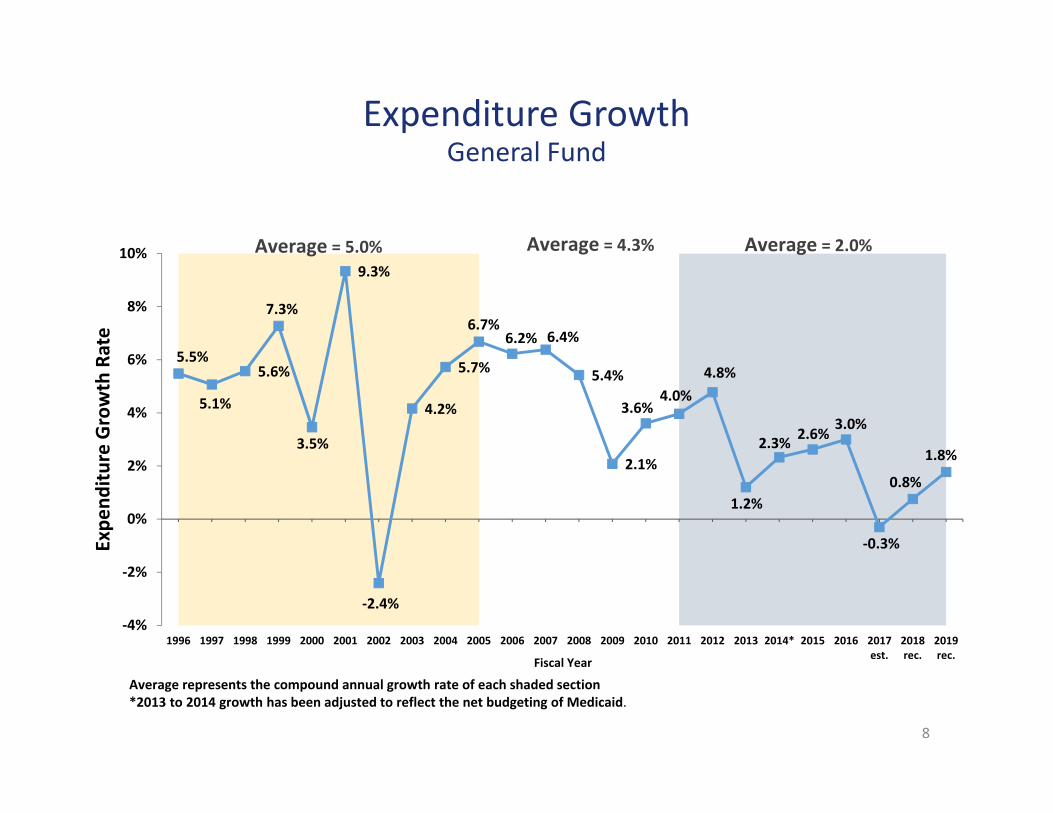
Expenditure GrowthGeneral Fund
5.5%
5.1%
5.6%
7.3%
3.5%
9.3%
‐2.4%
4.2%
5.7%
6.7%6.2% 6.4%
5.4%
2.1%
3.6%4.0%
4.8%
1.2%
2.3% 2.6% 3.0%
‐0.3%
0.8%
1.8%
‐4%
‐2%
0%
2%
4%
6%
8%
10%
1996 1997 1998 1999 2000 2001 2002 2003 2004 2005 2006 2007 2008 2009 2010 2011 2012 2013 2014* 2015 2016 2017est.
2018rec.
2019rec.
Expe
nditu
re Growth Rate
Fiscal Year
Average represents the compound annual growth rate of each shaded section*2013 to 2014 growth has been adjusted to reflect the net budgeting of Medicaid.
Average = 2.0%Average = 4.3%Average = 5.0%
8
Municipal Aid
9

State Aid to or on Behalf of Local Governments(in millions)
$581.82 $654.03 $645.93
$3,321.7 $3,301.8 $3,303.8
$1,151.8 $1,053.0 $1,063.6
$0
$1,000
$2,000
$3,000
$4,000
$5,000
$6,000
FY 2017 FY 2018 FY 2019Teachers' Retirement: Debt Service, Retiree Health and Retirement Contributions Education General Government
$5,055.3 $5,008.8 $5,013.3
10
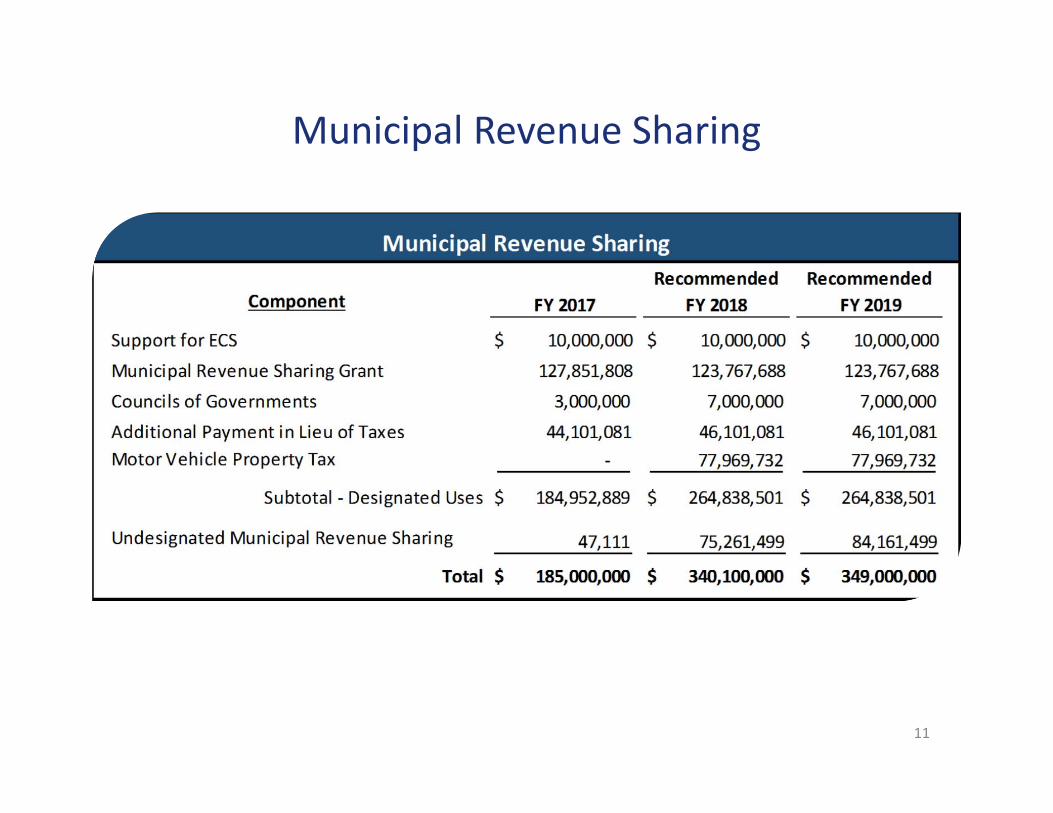
Municipal Revenue Sharing
11

Teachers’ Retirement The Governor proposes that municipalities begin to contribute one‐third of the employer share of teachers’ pension costs
Proposal complies with bond indenture
No changes to teachers’ retirement benefits or contributions
Municipal contributions will total $407.6 million in FY 2018 and $420.9 million in FY 2019
12

Retired Teachers’ Healthcare
The Governor’s budget proposes raising the state share in support of these costs from about 18% to 25%
This represents a $10 million increase in funding for FY 2018 over the FY 2017 level and an additional $3.7 million increase in FY 2019
13
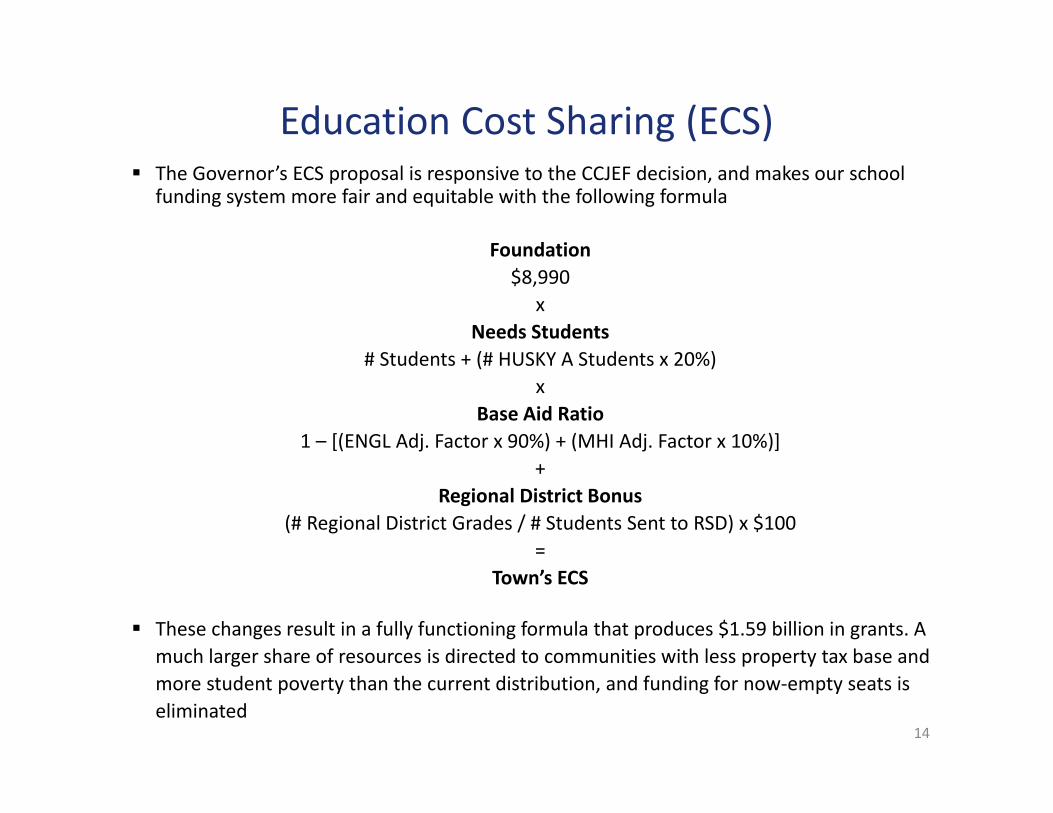
Education Cost Sharing (ECS) The Governor’s ECS proposal is responsive to the CCJEF decision, and makes our school
funding system more fair and equitable with the following formula
Foundation$8,990
xNeeds Students
# Students + (# HUSKY A Students x 20%)x
Base Aid Ratio1 – [(ENGL Adj. Factor x 90%) + (MHI Adj. Factor x 10%)]
+Regional District Bonus
(# Regional District Grades / # Students Sent to RSD) x $100=
Town’s ECS
These changes result in a fully functioning formula that produces $1.59 billion in grants. A much larger share of resources is directed to communities with less property tax base and more student poverty than the current distribution, and funding for now‐empty seats is eliminated
14
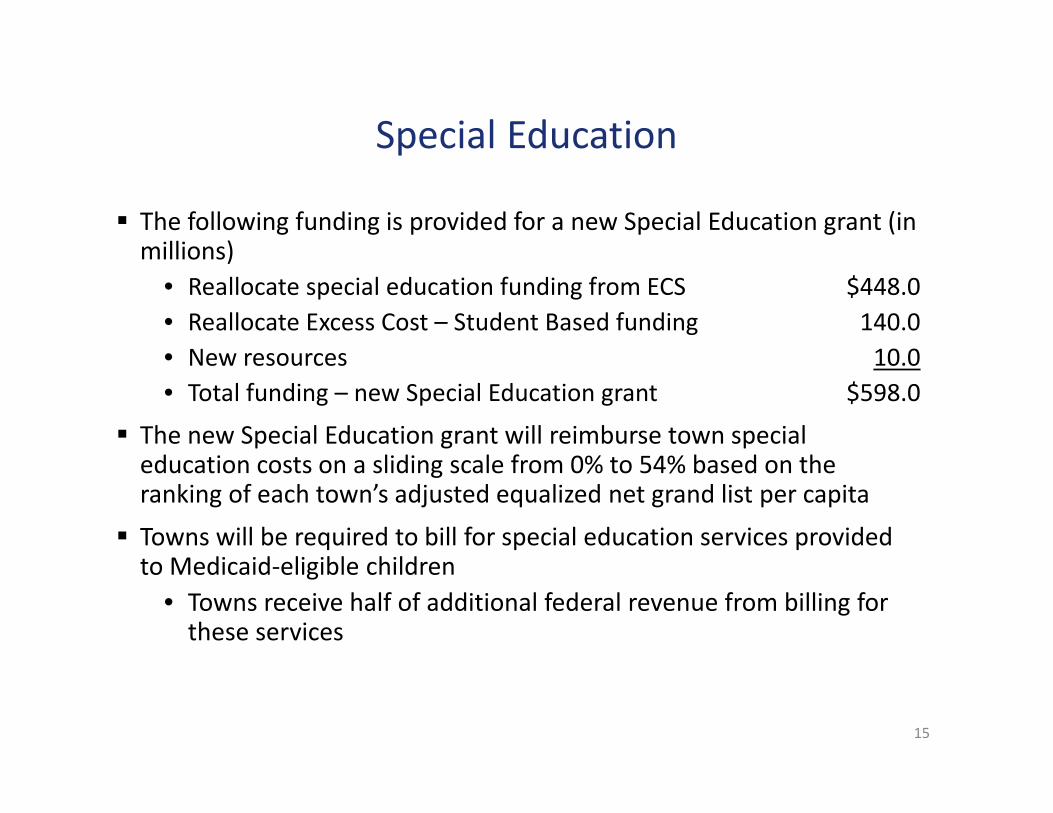
Special Education
The following funding is provided for a new Special Education grant (in millions)
• Reallocate special education funding from ECS $448.0• Reallocate Excess Cost – Student Based funding 140.0• New resources 10.0• Total funding – new Special Education grant $598.0
The new Special Education grant will reimburse town special education costs on a sliding scale from 0% to 54% based on the ranking of each town’s adjusted equalized net grand list per capita
Towns will be required to bill for special education services provided to Medicaid‐eligible children
• Towns receive half of additional federal revenue from billing for these services
15

Maximizing Federal Revenue and Local Option Property Taxation of Hospitals
The tax exemption for hospitals’ real property is eliminated
A local real property tax option is created which could add an estimated $212.2 million to town local revenue
New supplemental payments of $250.3 million are provided to hospitals from the state to help address the potential tax impact
These supplemental payments will generate $162.7 million in federal Medicaid reimbursement
16

17
Changes in Municipal Aid Are Progressive
Waterbury, $396
Hartford, $382
Manchester, $141
Middletown, $285
Danbury, $137
Monroe, $(329) New Fairfield, $(307)
Canaan, $(239)
Norwalk, $94
Wilton, $(209)
Greenwich, $(106)
$(500)
$(400)
$(300)
$(200)
$(100)
$‐
$100
$200
$300
$400
$500
Per C
apita
Change in M
unicipal Aid
Arranged by ENGLPC: ← Lowest (New Britain) to Highest (Greenwich) →
Per Capita Change in Municipal Aid from FY 2017 to FY 2018 Arranged by Equalized Net Grand List Per Capita (ENGLPC)
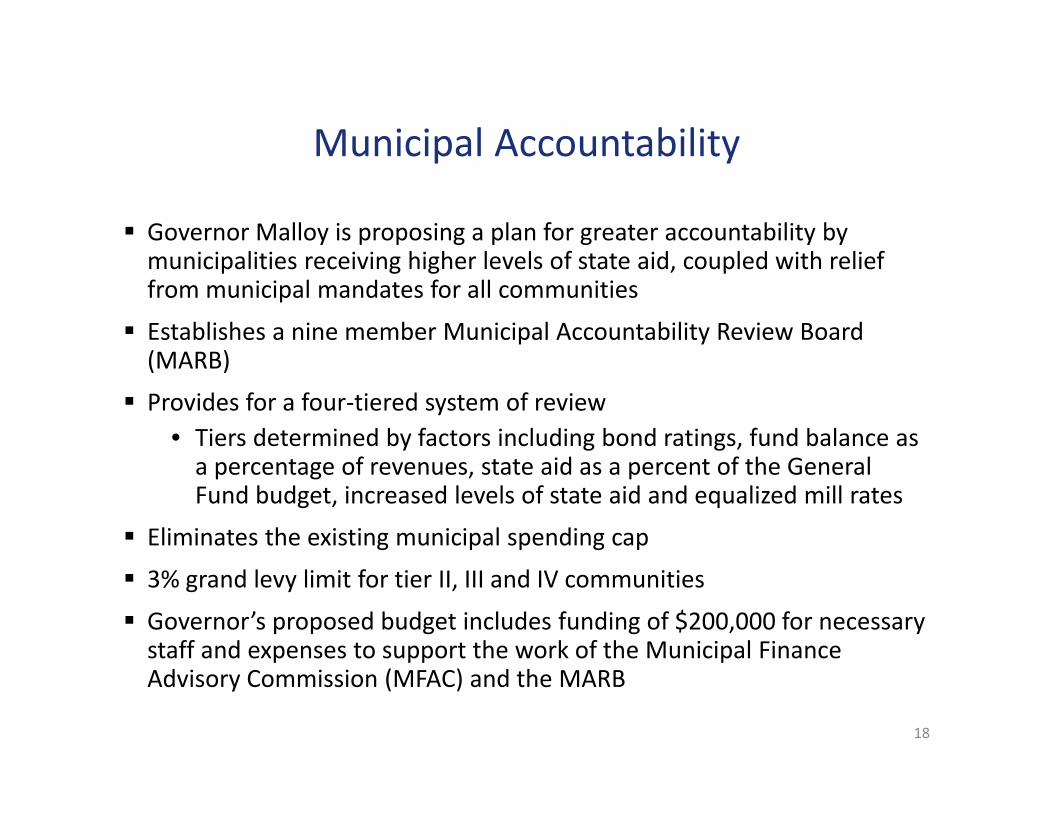
Municipal Accountability
Governor Malloy is proposing a plan for greater accountability by municipalities receiving higher levels of state aid, coupled with relief from municipal mandates for all communities
Establishes a nine member Municipal Accountability Review Board (MARB)
Provides for a four‐tiered system of review• Tiers determined by factors including bond ratings, fund balance as a percentage of revenues, state aid as a percent of the General Fund budget, increased levels of state aid and equalized mill rates
Eliminates the existing municipal spending cap
3% grand levy limit for tier II, III and IV communities
Governor’s proposed budget includes funding of $200,000 for necessary staff and expenses to support the work of the Municipal Finance Advisory Commission (MFAC) and the MARB
18

Other Program Changes
19

Department of Emergency Services and Public Protection (DESPP) – Fee Changes
State portion of the pistol permit fee will increase from $70 to $300, initial 5 year pistol permit fee will increase from $140 to $370
• Local authorities will still retain $70 of the initial permit• 5‐year renewal will also increase from $70 to $300• Estimated revenue from this change is $9 million annually
Background check fees will increase from $50 to $75• Estimated revenue from this change is $2.6 million annually
Resident state trooper charge to towns increasing to 100% of the total cost for all troopers
• Current charge is 85% for first two troopers and 100% for each trooper thereafter
• Estimated revenue from this change is $1.5 million annually
$750 surcharge per constable supervised by a resident state trooper• Estimated revenue from this change is $200,000 annually
20

Education Changes Connecticut Technical High School System (CTHSS)
• Strengthen system management and provide better service and coordination by realigning business functions in the CTHSS central office and four regions. Saves $2.7 million and will not impact classroom instruction or require closure of any schools
Office of Higher Education (OHE)• Realign OHE as a separate division under the State Dept. of Education, consistent with Every Student Succeeds Act requirement to coordinate K‐12 through higher education systems
Mandate Relief• Foster flexibility for school districts on curricular instruction, professional development, teaching in local high schools, and hiring and retention of superintendents
Regional Incentives• Increase ECS for regional participants, add eligibility to general improvements grants
School Construction• Governor submits priority list with budget, criteria include a review of district enrollment and capacity
• Cap priority list at $450 million for grants as submitted and $500 million when legislatively approved 21

Revenue
22
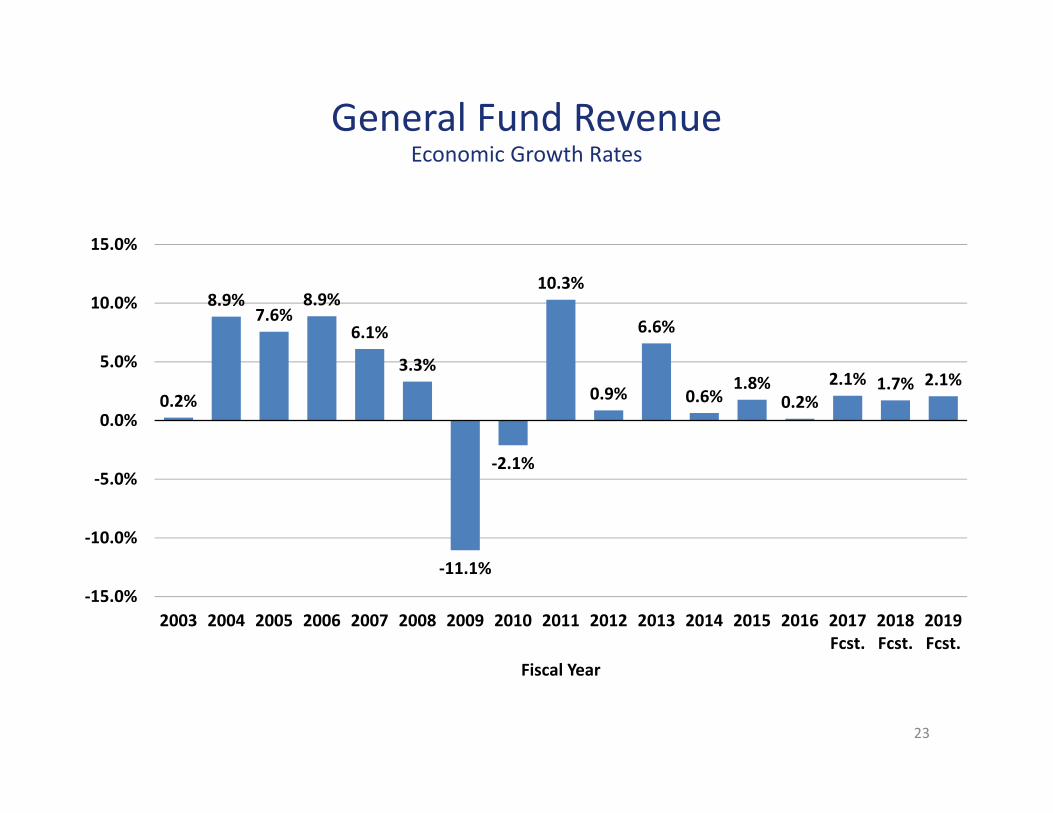
General Fund RevenueEconomic Growth Rates
0.2%
8.9%7.6%
8.9%
6.1%
3.3%
‐11.1%
‐2.1%
10.3%
0.9%
6.6%
0.6%1.8%
0.2%2.1% 1.7% 2.1%
‐15.0%
‐10.0%
‐5.0%
0.0%
5.0%
10.0%
15.0%
2003 2004 2005 2006 2007 2008 2009 2010 2011 2012 2013 2014 2015 2016 2017Fcst.
2018Fcst.
2019Fcst.
Fiscal Year
23

Revenue Preserves previously enacted tax changes that take effect during the biennium
• Phase‐in of teachers’ pension exemption• Sunset of 20% corporate surcharge• Phase‐in increase of the cap on R&D and URA tax credits
Gift and Estate Tax• Phase in exemption to federal level over three years
Insurance Premiums• Makes Connecticut a more competitive state for the insurance industry by lowering the insurance premium tax rate from 1.75% to 1.5%
Tobacco Taxes – Increases rates on cigarettes, cigars, and snuff• Aligns Connecticut’s cigarette tax with New York state, and taxes on other tobacco products with surrounding states
Tax Credits – Eliminates property tax credit and sets the earned income tax credit at 25% of the Federal EITC 33

Summary of Revenue Changes(in millions)
FY FYLegislative Proposals 2018 2019Eliminate the $200 Property Tax Credit $ 105.0 $ 105.0 Increase Cigarette Tax to $4.35 per pack and Other Tobacco Changes $ 59.8 $ 52.9 Decrease EITC from 27.5% to 25.0% $ 25.0 $ 26.0
Lower Insurance Premiums rate from 1.75% to 1.50% (11.0) (22.4)Make Insurance Premiums 3‐tier credit cap permanent 17.4 16.0
Make moratorium on film production tax credits permanent 4.0 4.0 Subtotal ‐ Insurance Premium Tax $ 10.4 $ (2.4)
Gift and Estate modifications $ ‐ $ (20.1)Modify minimum bottle pricing $ 1.9 $ 2.5 Impact on sales tax due to cigarette and minimum bottle changes $ 4.0 $ 3.7
Modifications to Ambulatory Surgical Center Tax $ (1.0) $ (1.0)All Tax Related Changes $ 205.1 $ 166.6
Fresh Start Initiative $ 60.0 $ 25.0 Eliminate Sales Tax Transfer To MRSA $ 340.1 $ 349.0 Transfer to MRSF from the resources of the General Fund $ (340.1) $ (349.0)
All Other Revenue Changes $ 55.7 $ 95.8 All General Fund Revenue Changes $ 320.8 $ 287.4
25

Proposed Capital Budget
26

Capital InvestmentsGovernor Malloy’s capital budget focuses on funding projects and
programs that address economic development and critical infrastructure needs
New general obligation bond authorizations
• $1.792 billion in FY 2018
• $1.714 billion in FY 2019
New transportation bond authorizations(in addition to previously approved Let’s Go CT! authorizations)
• $818.8 million in FY 2018
• $820.2 million in FY 2019
27
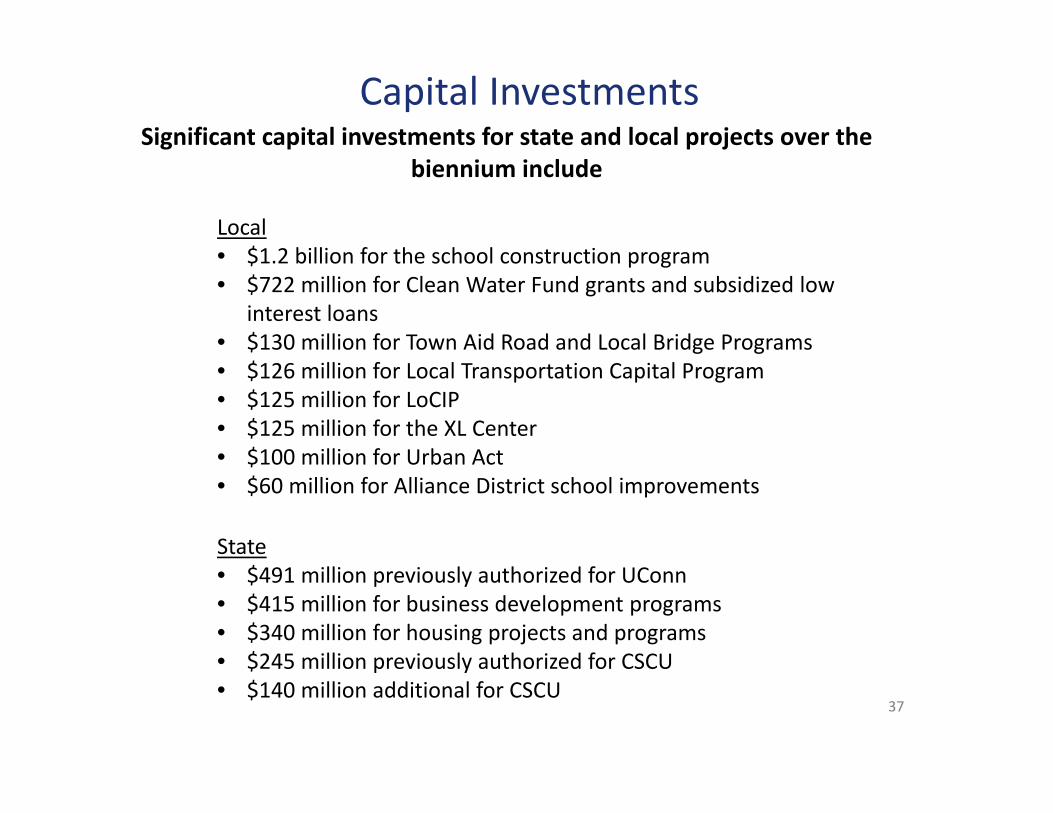
Capital Investments
Local• $1.2 billion for the school construction program• $722 million for Clean Water Fund grants and subsidized low
interest loans• $130 million for Town Aid Road and Local Bridge Programs• $126 million for Local Transportation Capital Program• $125 million for LoCIP• $125 million for the XL Center• $100 million for Urban Act• $60 million for Alliance District school improvements
State• $491 million previously authorized for UConn• $415 million for business development programs• $340 million for housing projects and programs• $245 million previously authorized for CSCU• $140 million additional for CSCU
Significant capital investments for state and local projects over the biennium include
37

Conclusion
29
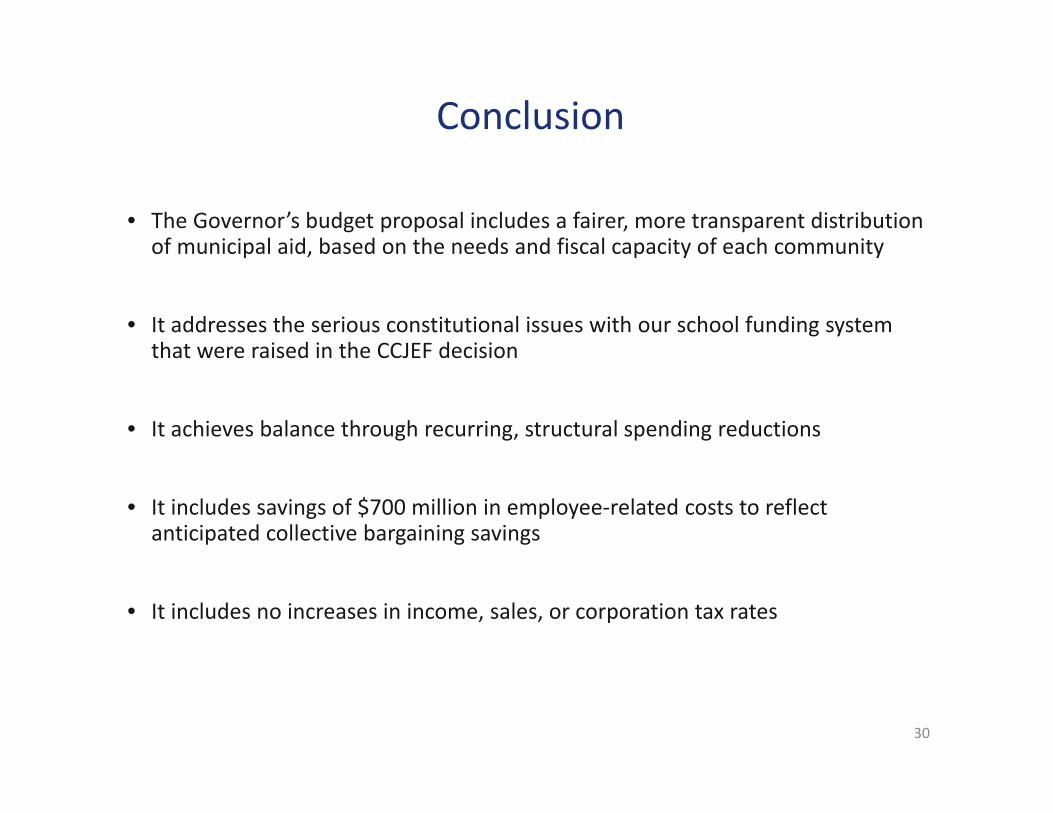
Conclusion
• The Governor’s budget proposal includes a fairer, more transparent distribution of municipal aid, based on the needs and fiscal capacity of each community
• It addresses the serious constitutional issues with our school funding system that were raised in the CCJEF decision
• It achieves balance through recurring, structural spending reductions
• It includes savings of $700 million in employee‐related costs to reflect anticipated collective bargaining savings
• It includes no increases in income, sales, or corporation tax rates
30
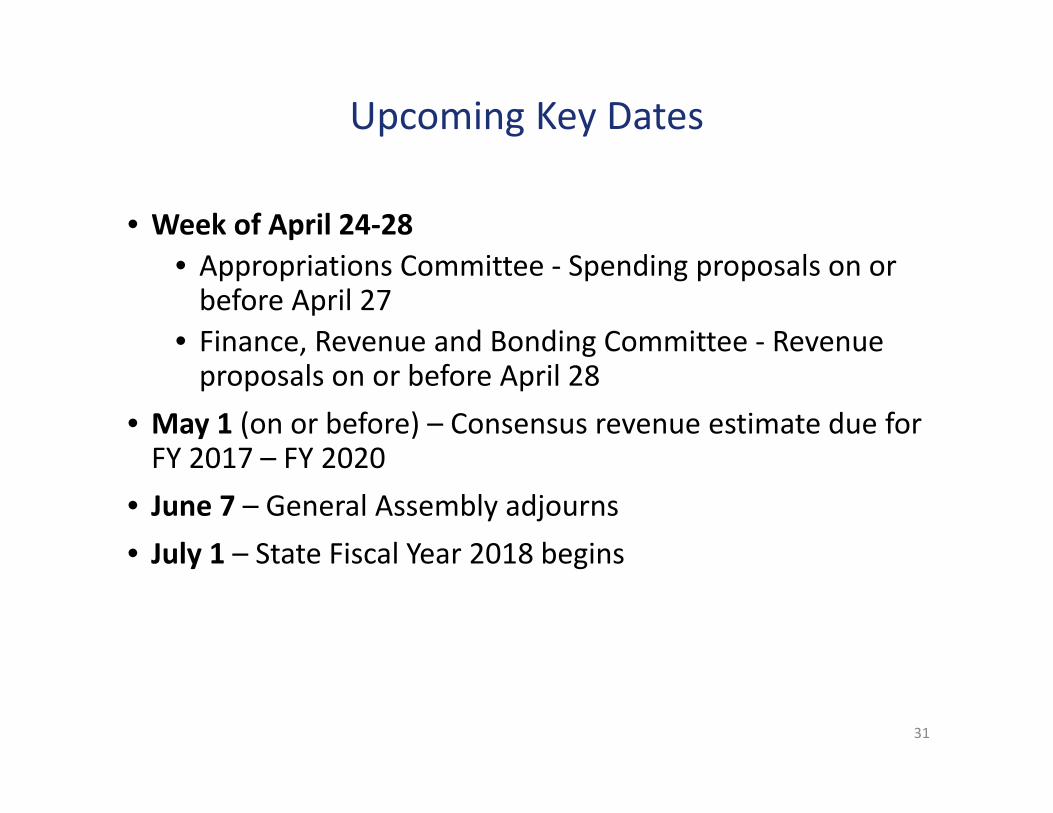
Upcoming Key Dates
• Week of April 24‐28• Appropriations Committee ‐ Spending proposals on or before April 27
• Finance, Revenue and Bonding Committee ‐ Revenue proposals on or before April 28
• May 1 (on or before) – Consensus revenue estimate due for FY 2017 – FY 2020
• June 7 – General Assembly adjourns• July 1 – State Fiscal Year 2018 begins
31