Embed Size (px)
Citation preview
Overview of the Incheon Strategy and Disability at a Glance 2012
Chol O Han
Social Development Division, ESCAP
Twelfth Meeting of the Washington Group on Disability Statistics, Bangkok, 23-25 October 2012
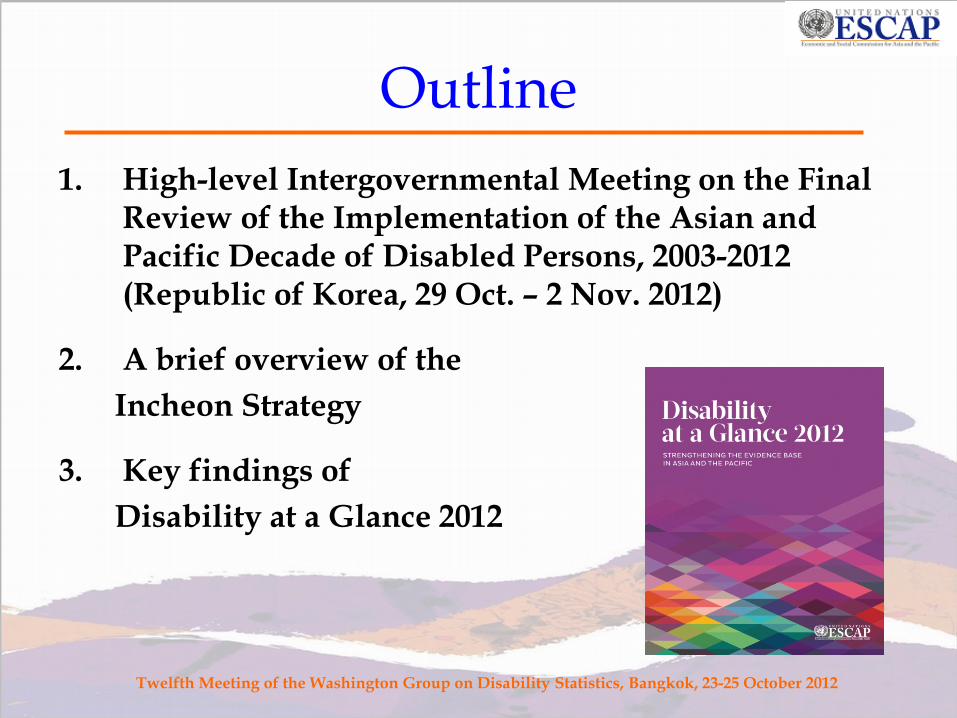
Outline 1. High-level Intergovernmental Meeting on the Final
Review of the Implementation of the Asian and Pacific Decade of Disabled Persons, 2003-2012 (Republic of Korea, 29 Oct. – 2 Nov. 2012)
2. A brief overview of the Incheon Strategy
3. Key findings of Disability at a Glance 2012
Twelfth Meeting of the Washington Group on Disability Statistics, Bangkok, 23-25 October 2012
High-level Intergovernmental Meeting
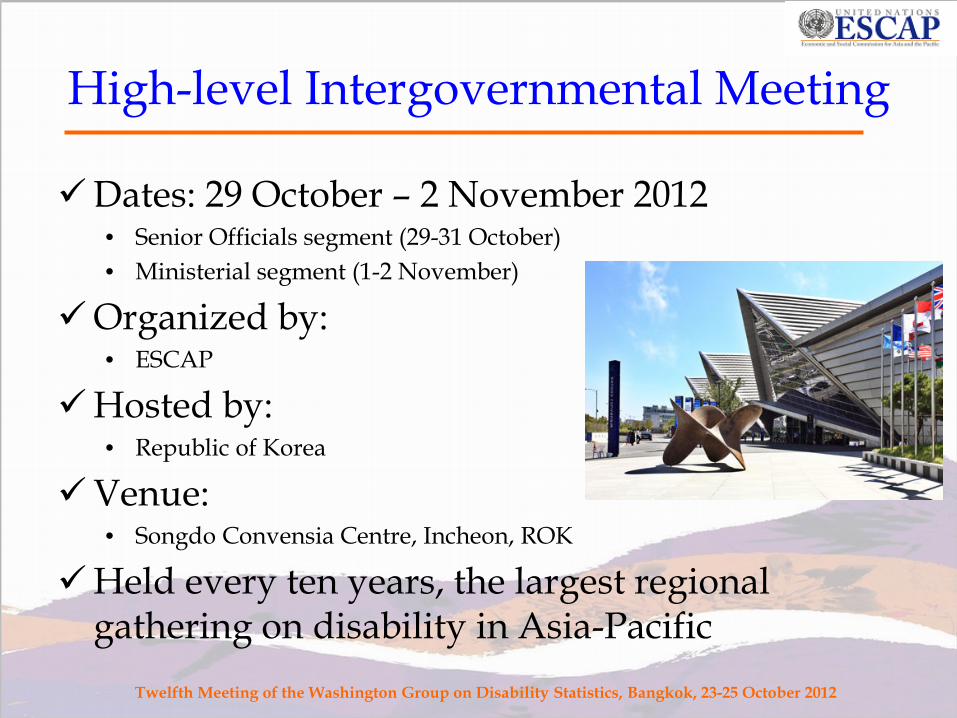
Dates: 29 October – 2 November 2012 • Senior Officials segment (29-31 October) • Ministerial segment (1-2 November)
Organized by: • ESCAP
Hosted by: • Republic of Korea
Venue: • Songdo Convensia Centre, Incheon, ROK
Held every ten years, the largest regional gathering on disability in Asia-Pacific
Twelfth Meeting of the Washington Group on Disability Statistics, Bangkok, 23-25 October 2012
Expected participation: Over 300 registered participants (as of 4 October
2012)
• 34 Governments (majority headed by Ministers)
• 50 civil society organizations
• 7 UN & other international organizations
Twelfth Meeting of the Washington Group on Disability Statistics, Bangkok, 23-25 October 2012
High-level Intergovernmental Meeting
Objectives & expected outcomes:
Reviewing progress & gaps during the past 10 years
Launching the new Asian and Pacific Decade of Persons with Disabilities, 2013-2022
Considering forward looking strategies to guide the implementation of the new Decade
Adoption of the Incheon Strategy
Regional input to the General Assembly High-level Meeting on Disability and Development, September 2013
Twelfth Meeting of the Washington Group on Disability Statistics, Bangkok, 23-25 October 2012
High-level Intergovernmental Meeting
Incheon Strategy
Aims to accelerate actions to promote disability-inclusive development and CRPD implementation in Asia-Pacific
Derived from the experiences in the implementation of two consecutive Asian and Pacific Decades of Disabled Persons (1993-2002, 2003-2012)
Based on the principles of the Convention on the Rights of Persons with Disabilities
Composed of 10 interrelated goals, 26 targets and 49 indicators, similar to the MDG structure
Twelfth Meeting of the Washington Group on Disability Statistics, Bangkok, 23-25 October 2012
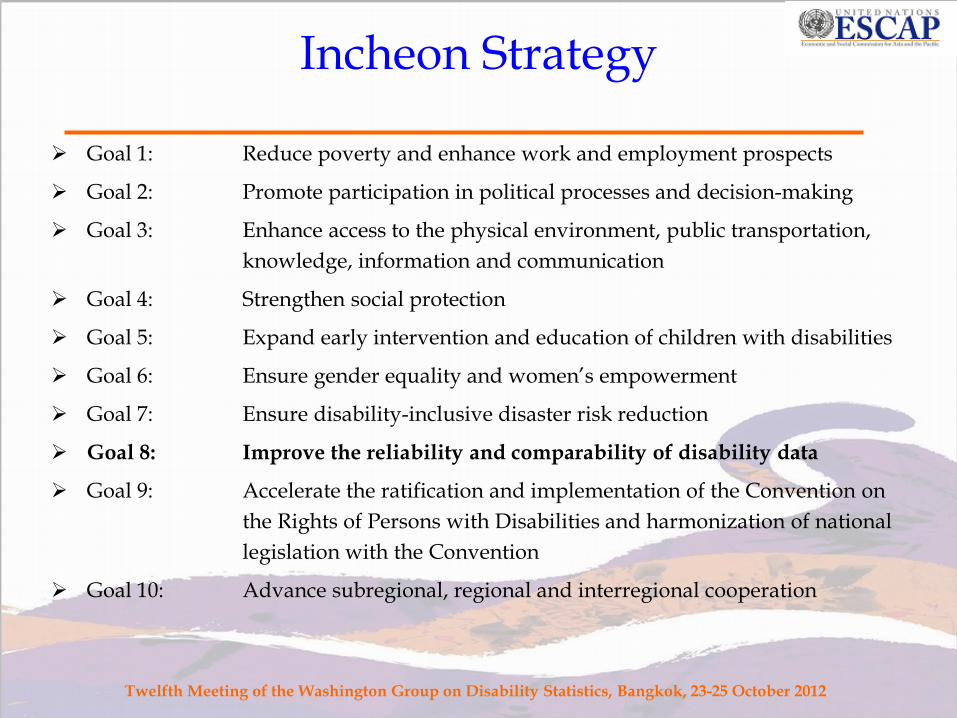
Goal 1: Reduce poverty and enhance work and employment prospects
Goal 2: Promote participation in political processes and decision-making
Goal 3: Enhance access to the physical environment, public transportation, knowledge, information and communication
Goal 4: Strengthen social protection
Goal 5: Expand early intervention and education of children with disabilities
Goal 6: Ensure gender equality and women’s empowerment
Goal 7: Ensure disability-inclusive disaster risk reduction
Goal 8: Improve the reliability and comparability of disability data
Goal 9: Accelerate the ratification and implementation of the Convention on the Rights of Persons with Disabilities and harmonization of national legislation with the Convention
Goal 10: Advance subregional, regional and interregional cooperation
Twelfth Meeting of the Washington Group on Disability Statistics, Bangkok, 23-25 October 2012
Incheon Strategy
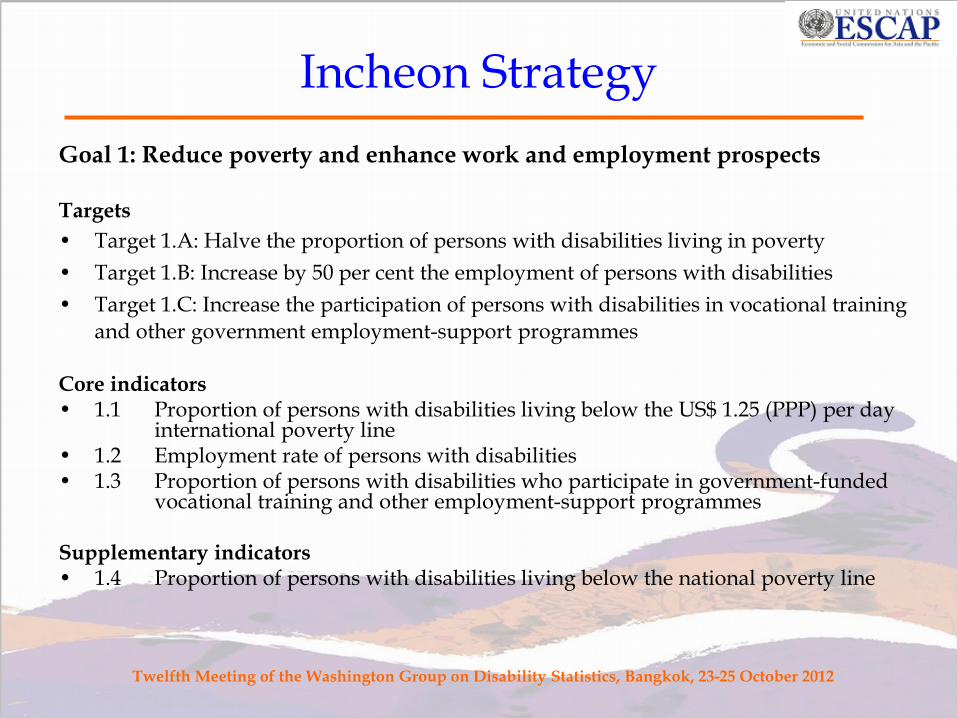
Goal 1: Reduce poverty and enhance work and employment prospects Targets • Target 1.A: Halve the proportion of persons with disabilities living in poverty • Target 1.B: Increase by 50 per cent the employment of persons with disabilities • Target 1.C: Increase the participation of persons with disabilities in vocational training
and other government employment-support programmes
Core indicators • 1.1 Proportion of persons with disabilities living below the US$ 1.25 (PPP) per day
international poverty line • 1.2 Employment rate of persons with disabilities • 1.3 Proportion of persons with disabilities who participate in government-funded
vocational training and other employment-support programmes Supplementary indicators • 1.4 Proportion of persons with disabilities living below the national poverty line
Twelfth Meeting of the Washington Group on Disability Statistics, Bangkok, 23-25 October 2012
Incheon Strategy
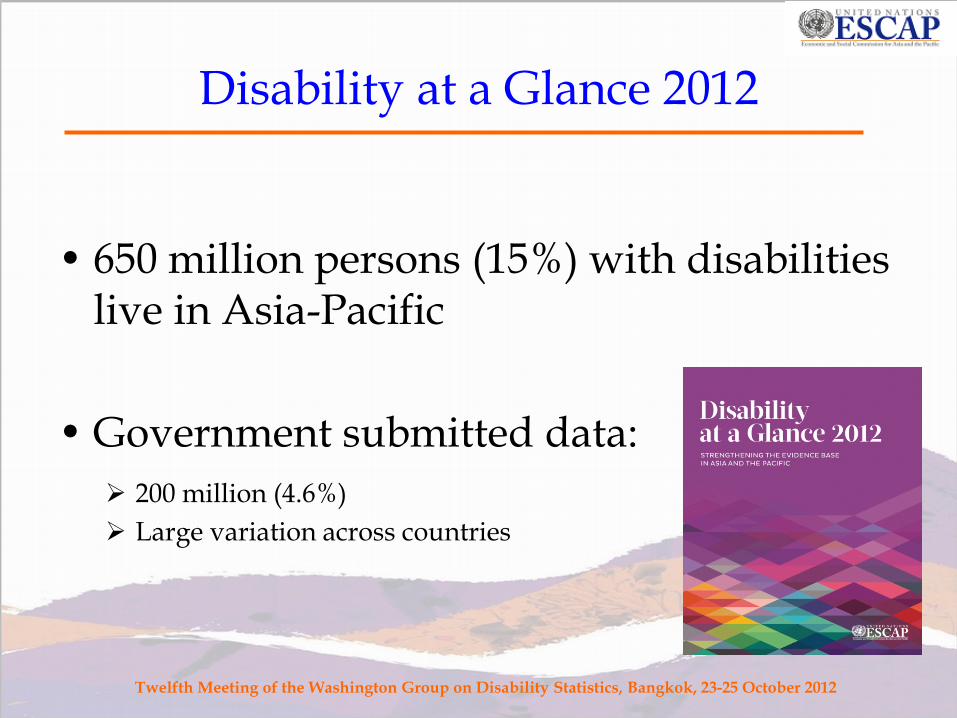
• 650 million persons (15%) with disabilities
live in Asia-Pacific
• Government submitted data: 200 million (4.6%) Large variation across countries
Twelfth Meeting of the Washington Group on Disability Statistics, Bangkok, 23-25 October 2012
Disability at a Glance 2012
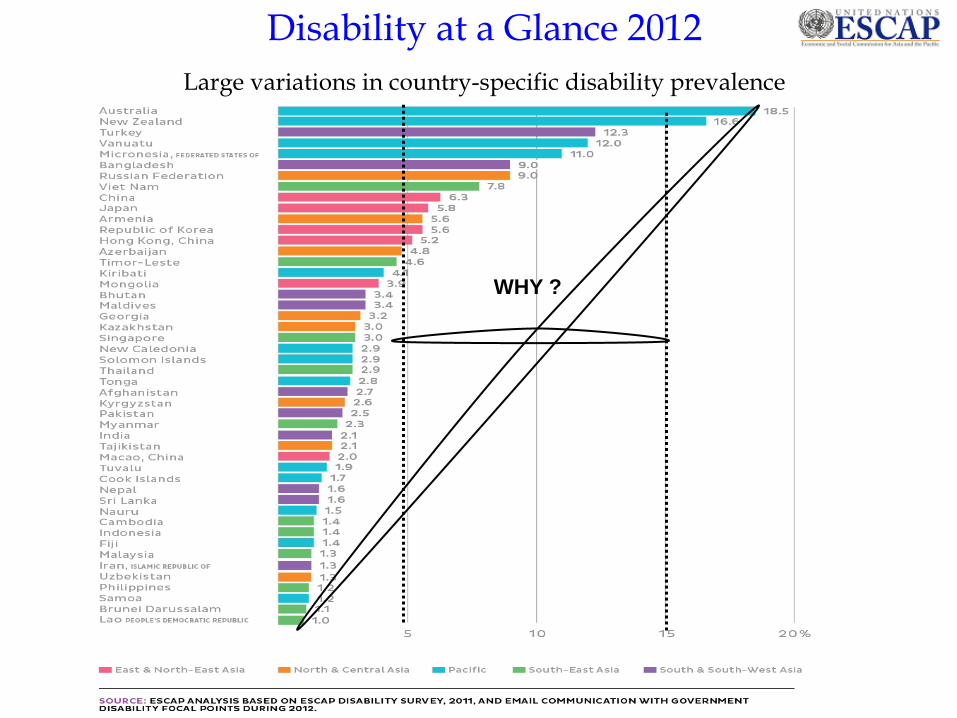
Disability at a Glance 2012 Large variations in country-specific disability prevalence
Average (4.6%)
WHO estimated average (15.0%)
WHY ?
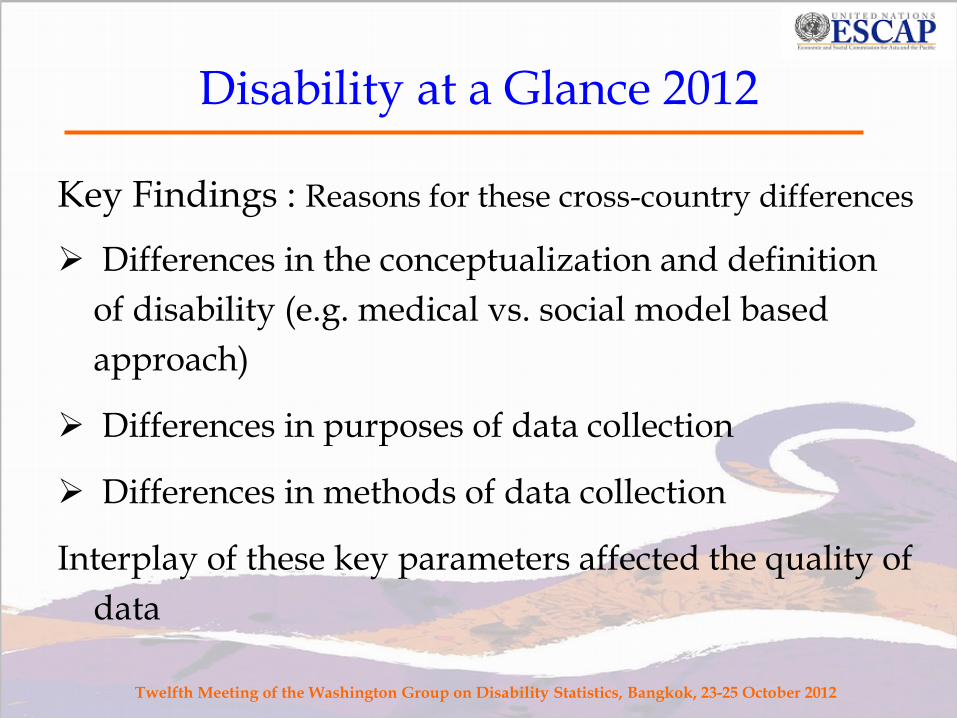
Key Findings : Reasons for these cross-country differences
Differences in the conceptualization and definition of disability (e.g. medical vs. social model based approach)
Differences in purposes of data collection
Differences in methods of data collection
Interplay of these key parameters affected the quality of data
Twelfth Meeting of the Washington Group on Disability Statistics, Bangkok, 23-25 October 2012
Disability at a Glance 2012
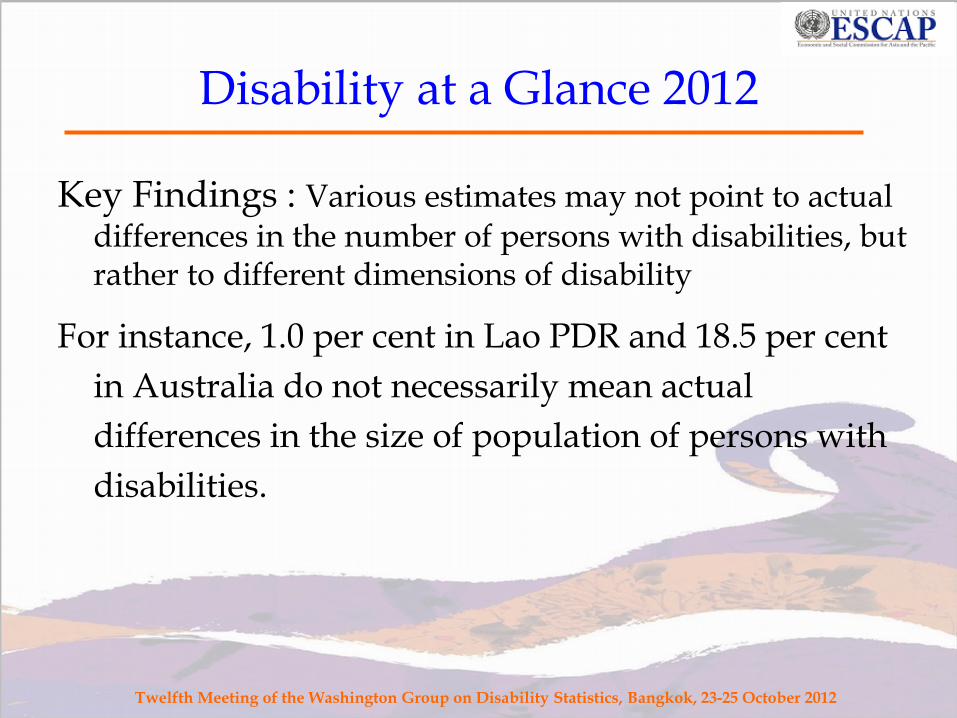
Key Findings : Various estimates may not point to actual differences in the number of persons with disabilities, but rather to different dimensions of disability
For instance, 1.0 per cent in Lao PDR and 18.5 per cent in Australia do not necessarily mean actual differences in the size of population of persons with disabilities.
Twelfth Meeting of the Washington Group on Disability Statistics, Bangkok, 23-25 October 2012
Disability at a Glance 2012
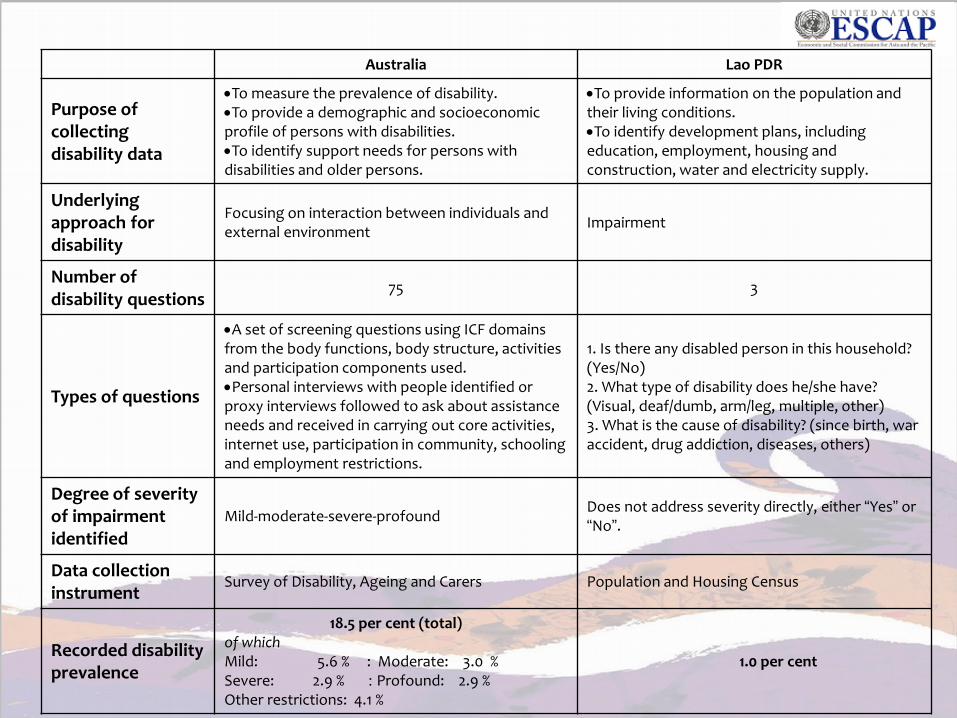
Australia Lao PDR
Purpose of collecting disability data
•To measure the prevalence of disability. •To provide a demographic and socioeconomic profile of persons with disabilities. •To identify support needs for persons with disabilities and older persons.
•To provide information on the population and their living conditions. •To identify development plans, including education, employment, housing and construction, water and electricity supply.
Underlying approach for disability
Focusing on interaction between individuals and external environment Impairment
Number of disability questions 75 3
Types of questions
•A set of screening questions using ICF domains from the body functions, body structure, activities and participation components used. •Personal interviews with people identified or proxy interviews followed to ask about assistance needs and received in carrying out core activities, internet use, participation in community, schooling and employment restrictions.
1. Is there any disabled person in this household? (Yes/No) 2. What type of disability does he/she have? (Visual, deaf/dumb, arm/leg, multiple, other) 3. What is the cause of disability? (since birth, war accident, drug addiction, diseases, others)
Degree of severity of impairment identified
Mild-moderate-severe-profound Does not address severity directly, either “Yes” or “No”.
Data collection instrument Survey of Disability, Ageing and Carers Population and Housing Census
Recorded disability prevalence
18.5 per cent (total) of which Mild: 5.6 % : Moderate: 3.0 % Severe: 2.9 % : Profound: 2.9 % Other restrictions: 4.1 %
1.0 per cent
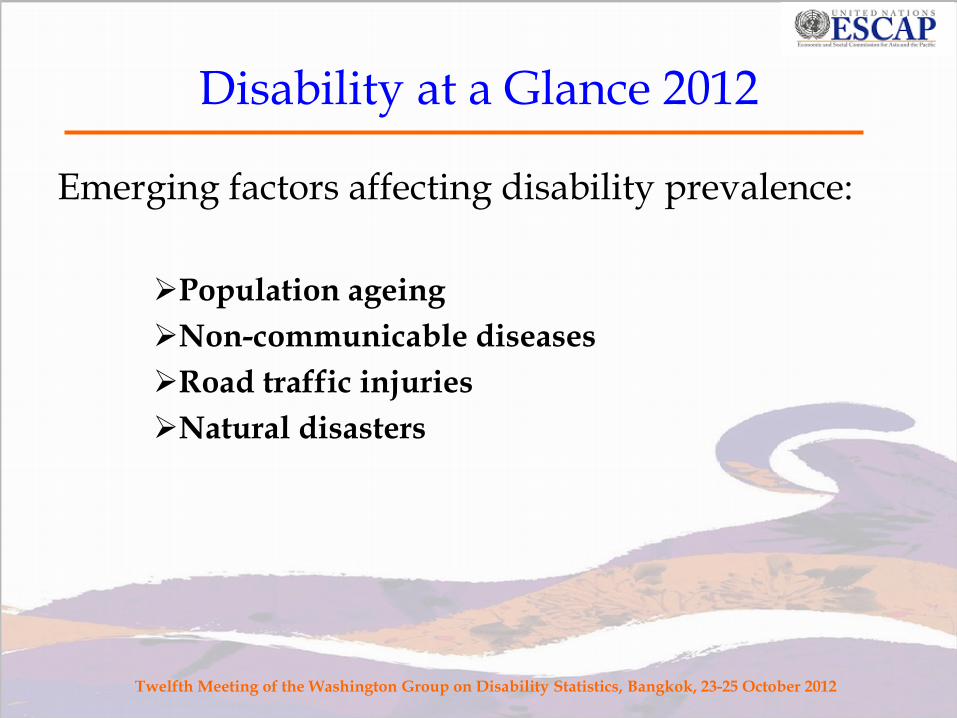
Emerging factors affecting disability prevalence:
Population ageing Non-communicable diseases Road traffic injuries Natural disasters
Twelfth Meeting of the Washington Group on Disability Statistics, Bangkok, 23-25 October 2012
Disability at a Glance 2012
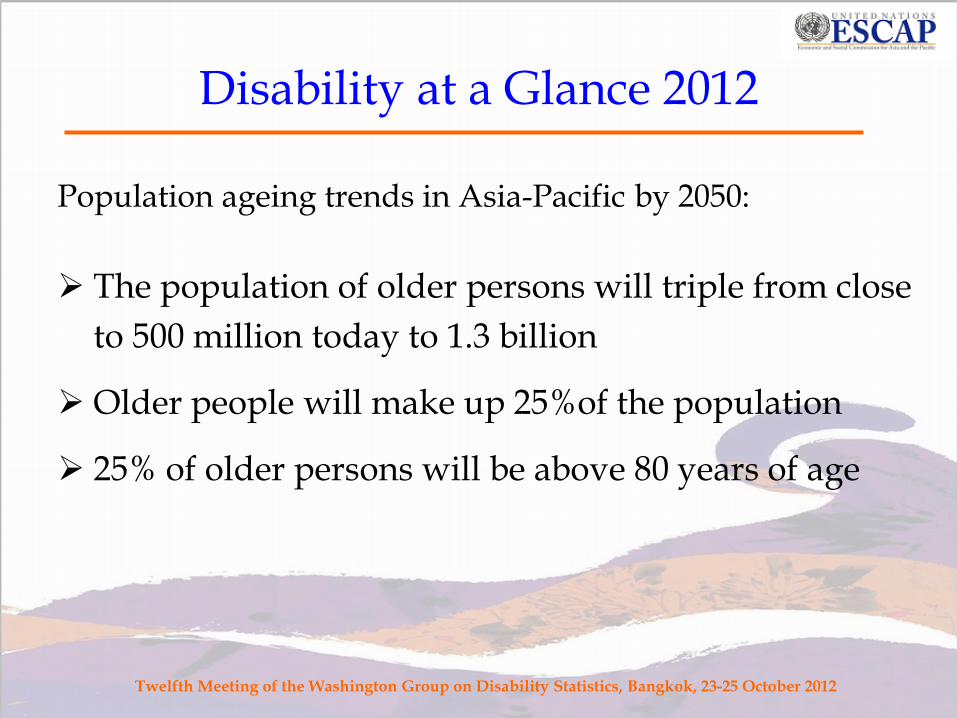
Population ageing trends in Asia-Pacific by 2050:
The population of older persons will triple from close to 500 million today to 1.3 billion
Older people will make up 25%of the population
25% of older persons will be above 80 years of age
Twelfth Meeting of the Washington Group on Disability Statistics, Bangkok, 23-25 October 2012
Disability at a Glance 2012
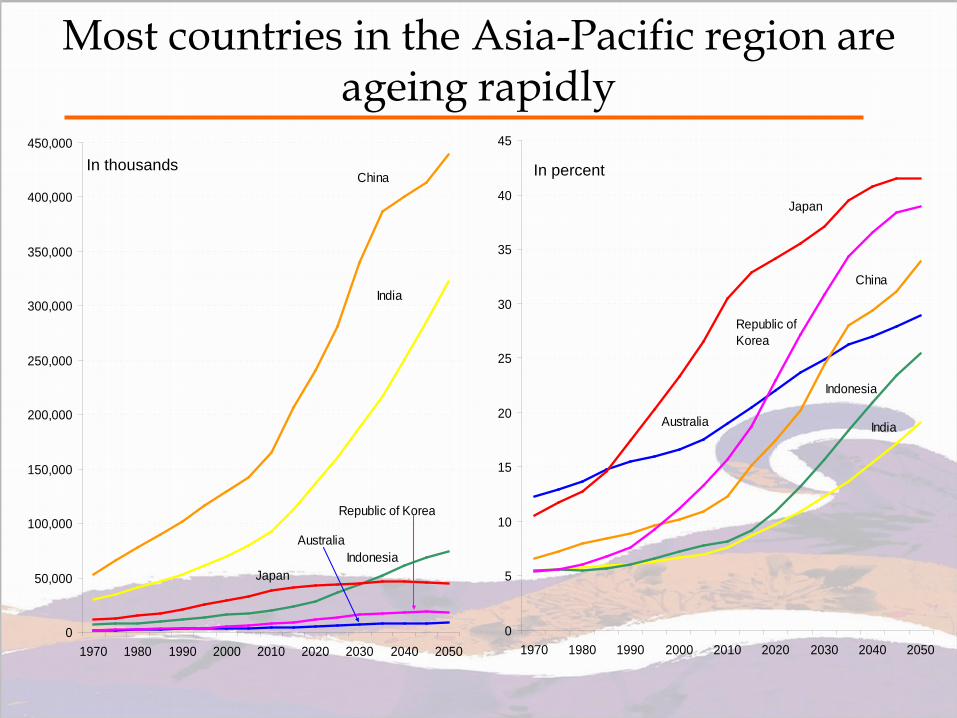
Most countries in the Asia-Pacific region are ageing rapidly
In thousands In percent
0
5
10
15
20
25
30
35
40
45
1970 1980 1990 2000 2010 2020 2030 2040 2050
China
Republic of Korea
Japan
Australia
Indonesia
India
0
50,000
100,000
150,000
200,000
250,000
300,000
350,000
400,000
450,000
1970 1980 1990 2000 2010 2020 2030 2040 2050
China
India
IndonesiaJapan
Australia
Republic of Korea
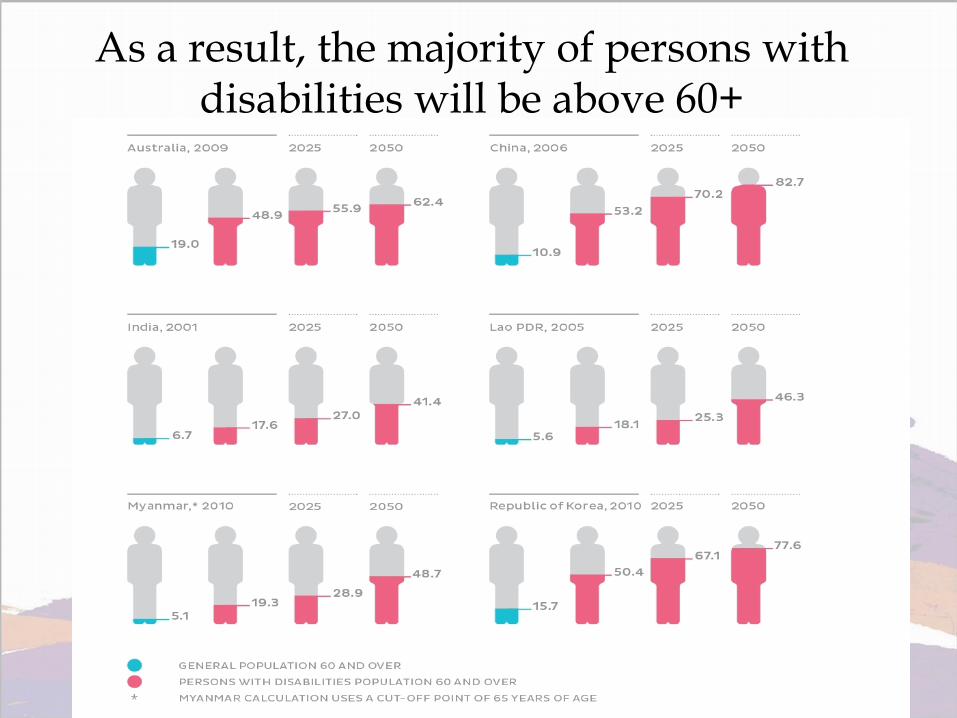
As a result, the majority of persons with disabilities will be above 60+
Conclusion: Governments to actively revisit and assess their
disability data collection methods The work of the Washington Group on Disability
Statistics will contribute to improving the quality of disability data in Asia and the Pacific
Twelfth Meeting of the Washington Group on Disability Statistics, Bangkok, 23-25 October 2012
Disability at a Glance 2012
Voices of persons with disabilities “Get Counted to Count!”
“Effective policy formulation is not possible without accurate
data of persons with disabilities”
Thank you.
Twelfth Meeting of the Washington Group on Disability Statistics, Bangkok, 23-25 October 2012