Embed Size (px)
Citation preview
A form-based user-friendly framework for incentivising economically stable and socially equitable housing development.
OVERVIEW OF THE OHIO 2020 -2021
USR Opportunity Index
Prepared for:

Glennon SweeneySENIOR RESEARCH
ASSOCIATE
Michael OutrichRESEARCH ASSOCIATE
Dr. Darrick HamiltonExecutive Director
THE KIRWAN INSTITUTE FOR THE STUDY OF RACE AND ETHNICITY
THIS REPORT WAS PREPARED FOR AND SUPPORTED BY:
ContentsINTRODUCTION
Defining Opportunity
FOUNDATIONSOpportunity Mapping: An Infographic
THE 2020 - 2021 USR OPPORTUNITY INDEXOverviewBackground Development Process Opportunity Index Layers
Urban Suburban Rural (USR) Index
1
2
456
7 - 157
1014
Preferred APA Citation
Sweeney, G. Outrich, M. Forcone, T., Kenitzer, Z. (2019). Overview of the Ohio 2020- 2021 USR Opportunity Index. The Kirwan Institute for the Study of Race and Ethnicity at The Ohio State University. Columbus, Ohio.
Project Team
Opportunity Index
Neighborhood Change Index
Change Index EvaluationEvaluation 16
Tannya ForconeGRADUATE RESEARCH
ASSISTANT
Zachary KenitzerPOST-DOCTORAL
RESEARCHER

1THE OHIO STATE UNIVERSITY • KIRWAN INSTITUTE.OSU.EDU
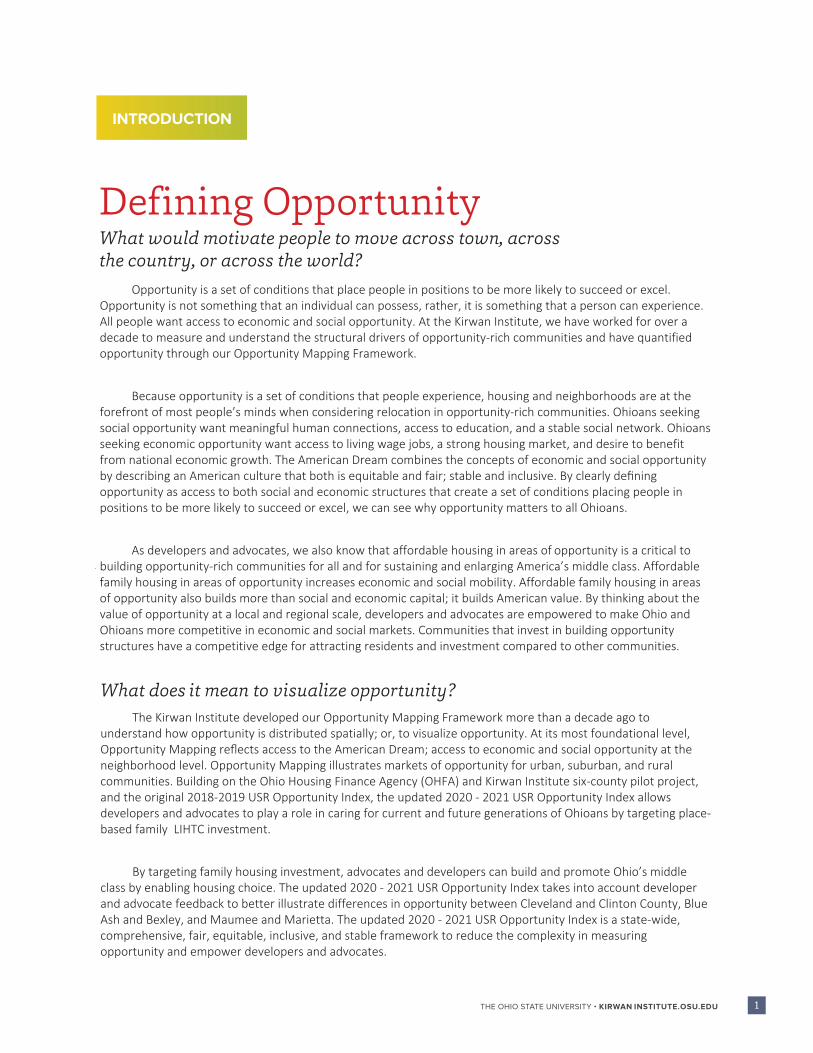
Defining OpportunityWhat would motivate people to move across town, across the country, or across the world?
Opportunity is a set of conditions that place people in positions to be more likely to succeed or excel. Opportunity is not something that an individual can possess, rather, it is something that a person can experience. All people want access to economic and social opportunity. At the Kirwan Institute, we have worked for over a decade to measure and understand the structural drivers of opportunity-rich communities and have quantified opportunity through our Opportunity Mapping Framework.
Because opportunity is a set of conditions that people experience, housing and neighborhoods are at the forefront of most people’s minds when considering relocation in opportunity-rich communities. Ohioans seeking social opportunity want meaningful human connections, access to education, and a stable social network. Ohioans seeking economic opportunity want access to living wage jobs, a strong housing market, and desire to benefit from national economic growth. The American Dream combines the concepts of economic and social opportunity by describing an American culture that both is equitable and fair; stable and inclusive. By clearly defining opportunity as access to both social and economic structures that create a set of conditions placing people in positions to be more likely to succeed or excel, we can see why opportunity matters to all Ohioans.
As developers and advocates, we also know that affordable housing in areas of opportunity is a critical to building opportunity-rich communities for all and for sustaining and enlarging America’s middle class. Affordable family housing in areas of opportunity increases economic and social mobility. Affordable family housing in areas of opportunity also builds more than social and economic capital; it builds American value. By thinking about the value of opportunity at a local and regional scale, developers and advocates are empowered to make Ohio and Ohioans more competitive in economic and social markets. Communities that invest in building opportunity structures have a competitive edge for attracting residents and investment compared to other communities.
What does it mean to visualize opportunity?
The Kirwan Institute developed our Opportunity Mapping Framework more than a decade ago to understand how opportunity is distributed spatially; or, to visualize opportunity. At its most foundational level, Opportunity Mapping reflects access to the American Dream; access to economic and social opportunity at the neighborhood level. Opportunity Mapping illustrates markets of opportunity for urban, suburban, and rural communities. Building on the Ohio Housing Finance Agency (OHFA) and Kirwan Institute six-county pilot project, and the original 2018-2019 USR Opportunity Index, the updated 2020 - 2021 USR Opportunity Index allows developers and advocates to play a role in caring for current and future generations of Ohioans by targeting place-based family LIHTC investment.
By targeting family housing investment, advocates and developers can build and promote Ohio’s middle class by enabling housing choice. The updated 2020 - 2021 USR Opportunity Index takes into account developer and advocate feedback to better illustrate differences in opportunity between Cleveland and Clinton County, Blue Ash and Bexley, and Maumee and Marietta. The updated 2020 - 2021 USR Opportunity Index is a state-wide, comprehensive, fair, equitable, inclusive, and stable framework to reduce the complexity in measuring opportunity and empower developers and advocates.
INTRODUCTION
2 KIRWAN INSTITUTE FOR THE STUDY OF RACE AND ETHNICITY
FOUNDATIONS
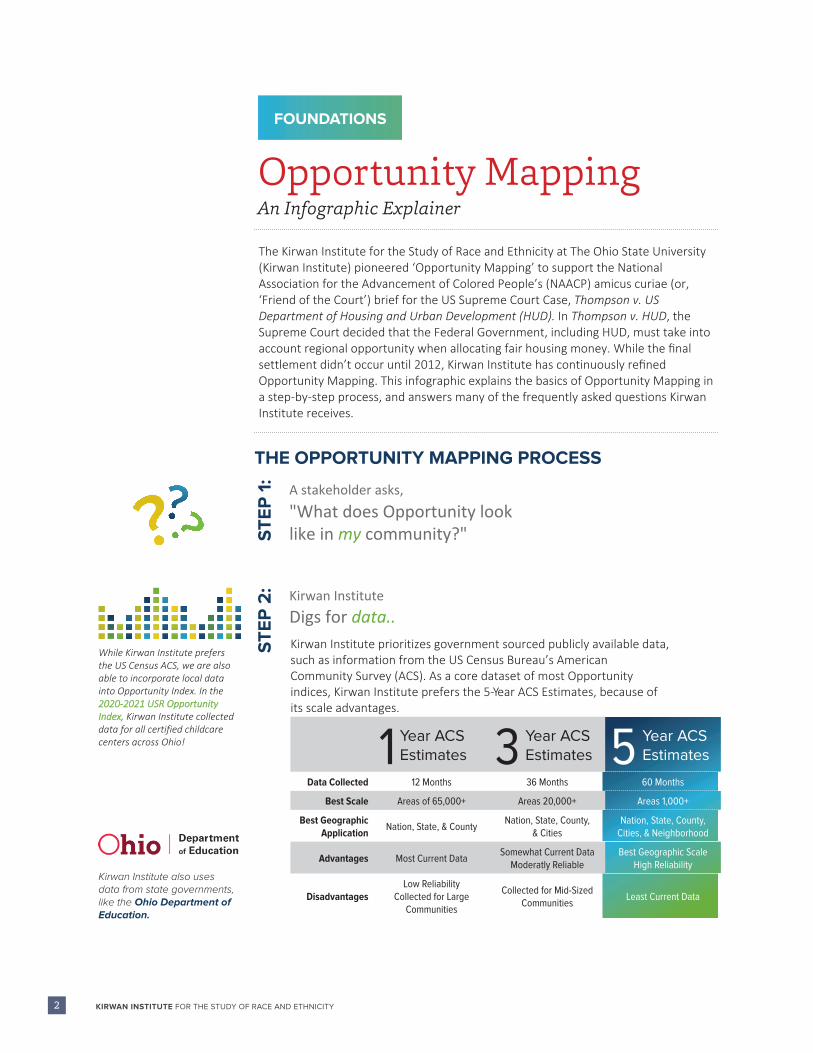
The Kirwan Institute for the Study of Race and Ethnicity at The Ohio State University (Kirwan Institute) pioneered ‘Opportunity Mapping’ to support the National Association for the Advancement of Colored People’s (NAACP) amicus curiae (or, ‘Friend of the Court’) brief for the US Supreme Court Case, Thompson v. US Department of Housing and Urban Development (HUD). In Thompson v. HUD, the Supreme Court decided that the Federal Government, including HUD, must take into account regional opportunity when allocating fair housing money. While the final settlement didn’t occur until 2012, Kirwan Institute has continuously refined Opportunity Mapping. This infographic explains the basics of Opportunity Mapping in a step-by-step process, and answers many of the frequently asked questions Kirwan Institute receives.
Opportunity Mapping
ST
EP
1:
THE OPPORTUNITY MAPPING PROCESS
ST
EP
2:
A stakeholder asks, "What does Opportunity look like in my community?"
Kirwan Institute Digs for data..Kirwan Institute prioritizes government sourced publicly available data, such as information from the US Census Bureau’s American Community Survey (ACS). As a core dataset of most Opportunity indices, Kirwan Institute prefers the 5-Year ACS Estimates, because of its scale advantages.
1 3 5Data Collected 12 Months 36 Months 60 Months
Best Scale Areas of 65,000+ Areas 20,000+ Areas 1,000+
Best Geographic Application
Nation, State, & CountyNation, State, County,
& CitiesNation, State, County,
Cities, & Neighborhood
Advantages Most Current DataSomewhat Current Data
Moderatly ReliableBest Geographic Scale
High Reliability
Disadvantages Low Reliability
Collected for Large Communities
Collected for Mid-Sized Communities
Least Current Data
Year ACSEstimates
Year ACSEstimates
Year ACSEstimates
While Kirwan Institute prefers the US Census ACS, we are also able to incorporate local data into Opportunity Index. In the 2020-2021 USR Opportunity Index, Kirwan Institute collected data for all certified childcare centers across Ohio!
Kirwan Institute also uses data from state governments, like the Ohio Department of Education.
An Infographic Explainer
3THE OHIO STATE UNIVERSITY • KIRWAN INSTITUTE.OSU.EDU
ST
EP
3: Kirwan Institute
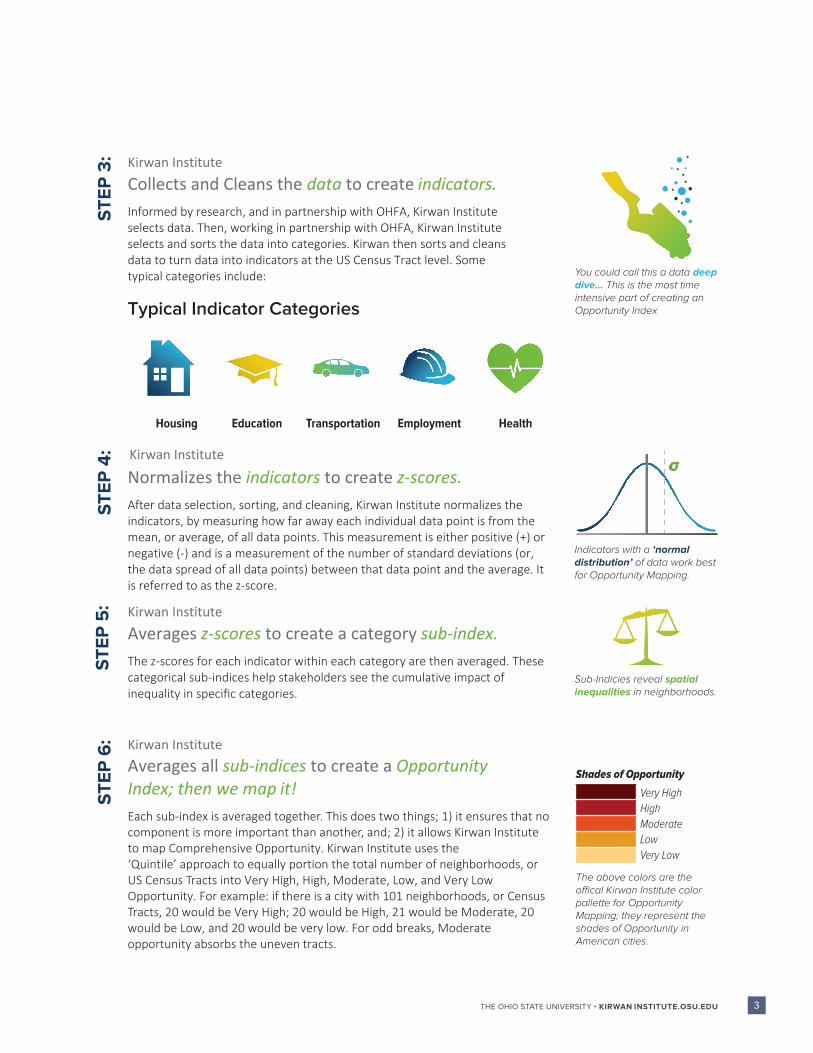
Collects and Cleans the data to create indicators.Informed by research, and in partnership with OHFA, Kirwan Institute selects data. Then, working in partnership with OHFA, Kirwan Institute selects and sorts the data into categories. Kirwan then sorts and cleans data to turn data into indicators at the US Census Tract level. Some typical categories include:
Typical Indicator Categories
Education Transportation Employment Health
You could call this a data deep dive... This is the most time intensive part of creating an Opportunity Index
Housing
Kirwan Institute
Indicators with a ‘normal distribution’ of data work best for Opportunity Mapping.
ST
EP
4:
ST
EP
5:
Sub-Indicies reveal spatial inequalities in neighborhoods.
ST
EP
6:
Normalizes the indicators to create z-scores.After data selection, sorting, and cleaning, Kirwan Institute normalizes the indicators, by measuring how far away each individual data point is from the mean, or average, of all data points. This measurement is either positive (+) or negative (-) and is a measurement of the number of standard deviations (or, the data spread of all data points) between that data point and the average. It is referred to as the z-score.
Kirwan Institute Averages z-scores to create a category sub-index.The z-scores for each indicator within each category are then averaged. These categorical sub-indices help stakeholders see the cumulative impact of inequality in specific categories.
Kirwan Institute Averages all sub-indices to create a Opportunity Index; then we map it!Each sub-index is averaged together. This does two things; 1) it ensures that no component is more important than another, and; 2) it allows Kirwan Institute to map Comprehensive Opportunity. Kirwan Institute uses the ‘Quintile’ approach to equally portion the total number of neighborhoods, or US Census Tracts into Very High, High, Moderate, Low, and Very Low Opportunity. For example: if there is a city with 101 neighborhoods, or Census Tracts, 20 would be Very High; 20 would be High, 21 would be Moderate, 20 would be Low, and 20 would be very low. For odd breaks, Moderate opportunity absorbs the uneven tracts.
Very High
High
Moderate
Low
Very Low
The above colors are the offical Kirwan Institute color pallette for Opportunity Mapping; they represent the shades of Opportunity in American cities.
Shades of Opportunity
4 KIRWAN INSTITUTE FOR THE STUDY OF RACE AND ETHNICITY
OverviewThis new data tool helps developers and advocates strategize their housing investments by exploring opportunity at a statewide level.
The 2020 - 2021 USR Opportunity Index is an updated data tool jointly developed by the Ohio Housing Finance Agency (OHFA) and the Kirwan Institute to help advocates and developers using Low-Income Housing Tax Credits (LIHTC) in their application process. The updated 2020-2021 USR Opportunity Index builds on applied lessons and stakeholder feedback and input since OHFA’s pilot 2016-2017 Opportunity Index, and the original 2018 - 2019 USR Opportunity Index. Changes in the 2020-2021 USR Opportunity Index are consistent with OHFA and Kirwan Institute missions; in addition, changes directly respond to OHFA’s priorities.
Kirwan Institute updated the original 2018 -2019 USR Opportunity Index with the understanding that Ohio’s housing needs and priorities seek to “expand and preserve affordable housing opportunities,” and “focus on customer-driven, sustainable multi-sector solutions to promote public health, welfare, and prosperity of the people of the state” (OHFA, 2017, pp. 5). In doing so, OHFA and the Kirwan Institute believe that the 2020-2021 updated USR Opportunity Index is an applied tool that responds to differences between urban, suburban, and rural market areas. This short report details the approach, inputs, methods, and indicators developed to build the 2020 -2021 USR Opportunity Index.
A' User' Friendly Opportunity Index When talking about the USR Opportunity Index you can refer to it quickly by calling it the 'User' Opportunity Index. Kirwan Institute has taken an extensive amount of time to design the USR Opportunity Index to be more user friendly.
THE 2020-2021 USR OPPORTUNITY INDEX
5THE OHIO STATE UNIVERSITY • KIRWAN INSTITUTE.OSU.EDU
BackgroundLessons learned and differences between the 2016-2017 pilot, the 2018-2019 statewide USR Opportunity Index and the updated 2020-2021 USR Opportunity Index
Prior to the 2016-2017 Opportunity Index, OHFA emphasized the placement of LIHTC into Qualified Census Tracts (QCTs) or Difficult Development Areas (DDA’s). QCT’s are neighborhoods where more than half of households are under 60% of the Area Median Income or have a poverty rate of 25% or more, and are designated as such to encourage development. DDA’s are areas with high construction, land, and utility costs relative to the Area Median Gross Income. In late 2014, OHFA contracted with Kirwan Institute to develop a pilot data mapping tool for a new policy-based approach that took into account the opportunity of local neighborhoods. Rolled out for the 2016-2017 process, the 2016-2017 Opportunity Index was a pilot program that classified Census Tracts on Ohio’s six largest counties: Cuyahoga (Cleveland), Franklin (Columbus), Hamilton (Cincinnati), Lucas (Toledo), Montgomery (Dayton), and Summit (Akron).
Available as a mapping and data tool on OHFA’s website, the Opportunity Index scores Composite Opportunity in Census Tracts on a five-tier scale: Very Low, Low, Moderate, High, and Very High. Composite Opportunity, per the 2020 - 2021 index, is a combination of five smaller indices that quantify transportation, educational, economic, housing, and health opportunity; each responding to different portions of social and economic opportunity. OHFA awards points to development proposals based on their location in areas of moderate, high, and very high opportunity.
In applying the pilot 2016-2017 Opportunity Index to the process, OHFA and Kirwan Institute learned lessons about how developers and advocates use and understand Opportunity Mapping. One of the key limitations of the pilot 2016-2017 Opportunity Index was that it only accounted for the largest counties in the state, leaving the rest of the State of Ohio unmapped. Additionally, the pilot 2016-2017 Opportunity Index mapped opportunity across each county, and did not take into account the urban, suburban, or rural nature of market areas. To address these limitations, OHFA contracted Kirwan Institute in Fall 2016 to conduct stakeholder engagement and develop a statewide model to map opportunity. The result of this work was the first 2018-2019 USR Opportunity Index.
Slight changes to the 2020-2021 USR Opportunity Index process include replacements to some of the 16 indicators used in the 2018 - 2019 USR Opportunity Index. Changes were made primarily due to data availability limitations and to reduce redundancy between the opportunity index and the change index. To ensure each subindex had equal representation, the 2020 - 2021 USR Opportunity Index has only 15 indicators instead of the previous 16. Indicators like “proximity to workforce development and training programs” were replaced with standard indicators that do not require different measurement criteria between urban, rural, and suburban areas. These improvements to the 2018-2019 USR Opportunity Index better capture the social and economic structures of opportunity throughout Ohio, enabling new prospects for developers and advocates to engage in their common mission.
Measuring OpportunityTo measure opportunity, Kirwan Institute calculates a common statistical derivative known as a 'z-score.' In laymens terms, its the distance away from the average; or, z-scores are measured in standard deviations from the average. The greater the number away from 0 (ex. +4 or -4) the more unique that tract is. By combining factors, a comprehensive opportunity model is developed.

6 KIRWAN INSTITUTE FOR THE STUDY OF RACE AND ETHNICITY
OHFA engages Kirwan Institute in conversations about developing an updated USR Opportunity Index that responds to the critiques of the original 2018 - 2019 USR Opportunity Index.
OHFA and Kirwan Institute schedule engagement sessions and Kirwan Institute reviewed up to date scholarly sources in an updated literature review.
OHFA and Kirwan Institute respond to critiques of the original 2018 - 2019 USR Opportunity Index with a solid set of indicators that better capture opportunity structures in communities.
Development ProcessHow Kirwan Institute enriched the original 2018-2019 USR Opportunity Index.
To improve the 2018-2019 USR Opportunity Index, OHFA and Kirwan Institute built on lessons learned, sought stakeholder feedback, and researched the most cutting edge methods to ensure Ohio’s competitiveness among other states. One important pieces of feedback OHFA and Kirwan Institute received was that stakeholders wanted a clearer picture of the development process behind the 2020 - 2021 USR Opportunity Index. Below is a short sketch of steps required to create the new index.
Learning From the 2018-2019 Opportunity Index
November 2018
January 2019
March 2019
Kirwan Institute begins collecting data for 2020-2021 USR Opportunity Index; Responding to developer and advocate feedback, Kirwan Institute replaces redundant indicators and updates indicators for the 2020 - 2021 USR Opportunity Index.
Kirwan Institute builds 2020 - 2021 USR Opportunity Index.
Building the 2020-2021 USR Opportunity IndexApril 2019
May 2019
Approval Process
OHFA circulates 2020 - 2021 USR Opportunity Index for stakeholder feedback and comment.
OHFA feedback and comment period ends.
June 2019
August 2019
Process Matters Another key piece of stakeholder feedback was that developers and advocates wanted to see what the process for developing the 2018-2019 USR Opportunity Index looked like.
7THE OHIO STATE UNIVERSITY • KIRWAN INSTITUTE.OSU.EDU
Layer 1:USR INDEX
Layer 2:OPPORTUNITY INDEX
Layer 3:COMMUNITY CHANGE INDEX
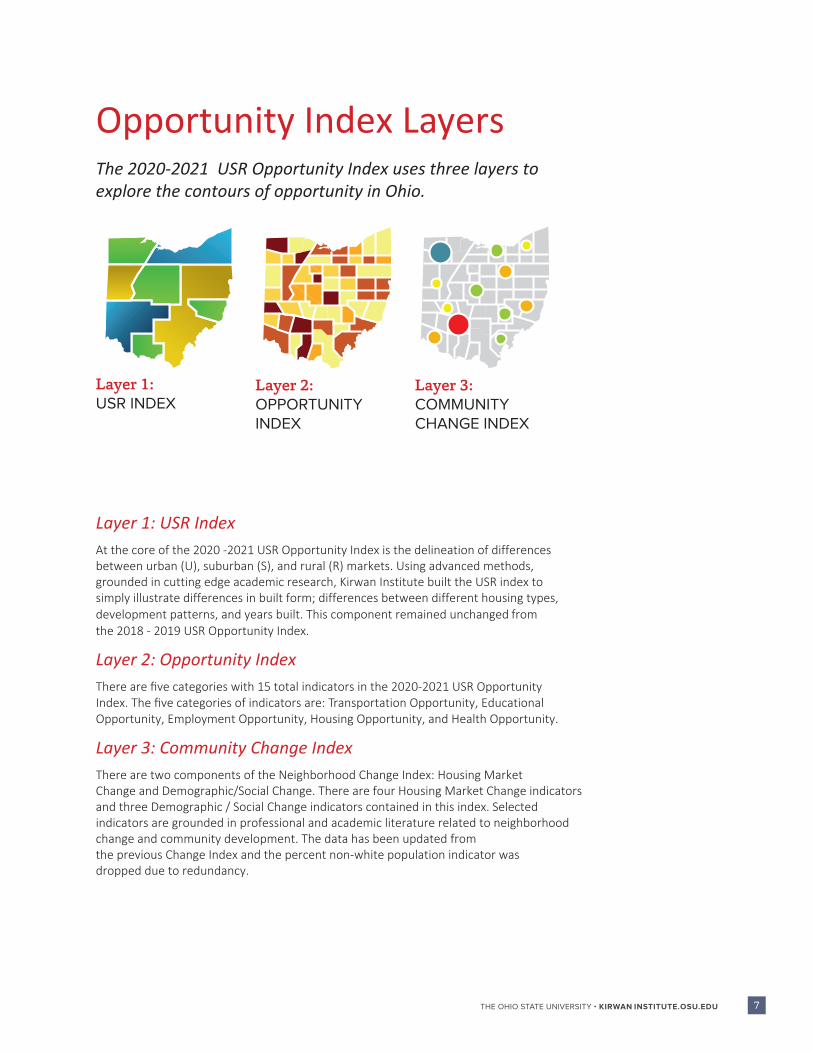
Opportunity Index LayersThe 2020-2021 USR Opportunity Index uses three layers to explore the contours of opportunity in Ohio.
Layer 1: USR IndexAt the core of the 2020 -2021 USR Opportunity Index is the delineation of differences between urban (U), suburban (S), and rural (R) markets. Using advanced methods, grounded in cutting edge academic research, Kirwan Institute built the USR index to simply illustrate differences in built form; differences between different housing types, development patterns, and years built. This component remained unchanged from the 2018 - 2019 USR Opportunity Index.
Layer 2: Opportunity IndexThere are five categories with 15 total indicators in the 2020-2021 USR Opportunity Index. The five categories of indicators are: Transportation Opportunity, Educational Opportunity, Employment Opportunity, Housing Opportunity, and Health Opportunity.
Layer 3: Community Change IndexThere are two components of the Neighborhood Change Index: Housing Market Change and Demographic/Social Change. There are four Housing Market Change indicators and three Demographic / Social Change indicators contained in this index. Selected indicators are grounded in professional and academic literature related to neighborhood change and community development. The data has been updated from the previous Change Index and the percent non-white population indicator was dropped due to redundancy.
8 KIRWAN INSTITUTE FOR THE STUDY OF RACE AND ETHNICITY
LAYER 1:
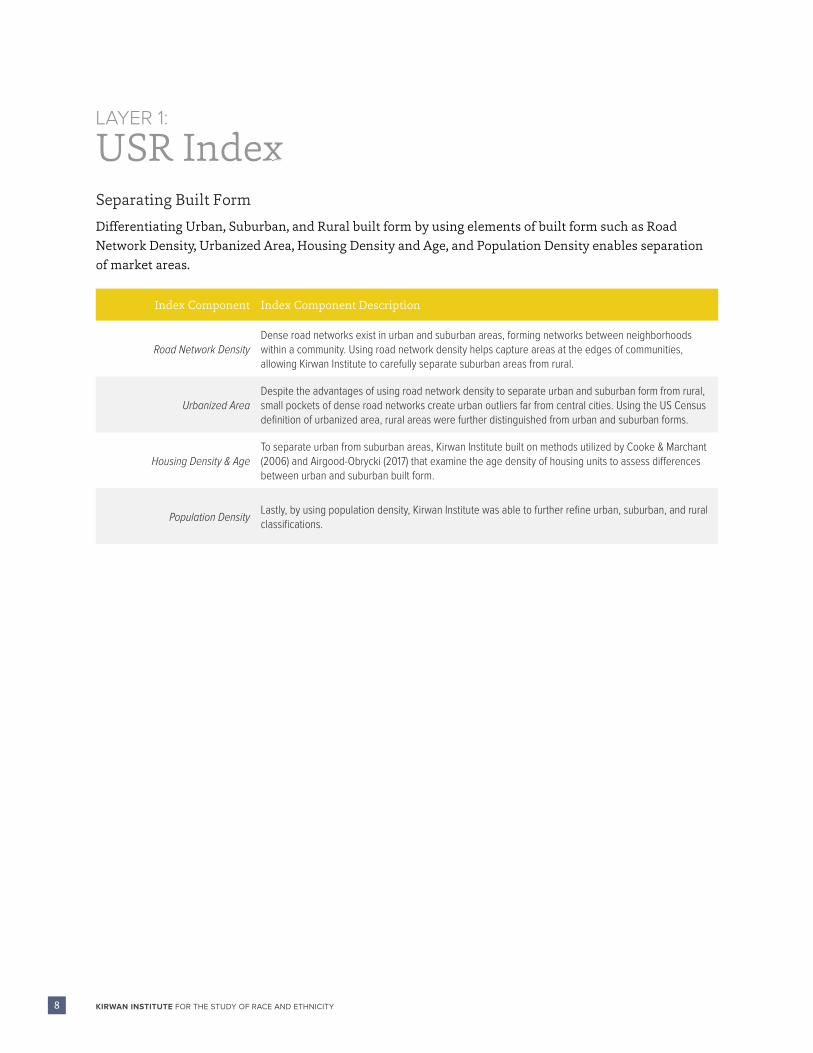
USR IndexSeparating Built Form
Differentiating Urban, Suburban, and Rural built form by using elements of built form such as Road
Network Density, Urbanized Area, Housing Density and Age, and Population Density enables separation
of market areas.
Index Component Index Component Description
Road Network DensityDense road networks exist in urban and suburban areas, forming networks between neighborhoods within a community. Using road network density helps capture areas at the edges of communities, allowing Kirwan Institute to carefully separate suburban areas from rural.
Urbanized Area Despite the advantages of using road network density to separate urban and suburban form from rural, small pockets of dense road networks create urban outliers far from central cities. Using the US Census definition of urbanized area, rural areas were further distinguished from urban and suburban forms.
Housing Density & Age To separate urban from suburban areas, Kirwan Institute built on methods utilized by Cooke & Marchant (2006) and Airgood-Obrycki (2017) that examine the age density of housing units to assess differences between urban and suburban built form.
Population DensityLastly, by using population density, Kirwan Institute was able to further refine urban, suburban, and rural classifications.
9THE OHIO STATE UNIVERSITY • KIRWAN INSTITUTE.OSU.EDU
Cleveland
Toledo
Cincinnati
Dayton
Columbus
Akron
Urban CoreSuburb or Medium Sized CityRural Area, Small Town or Village
Urban CoreSuburb or Medium Sized CityRural Area, Small Town or Village
Urban CoreSuburb or Medium Sized CityRural Area, Small Town or Village
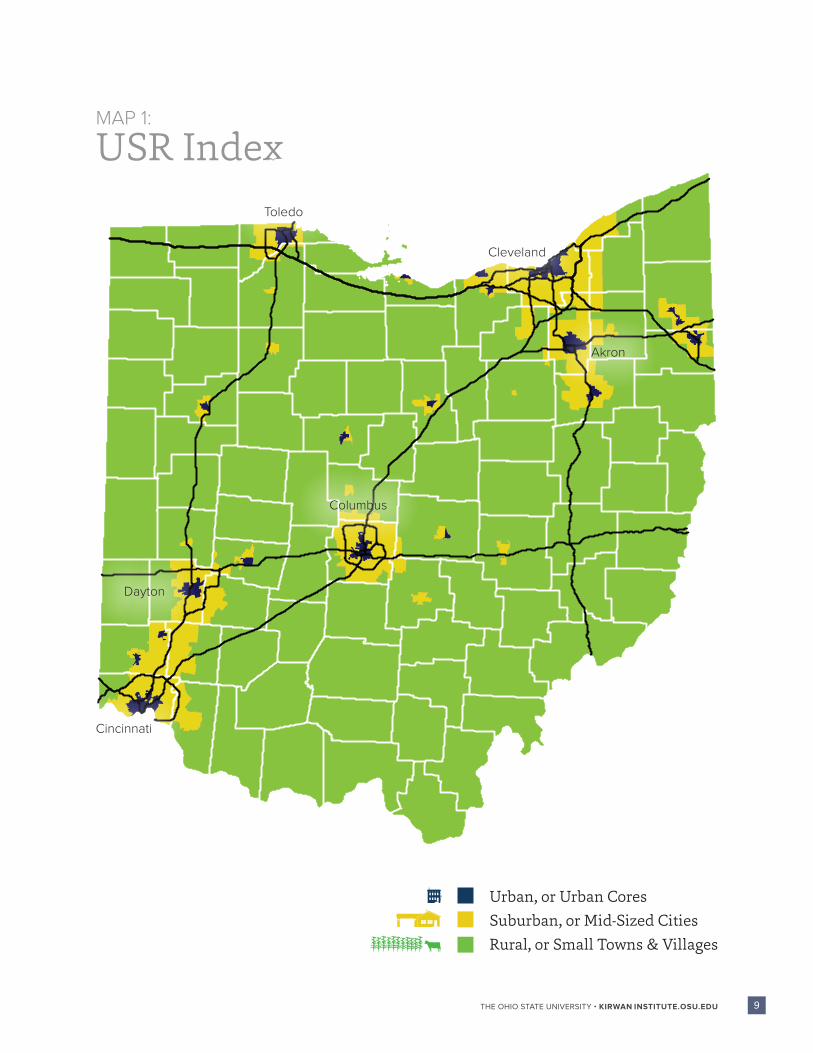
Urban, or Urban Cores
Suburban, or Mid-Sized Cities
Rural, or Small Towns & Villages
MAP 1:
USR Index
LAYER 2:
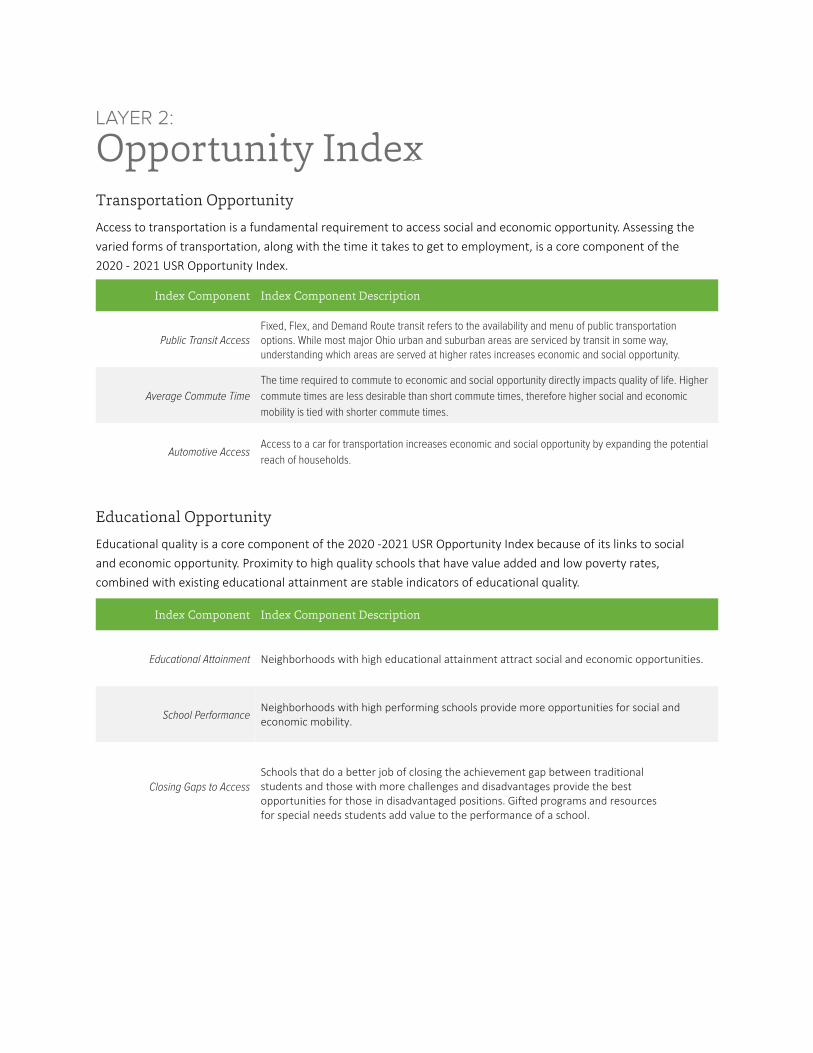
Opportunity IndexTransportation Opportunity
Access to transportation is a fundamental requirement to access social and economic opportunity. Assessing the varied forms of transportation, along with the time it takes to get to employment, is a core component of the 2020 - 2021 USR Opportunity Index.
Index Component Index Component Description
Public Transit AccessFixed, Flex, and Demand Route transit refers to the availability and menu of public transportation options. While most major Ohio urban and suburban areas are serviced by transit in some way, understanding which areas are served at higher rates increases economic and social opportunity.
Average Commute Time
The time required to commute to economic and social opportunity directly impacts quality of life. Higher
commute times are less desirable than short commute times, therefore higher social and economic
mobility is tied with shorter commute times.
Automotive AccessAccess to a car for transportation increases economic and social opportunity by expanding the potential
reach of households.
Educational Opportunity
Educational quality is a core component of the 2020 -2021 USR Opportunity Index because of its links to social and economic opportunity. Proximity to high quality schools that have value added and low poverty rates, combined with existing educational attainment are stable indicators of educational quality.
Index Component Index Component Description
Educational Attainment Neighborhoods with high educational attainment attract social and economic opportunities.
School PerformanceNeighborhoods with high performing schools provide more opportunities for social and economic mobility.
Closing Gaps to AccessSchools that do a better job of closing the achievement gap between traditional students and those with more challenges and disadvantages provide the best opportunities for those in disadvantaged positions. Gifted programs and resources for special needs students add value to the performance of a school.
11THE OHIO STATE UNIVERSITY • KIRWAN INSTITUTE.OSU.EDU
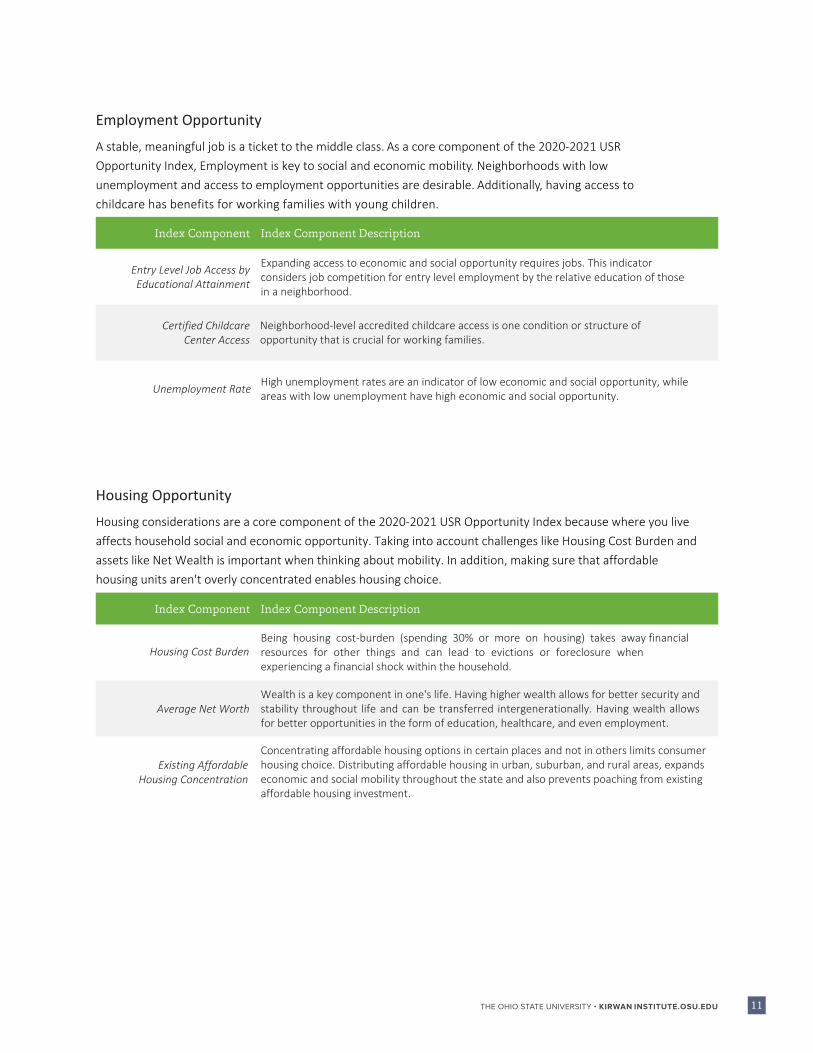
Employment Opportunity
A stable, meaningful job is a ticket to the middle class. As a core component of the 2020-2021 USR Opportunity Index, Employment is key to social and economic mobility. Neighborhoods with low unemployment and access to employment opportunities are desirable. Additionally, having access to childcare has benefits for working families with young children.
Index Component Index Component Description
Entry Level Job Access by Educational Attainment
Expanding access to economic and social opportunity requires jobs. This indicator considers job competition for entry level employment by the relative education of those in a neighborhood.
Certified Childcare Center Access
Neighborhood-level accredited childcare access is one condition or structure of opportunity that is crucial for working families.
Unemployment Rate High unemployment rates are an indicator of low economic and social opportunity, whileareas with low unemployment have high economic and social opportunity.
Housing Opportunity
Housing considerations are a core component of the 2020-2021 USR Opportunity Index because where you live affects household social and economic opportunity. Taking into account challenges like Housing Cost Burden and assets like Net Wealth is important when thinking about mobility. In addition, making sure that affordable housing units aren't overly concentrated enables housing choice.
Index Component Index Component Description
Housing Cost BurdenBeing housing cost-burden (spending 30% or more on housing) takes away financial resources for other things and can lead to evictions or foreclosure when experiencing a financial shock within the household.
Average Net WorthWealth is a key component in one's life. Having higher wealth allows for better security and stability throughout life and can be transferred intergenerationally. Having wealth allows for better opportunities in the form of education, healthcare, and even employment.
Existing Affordable Housing Concentration
Concentrating affordable housing options in certain places and not in others limits consumer housing choice. Distributing affordable housing in urban, suburban, and rural areas, expands economic and social mobility throughout the state and also prevents poaching from existing affordable housing investment.
12 KIRWAN INSTITUTE FOR THE STUDY OF RACE AND ETHNICITY
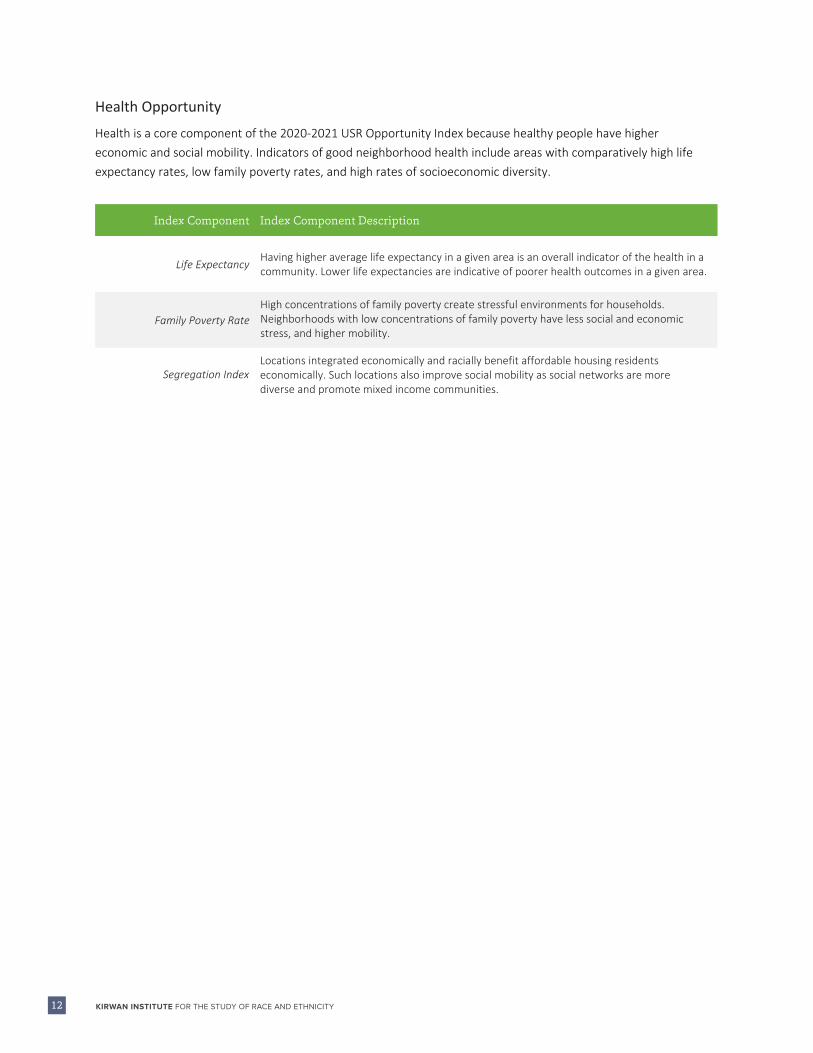
Health Opportunity
Health is a core component of the 2020-2021 USR Opportunity Index because healthy people have higher economic and social mobility. Indicators of good neighborhood health include areas with comparatively high life expectancy rates, low family poverty rates, and high rates of socioeconomic diversity.
Index Component Index Component Description
Life ExpectancyHaving higher average life expectancy in a given area is an overall indicator of the health in a community. Lower life expectancies are indicative of poorer health outcomes in a given area.
Family Poverty RateHigh concentrations of family poverty create stressful environments for households. Neighborhoods with low concentrations of family poverty have less social and economic stress, and higher mobility.
Segregation IndexLocations integrated economically and racially benefit affordable housing residents economically. Such locations also improve social mobility as social networks are more diverse and promote mixed income communities.
13THE OHIO STATE UNIVERSITY • KIRWAN INSTITUTE.OSU.EDU
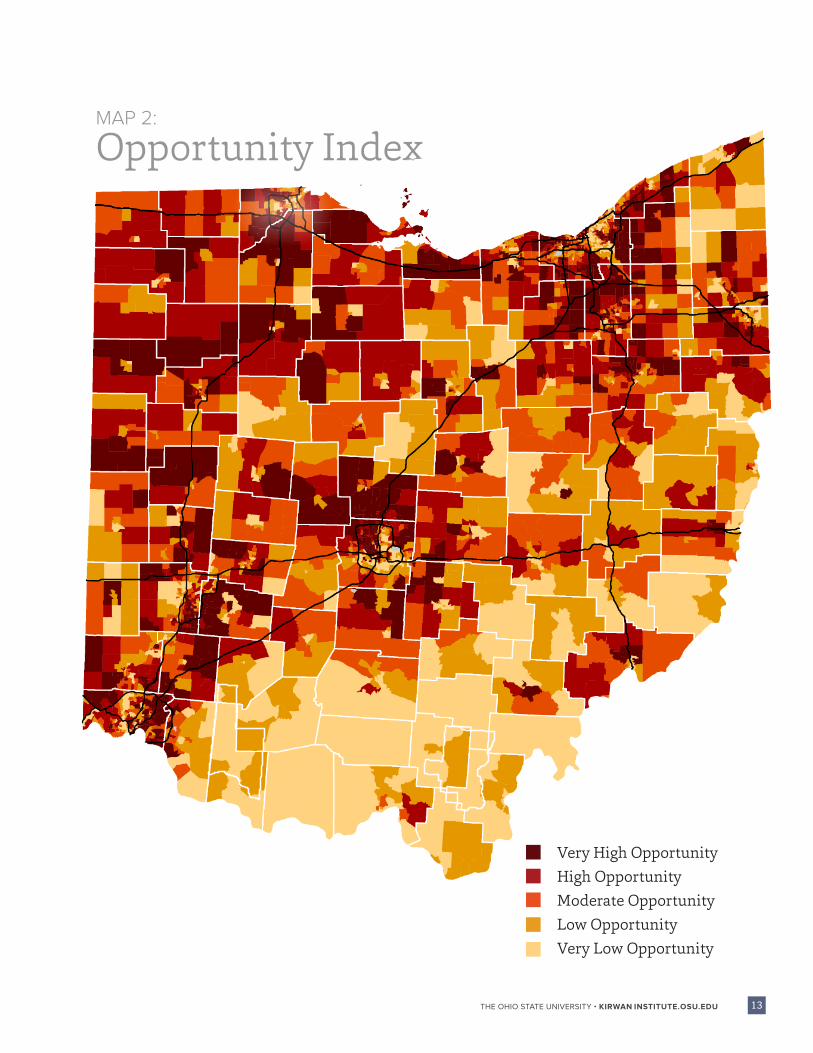
MAP 2:
Opportunity Index
Very High Opportunity
High Opportunity
Moderate Opportunity
Low Opportunity
Very Low Opportunity
14 KIRWAN INSTITUTE FOR THE STUDY OF RACE AND ETHNICITY
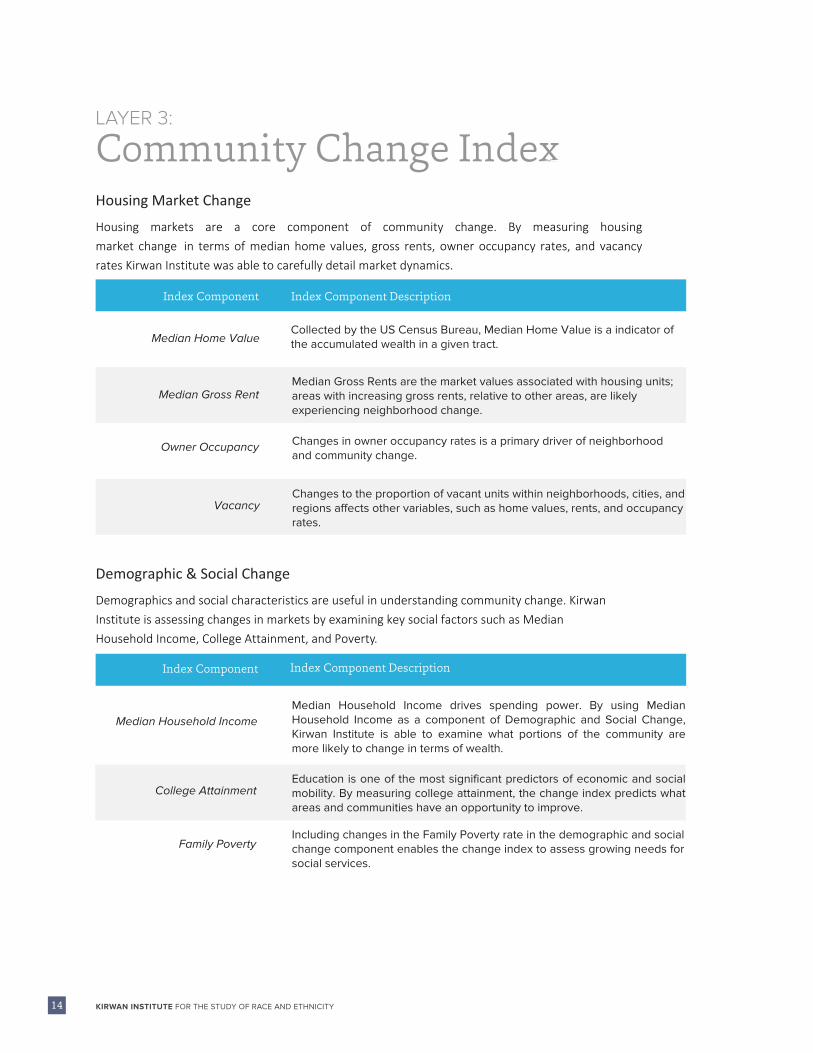
LAYER 3:
Community Change IndexHousing Market Change
Housing markets are a core component of community change. By measuring housing market change in terms of median home values, gross rents, owner occupancy rates, and vacancy rates Kirwan Institute was able to carefully detail market dynamics.
Index Component Index Component Description
Median Home ValueCollected by the US Census Bureau, Median Home Value is a indicator of the accumulated wealth in a given tract.
Demographic & Social Change
Demographics and social characteristics are useful in understanding community change. Kirwan Institute is assessing changes in markets by examining key social factors such as Median Household Income, College Attainment, and Poverty.
Median Household IncomeMedian Household Income drives spending power. By using Median Household Income as a component of Demographic and Social Change, Kirwan Institute is able to examine what portions of the community are more likely to change in terms of wealth.
Education is one of the most significant predictors of economic and social mobility. By measuring college attainment, the change index predicts what areas and communities have an opportunity to improve.
Including changes in the Family Poverty rate in the demographic and social change component enables the change index to assess growing needs for social services.
Index Component Index Component Description
Median Gross Rent
Owner Occupancy
Vacancy
Median Gross Rents are the market values associated with housing units; areas with increasing gross rents, relative to other areas, are likely experiencing neighborhood change.
Changes in owner occupancy rates is a primary driver of neighborhood and community change.
Changes to the proportion of vacant units within neighborhoods, cities, and regions affects other variables, such as home values, rents, and occupancy rates.
College Attainment
Family Poverty
15THE OHIO STATE UNIVERSITY • KIRWAN INSTITUTE.OSU.EDU
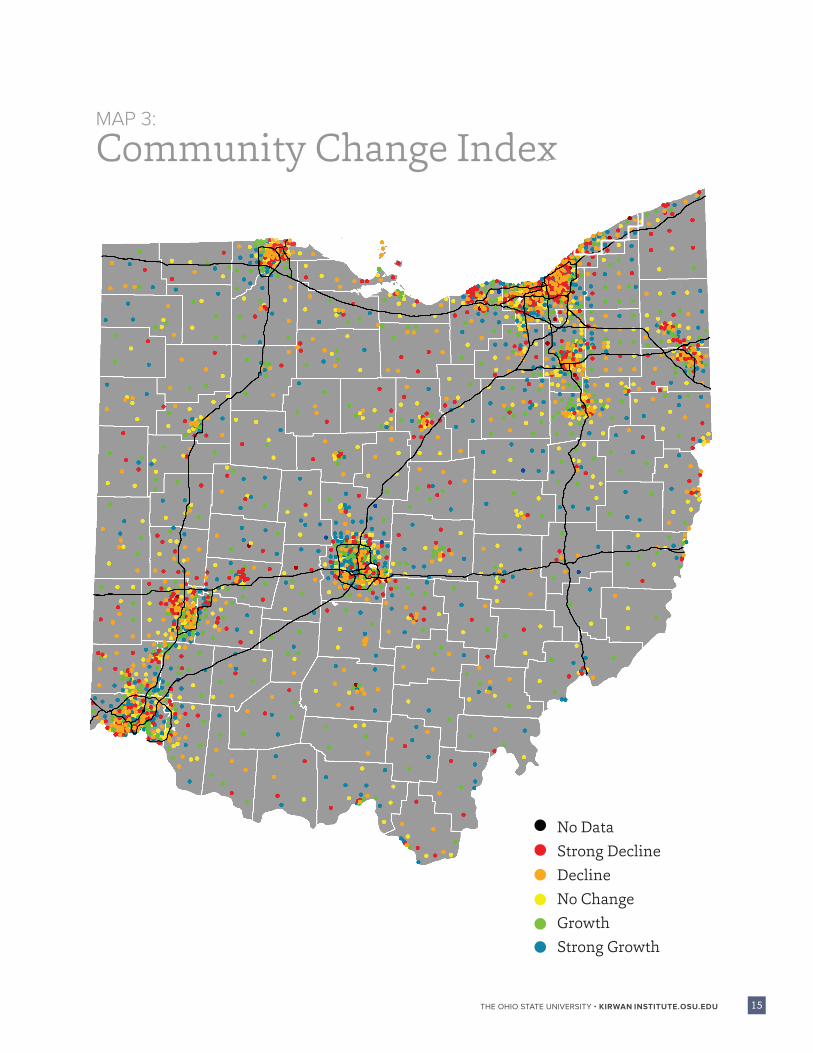
MAP 3:
Community Change Index
No Data
Strong Decline
Decline
No Change
Growth
Strong Growth
16 KIRWAN INSTITUTE FOR THE STUDY OF RACE AND ETHNICITY
Change Index EvaluationAssessing the Change Index's explanatory power on the Opportunity Index
Comparison of Average Changes
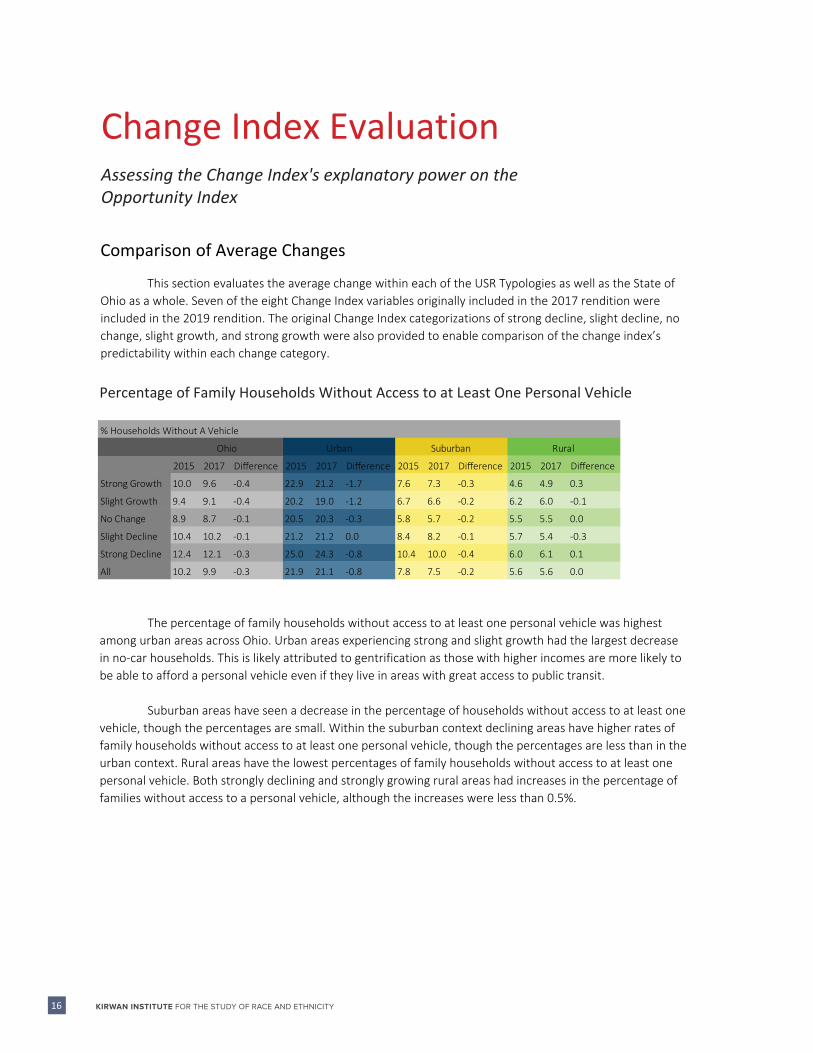
This section evaluates the average change within each of the USR Typologies as well as the State of Ohio as a whole. Seven of the eight Change Index variables originally included in the 2017 rendition were included in the 2019 rendition. The original Change Index categorizations of strong decline, slight decline, no change, slight growth, and strong growth were also provided to enable comparison of the change index’s predictability within each change category.
Percentage of Family Households Without Access to at Least One Personal Vehicle
2015 2017 Difference 2015 2017 Difference 2015 2017 Difference 2015 2017 Difference
Strong Growth 10.0 9.6 -0.4 22.9 21.2 -1.7 7.6 7.3 -0.3 4.6 4.9 0.3
Slight Growth 9.4 9.1 -0.4 20.2 19.0 -1.2 6.7 6.6 -0.2 6.2 6.0 -0.1
No Change 8.9 8.7 -0.1 20.5 20.3 -0.3 5.8 5.7 -0.2 5.5 5.5 0.0
Slight Decline 10.4 10.2 -0.1 21.2 21.2 0.0 8.4 8.2 -0.1 5.7 5.4 -0.3
Strong Decline 12.4 12.1 -0.3 25.0 24.3 -0.8 10.4 10.0 -0.4 6.0 6.1 0.1
All 10.2 9.9 -0.3 21.9 21.1 -0.8 7.8 7.5 -0.2 5.6 5.6 0.0
Ohio Urban Suburban Rural
% Households Without A Vehicle
The percentage of family households without access to at least one personal vehicle was highest among urban areas across Ohio. Urban areas experiencing strong and slight growth had the largest decrease in no-car households. This is likely attributed to gentrification as those with higher incomes are more likely to be able to afford a personal vehicle even if they live in areas with great access to public transit.
Suburban areas have seen a decrease in the percentage of households without access to at least one vehicle, though the percentages are small. Within the suburban context declining areas have higher rates of family households without access to at least one personal vehicle, though the percentages are less than in the urban context. Rural areas have the lowest percentages of family households without access to at least one personal vehicle. Both strongly declining and strongly growing rural areas had increases in the percentage of families without access to a personal vehicle, although the increases were less than 0.5%.
17THE OHIO STATE UNIVERSITY • KIRWAN INSTITUTE.OSU.EDU
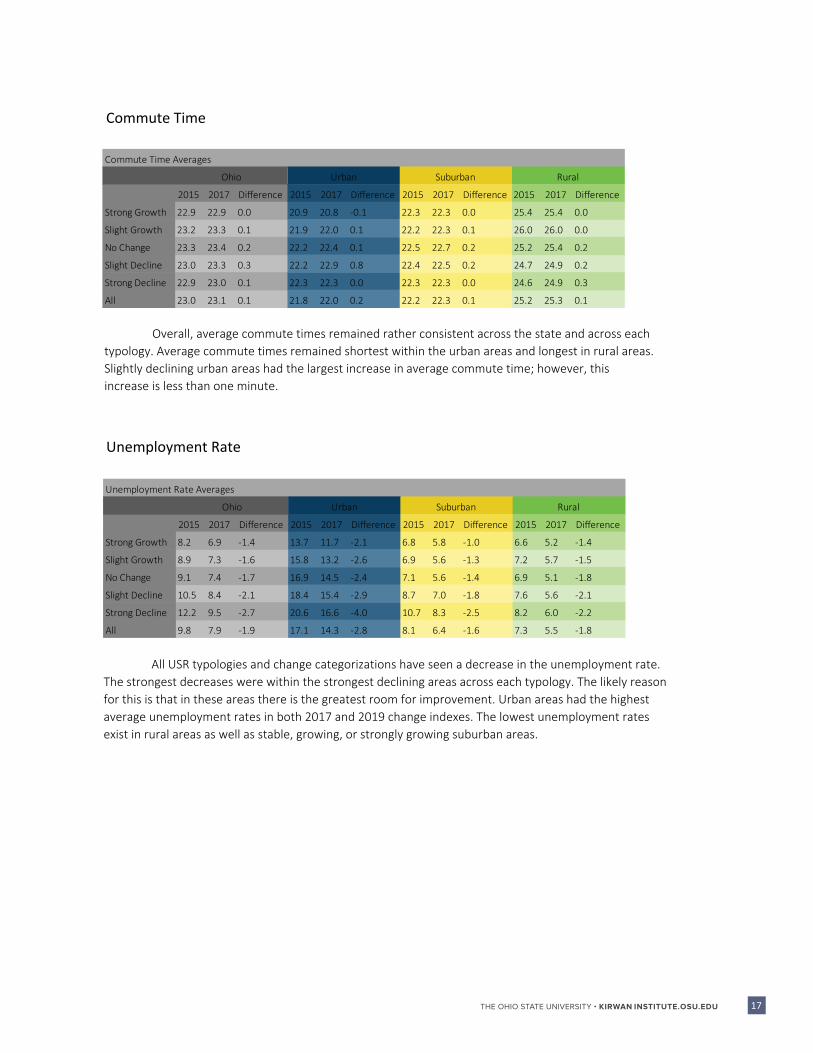
Commute Time
2015 2017 Difference 2015 2017 Difference 2015 2017 Difference 2015 2017 Difference
Strong Growth 22.9 22.9 0.0 20.9 20.8 -0.1 22.3 22.3 0.0 25.4 25.4 0.0
Slight Growth 23.2 23.3 0.1 21.9 22.0 0.1 22.2 22.3 0.1 26.0 26.0 0.0
No Change 23.3 23.4 0.2 22.2 22.4 0.1 22.5 22.7 0.2 25.2 25.4 0.2
Slight Decline 23.0 23.3 0.3 22.2 22.9 0.8 22.4 22.5 0.2 24.7 24.9 0.2
Strong Decline 22.9 23.0 0.1 22.3 22.3 0.0 22.3 22.3 0.0 24.6 24.9 0.3
All 23.0 23.1 0.1 21.8 22.0 0.2 22.2 22.3 0.1 25.2 25.3 0.1
Urban Suburban RuralOhio
Commute Time Averages
Overall, average commute times remained rather consistent across the state and across each typology. Average commute times remained shortest within the urban areas and longest in rural areas. Slightly declining urban areas had the largest increase in average commute time; however, this increase is less than one minute.
Unemployment Rate
2015 2017 Difference 2015 2017 Difference 2015 2017 Difference 2015 2017 Difference
Strong Growth 8.2 6.9 -1.4 13.7 11.7 -2.1 6.8 5.8 -1.0 6.6 5.2 -1.4
Slight Growth 8.9 7.3 -1.6 15.8 13.2 -2.6 6.9 5.6 -1.3 7.2 5.7 -1.5
No Change 9.1 7.4 -1.7 16.9 14.5 -2.4 7.1 5.6 -1.4 6.9 5.1 -1.8
Slight Decline 10.5 8.4 -2.1 18.4 15.4 -2.9 8.7 7.0 -1.8 7.6 5.6 -2.1
Strong Decline 12.2 9.5 -2.7 20.6 16.6 -4.0 10.7 8.3 -2.5 8.2 6.0 -2.2
All 9.8 7.9 -1.9 17.1 14.3 -2.8 8.1 6.4 -1.6 7.3 5.5 -1.8
Unemployment Rate Averages
Ohio Urban Suburban Rural
All USR typologies and change categorizations have seen a decrease in the unemployment rate. The strongest decreases were within the strongest declining areas across each typology. The likely reason for this is that in these areas there is the greatest room for improvement. Urban areas had the highest average unemployment rates in both 2017 and 2019 change indexes. The lowest unemployment rates exist in rural areas as well as stable, growing, or strongly growing suburban areas.
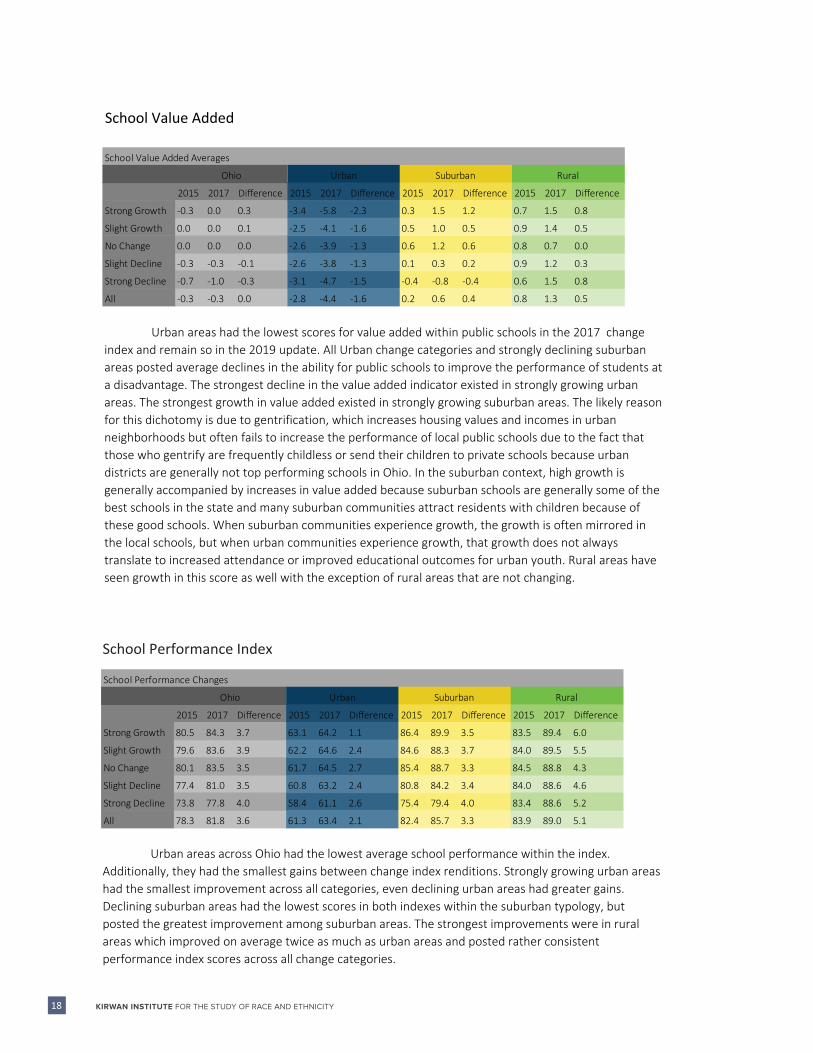
School Value Added
2015 2017 Difference 2015 2017 Difference 2015 2017 Difference 2015 2017 Difference
Strong Growth -0.3 0.0 0.3 0.3 1.5 1.2 0.7 1.5 0.8
Slight Growth 0.0 0.0 0.1 0.5 1.0 0.5 0.9 1.4 0.5
No Change 0.0 0.0 0.0 0.6 1.2 0.6 0.8 0.7 0.0
Slight Decline -0.3 -0.3 -0.1 0.1 0.3 0.2 0.9 1.2 0.3
Strong Decline -0.7 -1.0 -0.3 -0.4 -0.8 -0.4 0.6 1.5 0.8
All -0.3 -0.3 0.0
-3.4 -5.8 -2.3
-2.5 -4.1 -1.6
-2.6 -3.9 -1.3
-2.6 -3.8 -1.3
-3.1 -4.7 -1.5
-2.8 -4.4 -1.6 0.2 0.6 0.4 0.8 1.3 0.5
School Value Added Averages
Ohio Urban Suburban Rural
2015 2017 Difference 2015 2017 Difference 2015 2017 Difference 2015 2017 Difference
Strong Growth 80.5 84.3 3.7 63.1 64.2 1.1 86.4 89.9 3.5 83.5 89.4 6.0
Slight Growth 79.6 83.6 3.9 62.2 64.6 2.4 84.6 88.3 3.7 84.0 89.5 5.5
No Change 80.1 83.5 3.5 61.7 64.5 2.7 85.4 88.7 3.3 84.5 88.8 4.3
Slight Decline 77.4 81.0 3.5 60.8 63.2 2.4 80.8 84.2 3.4 84.0 88.6 4.6
Strong Decline 73.8 77.8 4.0 58.4 61.1 2.6 75.4 79.4 4.0 83.4 88.6 5.2
All 78.3 81.8 3.6 61.3 63.4 2.1 82.4 85.7 3.3 83.9 89.0 5.1
School Performance Changes
Ohio Urban Suburban Rural
Urban areas across Ohio had the lowest average school performance within the index. Additionally, they had the smallest gains between change index renditions. Strongly growing urban areas had the smallest improvement across all categories, even declining urban areas had greater gains. Declining suburban areas had the lowest scores in both indexes within the suburban typology, but posted the greatest improvement among suburban areas. The strongest improvements were in rural areas which improved on average twice as much as urban areas and posted rather consistent performance index scores across all change categories.
18 KIRWAN INSTITUTE FOR THE STUDY OF RACE AND ETHNICITY
Urban areas had the lowest scores for value added within public schools in the 2017 change index and remain so in the 2019 update. All Urban change categories and strongly declining suburban areas posted average declines in the ability for public schools to improve the performance of students at a disadvantage. The strongest decline in the value added indicator existed in strongly growing urban areas. The strongest growth in value added existed in strongly growing suburban areas. The likely reason for this dichotomy is due to gentrification, which increases housing values and incomes in urban neighborhoods but often fails to increase the performance of local public schools due to the fact that those who gentrify are frequently childless or send their children to private schools because urban districts are generally not top performing schools in Ohio. In the suburban context, high growth is generally accompanied by increases in value added because suburban schools are generally some of the best schools in the state and many suburban communities attract residents with children because of these good schools. When suburban communities experience growth, the growth is often mirrored in the local schools, but when urban communities experience growth, that growth does not always translate to increased attendance or improved educational outcomes for urban youth. Rural areas have seen growth in this score as well with the exception of rural areas that are not changing.
School Performance Index
19THE OHIO STATE UNIVERSITY • KIRWAN INSTITUTE.OSU.EDU
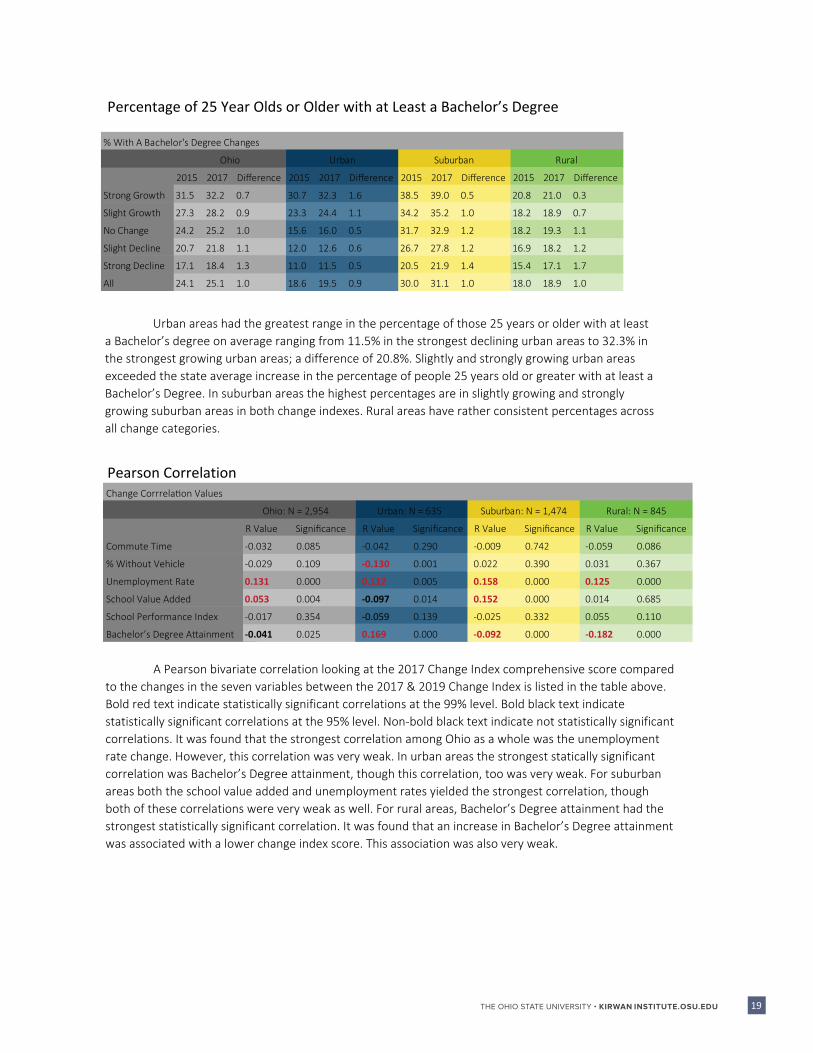
Percentage of 25 Year Olds or Older with at Least a Bachelor’s Degree
2015 2017 Difference 2015 2017 Difference 2015 2017 Difference 2015 2017 Difference
Strong Growth 31.5 32.2 0.7 30.7 32.3 1.6 38.5 39.0 0.5 20.8 21.0 0.3
Slight Growth 27.3 28.2 0.9 23.3 24.4 1.1 34.2 35.2 1.0 18.2 18.9 0.7
No Change 24.2 25.2 1.0 15.6 16.0 0.5 31.7 32.9 1.2 18.2 19.3 1.1
Slight Decline 20.7 21.8 1.1 12.0 12.6 0.6 26.7 27.8 1.2 16.9 18.2 1.2
Strong Decline 17.1 18.4 1.3 11.0 11.5 0.5 20.5 21.9 1.4 15.4 17.1 1.7
All 24.1 25.1 1.0 18.6 19.5 0.9 30.0 31.1 1.0 18.0 18.9 1.0
% With A Bachelor's Degree Changes
Ohio Urban Suburban Rural
Urban areas had the greatest range in the percentage of those 25 years or older with at least a Bachelor’s degree on average ranging from 11.5% in the strongest declining urban areas to 32.3% in the strongest growing urban areas; a difference of 20.8%. Slightly and strongly growing urban areas exceeded the state average increase in the percentage of people 25 years old or greater with at least a Bachelor’s Degree. In suburban areas the highest percentages are in slightly growing and strongly growing suburban areas in both change indexes. Rural areas have rather consistent percentages across all change categories.
Pearson Correlation
R Value Significance
Commute Time -0.032 0.085
% Without Vehicle 0.109
Unemployment Rate 0.000
School Value Added
-0.029
0.131
0.053 0.004
School Performance Index -0.017 0.354
Bachelor’s Degree A�ainment -0.041 0.025
Change Corrrela�on Values
Ohio: N = 2,954 Urban: N = 635 Suburban: N = 1,474 Rural: N = 845
R Value Significance
-0.042 0.290
0.001-0.130
0.112 0.005
-0.097 0.014
0.139-0.059
0.169 0.000
R Value Significance
0.742
0.390
0.000
-0.009
0.022
0.158
0.152 0.000
-0.025 0.332
-0.092 0.000
R Value Significance
0.086
0.367
0.000
0.685
-0.059
0.031
0.125
0.014
0.055 0.110
-0.182 0.000
A Pearson bivariate correlation looking at the 2017 Change Index comprehensive score compared to the changes in the seven variables between the 2017 & 2019 Change Index is listed in the table above. Bold red text indicate statistically significant correlations at the 99% level. Bold black text indicate statistically significant correlations at the 95% level. Non-bold black text indicate not statistically significant correlations. It was found that the strongest correlation among Ohio as a whole was the unemployment rate change. However, this correlation was very weak. In urban areas the strongest statically significant correlation was Bachelor’s Degree attainment, though this correlation, too was very weak. For suburban areas both the school value added and unemployment rates yielded the strongest correlation, though both of these correlations were very weak as well. For rural areas, Bachelor’s Degree attainment had the strongest statistically significant correlation. It was found that an increase in Bachelor’s Degree attainment was associated with a lower change index score. This association was also very weak.
33 West 11th Avenue Columbus, Ohio 43201
Phone: (614) 688-5429Fax: (614) 688-5592
www.KirwanInstitute.osu.edu
/KirwanInstitute