Embed Size (px)
Citation preview


OVERVIEW
• PHILIPPINES - AT A GLANCE
• ECONOMIC PERFORMANCE • PHILIPPINES – UNITED KINGDOM TRADE• PHILIPPINES – UNITED KINGDOM TRADE
• PHILIPPINES – EU TRADE
• PHILIPPINES – ASEAN
• ASEAN TRADE
• PHILIPPINES – NEW GOVERNMENT
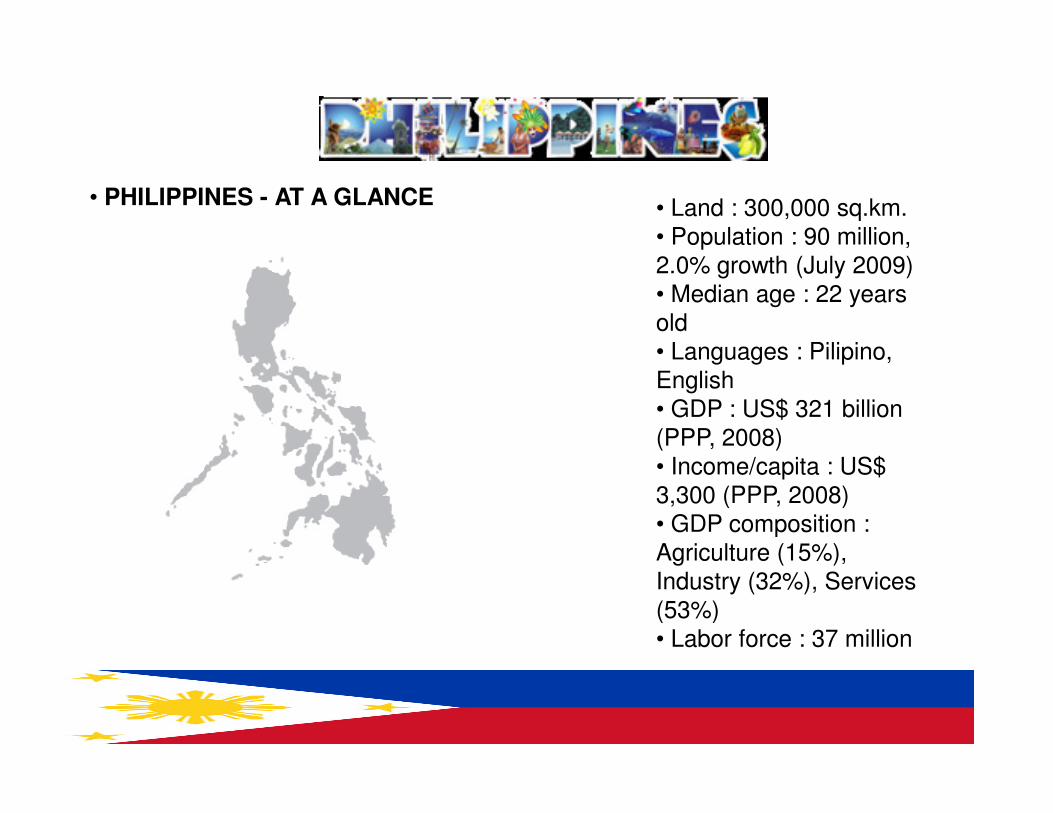
• Land : 300,000 sq.km.• Population : 90 million, 2.0% growth (July 2009)• Median age : 22 years old• Languages : Pilipino, English • GDP : US$ 321 billion
• PHILIPPINES - AT A GLANCE
• GDP : US$ 321 billion (PPP, 2008) • Income/capita : US$ 3,300 (PPP, 2008) • GDP composition : Agriculture (15%), Industry (32%), Services (53%)• Labor force : 37 million

• PHILIPPINES - AT A GLANCE
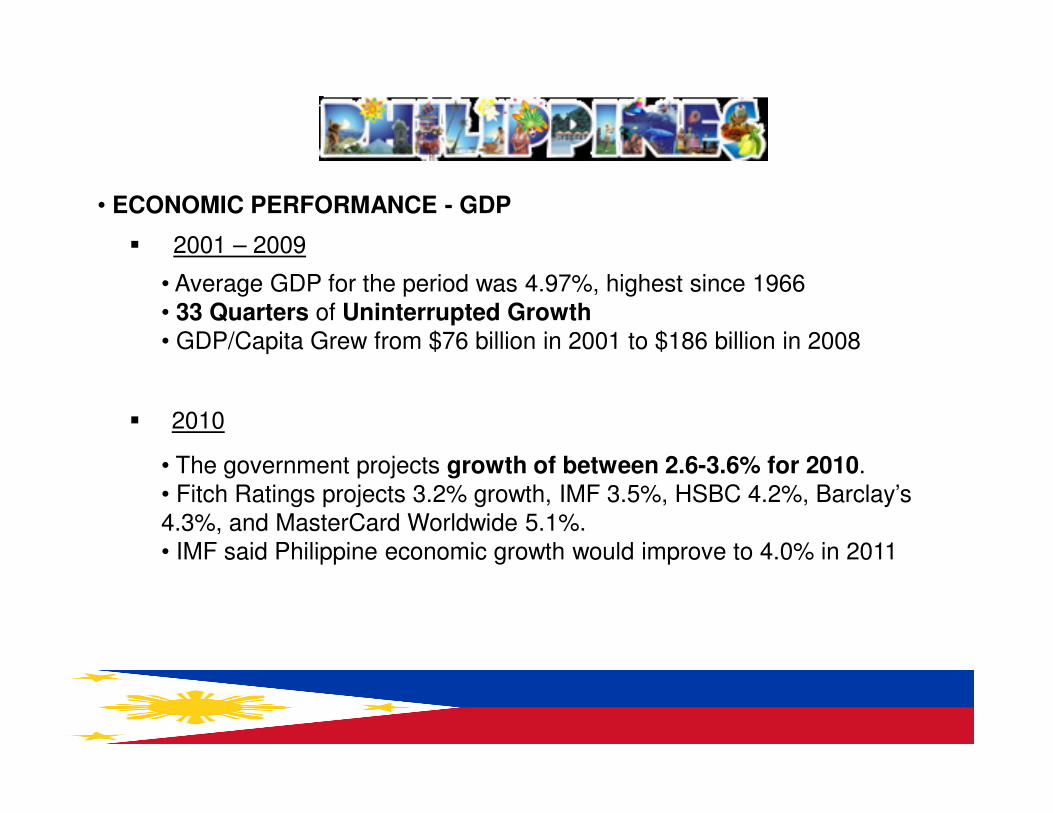
• ECONOMIC PERFORMANCE - GDP
� 2001 – 2009
• Average GDP for the period was 4.97%, highest since 1966• 33 Quarters of Uninterrupted Growth• GDP/Capita Grew from $76 billion in 2001 to $186 billion in 2008
� 2010
• The government projects growth of between 2.6-3.6% for 2010. • Fitch Ratings projects 3.2% growth, IMF 3.5%, HSBC 4.2%, Barclay’s 4.3%, and MasterCard Worldwide 5.1%.• IMF said Philippine economic growth would improve to 4.0% in 2011
• ECONOMIC PERFORMANCE – STOCK MARKET INDEX
� 2010
• Last week, the Philippine Stock Exchange index (PSEi) advanced to
� 2001 – 2009
• From 1,494.50 points on 29 December 2000 to 3,052.68 points on 29 December 2009
• Last week, the Philippine Stock Exchange index (PSEi) advanced to 3,327.69, its highest close in 28 months• Money placed by foreign investors in the stock market nearly doubled to $2.01 billion during the first four months of the year. • The total amount of foreign portfolio investments registered with the BSP totaled $2.78 billion, up by $1.09 billion or 65 percent from $1.69 billion the same comparable period

• ECONOMIC PERFORMANCE – INTERNATIONAL RESERVES
� 2001 – 2009
• From $15.06 billion in 2000, to $45.03 billion in 2009• Dollar reserves jumped 199% from 2000 - 2009
� 2010
•The country's foreign exchange reserves grew to a new record level of •The country's foreign exchange reserves grew to a new record level of $47.03 billion last April•The country's GIR is expected to reach between $48 billion and $49 billion, instead of the earlier projection of $47 billion
• ECONOMIC PERFORMANCE – INWARD REMITTANCES
� 2000 - 2009
• From $6 billion in 2000, to over $17 billion in 2009
� 2010
• Remittances grew year-on-year by 5.6 percent in March 2010 to reach US$1.6 billion, the second highest monthly remittance level everrecorded.
• This brought total remittances for the first three months of the year to US$4.3 billion, or 7.0 percent year-on-year growth registered for the period
� 2010
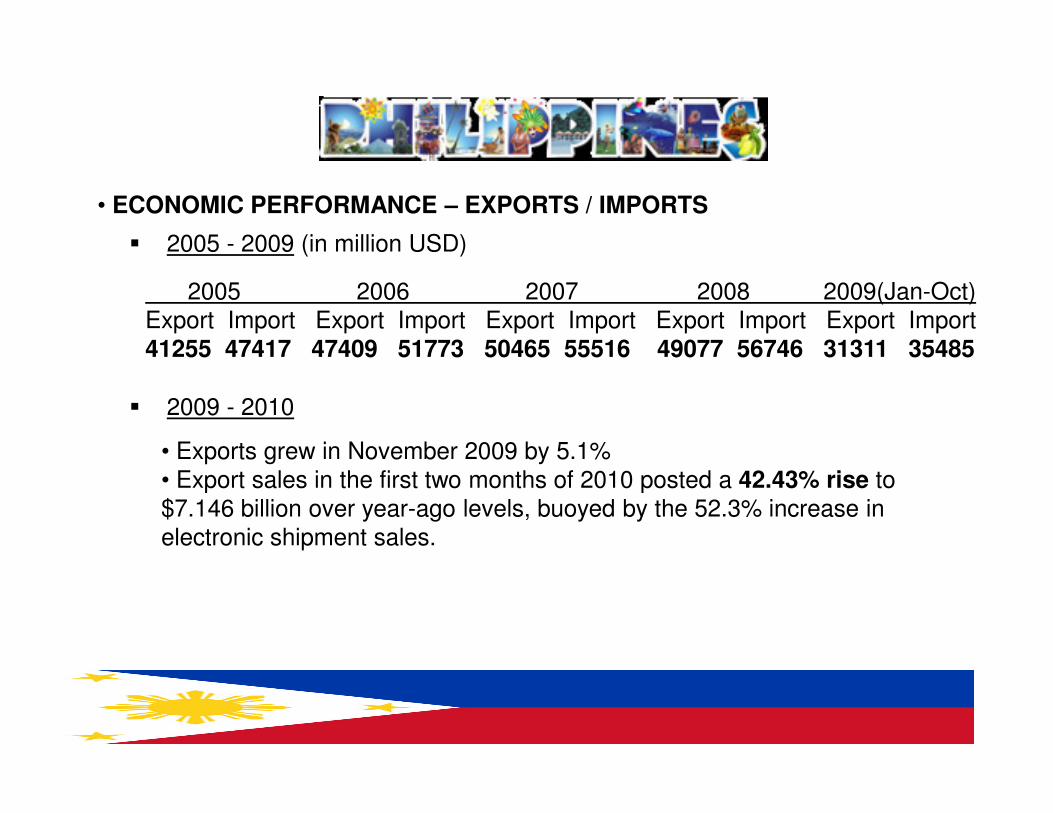
� 2005 - 2009 (in million USD)
2005 2006 2007 2008 2009(Jan-Oct)Export Import Export Import Export Import Export Import Export Import 41255 47417 47409 51773 50465 55516 49077 56746 31311 35485
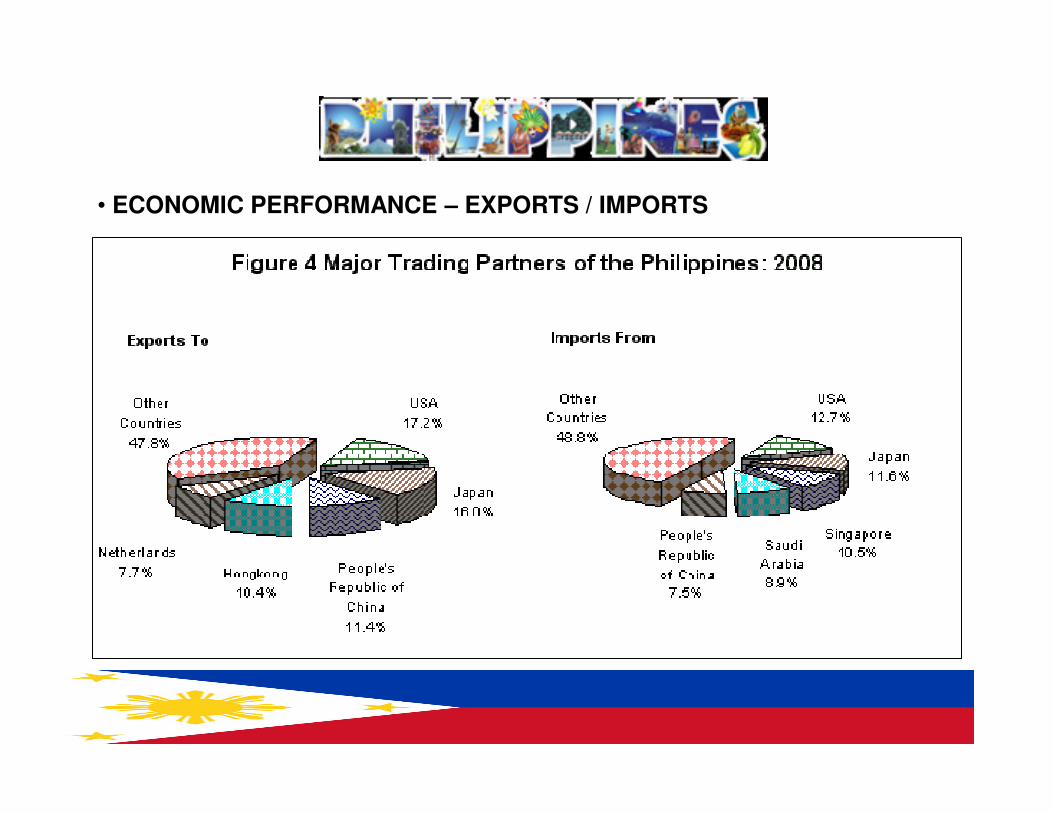
• ECONOMIC PERFORMANCE – EXPORTS / IMPORTS
� 2009 - 2010
• Exports grew in November 2009 by 5.1% • Export sales in the first two months of 2010 posted a 42.43% rise to $7.146 billion over year-ago levels, buoyed by the 52.3% increase in electronic shipment sales.
� 2009 - 2010
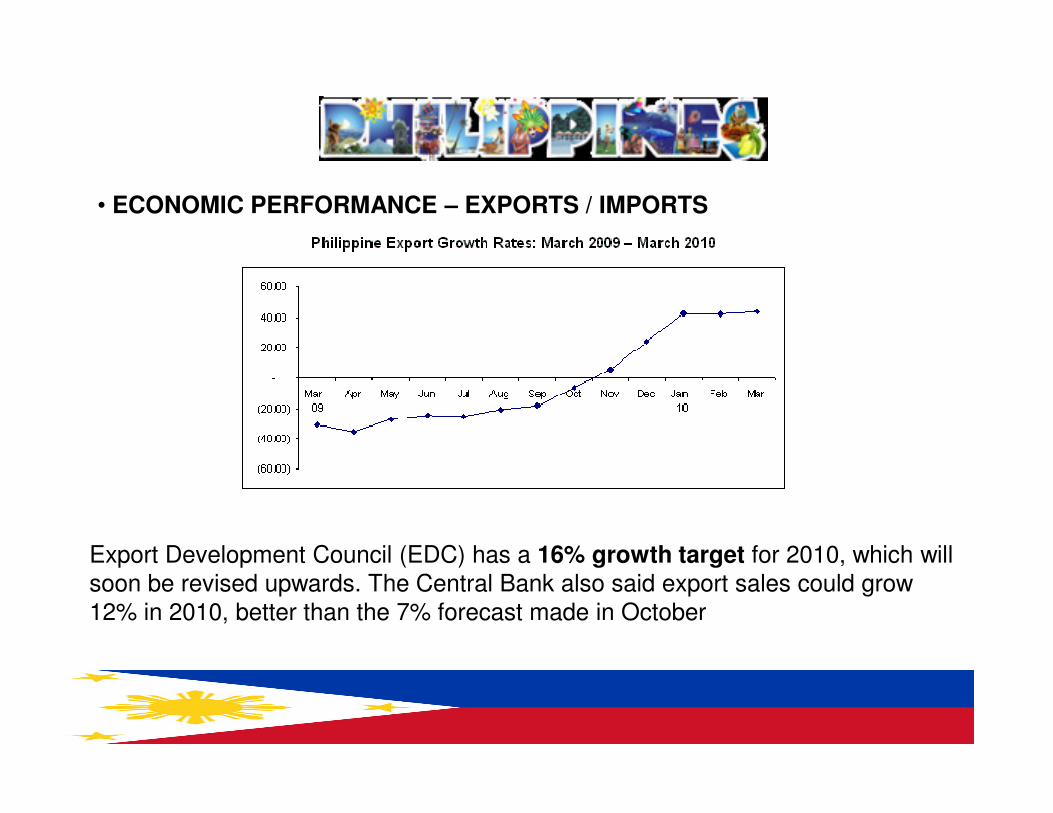
• ECONOMIC PERFORMANCE – EXPORTS / IMPORTS
Export Development Council (EDC) has a 16% growth target for 2010, which will soon be revised upwards. The Central Bank also said export sales could grow 12% in 2010, better than the 7% forecast made in October
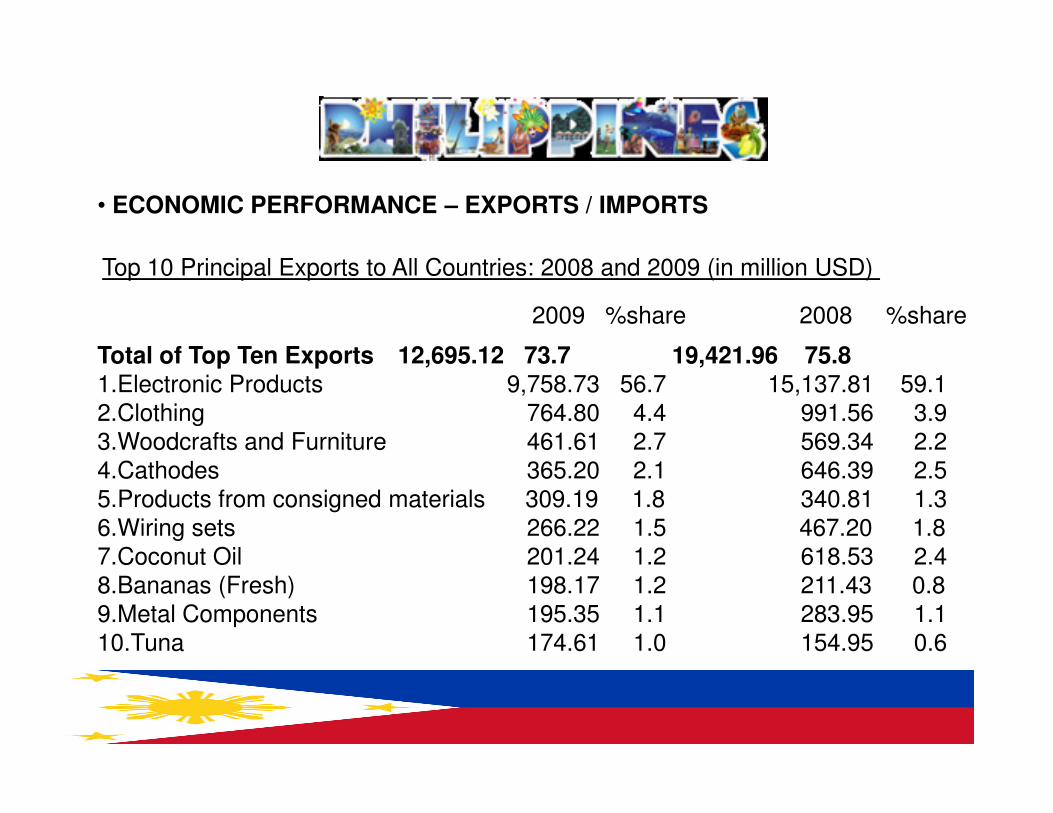
Top 10 Principal Exports to All Countries: 2008 and 2009 (in million USD)
Total of Top Ten Exports 12,695.12 73.7 19,421.96 75.8 1.Electronic Products 9,758.73 56.7 15,137.81 59.1 2.Clothing 764.80 4.4 991.56 3.9
2009 %share 2008 %share
• ECONOMIC PERFORMANCE – EXPORTS / IMPORTS
2.Clothing 764.80 4.4 991.56 3.9 3.Woodcrafts and Furniture 461.61 2.7 569.34 2.2 4.Cathodes 365.20 2.1 646.39 2.5 5.Products from consigned materials 309.19 1.8 340.81 1.3 6.Wiring sets 266.22 1.5 467.20 1.8 7.Coconut Oil 201.24 1.2 618.53 2.4 8.Bananas (Fresh) 198.17 1.2 211.43 0.8 9.Metal Components 195.35 1.1 283.95 1.1 10.Tuna 174.61 1.0 154.95 0.6

Total of Top Ten Imports 15,650.73 76.9 23,990.71 81.1 1 Electronic Products 7,113.95 34.9 10,888.18 36.8 2 Mineral fuels, lubricants etc 3,285.04 16.1 6,504.10 22.0
2009 %share 2008 %share
Top 10 Principal Imports from All Countries: 2008 and 2009 (in million USD)
• ECONOMIC PERFORMANCE – EXPORTS / IMPORTS
2 Mineral fuels, lubricants etc 3,285.04 16.1 6,504.10 22.0 3 Cereals and Cereal Preparations 1,459.23 7.2 1,304.33 4.4 4 Transport Equipment 1,018.58 5.0 1,333.18 4.5 5 Machinery and Equipment 776.16 3.8 1,091.34 3.76 Organic and Inorganic Chemical 558.96 2.7 634.40 2.1 7 Iron and Steel 422.14 2.1 885.65 3.0 8 Pharmaceutical Products 361.36 1.8 337.84 1.1 9 Plastics 355.05 1.7 586.07 2.010 Textiles and related products 300.27 1.5 425.63 1.4
• ECONOMIC PERFORMANCE – EXPORTS / IMPORTS
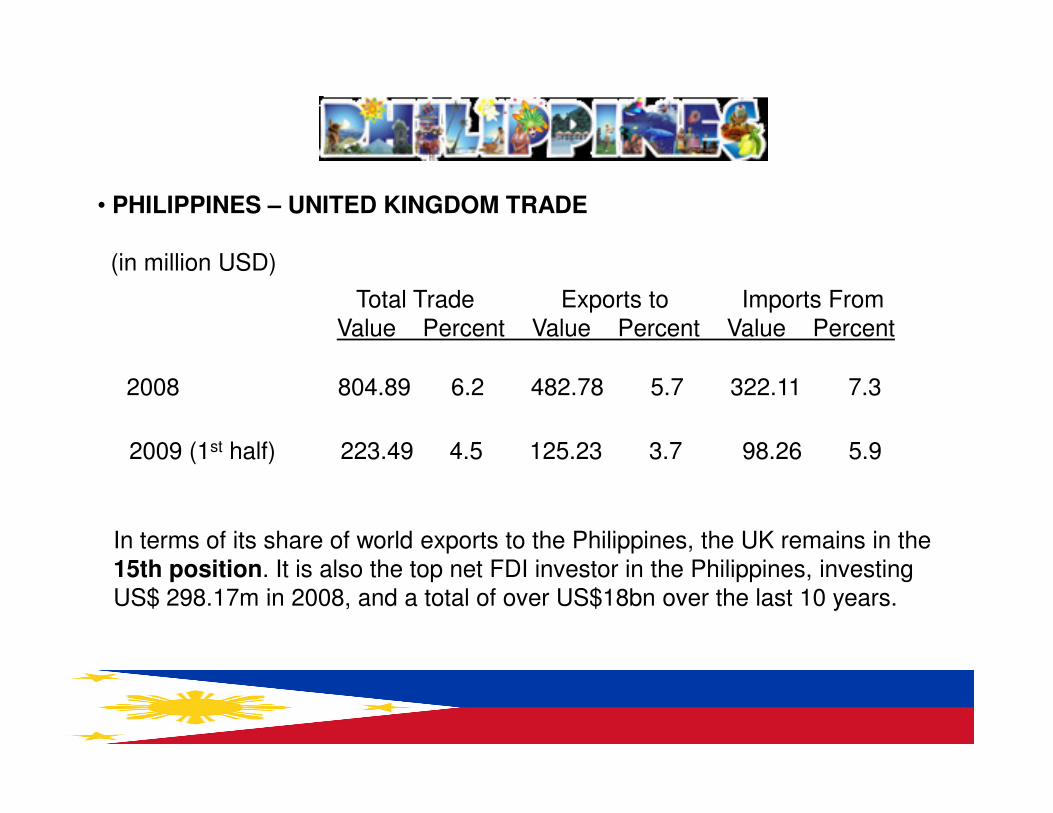
• PHILIPPINES – UNITED KINGDOM TRADE
(in million USD)
Total Trade Exports to Imports From Value Percent Value Percent Value Percent
2008 804.89 6.2 482.78 5.7 322.11 7.3
2009 (1st half) 223.49 4.5 125.23 3.7 98.26 5.9
In terms of its share of world exports to the Philippines, the UK remains in the 15th position. It is also the top net FDI investor in the Philippines, investing US$ 298.17m in 2008, and a total of over US$18bn over the last 10 years.

1999 2000 2001 2002 2003 2004 2005 2006 2007 2008 2009 p/
• PHILIPPINES – UNITED KINGDOM TRADE
(in million USD)
� Net Foreign Direct Investment
4.89 510.77 8.80 1.26 3.10 1.98 9.91 16.52 74.77 298.17 0.45
� Net Foreign Portfolio Investment
2000 2001 2002 2003 2004 2005 2006
-232.61 -69.04 42.58 71.70 162.40 483.28 950.58
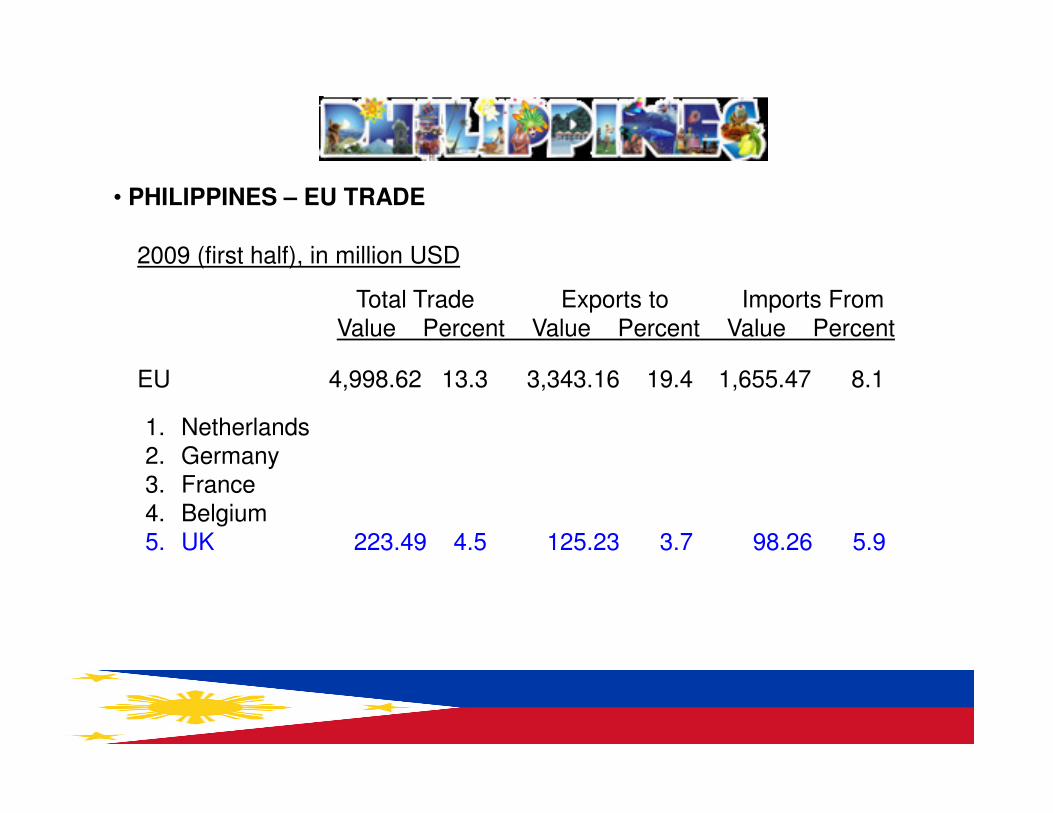
EU 4,998.62 13.3 3,343.16 19.4 1,655.47 8.1
Total Trade Exports to Imports From Value Percent Value Percent Value Percent
• PHILIPPINES – EU TRADE
2009 (first half), in million USD
1. Netherlands2. Germany3. France 4. Belgium5. UK 223.49 4.5 125.23 3.7 98.26 5.9

Value(in million USD) %Share
Total 3,343.16 100.0
Major Philippine Exports to EU
• PHILIPPINES – EU TRADE
Electronic products 2,386.70 71.4 Products from consigned imported materials 173.33 5.2 Coconut oil 84.23 2.5Tuna 84.18 2.5Articles of apparel and clothing accessories 66.67 2.0
Value(in million USD) Share
Total 1,655.47 100.0
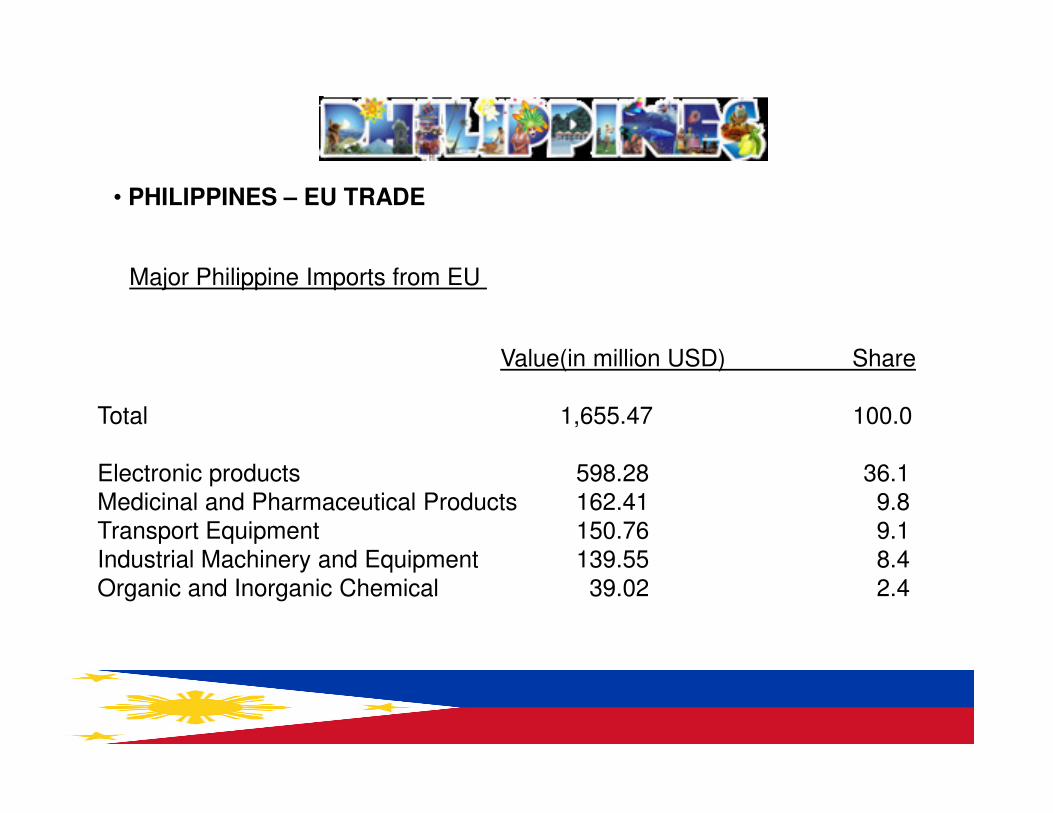
Major Philippine Imports from EU
• PHILIPPINES – EU TRADE
Total 1,655.47 100.0
Electronic products 598.28 36.1 Medicinal and Pharmaceutical Products 162.41 9.8 Transport Equipment 150.76 9.1 Industrial Machinery and Equipment 139.55 8.4 Organic and Inorganic Chemical 39.02 2.4
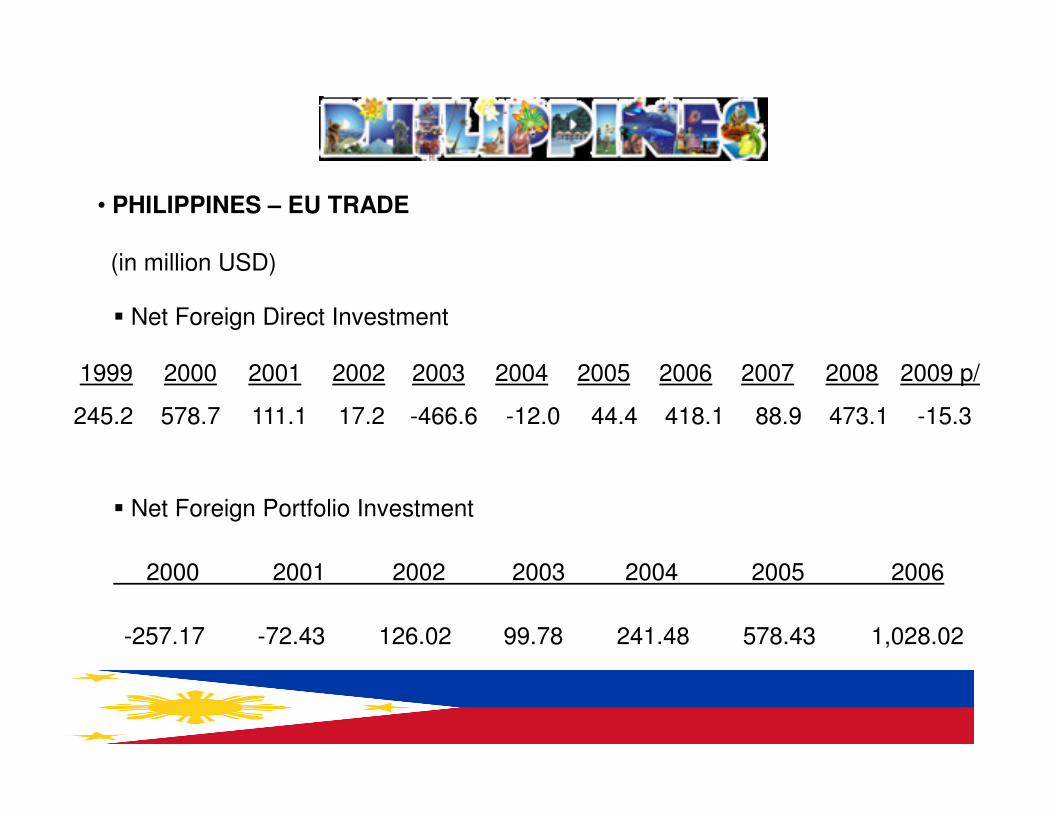
1999 2000 2001 2002 2003 2004 2005 2006 2007 2008 2009 p/
• PHILIPPINES – EU TRADE
(in million USD)
� Net Foreign Direct Investment
245.2 578.7 111.1 17.2 -466.6 -12.0 44.4 418.1 88.9 473.1 -15.3
� Net Foreign Portfolio Investment
2000 2001 2002 2003 2004 2005 2006
245.2 578.7 111.1 17.2 -466.6 -12.0 44.4 418.1 88.9 473.1 -15.3
-257.17 -72.43 126.02 99.78 241.48 578.43 1,028.02
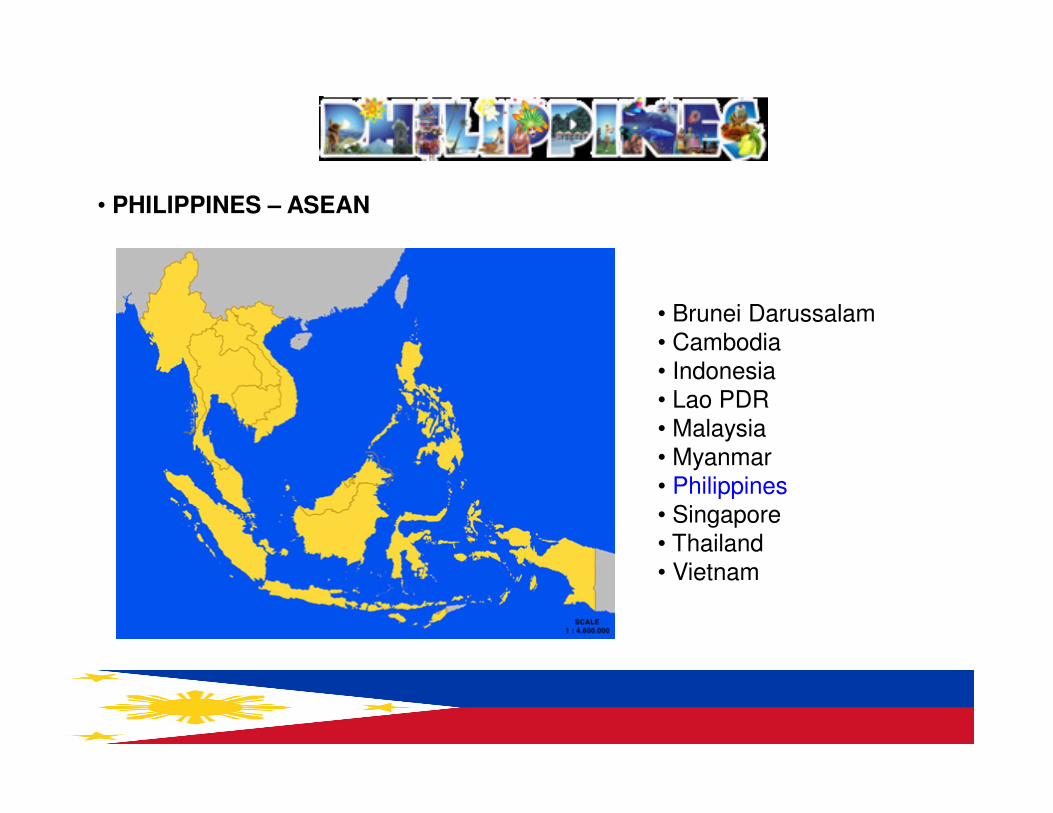
• Brunei Darussalam• Cambodia• Indonesia• Lao PDR
• PHILIPPINES – ASEAN
• Lao PDR• Malaysia• Myanmar• Philippines• Singapore• Thailand• Vietnam
• PHILIPPINES – ASEAN
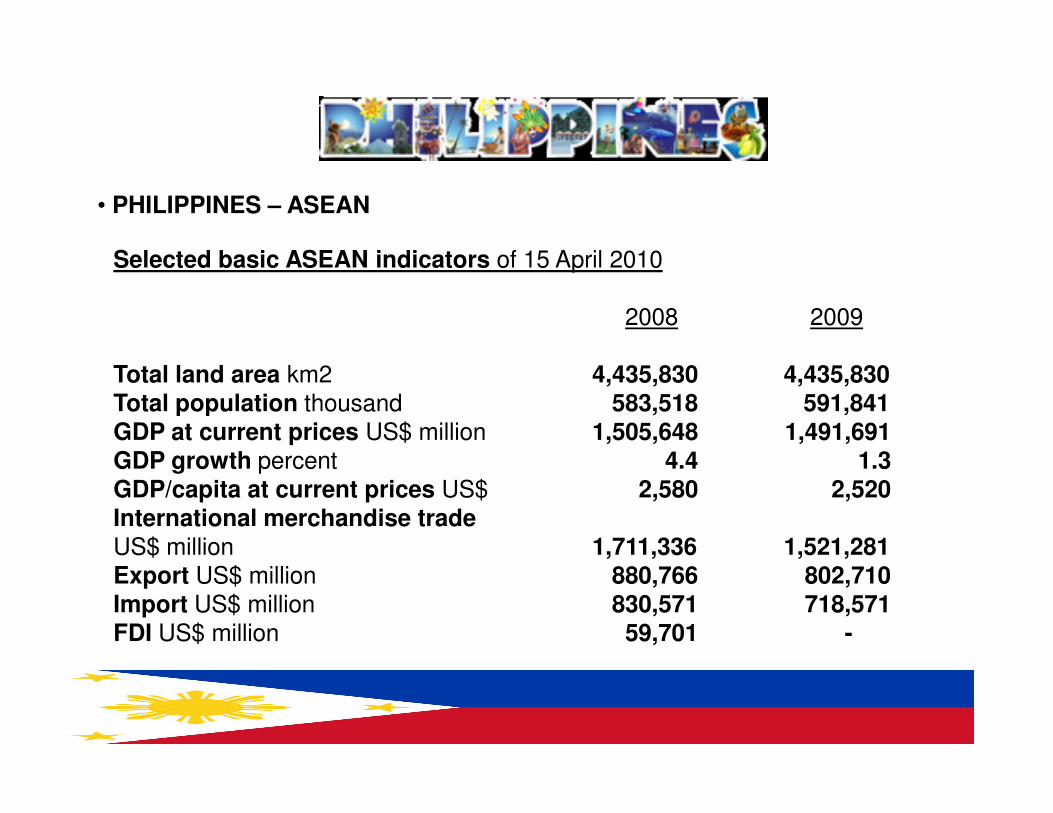
Selected basic ASEAN indicators of 15 April 2010
2008 2009
Total land area km2 4,435,830 4,435,830Total population thousand 583,518 591,841 Total population thousand 583,518 591,841 GDP at current prices US$ million 1,505,648 1,491,691GDP growth percent 4.4 1.3GDP/capita at current prices US$ 2,580 2,520International merchandise trade US$ million 1,711,336 1,521,281Export US$ million 880,766 802,710Import US$ million 830,571 718,571FDI US$ million 59,701 -
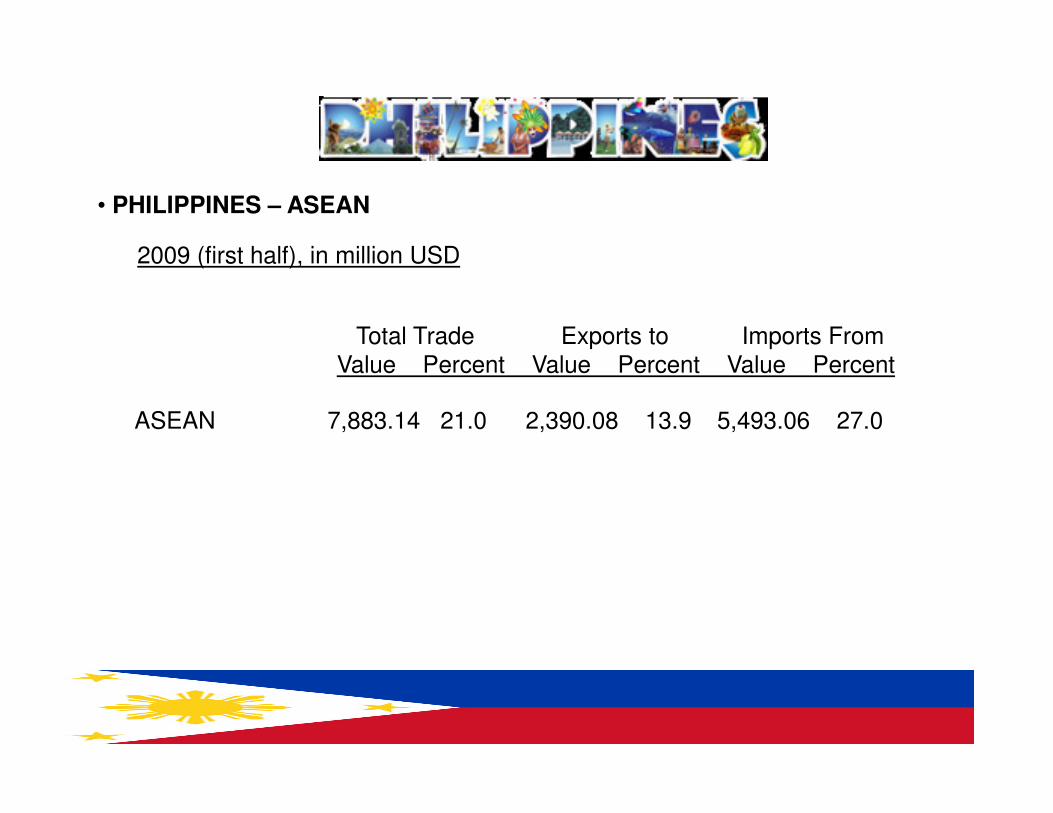
Total Trade Exports to Imports From Value Percent Value Percent Value Percent
• PHILIPPINES – ASEAN
2009 (first half), in million USD
ASEAN 7,883.14 21.0 2,390.08 13.9 5,493.06 27.0

Value Share to total ASEAN trade
ASEAN Trade with EU, 2009 (in millions USD)
• ASEAN TRADE
2009 - 88,773.9 81,098.7 169,872.5 11.1 11.3 11.2
Exports Imports Total trade Exports Imports Total trade
Value Share to total ASEAN trade
2008 - 89,471.5 112,886.8 202,358.3 10.2 13.6 11.8
UK 2008 - 12,835.1 8,567.0 21,402.1 1.5 1.0 1.3
� With the entry into force of the ASEAN Charter on 15 December 2008, ASEAN will operate under a new legal framework and establish a number of new organs to boost its community-building process.
• ASEAN TRADE
ASEAN Charter
� Economic Significance of Charter:
• Rules-based economic integration; market economy• Adherence to multilateral trade rules and ASEAN’s rules-based regimes• Progress reduction towards elimination of all barriers to regional economic integration
ASEAN Trade Agreements - ASEAN Free Trade Area (AFTA)
� The AFTA has been virtually established with significant progress in the lowering of intra-regional tariffs through the Common Effective Preferential Tariff (CEPT) Scheme. More than 99% of products in the CEPT Inclusion List (IL) of the ASEAN-6 have been brought down to the 0-5% tariff range
• ASEAN TRADE
the ASEAN-6 have been brought down to the 0-5% tariff range
� Products that remain out of the CEPT-AFTA Scheme are those in the Highly Sensitive List (i.e. rice) and the General Exception List.
� ASEAN’s newer members are not far behind in the implementation of their CEPT commitments with almost 80 percent of their products having been moved into their respective CEPT ILS.

�The cost of doing business in ASEAN will be lower and trade-related transactions simpler as the ATIGA entered into force on 17 May 2010.
�The ATIGA consolidates all commitments related to trade in goods. It
• ASEAN TRADE
ASEAN Trade Agreements - ASEAN Trade in Goods Agreement (ATIGA)
�The ATIGA consolidates all commitments related to trade in goods. It focuses on not only tariff liberalisation and non-tariff measures, but it also includes matters related to simplification of rules of origin and its implementation.
�The ATIGA contains the full import duty liberalisation schedule among ASEAN Member States and spells out the tariff rates to be applied on products, providing businesses with transparency and certainty.
• ASEAN TRADE
ASEAN Trade Agreements – FTAs with Other Countries
� The ASEAN-China FTA became fully effective as of 1 January 2010;Agreement on Trade in Goods was signed in 2004; Trade In ServicesAgreement entered into force in July 2007; Investment Agreement signed inAugust 2009.
� The ASEAN-Korea Trade in Goods Agreement was signed in August 2006; Trade in Services Agreement was concluded in November 2007; Investment Agreement was signed in June 2009
� The Agreement Establishing the ASEAN-Australia-New Zealand Free Trade Area (AANZFTA) was signed on 27 February 2009.
� The EU is reportedly still keen on a free trade pact with ASEAN although itwill soon start free trade agreement talks with individual membercountries.
� One of the stumbling blocks to an FTA with ASEAN is that its members are
ASEAN Trade Agreements – EU (?)
• ASEAN TRADE
� One of the stumbling blocks to an FTA with ASEAN is that its members arein different phases of development.
� The EU hopes to start its first FTA talk in ASEAN with Singapore, andrecently expressed interest in an FTA with Vietnam.

RP-EU Partnership and Cooperation Agreement (PCA)
� Great progress was reported at the fourth round of negotiations concluded last 5 February 2010 on the PCA that will serve as the general framework of relationsbetween the Philippines and the European Union.
� The parties agreed on provisions with respect combating illicit drugs, employment
• PHILIPPINES – EU TRADE
� The parties agreed on provisions with respect combating illicit drugs, employment and social affairs, data protection, education, culture and intercultural and interfaith dialogue, development cooperation, statistics, and small arms and light weapons.
� Next round of PCA negotiations in June may also be the last. FTA talks may proceed thereafter.
� The Philippine Trade and Industry Secretary issued a statement on 18 May 2010 that “an FTA between the Philippines and the EU is not only desirable but also in order”.
� On 10 May 2010, Philippine national elections were held to elect a new President and Vice-President, 12 Senators, the House of Representatives, and local government officials.
� There was 75% turnout of the 50 million registered voters. Foreign governments - including the UK and the EU - congratulated the Philippines on
• PHILIPPINES – NEW GOVERNMENT
governments - including the UK and the EU - congratulated the Philippines on the successful elections.
� With 90% of votes counted, Senator Benigno Simeon “Noynoy” Aquino IIIleads his closest rival by over five million votes.
• PHILIPPINES – NEW GOVERNMENT
Policy Pronouncements of Senator Aquino:
� Raise Tax Efficiency rate by two percentage points from the current 13%
� Consider raising taxes if it was clear budget shortfall was unlikely to be cut quickly by anti-evasion and anti-smuggling measures
� Streamline fiscal incentives offered to investors
� Impose a “zero budgeting” measure, in which all major-ticket items under the P1.54-trillion 2010 budget will be re-examined
� Reduce red-tape and simplify business procedures
� Improve transportation and housing infrastructure, invest in early childhood education, and achieve 100 percent health care protection in three years
• PHILIPPINES – NEW GOVERNMENT
Policy Pronouncements of Senator Aquino include (continued):
� Promote industries with the greatest potential for growth and where the Philippines has a competitive advantage, such as agri-business, BPO, creative industries, infrastructure, manufacturing and logistics, mining, and tourism and retirement.and tourism and retirement.
� Review possible changes to economic provisions in the Philippine Constitution, in his first 100 days as President.
� Increase defense spending to two percent of GDP, from the current one percent.

THANK YOU
ANDAND
MABUHAY!


![PHILIPPINE ECONOMY [PREHISTORIC]](https://img.pdfslide.net/doc/110x75/546eae3caf795987318b4ba7/philippine-economy-prehistoric.jpg)