Embed Size (px)
Citation preview

TIMSS & PIRLS INTERNATIONAL STUDY CENTER, LYNCH SCHOOL OF EDUCATION, BOSTON COLLEGE 333
APPENDIX A: OVERVIEW OF TIMSS 2003 PROCEDURES: MATHEMATICS ACHIEVEMENT
Appendix AOverview of TIMSS Procedures for Assessing Mathematics
History
TIMSS 2003 is the latest in a long series of studies conducted by the International Association for the Evaluation of Educational Achieve-ment (IEA). Since its inception in 1959, the IEA has conducted almost 20 studies of cross-national achievement in the curricular areas of mathematics, science, language, civics, and reading.
In particular, TIMSS 2003 continues a rich tradition of studies designed to improve teaching and learning in mathematics and science. IEA conducted the pioneering First International Science Study (FISS) in 1970-71 and the Second International Science Study (SISS) in 1983-84. The First and Second International Mathematics Studies (FIMS and SIMS) were conducted in 1964 and 1980-82, respectively. The Third International Mathematics and Science Study (TIMSS) in 1994-1995 was the largest and most complex IEA study ever conducted, including both mathematics and science at third and fourth grades, seventh and eighth grades, and the fi nal year of secondary school.
In 1999, TIMSS (now renamed the Trends in International Mathematics and Science Study) again assessed eighth-grade students

TIMSS & PIRLS INTERNATIONAL STUDY CENTER, LYNCH SCHOOL OF EDUCATION, BOSTON COLLEGE334
APPENDIX A: OVERVIEW OF TIMSS 2003 PROCEDURES: MATHEMATICS ACHIEVEMENT
in both mathematics and science to measure trends in student achieve-ment since 1995. Also, 1999 represented four years since the fi rst TIMSS, and the population of students originally assessed as fourth-graders had advanced to the eighth grade. Thus, TIMSS 1999 also pro-vided information about whether the relative performance of these students had changed in the intervening years.
TIMSS 2003, the third data collection in the TIMSS cycle of studies, was administered at the eighth and fourth grades. For coun-tries that participated in previous assessments, TIMSS 2003 provides three-cycle trends at the eighth grade (1995, 1999, 2003) and data over two points in time at the fourth grade (1995 and 2003). In countries new to the study, the 2003 results can help policy makers and prac-titioners assess their comparative standing and gauge the rigor and effectiveness of their mathematics and science programs. TIMSS 2007 will again assess mathematics and science achievement at fourth and eighth grades, providing previously participating countries an oppor-tunity to extend their trend lines and new countries an opportunity to join a valuable and exciting endeavor.
Participants in TIMSS
Exhibit A.1 lists all the countries that have participated in TIMSS in 1995, 1999, or 2003 at fourth or eighth grade. In all, 67 countries have participated in TIMSS at one time or another. Of the 49 coun-tries that participated in TIMSS 2003, 48 participated at the eighth grade and 26 at the fourth grade. Yemen participated at the fourth but not the eighth grade. The exhibit shows that at the eighth grade 23 countries also participated in TIMSS 1995 and TIMSS 1999. For these participants, trend data across three points in time are avail-able. Eleven countries participated in TIMSS 2003 and TIMSS 1999 only, while three countries participated in TIMSS 2003 and TIMSS 1995. These countries have trend data for two points in time. Of the 12 new countries participating in the study, 11 participated at eighth grade and 2 at the fourth grade. Of the 26 countries participating in

TIMSS & PIRLS INTERNATIONAL STUDY CENTER, LYNCH SCHOOL OF EDUCATION, BOSTON COLLEGE 335
APPENDIX A: OVERVIEW OF TIMSS 2003 PROCEDURES: MATHEMATICS ACHIEVEMENT
TIMSS 2003 at the fourth grade, 16 also participated in 1995, provid-ing data at two points in time.
Inspired by the very successful TIMSS 1999 benchmarking ini-tiative in the United States,1 in which 13 states and 14 school dis-tricts or district consortia administered the TIMSS assessment and compared their students’ achievement to student achievement world wide, TIMSS 2003 provided an international benchmarking program, whereby regions or localities of countries could participate in the study to compare to international standards. TIMSS 2003 included four benchmarking participants at the eighth grade: the Basque Country of Spain, the US state of Indiana, and the Canadian provinces of Ontario and Quebec. Indiana, Ontario, and Quebec participated also at the fourth grade. Having also participated in 1999, Indiana has data at two points in time at eighth grade. Ontario and Quebec participated also in 1995 and 1999, and so have trend data across three points in time at both grade levels.
1 Mullis, I.V.S., Martin, M.O., Gonzalez, E.J., O’Connor, K.M., Chrostowski, S.J., Gregory, K.D., Garden, R.A., and Smith, T.A. (2001), Math-ematics Benchmarking Report TIMSS 1999 – Eighth Grade: Achievement for U.S. States and Districts in an International Context. Chestnut Hill, MA: Boston College.

SOU
RCE:
IEA
's T
rend
s in
Inte
rnat
iona
l Mat
hem
atic
s an
d Sc
ienc
e St
udy
(TIM
SS) 2
003
TIMSS & PIRLS INTERNATIONAL STUDY CENTER, LYNCH SCHOOL OF EDUCATION, BOSTON COLLEGE336
TIMSS2003APPENDIX A: OVERVIEW OF TIMSS 2003 PROCEDURES: MATHEMATICS ACHIEVEMENT
Grades 88MATHEMATICS 44&
2003 1999 1995 2003 1995
1 Argentina k k
Armenia k k
Australia k k k k k
Austria k k
Bahrain k
Belgium (Flemish) k k k k
Belgium (French) k
Botswana k
Bulgaria k k k
Canada k k k
Chile k k
Chinese Taipei k k k
Colombia k
Cyprus k k k k k
Czech Republic k k k
Denmark k
Egypt k
England k k k k k
Estonia k
Finland k
France k
Germany k
Ghana k
Greece k k
Hong Kong, SAR k k k k k
Hungary k k k k k
Iceland k k
Indonesia k k
Iran, Islamic Rep. of k k k k k
Ireland k k
Israel k k k k
Italy k k k k k
Japan k k k k k
Jordan k k
Korea, Rep. of k k k k
Kuwait k k
Latvia k k k k k
Lebanon k
Lithuania k k k k
Macedonia, Rep. of k k
Malaysia k k
Moldova, Rep. of k k k
Morocco k k k
Netherlands k k k k k
New Zealand k k k k k
Norway k k k k
Palestinian Nat'l Auth. k
Philippines k k k
Portugal k k
Grade 8 Grade 4
Countries
Exhibit A.1: Countries Participating in TIMSS 2003, 1999, and 1995
1 Argentina administered the TIMSS 2003 data collection one year late, and did not score and process its data in time for inclusion in this report.

SOU
RCE:
IEA
's T
rend
s in
Inte
rnat
iona
l Mat
hem
atic
s an
d Sc
ienc
e St
udy
(TIM
SS) 2
003
APPENDIX A: OVERVIEW OF TIMSS 2003 PROCEDURES: MATHEMATICS ACHIEVEMENT TIMSS2003
TIMSS & PIRLS INTERNATIONAL STUDY CENTER, LYNCH SCHOOL OF EDUCATION, BOSTON COLLEGE 337
Grades 88MATHEMATICS 44&
2003 1999 1995 2003 1995
Romania k k k
Russian Federation k k k k
Saudi Arabia k
Scotland k k k k
Serbia k
Singapore k k k k k
Slovak Republic k k k
Slovenia k k k k k
South Africa k k k
Spain k
Sweden k k
Switzerland k
2 Syrian Arab Republic k
Thailand k k k
Tunisia k k k
Turkey k
United States k k k k k
2 Yemen k
Benchmarking ParticipantsBasque Country, Spain k
Indiana State, US k k k
3 Ontario Province, Can. k k k k k
3 Quebec Province, Can. k k k k k
Grade 8 Grade 4
Countries
Exhibit A.1: Countries Participating in TIMSS 2003, 1999, and 1995
2 Because the characteristics of their samples are not completely known, achievement data for Syrian Arab Republic and Yemen are presented in Appendix F of this report.
3 Ontario and Quebec participated in TIMSS 1999 and 1995 as part of Canada.

TIMSS & PIRLS INTERNATIONAL STUDY CENTER, LYNCH SCHOOL OF EDUCATION, BOSTON COLLEGE338
APPENDIX A: OVERVIEW OF TIMSS 2003 PROCEDURES: MATHEMATICS ACHIEVEMENT
Developing the TIMSS 2003 Mathematics Assessment
The development of the TIMSS 2003 mathematics assessment was a collaborative process spanning a two-and-a-half-year period and involving mathematics educators and development specialists from all over the world.2 Central to this effort was a major updating and revi-sion of the existing TIMSS assessment frameworks to address changes during the last decade in curricula and the way mathematics is taught. The resulting publication entitled TIMSS Assessment Frameworks and Spec-ifi cations 2003 serves as the basis of TIMSS 2003 and beyond.3
As shown in Exhibit A.2, the mathematics assessment frame-work for TIMSS 2003 is framed by two organizing dimensions or aspects, a content domain and a cognitive domain. The fi ve content domains, number, algebra, measurement, geometry, and data, defi ne the specifi c mathematics subject matter covered by the assessment, and the four cognitive domains defi ne the sets of behaviors expected of students as they engage with the mathematics content. The cognitive domains include knowing facts and procedures, using concepts, solving routine problems, and reasoning.
Developing the TIMSS assessments for 2003 was a cooperative venture involving all of the National Research Coordinators (NRCs) during the entire process. Although about half of the items in the 1999 eighth-grade assessment had been kept secure and were available for use in 2003 to measure trends from 1995 and 1999, the ambitious goals for curriculum coverage and innovative problem solving tasks specifi ed in the Frameworks and Specifi cations necessitated a tremendous item development effort.
To maximize the effectiveness of the contributions from national centers, the TIMSS & PIRLS International Study Center developed a detailed item-writing manual and conducted a workshop for countries that wished to provide items for the international item pool. At this workshop, an item development “Task Force” consisting of the math-ematics coordinator and two experienced mathematics item writers
2 For a full discussion of the TIMSS 2003 test development effort, please see Smith Neidorf, T.A. and Garden, R.A. (2004), “Developing the TIMSS 2003 Mathematics and Science Assessment and Scoring Guides” in M.O. Martin, I.V.S. Mullis and S.J. Chrostowski (eds.), TIMSS 2003 Technical Report, Chestnut Hill, MA: Boston College.
3 Mullis, I.V.S., Martin, M.O., Smith, T.A., Garden, R.A., Gregory, K.D., Gonzalez, E.J., Chrostowski, S.J, and O’Connor, K.M. (2003), TIMSS Assessment Frameworks and Specifi cations 2003 (2nd Edition), Chestnut Hill, MA: Boston College.
For the TIMSS frameworks used in 1995 and 1999, see Robitaillle, D.F., McKnight, C.C., Schmidt, W.H., Britton, E.D., Raisen, S.A., and Nicol, C. (1993), TIMSS Monograph No. 1: Curriculum Frameworks for Mathematics and Science, Vancouver, BC: Pacifi c Educational Press.

SOU
RCE:
IEA
's T
rend
s in
Inte
rnat
iona
l Mat
hem
atic
s an
d Sc
ienc
e St
udy
(TIM
SS) 2
003
APPENDIX A: OVERVIEW OF TIMSS 2003 PROCEDURES: MATHEMATICS ACHIEVEMENT TIMSS2003
TIMSS & PIRLS INTERNATIONAL STUDY CENTER, LYNCH SCHOOL OF EDUCATION, BOSTON COLLEGE 339
Grades 88MATHEMATICS 44&
Number
Algebra*
Measurement
Geometry
Data
Knowing Facts and Procedures
Using Concepts
Solving Routine Problems
Reasoning
Content Domain
Cognitive Domain
The Content and the Cognitive Domains of the Mathematics Frameworks
Exhibit A.2:
* At fourth grade, the Algebra content domain is called Patterns and Relationships.

TIMSS & PIRLS INTERNATIONAL STUDY CENTER, LYNCH SCHOOL OF EDUCATION, BOSTON COLLEGE340
APPENDIX A: OVERVIEW OF TIMSS 2003 PROCEDURES: MATHEMATICS ACHIEVEMENT
reviewed general item-writing guidelines for multiple-choice and con-structed-response items and provided specifi c training in writing math-ematics and science items in accordance with the TIMSS Assessment Frameworks and Specifi cations 2003. In the weeks that followed, more than 2,000 items and scoring guides were drafted, and reviewed by the task force. The items were further reviewed by the Science and Math-ematics Item Review Committee, a group of internationally prominent mathematics and science educators nominated by participating coun-tries to advise on subject-matter issues in the assessment. Committee members also contributed enormously to the quality of the assessment by helping to develop tasks and items to assess problem solving and scientifi c inquiry.
Participating countries fi eld-tested the items with representa-tive samples of students, and all of the potential new items were again reviewed by the Science and Mathematics Item Review Committee. The NRCs had several opportunities to review the items and scoring criteria. The resulting TIMSS 2003 mathematics tests contained 194 items at the eighth grade and 161 items at the fourth grade.
Exhibit A.3 presents the number and percentage of items, the number of multiple-choice and constructed-response items, and the number of score points in each of the fi ve mathematics content domains for eighth and fourth grades. Comparable information is pre-sented for the four cognitive domains. About one-fourth of the eighth-grade items and more than two-fi fths of the fourth-grade items were in constructed-response format, requiring students to generate and write their own answers. Some constructed-response questions asked for short answers while others required extended responses with stu-dents showing their work or providing explanations for their answers. The remaining questions used a multiple-choice format. In scoring the items, correct answers to most questions were worth one point. However, responses to some constructed-response questions (particu-larly those requiring extended responses) were evaluated for partial credit, with a fully correct answer being awarded two points (see later

TIMSS & PIRLS INTERNATIONAL STUDY CENTER, LYNCH SCHOOL OF EDUCATION, BOSTON COLLEGE 341
APPENDIX A: OVERVIEW OF TIMSS 2003 PROCEDURES: MATHEMATICS ACHIEVEMENT
section on scoring). The total number of score points available for anal-ysis thus somewhat exceeds the number of items (215 and 169 score points for eighth- and fourth-grades, respectively). About 40% of stu-dents’ testing time at eighth grade and almost half at fourth grade was allocated to constructed-response items.
To ensure reliable measurement of trends over time, the TIMSS 2003 assessment included items that had been used in the 1995 and 1999 assessments as well as items developed for the fi rst time in 2003. Exhibit A.4 shows the distribution of score points across content domains for both trend items and items used for the fi rst time. Of the 215 score points available in the entire 2003 mathematics assessment, 23 came from items used also in 1995, 60 from items used also in 1999, and 132 from items used for the fi rst time in 2003. At fourth grade, 37 score points came from 1995 items, and the remaining 132 from new 2003 items.
Every effort was made to ensure that the tests represented the curricula of the participating countries and that the items exhibited no bias toward or against particular countries. The fi nal forms of the test were endorsed by the NRCs of the participating countries. In addi-tion, countries had an opportunity to match the content of the test to their curriculum. They identifi ed items measuring topics not covered in their intended curriculum. The information from this Test-Curriculum Matching Analysis, provided in Appendix C, indicates that omitting such items has little effect on the overall pattern of results.

SOU
RCE:
IEA
's T
rend
s in
Inte
rnat
iona
l Mat
hem
atic
s an
d Sc
ienc
e St
udy
(TIM
SS) 2
003
TIMSS & PIRLS INTERNATIONAL STUDY CENTER, LYNCH SCHOOL OF EDUCATION, BOSTON COLLEGE342
TIMSS2003
Grade88MATHEMATICS
APPENDIX A: OVERVIEW OF TIMSS 2003 PROCEDURES: MATHEMATICS ACHIEVEMENT
Exhibit A.3:
Number 30 57 43 14 60
Algebra 24 47 29 18 53
Measurement 16 31 19 12 34
Geometry 16 31 22 9 34
Data 14 28 15 13 34
Total 100 194 128 66 215
Cognitive Domain
Knowing Factsand Procedures 23 45 35 10 45
Using Concepts 19 37 31 6 39
Solving RoutineProblems 36 70 43 27 76
Reasoning 22 42 19 23 55
Total 100 194 128 66 215
Number ofMultiple-Choice
Items
Number ofConstructed-
Response
Items1
Percentageof Items
Numberof Score
Points2
Percentageof Items
TotalNumberof Items
Number ofMultiple-Choice
Items
Number ofConstructed-
Response
Items1
Numberof Score
Points2
Content DomainTotal
Numberof Items
Distribution of Mathematics Items by Content Domain and Cognitive Domain
1 Constructed-response items include both short-answer and extended-response types. 2 In scoring the tests, correct answers to most items were worth one point. However, responses to some constructed-response items were evaluated for partial credit with a fully correct answer awarded two points. Thus, the number of score points exceeds the number of items in the test.

SOU
RCE:
IEA
's T
rend
s in
Inte
rnat
iona
l Mat
hem
atic
s an
d Sc
ienc
e St
udy
(TIM
SS) 2
003
APPENDIX A: OVERVIEW OF TIMSS 2003 PROCEDURES: MATHEMATICS ACHIEVEMENT TIMSS2003
GradeMATHEMATICS44
TIMSS & PIRLS INTERNATIONAL STUDY CENTER, LYNCH SCHOOL OF EDUCATION, BOSTON COLLEGE 343
Exhibit A.3:
Number 39 63 30 33 68
Patterns andRelationships 15 24 16 8 25
Measurement 20 33 23 10 33
Geometry 15 24 12 12 25
Data 11 17 11 6 18
Total 100 161 92 69 169
Cognitive Domain
Knowing Facts andProcedures 24 38 20 18 39
Using Concepts 23 37 24 13 39
Solving RoutineProblems 37 60 35 25 61
Reasoning 16 26 13 13 30
Total 100 161 92 69 169
Content Domain Percentageof Items
TotalNumberof Items
Number ofMultiple-Choice
Items
Number ofConstructed-
Response
Items1
Numberof Score
Points2
Percentageof Items
TotalNumberof Items
Number ofMultiple-Choice
Items
Number ofConstructed-
Response
Items1
Numberof Score
Points2
Distribution of Mathematics Items by Content Domain and Cognitive Domain
1 Constructed-response items include both short-answer and extended-response types. 2 In scoring the tests, correct answers to most items were worth one point. However, responses to some constructed-response items were evaluated for partial credit with a fully correct answer awarded two points. Thus, the number of score points exceeds the number of items in the test.

SOU
RCE:
IEA
's T
rend
s in
Inte
rnat
iona
l Mat
hem
atic
s an
d Sc
ienc
e St
udy
(TIM
SS) 2
003
TIMSS & PIRLS INTERNATIONAL STUDY CENTER, LYNCH SCHOOL OF EDUCATION, BOSTON COLLEGE344
TIMSS2003APPENDIX A: OVERVIEW OF TIMSS 2003 PROCEDURES: MATHEMATICS ACHIEVEMENT
Grades 88MATHEMATICS 44&Distribution of Score Points in TIMSS 2003 from Each Assessment Year by Mathematics Content Domain
Exhibit A.4:
Content Domain
Number 6 20 34 60
Algebra 6 11 36 53
Measurement 4 14 16 34
Geometry 4 8 22 34
Data 3 7 24 34
Total 23 60 132 215
From 1995 From 1999 New in 2003 Total
Content Domain
Number 19 N/A 49 68
Patterns andRelationships 2 N/A 23 25
Measurement 8 N/A 25 33
Geometry 4 N/A 21 25
Data 4 N/A 14 18
Total 37 N/A 132 169
From 1995 From 1999 New in 2003 Total
Grade 8
Grade 4

TIMSS & PIRLS INTERNATIONAL STUDY CENTER, LYNCH SCHOOL OF EDUCATION, BOSTON COLLEGE 345
APPENDIX A: OVERVIEW OF TIMSS 2003 PROCEDURES: MATHEMATICS ACHIEVEMENT
TIMSS 2003 Assessment Design
Not all of the students in the TIMSS assessment responded to all of the mathematics items. To ensure broad subject-matter coverage without overburdening individual students, TIMSS 2003, as in the 1995 and 1999 assessments, used a matrix-sampling technique that assigns each assessment item to one of a set of item blocks, and then assembles student test booklets by combining the item blocks according to a bal-anced design. Each student takes one booklet containing both math-ematics and science items. Thus, the same students participated in both the mathematics and science testing.
Exhibit A.5 summarizes the TIMSS 2003 assessment design, presenting both the matrix-sampling item blocks for mathematics and science and the item block-to-booklet assignment plan. According to the design, the 313 mathematics and science items at fourth grade and 383 items at eighth grade are divided among 28 item blocks at each grade, 14 mathematics blocks labeled M01 through M14, and 14 science blocks labeled S01 through S14. Each block contains either mathematics items only or science items only. This general block design is the same for both grades, although the planned assessment time per block is 12 minutes for fourth grade and 15 minutes for eighth grade. At the eighth grade, six blocks in each subject (blocks 01 – 06) contain secure items from 1995 and 1999 to measure trends and eight blocks (07 – 14) contain new items developed for TIMSS 2003. Since fourth grade was not included in the 1999 assessment, trend items from 1995 only were available, and these were placed in the fi rst three blocks. The remaining 11 blocks contain items new in 2003.
In the TIMSS 2003 design, the 28 blocks of items are distributed across 12 student booklets, as shown in Exhibit A.5. Each booklet con-sists of six blocks of items. To enable linking between booklets, each block appears in two, three, or four different booklets. The assessment time for individual students is 72 minutes at fourth grade (six 12-minute blocks) and 90 minutes at eighth grade (six 15-minute blocks),

SOU
RCE:
IEA
's T
rend
s in
Inte
rnat
iona
l Mat
hem
atic
s an
d Sc
ienc
e St
udy
(TIM
SS) 2
003
TIMSS & PIRLS INTERNATIONAL STUDY CENTER, LYNCH SCHOOL OF EDUCATION, BOSTON COLLEGE346
TIMSS2003APPENDIX A: OVERVIEW OF TIMSS 2003 PROCEDURES: MATHEMATICS ACHIEVEMENT
Grades 88MATHEMATICS 44&
Student Booklet
Booklet 1 M01 M02 S06 S07 M05 M07
Booklet 2 M02 M03 S05 S08 M06 M08
Booklet 3 M03 M04 S04 S09 M13 M11
Booklet 4 M04 M05 S03 S10 M14 M12
Booklet 5 M05 M06 S02 S11 M09 M13
Booklet 6 M06 M01 S01 S12 M10 M14
Booklet 7 S01 S02 M06 M07 S05 S07
Booklet 8 S02 S03 M05 M08 S06 S08
Booklet 9 S03 S04 M04 M09 S13 S11
Booklet 10 S04 S05 M03 M10 S14 S12
Booklet 11 S05 S06 M02 M11 S09 S13
Booklet 12 S06 S01 M01 M12 S10 S14
Part I Part II
Booklet Design for TIMSS 2003
New Replacement Items (TIMSS 2003)
New Replacement Items (TIMSS 2003)
S13
S14
New Replacement Items (TIMSS 2003)
New Replacement Items (TIMSS 2003)
New Replacement Items (TIMSS 2003)
New Replacement Items (TIMSS 2003)
Trend Items (TIMSS 1999)
Trend Items (TIMSS 1999)
New Replacement Items (TIMSS 2003)
New Replacement Items (TIMSS 2003)
Trend Items (TIMSS 1995 or 1999)
Trend Items (TIMSS 1995 or 1999)
Trend Items (TIMSS 1995 or 1999)
Trend Items (TIMSS 1999)
M10
M01
Source of Items
TIMSS 2003 Item Blocks for Matrix-Sampling
M05
Mathematics Blocks
M06
M07
M08
M09
M03
M04
M02
S03
S04
M11
M12
M13
M14
S12
S05
S06
S07
S08
Science Blocks
S09
S10
S11
S01
S02
Exhibit A.5: TIMSS 2003 Assessment Design

TIMSS & PIRLS INTERNATIONAL STUDY CENTER, LYNCH SCHOOL OF EDUCATION, BOSTON COLLEGE 347
APPENDIX A: OVERVIEW OF TIMSS 2003 PROCEDURES: MATHEMATICS ACHIEVEMENT
which is comparable to that in the 1995 and 1999 assessments. The booklets are organized into two three-block sessions (Parts I and II), with a break between the parts.
The 2003 assessment was the fi rst TIMSS assessment in which calculators were permitted, and so it was important that the design allow students to use calculators when working on the new 2003 items. However, because calculators were not permitted in TIMSS 1995 or 1999, the design also had to ensure that students did not use calcula-tors when working on trend items from these assessments. The solu-tion was to place the blocks containing trend items (blocks M01 – M06 and S01 – S06) in Part I of the test booklets, to be completed without calculators before the break. After the break, calculators were allowed for the new items (blocks M07 – M14 and S07 – S14). To provide a more balanced design, however, and have information about differ-ences with calculator access, two mathematics trend blocks (M05 and M06) and two science trend blocks (S05 and S06) also were placed in Part II of one booklet each.
Background Questionnaires
As in previous assessments, TIMSS in 2003 administered a broad array of questionnaires to collect data on the educational context for student achievement. For TIMSS 2003, a concerted effort was made to stream-line and upgrade the questionnaires. This work began with articulat-ing the information to be collected in the TIMSS 2003 framework and continued with extensive fi eld testing.4
Across the two grades and two subjects, TIMSS 2003 involved 11 questionnaires. National Research Coordinators completed four ques-tionnaires. With the assistance of their curriculum experts, they pro-vided detailed information on the organization, emphasis, and content coverage of the mathematics and science curriculum at fourth and eighth grades. The fourth- and eighth-grade students who were tested answered questions pertaining to their attitudes towards mathematics
4 For more information, see Chrostowski, S.J. (2004), “Developing the TIMSS 2003 Background Questionnaires” in M.O. Martin, I.V.S. Mullis, and S.J. Chrostowski (eds.), TIMSS 2003 Technical Report, Chestnut Hill, MA: Boston College.

TIMSS & PIRLS INTERNATIONAL STUDY CENTER, LYNCH SCHOOL OF EDUCATION, BOSTON COLLEGE348
APPENDIX A: OVERVIEW OF TIMSS 2003 PROCEDURES: MATHEMATICS ACHIEVEMENT
and science, their academic self-concept, classroom activities, home background, and out-of-school activities. The mathematics and science teachers of sampled students responded to questions about teaching emphasis on the topics in the curriculum frameworks, instructional practices, professional training and education, and their views on mathematics and science. Separate questionnaires for mathematics and science teachers were administered at the eighth grade, while to refl ect the fact that most younger students are taught all subjects by the same teacher, a single questionnaire was used at the fourth grade. The principals or heads of schools at the fourth and eighth grades responded to questions about school staffi ng and resources, school safety, math-ematics and science course offerings, and teacher support.
Translation and Verifi cation
The TIMSS data collection instruments were prepared in English and translated into 34 languages. Of the 49 countries and four benchmark-ing participants, 17 collected data in two languages and one country, Egypt, in three languages – Arabic, English, and French. In addition to translation, it sometimes was necessary to modify the international versions for cultural reasons, even in the countries that tested wholly or partly in English. This process represented an enormous effort for the national centers, with many checks along the way. The translation effort included (1) developing explicit guidelines for translation and cultural adaptation; (2) translation of the instruments by the national centers in accordance with the guidelines, using two or more inde-pendent translations; (3) consultation with subject-matter experts on cultural adaptations to ensure that the meaning and diffi culty of items did not change; (4) verifi cation of translation quality by professional translators from an independent translation company; (5) corrections by the national centers in accordance with the suggestions made; (6) verifi cation by the International Study Center that corrections were made; and (7) a series of statistical checks after the testing to detect items that did not perform comparably across countries.5
5 More details about the translation verifi cation procedures can be found in Chrostowski, S.J. and Malak, B. (2004), “Translation and Cultural Adaptation of the TIMSS 2003 Instruments” in M.O. Martin, I.V.S. Mullis, and S.J. Chrostowski (eds.), TIMSS 2003 Technical Report, Chestnut Hill, MA: Boston College.

TIMSS & PIRLS INTERNATIONAL STUDY CENTER, LYNCH SCHOOL OF EDUCATION, BOSTON COLLEGE 349
APPENDIX A: OVERVIEW OF TIMSS 2003 PROCEDURES: MATHEMATICS ACHIEVEMENT
Population Defi nition and Sampling
Since it is a curriculum-based study, TIMSS 2003 had as its intended target population all students at the end of their eighth and fourth years of formal schooling in the participating countries. However, for comparability with previous TIMSS assessments, the formal defi nition for the eighth grade specifi ed all students enrolled in the upper of the two adjacent grades that contained the largest proportion of 13-year-old students at the time of testing, and for fourth grade, all students enrolled in the upper of the two adjacent grades that contained the largest proportion of 9-year-olds. These correspond to the eighth and fourth grades in practically every country.6
The selection of valid and efficient samples is crucial to the quality and success of an international comparative study such as TIMSS. The accuracy of the survey results depends on the quality of sampling information and that of the sampling activities themselves. For TIMSS, NRCs worked on all phases of sampling with the TIMSS sampling experts from Statistics Canada and the IEA Data Process-ing Center (DPC). NRCs received training in how to select the school and student samples and in the use of the sampling software. In con-sultation with the TIMSS sampling referee (Keith Rust, Westat, Inc.), the TIMSS sampling experts reviewed the national sampling plans, sampling data, sampling frames, and sample execution. The sampling documentation was used by the TIMSS & PIRLS International Study Center, in consultation with the sampling experts and the sampling referee, to evaluate the quality of the samples.
In a few situations where it was not possible to test the entire internationally desired population (all students enrolled in the upper of the two adjacent grades that contained the largest proportion of 13-year-old or 9-year-old students at the time of testing), countries were permitted to defi ne a national desired population that excluded part of the internationally desired population. Exhibit A.6 shows any dif-ferences in coverage between the international and national desired
6 The sample design for TIMSS is described in detail in Foy, P., and Joncas, M. (2004), “TIMSS 2003 Sampling Design” in M.O. Martin, I.V.S. Mullis and S.J. Chrostowski (eds.), TIMSS 2003 Technical Report, Chestnut Hill, MA: Boston College.

TIMSS & PIRLS INTERNATIONAL STUDY CENTER, LYNCH SCHOOL OF EDUCATION, BOSTON COLLEGE350
APPENDIX A: OVERVIEW OF TIMSS 2003 PROCEDURES: MATHEMATICS ACHIEVEMENT
populations for eighth and fourth grades. Almost all participants at the eighth grade achieved 100 percent coverage (47 out of 51), with Indo-nesia, Lithuania, Morocco, and Serbia the exceptions. Consequently, the results for these countries are annotated in exhibits in this report. At fourth grade, only Lithuania of the 29 participants had less than 100 percent coverage.
Within the desired population, countries could defi ne a popula-tion that excluded a small percentage (less than 5%) of certain kinds of schools or students that would be very diffi cult or resource-intensive to test (e.g., schools for students with special needs or schools that were very small or located in extremely rural areas). Countries excluding more than 10 percent of their population are annotated in the exhibits in this report. Exhibit A.6 shows that only three countries exceeded the 10 percent limit at eighth grade (Israel, Macedonia, and Syria) and no fourth-grade participant did so.
Within countries, TIMSS used a two-stage sample design, in which the fi rst stage involved selecting about 150 public and private schools in each country. Within each school, countries were to use random procedures to select one eighth-grade mathematics class (for eighth-grade participants) and one fourth-grade classroom (fourth-grade participants). All of the students in the sampled class were to participate in the TIMSS testing. This approach was designed to yield a representative sample of at least 4,000 students per country at each grade level. Typically, between 1,200 and 2,000 students responded to each achievement item in each country, depending on the booklets in which the items appeared.
Exhibits A.7 and A.8 present achieved sample sizes for schools and students, respectively, for participating countries. Exhibit A.9 shows the participation rates for schools, students, and overall, both with and without the use of replacement schools. Most countries achieved the minimum acceptable participation rates – 85 percent of both the schools and students, or a combined rate (the product of school and student participation) of 75 percent – although Hong Kong SAR,

TIMSS & PIRLS INTERNATIONAL STUDY CENTER, LYNCH SCHOOL OF EDUCATION, BOSTON COLLEGE 351
APPENDIX A: OVERVIEW OF TIMSS 2003 PROCEDURES: MATHEMATICS ACHIEVEMENT
the Netherlands, and Scotland did so only after including replacement schools. The United States and Morocco had overall participation rates after including replacement schools of just below 75 percent (73% and 71%, respectively), and were annotated accordingly. Despite extraor-dinary efforts to secure full participation, England’s participation fell below the minimum requirement of 50 percent, and so their results were annotated and placed below a line in exhibits showing achieve-ment. Because of scheduling diffi culties, Korea was unable to test its eighth-grade students in May 2003 as planned. Instead, the students were tested in September 2003, when they had moved into the ninth grade. The results for Korea are annotated accordingly in exhibits in this report. At fourth grade, all participants achieved the minimum acceptable participation rates, although Australia, England, Hong Kong SAR, the Netherlands, Scotland, and the United States did so only after including replacement schools.
Whereas countries achieved a high degree of compliance with sampling guidelines in 2003, occasionally countries’ data were omitted from exhibits dealing with trends from earlier assessments because of comparability issues. Because of differences in population cover-age, 1999 eighth-grade data for Australia, Morocco, and Slovenia and fourth-grade data for Italy are not shown in this report. Israel, Italy, and South Africa, experienced diffi culties with sampling at the classroom level in 1995; consequently their eighth-grade data from that assess-ment are not shown in this report.

SOU
RCE:
IEA
's T
rend
s in
Inte
rnat
iona
l Mat
hem
atic
s an
d Sc
ienc
e St
udy
(TIM
SS) 2
003
TIMSS & PIRLS INTERNATIONAL STUDY CENTER, LYNCH SCHOOL OF EDUCATION, BOSTON COLLEGE352
TIMSS2003
Grade88MATHEMATICS
APPENDIX A: OVERVIEW OF TIMSS 2003 PROCEDURES: MATHEMATICS ACHIEVEMENT
Notes on Coverage
Countries
School-LevelExclusions
Within-SampleExclusions
OverallExclusions
National Desired PopulationInternational Desired Population
Coverage
Armenia 100% 2.9% 0.0% 2.9%
Australia 100% 0.4% 0.9% 1.3%
Bahrain 100% 0.0% 0.0% 0.0%
Belgium (Flemish) 100% 3.1% 0.1% 3.2%
Botswana 100% 0.8% 2.2% 3.0%
Bulgaria 100% 0.5% 0.0% 0.5%
Chile 100% 1.6% 0.7% 2.2%
Chinese Taipei 100% 0.2% 4.6% 4.8%
Cyprus 100% 1.1% 1.5% 2.5%
Egypt 100% 3.4% 0.0% 3.4%
England 100% 2.1% 0.0% 2.1%
Estonia 100% 2.6% 0.8% 3.4%
Ghana 100% 0.9% 0.0% 0.9%
Hong Kong, SAR 100% 3.3% 0.1% 3.4%
Hungary 100% 5.5% 3.2% 8.5%
Indonesia 80% Non-Islamic schools 0.1% 0.3% 0.4%
Iran, Islamic Rep. of 100% 5.5% 1.1% 6.5%
Israel 100% 15.2% 8.6% 22.5%
Italy 100% 0.0% 3.6% 3.6%
Japan 100% 0.5% 0.1% 0.6%
Jordan 100% 0.5% 0.8% 1.3%
Korea, Rep. of 100% 1.5% 3.4% 4.9%
Latvia 100% 3.6% 0.1% 3.7%
Lebanon 100% 1.4% 0.0% 1.4%
Lithuania 89% Students taught in Lithuanian 1.4% 1.2% 2.6%
Macedonia, Rep. of 100% 12.5% 0.0% 12.5%
Malaysia 100% 4.0% 0.0% 4.0%
Moldova, Rep. of 100% 0.7% 0.5% 1.2%
Morocco 69% All students but Souss Massa Draa, Casablanca, Gharb-Chrarda 1.5% 0.0% 1.5%
Netherlands 100% 3.0% 0.0% 3.0%
New Zealand 100% 1.7% 2.7% 4.4%
Norway 100% 0.9% 1.5% 2.3%
Palestinian Nat'l Auth. 100% 0.2% 0.3% 0.5%
Philippines 100% 1.5% 0.0% 1.5%
Romania 100% 0.4% 0.1% 0.5%
Russian Federation 100% 1.7% 3.9% 5.5%
Saudi Arabia 100% 0.3% 0.2% 0.5%
Scotland 100% 0.0% 0.0% 0.0%
Serbia 81% 2.4% 0.6% 2.9%
Singapore 100% 0.0% 0.0% 0.0%
Slovak Republic 100% 5.0% 0.0% 5.0%
Slovenia 100% 1.3% 0.1% 1.4%
South Africa 100% 0.6% 0.0% 0.6%
Sweden 100% 0.3% 2.5% 2.8%
Syrian Arab Republic 100% 18.7% 0.0% 18.8%
Tunisia 100% 1.8% 0.0% 1.8%
United States 100% 0.0% 4.9% 4.9%
Benchmarking Participants
Basque Region, Spain 100% 2.1% 3.8% 5.8%
Indiana State, US 0.0% 7.8% 7.8%
Ontario Province, Can. 100% 1.0% 5.0% 6.0%
Quebec Province, Can. 100% 1.4% 3.5% 4.8%
Serbia without Kosovo
100%
Exhibit A.6: Coverage of TIMSS 2003 Target Population
SOU
RCE:
IEA
's T
rend
s in
Inte
rnat
iona
l Mat
hem
atic
s an
d Sc
ienc
e St
udy
(TIM
SS) 2
003
APPENDIX A: OVERVIEW OF TIMSS 2003 PROCEDURES: MATHEMATICS ACHIEVEMENT TIMSS2003
GradeMATHEMATICS44
TIMSS & PIRLS INTERNATIONAL STUDY CENTER, LYNCH SCHOOL OF EDUCATION, BOSTON COLLEGE 353
Notes on Coverage
Armenia 100% 2.9% 0.0% 2.9%
Australia 100% 1.2% 1.6% 2.7%
Belgium (Flemish) 100% 5.9% 0.4% 6.3%
Chinese Taipei 100% 0.3% 2.8% 3.1%
Cyprus 100% 1.5% 1.4% 2.9%
England 100% 1.9% 0.0% 1.9%
Hong Kong, SAR 100% 3.7% 0.1% 3.8%
Hungary 100% 4.4% 3.9% 8.1%
Iran, Islamic Rep. of 100% 3.6% 2.1% 5.7%
Italy 100% 0.1% 4.1% 4.2%
Japan 100% 0.4% 0.3% 0.8%
Latvia 100% 4.3% 0.1% 4.4%
Lithuania 92% Students taught in Lithuanian 2.1% 2.6% 4.6%
Moldova, Rep. of 100% 2.0% 1.6% 3.6%
Morocco 100% 2.2% 0.0% 2.2%
Netherlands 100% 4.1% 1.1% 5.2%
New Zealand 100% 1.5% 2.5% 4.0%
Norway 100% 1.7% 2.7% 4.4%
Philippines 100% 3.8% 0.7% 4.5%
Russian Federation 100% 2.2% 4.7% 6.8%
Scotland 100% 1.5% 0.0% 1.5%
Singapore 100% 0.0% 0.0% 0.0%
Slovenia 100% 0.8% 0.5% 1.3%
Tunisia 100% 0.9% 0.0% 0.9%
United States 100% 0.0% 5.1% 5.1%
Yemen 100% 0.6% 8.9% 9.5%
Benchmarking Participants
Indiana State, US 100% 0.0% 7.2% 7.2%
Ontario Province, Can. 100% 1.3% 3.5% 4.8%
Quebec Province, Can. 100% 2.7% 0.9% 3.6%
Countries
International Desired Population
Coverage
National Desired Population
School-LevelExclusions
Within-SampleExclusions
OverallExclusions
Exhibit A.6: Coverage of TIMSS 2003 Target Population

SOU
RCE:
IEA
's T
rend
s in
Inte
rnat
iona
l Mat
hem
atic
s an
d Sc
ienc
e St
udy
(TIM
SS) 2
003
TIMSS & PIRLS INTERNATIONAL STUDY CENTER, LYNCH SCHOOL OF EDUCATION, BOSTON COLLEGE354
TIMSS2003
Grade88MATHEMATICS
APPENDIX A: OVERVIEW OF TIMSS 2003 PROCEDURES: MATHEMATICS ACHIEVEMENT
Exhibit A.7:
Countries Number of Schoolsin Original Sample
Number of EligibleSchools in Original
Sample
Number of Schoolsin Original Samplethat Participated
Number ofReplacement Schools
that Participated
Total Number ofSchools thatParticipated
Armenia 150 150 149 0 149
Australia 230 226 186 21 207
Bahrain 67 67 67 0 67
Belgium (Flemish) 150 150 122 26 148
Botswana 152 150 146 0 146
Bulgaria 170 169 163 1 164
Chile 195 195 191 4 195
Chinese Taipei 150 150 150 0 150
Cyprus 59 59 59 0 59
Egypt 217 217 215 2 217
England 160 160 62 25 87
Estonia 154 152 151 0 151
Ghana 150 150 150 0 150
Hong Kong, SAR 150 150 112 13 125
Hungary 160 157 154 1 155
Indonesia 150 150 148 2 150
Iran, Islamic Rep. of 188 181 181 0 181
Israel 150 147 143 3 146
Italy 172 171 164 7 171
Japan 150 150 146 0 146
Jordan 150 140 140 0 140
Korea, Rep. of 151 150 149 0 149
Latvia 150 149 137 3 140
Lebanon 160 160 148 4 152
Lithuania 150 150 137 6 143
Macedonia, Rep. of 150 150 142 7 149
Malaysia 150 150 150 0 150
Moldova, Rep. of 150 149 147 2 149
Morocco 227 165 131 0 131
Netherlands 150 150 118 12 130
New Zealand 175 174 149 20 169
Norway 150 150 138 0 138
Palestinian Nat'l Auth. 150 145 145 0 145
Philippines 160 160 132 5 137
Romania 150 149 148 0 148
Russian Federation 216 216 214 0 214
Saudi Arabia 160 160 154 1 155
Scotland 150 150 115 13 128
Serbia 150 150 149 0 149
Singapore 164 164 164 0 164
Slovak Republic 180 179 170 9 179
Slovenia 177 177 169 5 174
South Africa 265 265 241 14 255
Sweden 160 160 155 4 159
Syrian Arab Republic 150 150 121 13 134
Tunisia 150 150 150 0 150
United States 301 296 211 21 232
Benchmarking Participants
Basque Region, Spain 120 120 119 1 120
Indiana State, US 56 56 54 0 54
Ontario Province, Can. 200 196 171 15 186
Quebec Province, Can. 199 185 173 2 175
School Sample Sizes

SOU
RCE:
IEA
's T
rend
s in
Inte
rnat
iona
l Mat
hem
atic
s an
d Sc
ienc
e St
udy
(TIM
SS) 2
003
APPENDIX A: OVERVIEW OF TIMSS 2003 PROCEDURES: MATHEMATICS ACHIEVEMENT TIMSS2003
GradeMATHEMATICS44
TIMSS & PIRLS INTERNATIONAL STUDY CENTER, LYNCH SCHOOL OF EDUCATION, BOSTON COLLEGE 355
Exhibit A.7:
Countries Number of Schoolsin Original Sample
Number of EligibleSchools in Original
Sample
Number of Schoolsin Original Samplethat Participated
Number ofReplacement Schools
that Participated
Total Number ofSchools thatParticipated
Armenia 150 150 148 0 148
Australia 230 227 178 26 204
Belgium (Flemish) 150 150 133 16 149
Chinese Taipei 150 150 150 0 150
Cyprus 150 150 150 0 150
England 150 150 79 44 123
Hong Kong, SAR 150 150 116 16 132
Hungary 160 159 156 1 157
Iran, Islamic Rep. of 176 171 171 0 171
Italy 172 171 165 6 171
Japan 150 150 150 0 150
Latvia 150 149 137 3 140
Lithuania 160 160 147 6 153
Moldova, Rep. of 153 151 147 4 151
Morocco 227 225 197 0 197
Netherlands 150 149 77 53 130
New Zealand 228 228 194 26 220
Norway 150 150 134 5 139
Philippines 160 160 122 13 135
Russian Federation 206 205 204 1 205
Scotland 150 150 94 31 125
Singapore 182 182 182 0 182
Slovenia 177 177 169 5 174
Tunisia 150 150 150 0 150
United States 310 300 212 36 248
Yemen 150 150 150 0 150
Benchmarking Participants
Indiana State, US 56 56 56 0 56
Ontario Province, Can. 200 196 179 10 189
Quebec Province, Can. 198 194 192 1 193
School Sample Sizes

SOU
RCE:
IEA
's T
rend
s in
Inte
rnat
iona
l Mat
hem
atic
s an
d Sc
ienc
e St
udy
(TIM
SS) 2
003
TIMSS & PIRLS INTERNATIONAL STUDY CENTER, LYNCH SCHOOL OF EDUCATION, BOSTON COLLEGE356
TIMSS2003
Grade88MATHEMATICS
APPENDIX A: OVERVIEW OF TIMSS 2003 PROCEDURES: MATHEMATICS ACHIEVEMENT
Exhibit A.8: Student Sample Sizes
Countries
Within-SchoolStudent
Participation(Weighted
Percentage)
Number ofSampled
Students inParticipating
Schools
Number ofStudents
Withdrawnfrom
Class/School
Number ofStudentsExcluded
Number ofEligible
Students
Number ofStudentsAbsent
Number ofStudentsAssessed
Armenia 90% 6388 56 0 6332 606 5726
Australia 93% 5286 60 16 5210 419 4791
Bahrain 98% 4351 64 0 4287 88 4199
Belgium (Flemish) 97% 5161 19 7 5135 165 4970
Botswana 98% 5388 70 70 5248 98 5150
Bulgaria 96% 4489 167 0 4322 205 4117
Chile 99% 6528 15 39 6474 97 6377
Chinese Taipei 99% 5525 54 37 5434 55 5379
Cyprus 96% 4314 79 66 4169 167 4002
Egypt 97% 7259 0 0 7259 164 7095
England 86% 3360 34 0 3326 496 2830
Estonia 96% 4242 28 5 4209 169 4040
Ghana 93% 5690 189 0 5501 401 5100
Hong Kong, SAR 97% 5204 33 4 5167 195 4972
Hungary 95% 3506 7 34 3465 163 3302
Indonesia 99% 5884 61 0 5823 61 5762
Iran, Islamic Rep. of 98% 5215 118 52 5045 103 4942
Israel 95% 4880 2 319 4559 241 4318
Italy 97% 4628 35 173 4420 142 4278
Japan 96% 5121 51 5 5065 209 4856
Jordan 96% 4871 176 41 4654 165 4489
Korea, Rep. of 99% 5451 18 50 5383 74 5309
Latvia 89% 4146 23 5 4118 488 3630
Lebanon 96% 4030 64 0 3966 152 3814
Lithuania 89% 6619 58 955 5606 642 4964
Macedonia, Rep. of 97% 4028 0 0 4028 135 3893
Malaysia 98% 5464 46 0 5418 104 5314
Moldova, Rep. of 96% 4262 58 0 4204 171 4033
Morocco 91% 3243 25 0 3218 275 2943
Netherlands 94% 3283 2 0 3281 216 3065
New Zealand 93% 4343 170 65 4108 307 3801
Norway 92% 4569 24 61 4484 351 4133
Palestinian Nat'l Auth. 99% 5543 117 14 5412 55 5357
Philippines 96% 7498 288 0 7210 293 6917
Romania 98% 4249 53 4 4192 88 4104
Russian Federation 97% 4926 50 62 4814 147 4667
Saudi Arabia 97% 4553 115 5 4433 138 4295
Scotland 89% 3962 24 0 3938 422 3516
Serbia 96% 4514 52 2 4460 164 4296
Singapore 97% 6236 5 0 6231 213 6018
Slovak Republic 95% 4428 16 0 4412 197 4215
Slovenia 93% 3883 19 2 3862 284 3578
South Africa 92% 9905 320 0 9585 633 8952
Sweden 89% 4941 58 93 4790 534 4256
Syrian Arab Republic 98% 5001 0 1 5000 105 4895
Tunisia 98% 5106 74 0 5032 101 4931
United States 94% 9891 90 279 9522 610 8912
Benchmarking Participants
Basque Region, Spain 98% 2736 41 113 2582 68 2514
Indiana State, US 97% 2402 43 107 2252 64 2188
Ontario Province, Can. 95% 4693 59 208 4426 209 4217
Quebec Province, Can. 92% 4919 78 46 4795 384 4411

SOU
RCE:
IEA
's T
rend
s in
Inte
rnat
iona
l Mat
hem
atic
s an
d Sc
ienc
e St
udy
(TIM
SS) 2
003
APPENDIX A: OVERVIEW OF TIMSS 2003 PROCEDURES: MATHEMATICS ACHIEVEMENT TIMSS2003
GradeMATHEMATICS44
TIMSS & PIRLS INTERNATIONAL STUDY CENTER, LYNCH SCHOOL OF EDUCATION, BOSTON COLLEGE 357
Exhibit A.8:
Countries
Within-SchoolStudent
Participation(Weighted
Percentage)
Number ofSampled
Students inParticipating
Schools
Number ofStudents
Withdrawnfrom
Class/School
Number ofStudentsExcluded
Number ofEligible
Students
Number ofStudentsAbsent
Number ofStudentsAssessed
Armenia 91% 6275 57 0 6218 544 5674
Australia 94% 4675 69 39 4567 246 4321
Belgium (Flemish) 98% 4866 17 20 4829 117 4712
Chinese Taipei 99% 4793 11 88 4694 33 4661
Cyprus 97% 4536 27 60 4449 121 4328
England 93% 3917 45 0 3872 287 3585
Hong Kong, SAR 95% 4901 23 4 4874 266 4608
Hungary 94% 3603 11 67 3525 206 3319
Iran, Islamic Rep. of 98% 4587 83 80 4424 72 4352
Italy 97% 4641 23 185 4433 151 4282
Japan 97% 4690 16 16 4658 123 4535
Latvia 94% 3980 16 4 3960 273 3687
Lithuania 92% 5701 35 852 4814 392 4422
Moldova, Rep. of 97% 4162 46 0 4116 135 3981
Morocco 93% 4546 0 0 4546 282 4264
Netherlands 96% 3080 0 30 3050 113 2937
New Zealand 95% 4785 145 107 4533 225 4308
Norway 95% 4706 22 107 4577 235 4342
Philippines 95% 5225 40 31 5154 582 4572
Russian Federation 97% 4229 54 66 4109 146 3963
Scotland 92% 4283 34 0 4249 313 3936
Singapore 98% 6851 16 0 6835 167 6668
Slovenia 92% 3410 13 17 3380 254 3126
Tunisia 99% 4408 23 0 4385 51 4334
United States 95% 10795 49 429 10317 488 9829
Yemen 93% 4550 0 0 4550 345 4205
Benchmarking Participants
Indiana State, US 98% 2472 44 151 2277 44 2233
Ontario Province, Can. 96% 4813 91 158 4564 202 4362
Quebec Province, Can. 91% 4864 51 73 4740 390 4350
Student Sample Sizes

SOU
RCE:
IEA
's T
rend
s in
Inte
rnat
iona
l Mat
hem
atic
s an
d Sc
ienc
e St
udy
(TIM
SS) 2
003
TIMSS & PIRLS INTERNATIONAL STUDY CENTER, LYNCH SCHOOL OF EDUCATION, BOSTON COLLEGE358
TIMSS2003
Grade88MATHEMATICS
APPENDIX A: OVERVIEW OF TIMSS 2003 PROCEDURES: MATHEMATICS ACHIEVEMENT
Exhibit A.9:
BeforeReplacement
AfterReplacement
BeforeReplacement
AfterReplacement
Armenia 99% 99% 99% 90% 89% 89%
Australia 81% 90% 100% 93% 75% 83%
Bahrain 100% 100% 100% 98% 98% 98%
Belgium (Flemish) 82% 99% 98% 97% 77% 94%
Botswana 98% 98% 100% 98% 96% 96%
Bulgaria 97% 97% 99% 96% 92% 92%
Chile 98% 100% 100% 99% 97% 99%
Chinese Taipei 100% 100% 100% 99% 99% 99%
Cyprus 100% 100% 100% 96% 96% 96%
Egypt 99% 100% 100% 97% 97% 97%
England 40% 54% 99% 86% 34% 46%
Estonia 99% 99% 100% 96% 95% 95%
Ghana 100% 100% 100% 93% 93% 93%
Hong Kong, SAR 74% 83% 99% 97% 72% 80%
Hungary 98% 99% 100% 95% 94% 94%
Indonesia 98% 100% 100% 99% 97% 99%
Iran, Islamic Rep. of 100% 100% 100% 98% 98% 98%
Israel 98% 99% 100% 95% 93% 94%
Italy 96% 100% 100% 97% 93% 97%
Japan 97% 97% 100% 96% 93% 93%
Jordan 100% 100% 100% 96% 96% 96%
Korea, Rep. of 99% 99% 100% 99% 98% 98%
Latvia 92% 94% 100% 89% 81% 83%
Lebanon 93% 95% 100% 96% 89% 91%
Lithuania 92% 95% 100% 89% 81% 84%
Macedonia, Rep. of 94% 99% 100% 97% 91% 96%
Malaysia 100% 100% 100% 98% 98% 98%
Moldova, Rep. of 99% 100% 100% 96% 95% 96%
Morocco 79% 79% 100% 91% 71% 71%
Netherlands 79% 87% 100% 94% 74% 81%
New Zealand 86% 97% 100% 93% 80% 90%
Norway 92% 92% 100% 92% 85% 85%
Palestinian Nat'l Auth. 100% 100% 100% 99% 99% 99%
Philippines 81% 86% 100% 96% 78% 82%
Romania 99% 99% 100% 98% 98% 98%
Russian Federation 99% 99% 100% 97% 96% 96%
Saudi Arabia 95% 97% 100% 97% 93% 94%
Scotland 76% 85% 100% 89% 68% 76%
Serbia 99% 99% 100% 96% 96% 96%
Singapore 100% 100% 100% 97% 97% 97%
Slovak Republic 96% 100% 100% 95% 91% 95%
Slovenia 94% 99% 100% 93% 87% 91%
South Africa 89% 96% 100% 92% 82% 88%
Sweden 97% 99% 99% 89% 85% 87%
Syrian Arab Republic 81% 89% 100% 98% 79% 87%
Tunisia 100% 100% 100% 98% 98% 98%
United States 71% 78% 99% 94% 66% 73%
Benchmarking Participants
Basque Region, Spain 100% 100% 100% 98% 97% 98%
Indiana State, US 97% 97% 100% 97% 94% 94%
Ontario Province, Can. 84% 93% 100% 95% 80% 89%
Quebec Province, Can. 91% 93% 100% 92% 84% 85%
Countries
Overall Participation
StudentParticipation
School Participation
ClassParticipation
Participation Rates (Weighted)

SOU
RCE:
IEA
's T
rend
s in
Inte
rnat
iona
l Mat
hem
atic
s an
d Sc
ienc
e St
udy
(TIM
SS) 2
003
APPENDIX A: OVERVIEW OF TIMSS 2003 PROCEDURES: MATHEMATICS ACHIEVEMENT TIMSS2003
GradeMATHEMATICS44
TIMSS & PIRLS INTERNATIONAL STUDY CENTER, LYNCH SCHOOL OF EDUCATION, BOSTON COLLEGE 359
Exhibit A.9:
BeforeReplacement
AfterReplacement
BeforeReplacement
AfterReplacement
Armenia 99% 99% 100% 91% 90% 90%
Australia 78% 90% 100% 94% 73% 85%
Belgium (Flemish) 89% 99% 100% 98% 87% 97%
Chinese Taipei 100% 100% 100% 99% 99% 99%
Cyprus 100% 100% 100% 97% 97% 97%
England 54% 82% 100% 93% 50% 76%
Hong Kong, SAR 77% 88% 99% 95% 73% 83%
Hungary 98% 99% 100% 94% 92% 93%
Iran, Islamic Rep. of 100% 100% 100% 98% 98% 98%
Italy 97% 100% 100% 97% 93% 97%
Japan 100% 100% 100% 97% 97% 97%
Latvia 91% 94% 100% 94% 85% 88%
Lithuania 92% 96% 99% 92% 84% 87%
Moldova, Rep. of 97% 100% 100% 97% 94% 97%
Morocco 87% 87% 100% 93% 81% 81%
Netherlands 52% 87% 100% 96% 50% 84%
New Zealand 87% 98% 100% 95% 82% 93%
Norway 89% 93% 100% 95% 85% 88%
Philippines 78% 85% 100% 95% 75% 81%
Russian Federation 99% 100% 100% 97% 96% 97%
Scotland 64% 83% 100% 92% 59% 77%
Singapore 100% 100% 100% 98% 98% 98%
Slovenia 95% 99% 100% 92% 87% 91%
Tunisia 100% 100% 100% 99% 99% 99%
United States 70% 82% 99% 95% 66% 78%
Yemen 100% 100% 100% 93% 93% 93%
Benchmarking Participants
Indiana State, US 100% 100% 100% 98% 98% 98%
Ontario Province, Can. 89% 94% 100% 96% 85% 90%
Quebec Province, Can. 99% 100% 100% 91% 90% 91%
Countries
Overall Participation
StudentParticipation
School Participation
ClassParticipation
Participation Rates (Weighted)

TIMSS & PIRLS INTERNATIONAL STUDY CENTER, LYNCH SCHOOL OF EDUCATION, BOSTON COLLEGE360
APPENDIX A: OVERVIEW OF TIMSS 2003 PROCEDURES: MATHEMATICS ACHIEVEMENT
Data Collection
Each participating country was responsible for carrying out all aspects of the data collection, using standardized procedures developed for the study. Training manuals were created for school coordinators and test administrators that explained procedures for receipt and distribution of materials as well as for the activities related to the testing sessions. These manuals covered procedures for test security, standardized scripts to regulate directions and timing, rules for answering students’ ques-tions, and steps to ensure that identifi cation on the test booklets and questionnaires corresponded to the information on the forms used to track students.7
Each country was responsible for conducting quality control procedures and describing this effort in the NRC’s report documenting procedures used in the study. In addition, the TIMSS & PIRLS Interna-tional Study Center considered it essential to monitor compliance with standardized procedures. NRCs were asked to nominate one or more persons unconnected with their national center to serve as quality control monitors for their countries. The International Study Center developed manuals for the monitors and briefed them in two-day train-ing sessions about TIMSS, the responsibilities of the national centers in conducting the study, and their roles and responsibilities.
In all, 50 quality control monitors drawn from the 49 coun-tries and four benchmarking participants participated in the training.8 Where necessary, quality control monitors who attended the train-ing session were permitted to recruit other monitors to assist them in covering the territory and meeting the testing timetable. All together, the international quality control monitors and those trained by them observed 1,147 testing sessions (755 for grade 8 and 392 for grade 4),9 and conducted interviews with the National Research Coordinator in each of the participating countries.10
The results of the interviews indicate that, in general, NRCs had prepared well for data collection and, despite the heavy demands
7 Data collection procedures for TIMSS is described in detail in Barth, J., Gonzalez, E.J., and Neuschmidt, O. (2004), “TIMSS 2003 Survey Opera-tions Procedures” in M.O. Martin, I.V.S. Mullis and S.J. Chrostowski (eds.), TIMSS 2003 Technical Report, Chestnut Hill, MA: Boston College.
8 Iran and Israel were the only countries whose quality control monitors were not trained; Ontario and Quebec shared the same quality control monitor.
9 Operational constraints prevented quality control monitor visits in fi ve testing sessions in Japan.
10 Steps taken to ensure high-quality data collection in TIMSS are described in detail in Gonzalez, E.J. and Diaconu, D. (2004), “Quality Assur-ance in the TIMSS 2003 Data Collection” in M.O. Martin, I.V.S. Mullis, and S.J. Chrostowski (eds.), TIMSS 2003 Technical Report, Chestnut Hill, MA: Boston College.

TIMSS & PIRLS INTERNATIONAL STUDY CENTER, LYNCH SCHOOL OF EDUCATION, BOSTON COLLEGE 361
APPENDIX A: OVERVIEW OF TIMSS 2003 PROCEDURES: MATHEMATICS ACHIEVEMENT
of the schedule and shortages of resources, were able to conduct the data collection effi ciently and professionally. Similarly, the TIMSS tests appeared to have been administered in compliance with international procedures, including the activities before the testing session, those during testing, and the school-level activities related to receiving, dis-tributing, and returning material from the national centers.
Scoring the Constructed-Response Items
Because 40 to 50 percent of the test time was devoted to constructed-response items, TIMSS needed to develop procedures for reliably eval-uating student responses within and across countries. Scoring used two-digit codes with rubrics specifi c to each item. The fi rst digit des-ignates the correctness level of the response. The second digit, com-bined with the fi rst, represents a diagnostic code identifying specifi c types of approaches, strategies, or common errors and misconceptions. Although not used in this report, analyses of responses based on the second digit should provide insight into ways to help students better understand mathematics concepts and problem-solving approaches.
To ensure reliable scoring procedures based on the TIMSS rubrics, the International Study Center prepared detailed guides containing the rubrics and explanations of how to implement them, together with example student responses for the various rubric categories. These guides, along with training packets containing extensive examples of student responses for practice in applying the rubrics, were used as a basis for intensive training in scoring the constructed-response items. The training sessions were designed to help representatives of national centers who would then be responsible for training personnel in their countries to apply the two-digit codes reliably.
To gather and document empirical information about the within-country agreement among scorers, TIMSS arranged to have systematic samples of at least 100 student responses to each item scored indepen-dently by two readers. Exhibit A.10 shows the average and range of

SOU
RCE:
IEA
's T
rend
s in
Inte
rnat
iona
l Mat
hem
atic
s an
d Sc
ienc
e St
udy
(TIM
SS) 2
003
TIMSS & PIRLS INTERNATIONAL STUDY CENTER, LYNCH SCHOOL OF EDUCATION, BOSTON COLLEGE362
TIMSS2003
Grade88MATHEMATICS
APPENDIX A: OVERVIEW OF TIMSS 2003 PROCEDURES: MATHEMATICS ACHIEVEMENT
Exhibit A.10:
Armenia 99 94 100 98 92 100
Australia 100 97 100 99 95 100
Bahrain 99 98 100 98 91 100
Belgium (Flemish) 99 96 100 98 91 100
Botswana 99 91 100 94 81 100
Bulgaria 96 70 100 92 64 99
Chile 99 95 100 97 91 100
Chinese Taipei 100 91 100 99 91 100
Cyprus 98 86 100 96 79 100
Egypt 100 97 100 99 97 100
England 99 93 100 98 91 100
Estonia 100 98 100 99 96 100
Ghana 99 97 100 95 90 99
Hong Kong, SAR 100 98 100 99 98 100
Hungary 98 90 100 96 80 100
Indonesia 98 90 100 94 82 100
Iran, Islamic Rep. of 99 94 100 96 90 100
Israel 98 93 100 93 83 99
Italy 99 95 100 98 92 100
Japan 99 94 100 98 91 100
Jordan 99 98 100 98 92 100
Korea, Rep. of 99 87 100 98 87 100
Latvia 98 90 100 96 79 100
Lebanon 100 94 100 99 91 100
Lithuania 97 71 100 95 62 100
Macedonia, Rep. of 100 97 100 99 95 100
Malaysia 100 98 100 99 97 100
Moldova, Rep. of 100 99 100 100 99 100
Morocco 97 89 100 92 82 99
Netherlands 97 84 100 95 78 100
New Zealand 99 96 100 97 88 100
Norway 98 91 100 96 86 100
Palestinian Nat'l Auth. 99 94 100 97 88 100
Philippines 99 97 100 97 92 100
Romania 100 98 100 99 94 100
Russian Federation 99 95 100 97 89 100
Saudi Arabia 99 94 100 95 81 99
Scotland 99 95 100 98 92 100
Serbia 99 96 100 98 94 100
Singapore 100 98 100 100 98 100
Slovak Republic 100 98 100 99 96 100
Slovenia 97 86 100 94 75 100
South Africa 99 95 100 97 90 99
Sweden 98 89 100 95 84 99
Tunisia 98 89 100 95 78 99
United States 97 86 100 94 75 99
International Avg. 99 92 100 97 87 100
Benchmarking Participants
Basque Country, Spain 98 87 100 96 83 100
Indiana State, US 98 88 100 95 76 100
Ontario Province, Can. 97 80 100 93 72 100
Quebec Province, Can. 97 81 100 94 79 100
Countries Average ofExact Percent
AgreementAcross Items Min Max
Range ofExact PercentAgreement
Correctness Score Agreement Diagnostic Score Agreement
Average ofExact PercentAgreement
Across Items Min Max
Range ofExact PercentAgreement
TIMSS 2003 Within-Country Scoring Reliability for the Constructed-Response Mathematics Items

SOU
RCE:
IEA
's T
rend
s in
Inte
rnat
iona
l Mat
hem
atic
s an
d Sc
ienc
e St
udy
(TIM
SS) 2
003
APPENDIX A: OVERVIEW OF TIMSS 2003 PROCEDURES: MATHEMATICS ACHIEVEMENT TIMSS2003
GradeMATHEMATICS44
TIMSS & PIRLS INTERNATIONAL STUDY CENTER, LYNCH SCHOOL OF EDUCATION, BOSTON COLLEGE 363
Exhibit A.10:
Armenia 99 98 100 98 95 100
Australia 100 98 100 99 97 100
Belgium (Flemish) 100 96 100 98 87 100
Chinese Taipei 99 83 100 97 76 100
Cyprus 98 91 100 95 82 100
England 99 91 100 98 90 100
Hong Kong, SAR 100 98 100 99 87 100
Hungary 98 91 100 95 78 100
Iran, Islamic Rep. of 100 98 100 99 96 100
Italy 98 92 100 96 81 100
Japan 99 95 100 98 94 100
Latvia 98 87 100 96 78 100
Lithuania 97 77 100 94 69 100
Moldova, Rep. of 100 100 100 100 100 100
Morocco 98 93 100 94 86 98
Netherlands 97 86 100 94 73 100
New Zealand 99 94 100 96 85 100
Norway 99 95 100 97 92 100
Philippines 99 96 100 97 91 100
Russian Federation 100 97 100 99 96 100
Scotland 99 98 100 98 93 100
Singapore 100 99 100 100 99 100
Slovenia 98 84 100 96 73 100
Tunisia 97 89 100 91 77 98
United States 97 88 100 95 82 100
International Avg. 99 92 100 97 86 100
Benchmarking Participants
Indiana State, US 99 92 100 96 83 100
Ontario Province, Can. 98 87 100 96 84 100
Quebec Province, Can. 98 92 100 96 86 100
Diagnostic Score Agreement
Average ofExact PercentAgreement
Across Items Min Max
Range ofExact PercentAgreement
Countries Average ofExact Percent
AgreementAcross Items Min Max
Range ofExact PercentAgreement
Correctness Score Agreement
TIMSS 2003 Within-Country Scoring Reliability for the Constructed-Response Mathematics Items

SOU
RCE:
IEA
's T
rend
s in
Inte
rnat
iona
l Mat
hem
atic
s an
d Sc
ienc
e St
udy
(TIM
SS) 2
003
TIMSS & PIRLS INTERNATIONAL STUDY CENTER, LYNCH SCHOOL OF EDUCATION, BOSTON COLLEGE364
TIMSS2003
Grade88MATHEMATICS
APPENDIX A: OVERVIEW OF TIMSS 2003 PROCEDURES: MATHEMATICS ACHIEVEMENT
Exhibit A.11:
Min Max Min Max
Australia 98 88 100 94 73 100
Belgium (Flemish) 98 92 100 94 78 100
Bulgaria 99 82 100 94 71 100
Chile 99 97 100 92 73 100
Chinese Taipei 98 95 100 94 79 100
Cyprus 98 91 100 94 79 100
Hong Kong, SAR 98 91 100 96 84 100
Hungary 98 89 100 95 86 100
Indonesia 98 90 100 93 60 100
Iran, Islamic Rep. 98 83 100 89 24 99
Israel 98 91 100 92 74 100
Italy 99 91 100 97 86 100
Japan 98 87 100 96 76 100
Jordan 99 96 100 96 87 100
Korea, Rep. of 98 88 100 94 67 100
Latvia 90 34 100 78 32 100
Lithuania 98 93 100 94 74 100
Macedonia, Rep. of 99 85 100 96 70 100
Malaysia 99 91 100 95 84 100
New Zealand 99 96 100 94 85 100
Philippines 99 86 100 95 75 100
Romania 99 97 100 97 90 100
Russian Federation 98 94 100 92 62 100
Singapore 99 96 100 98 89 100
Slovak Republic 93 54 100 87 50 99
Slovenia 99 95 100 95 81 100
South Africa 99 92 100 93 47 100
United States 98 91 100 94 76 100
International Avg. 98 88 100 93 72 100
Benchmarking Participants
Ontario Province, Can. 98 85 100 93 65 100
Quebec Province, Can. 98 85 100 93 65 100
Countries
Correctness Score Agreement Diagnostic Score Agreement
Average ofExact Percent
Agreement AcrossItems
Range ofExact PercentAgreement
Range ofExact PercentAgreement
Average ofExact PercentAgreement
Across Items
TIMSS 2003 Trend Scoring Reliability (1999–2003) for the Constructed-Response Mathematics Items

SOU
RCE:
IEA
's T
rend
s in
Inte
rnat
iona
l Mat
hem
atic
s an
d Sc
ienc
e St
udy
(TIM
SS) 2
003
APPENDIX A: OVERVIEW OF TIMSS 2003 PROCEDURES: MATHEMATICS ACHIEVEMENT TIMSS2003
GradeMATHEMATICS
TIMSS & PIRLS INTERNATIONAL STUDY CENTER, LYNCH SCHOOL OF EDUCATION, BOSTON COLLEGE 365
Exhibit A.12: 88TIMSS 2003 Cross-Country Scoring Reliability for the Constructed-Response Mathematics Items
TIMSS & PIRLS INTERNATIONAL STUDY CENTER, LYNCH SCHOOL OF EDUCATION, BOSTON COLLEGE366
APPENDIX A: OVERVIEW OF TIMSS 2003 PROCEDURES: MATHEMATICS ACHIEVEMENT
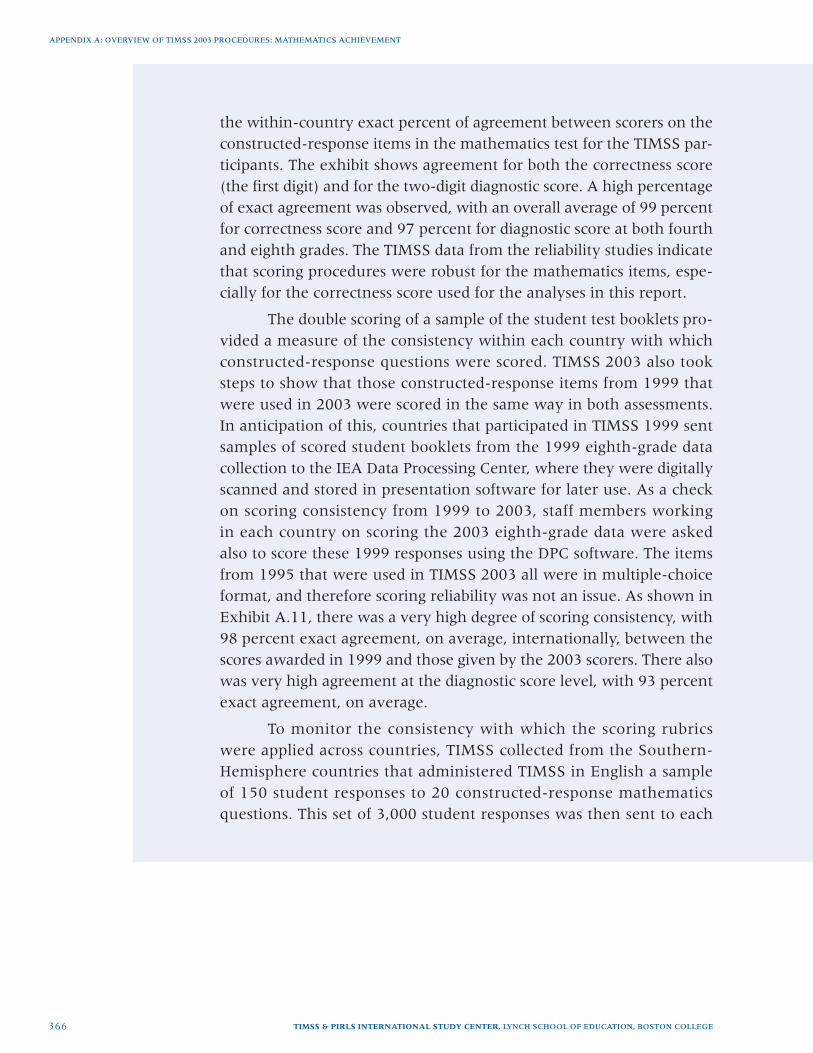
the within-country exact percent of agreement between scorers on the constructed-response items in the mathematics test for the TIMSS par-ticipants. The exhibit shows agreement for both the correctness score (the fi rst digit) and for the two-digit diagnostic score. A high percentage of exact agreement was observed, with an overall average of 99 percent for correctness score and 97 percent for diagnostic score at both fourth and eighth grades. The TIMSS data from the reliability studies indicate that scoring procedures were robust for the mathematics items, espe-cially for the correctness score used for the analyses in this report.
The double scoring of a sample of the student test booklets pro-vided a measure of the consistency within each country with which constructed-response questions were scored. TIMSS 2003 also took steps to show that those constructed-response items from 1999 that were used in 2003 were scored in the same way in both assessments. In anticipation of this, countries that participated in TIMSS 1999 sent samples of scored student booklets from the 1999 eighth-grade data collection to the IEA Data Processing Center, where they were digitally scanned and stored in presentation software for later use. As a check on scoring consistency from 1999 to 2003, staff members working in each country on scoring the 2003 eighth-grade data were asked also to score these 1999 responses using the DPC software. The items from 1995 that were used in TIMSS 2003 all were in multiple-choice format, and therefore scoring reliability was not an issue. As shown in Exhibit A.11, there was a very high degree of scoring consistency, with 98 percent exact agreement, on average, internationally, between the scores awarded in 1999 and those given by the 2003 scorers. There also was very high agreement at the diagnostic score level, with 93 percent exact agreement, on average.
To monitor the consistency with which the scoring rubrics were applied across countries, TIMSS collected from the Southern-Hemisphere countries that administered TIMSS in English a sample of 150 student responses to 20 constructed-response mathematics questions. This set of 3,000 student responses was then sent to each

TIMSS & PIRLS INTERNATIONAL STUDY CENTER, LYNCH SCHOOL OF EDUCATION, BOSTON COLLEGE 367
APPENDIX A: OVERVIEW OF TIMSS 2003 PROCEDURES: MATHEMATICS ACHIEVEMENT
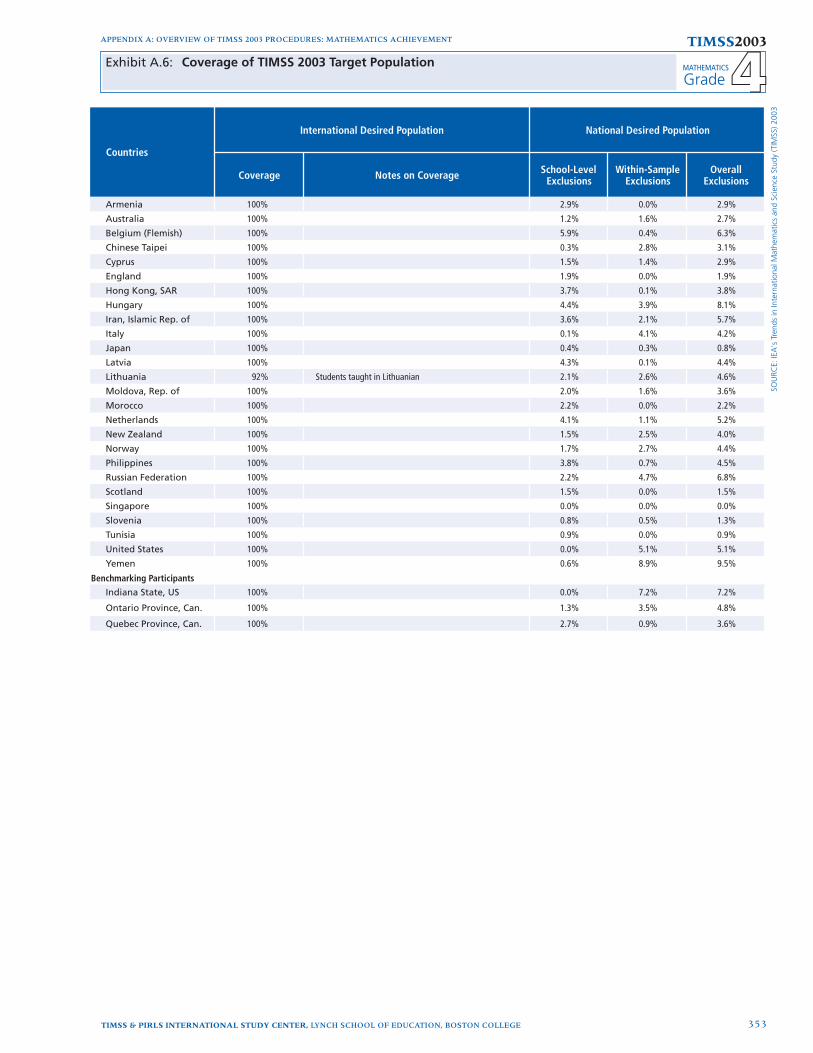
Northern-Hemisphere country having scorers profi cient in English and scored independently by one or, if possible, two of these scorers. Each of the responses was scored by 37 scorers from the countries that participated. Making all possible comparisons among scorers gave 666 comparisons for each student response to each item, and 99,900 total comparisons when aggregated across all 150 student responses to that item. Agreement across countries was defi ned in terms of the percent-age of these comparisons that were in exact agreement. Exhibit A.12 shows that scorer reliability across countries was very high, with the percent exact agreement ranging from 90 percent to 99 percent across the 20 items for the correctness score and from 84 to 99 percent for the diagnostic score.
Test Reliability
Exhibit A.13 displays the mathematics test reliability coeffi cient for each country. This coeffi cient is the median Cronbach's alpha reliabil-ity across the 12 test booklets. At both grade levels, median reliabilities generally were high, with an international median (the median of the reliability coeffi cients for all countries) of 0.89 for eighth grade and 0.87 for fourth grade. Despite the generally high reliabilities, there were some countries with median reliabilities below 0.80, namely Botswana, Ghana, Morocco (both grades), Saudi Arabia, Syria, and Tunisia (both grades).

SOU
RCE:
IEA
's T
rend
s in
Inte
rnat
iona
l Mat
hem
atic
s an
d Sc
ienc
e St
udy
(TIM
SS) 2
003
TIMSS & PIRLS INTERNATIONAL STUDY CENTER, LYNCH SCHOOL OF EDUCATION, BOSTON COLLEGE368
TIMSS2003APPENDIX A: OVERVIEW OF TIMSS 2003 PROCEDURES: MATHEMATICS ACHIEVEMENT
Grades 88MATHEMATICS 44&
Grade 8 Grade 4
Armenia 0.87 0.87
Australia 0.90 0.88
Bahrain 0.82
Belgium (Flemish) 0.90 0.83
Botswana 0.71
Bulgaria 0.90
Chile 0.86
Chinese Taipei 0.94 0.85
Cyprus 0.89 0.89
Egypt 0.86
England 0.90 0.91
Estonia 0.90
Ghana 0.51
Hong Kong, SAR 0.91 0.83
Hungary 0.92 0.88
Indonesia 0.87
Iran, Islamic Rep. of 0.84 0.80
Israel 0.91
Italy 0.89 0.88
Japan 0.92 0.87
Jordan 0.87
Korea, Rep. of 0.93
Latvia 0.90 0.87
Lebanon 0.84
Lithuania 0.90 0.88
Macedonia, Rep. of 0.88
Malaysia 0.90
Moldova, Rep. of 0.87 0.90
Morocco 0.74 0.76
Netherlands 0.90 0.83
New Zealand 0.90 0.88
Norway 0.85 0.87
Palestinian Nat'l Auth. 0.83
Philippines 0.83 0.87
Romania 0.91
Russian Federation 0.90 0.88
Saudi Arabia 0.64
Scotland 0.90 0.88
Serbia 0.91
Singapore 0.92 0.91
Slovak Republic 0.91
Slovenia 0.88 0.87
South Africa 0.85
Sweden 0.89
Syrian Arab Republic 0.72
Tunisia 0.77 0.83
United States 0.90 0.88
Yemen 0.77
International Median 0.89 0.87
Benchmarking Participants
Basque Country, Spain 0.85
Indiana State, US 0.89 0.86
Ontario Province, Can. 0.89 0.87
Quebec Province, Can. 0.87 0.84
Reliability Coefficient1
Countries
1 The reliability coeffi cient for each country is the median Cronbach's alpha reliability across the 12 test booklets.
Exhibit A.13: Cronbach's Alpha Reliability Coeffi cient – TIMSS 2003 Mathematics Test

TIMSS & PIRLS INTERNATIONAL STUDY CENTER, LYNCH SCHOOL OF EDUCATION, BOSTON COLLEGE 369
APPENDIX A: OVERVIEW OF TIMSS 2003 PROCEDURES: MATHEMATICS ACHIEVEMENT
Data Processing
To ensure the availability of comparable, high-quality data for analysis, TIMSS took rigorous quality control steps to create the international database.11 TIMSS prepared manuals and software for countries to use in entering their data, so that the information would be in a standard-ized international format before being forwarded to the IEA Data Pro-cessing Center in Hamburg for creation of the international database. Upon arrival at the Data Processing Center, the data underwent an exhaustive cleaning process. This involved several iterative steps and procedures designed to identify, document, and correct deviations from the international instruments, fi le structures, and coding schemes. The process also emphasized consistency of information within national data sets and appropriate linking among the many student, teacher, and school data fi les.
Throughout the process, the TIMSS 2003 data were checked and double-checked by the IEA Data Processing Center, the International Study Center, and the national centers. The national centers were con-tacted regularly and given multiple opportunities to review the data for their countries. In conjunction with the IEA Data Processing Center, the International Study Center reviewed item statistics for each cogni-tive item in each country to identify poorly performing items. On the fourth-grade mathematics test, two items were deleted for all countries. In addition, 7 countries had one or more items deleted (in most cases, one or two). Usually the poor statistics (negative point-biserials for the key, large item-by-country interactions, and statistics indicating lack of fi t with the model) were a result of translation, adaptation, or printing deviations. At eighth grade, no mathematics items were deleted for all countries, but 17 countries had one or more items deleted (mostly one or two). Because of a major booklet printing error, more than 40 mathematics items had to be deleted for Ghana, which may have con-tributed to its low Cronbach's alpha reliability.
11 These steps are detailed in Barth, J., Carstens, R., and Neuschmidt, O. (2004), “Creating and Checking the TIMSS 2003 Database” in M.O. Martin, I.V.S. Mullis, and S.J. Chrostowski (eds.), TIMSS 2003 Technical Report, Chestnut Hill, MA: Boston College.

TIMSS & PIRLS INTERNATIONAL STUDY CENTER, LYNCH SCHOOL OF EDUCATION, BOSTON COLLEGE370
APPENDIX A: OVERVIEW OF TIMSS 2003 PROCEDURES: MATHEMATICS ACHIEVEMENT
IRT Scaling and Data Analysis
The general approach to reporting the TIMSS achievement data was based primarily on item response theory (IRT) scaling methods.12 The mathematics results were summarized using a family of 2-parameter and 3-parameter IRT models for dichotomously-scored items (right or wrong), and generalized partial credit models for items with 0, 1, or 2 available score points. The IRT scaling method produces a score by averaging the responses of each student to the items that he or she took in a way that takes into account the diffi culty and discriminat-ing power of each item. The methodology used in TIMSS includes refi nements that enable reliable scores to be produced even though individual students responded to relatively small subsets of the total mathematics item pool. Achievement scales were produced for each of the fi ve mathematics content areas (number, algebra, measurement, geometry, and data), as well as for mathematics overall.
The IRT methodology was preferred for developing comparable estimates of performance for all students, since students answered dif-ferent test items depending upon which of the 12 test booklets they received. The IRT analysis provides a common scale on which perfor-mance can be compared across countries. In addition to providing a basis for estimating mean achievement, scale scores permit estimates of how students within countries vary and provide information on percentiles of performance.
As shown in Exhibit A.5, TIMSS has a complicated booklet design, with blocks of items appearing in different positions in different booklets. For example, the items in block M1 appear as the fi rst block in Booklet 1, as the second block in Booklet 6, and as the third block in Booklet 12. This allows the booklets to be linked together effi ciently, but also to monitor and counterbalance any position effect. In TIMSS 2003, the counterbalanced booklet design made it possible to detect an unex-pectedly strong position effect in the data as the item statistics for each country were reviewed. More specifi cally, this position effect occurred
12 For a detailed description of the TIMSS scaling, see Gonzalez, E.J., Galia, J., and Li, I. (2004), “Scaling Methods and Procedures for the TIMSS 2003 Mathematics and Science Scales” in M.O. Martin, I.V.S. Mullis, and S.J. Chrostowski (eds.), TIMSS 2003 Technical Report, Chestnut Hill, MA: Boston College.

TIMSS & PIRLS INTERNATIONAL STUDY CENTER, LYNCH SCHOOL OF EDUCATION, BOSTON COLLEGE 371
APPENDIX A: OVERVIEW OF TIMSS 2003 PROCEDURES: MATHEMATICS ACHIEVEMENT
because some students in all countries did not reach all the items in the third block position, which was the end of the fi rst half of each booklet before the break. The same effect was evident for the sixth block posi-tion, which was the last block in the booklets. The IRT scaling addressed this problem by treating items in the third and sixth block positions as if they were unique, even though they also appeared in other positions. For example, the mathematics items in block M1 from Booklet 1 (the fi rst position) and from Booklet 6 (second position) were considered to be the same items for scaling and reporting purposes, but those in Booklet 12 (the third position) were scaled as items that were different and unique.
The TIMSS mathematics achievement scale was designed to provide a reliable measure of student achievement spanning 1995, 1999, and 2003. The metric of the scale was established originally with the 1995 assessment. When all countries participating in 1995 at the eighth grade are treated equally, the TIMSS scale average over those countries is 500 and the standard deviation is 100. The same applies for the fourth-grade assessment. Since the countries varied in size, each country was weighted to contribute equally to the mean and standard deviation of the scale. The average and standard deviation of the scale scores are arbitrary and do not affect scale interpretation. To preserve the metric of the original 1995 scale, the 1999 eighth-grade assessment was scaled using students from the countries that participated in both 1995 and 1999. Then students from the countries that tested in 1999 but not 1995 were assigned scores on the basis of the scale.
At the eighth grade, TIMSS developed the 2003 scale in the same way as in 1999, preserving the metric fi rst with students from countries that participated in both 1999 and 2003,13 and then assigning scores on the basis of the scale to students tested in 2003 but not the earlier assess-ment. At fourth grade, because there was no assessment in 1999, the 2003 and 1995 data were linked directly together using students from countries that participated in both assessments, and the students tested in 2003 but not 1995 were assigned scores on the basis of the scale.
13 Because the 1995 student data had already been linked to the 1999 student data, it was not necessary to include the 1995 data in the 1999-2003 calibration.

TIMSS & PIRLS INTERNATIONAL STUDY CENTER, LYNCH SCHOOL OF EDUCATION, BOSTON COLLEGE372
APPENDIX A: OVERVIEW OF TIMSS 2003 PROCEDURES: MATHEMATICS ACHIEVEMENT
To allow more accurate estimation of summary statistics for student subpopulations, the TIMSS scaling made use of plausible-value technology, whereby fi ve separate estimates of each student’s score were generated on each scale, based on the student’s responses to the items in the student’s booklet and the student’s background charac-teristics. The fi ve score estimates are known as “plausible values,” and the variability between them encapsulates the uncertainty inherent in the score estimation process.
In addition to the scales for mathematics overall, IRT scales also were created for each of the fi ve mathematics content areas for the 2003 data. However, insuffi cient common items were used in 1995 and 1999 to establish reliable IRT content area scales for trend purposes. The trend exhibits presented in Chapter 3 were based on the average percentage of students responding correctly to the common items in each content area.
Estimating Sampling Error
Because the statistics presented in this report are estimates of national performance based on samples of students, rather than the values that could be calculated if every student in every country had answered every question, it is important to have measures of the degree of uncer-tainty of the estimates. The jackknife procedure was used to estimate the standard error associated with each statistic presented in this report.14 The jackknife standard errors also include an error compo-nent due to variation among the fi ve plausible values generated for each student. The use of confi dence intervals, based on the standard errors, provides a way to make inferences about the population means and proportions in a manner that refl ects the uncertainty associated with the sample estimates. An estimated sample statistic plus or minus two standard errors represents a 95 percent confi dence interval for the corresponding population result.
14 Procedures for computing jackknifed standard errors are presented in Gonzalez, E.J., Galia, J., Arora, A., Erberber, E., and Diancou, D. (2004), “Reporting Student Achievement in Mathematics and Science” in M.O. Martin, I.V.S. Mullis, and S.J. Chrostowski (eds.), TIMSS 2003 Technical Report, Chestnut Hill, MA: Boston College.

TIMSS & PIRLS INTERNATIONAL STUDY CENTER, LYNCH SCHOOL OF EDUCATION, BOSTON COLLEGE 373
APPENDIX A: OVERVIEW OF TIMSS 2003 PROCEDURES: MATHEMATICS ACHIEVEMENT
Assessing Statistical Signifi cance
This report makes extensive use of statistical hypothesis-testing to provide a basis for evaluating the signifi cance of differences in per-centages and in average achievement scores. Each separate test follows the usual convention of holding to 0.05 the probability that reported differences could be due to sampling variability alone. There is one important difference in the way TIMSS 2003 reports signifi cance tests compared with the practice in 1995 and 1999. In the previous assess-ments, signifi cance tests in exhibits where the results of many tests are reported simultaneously were based on a Bonferroni procedure for multiple comparisons. The Bonferroni procedure was not used in TIMSS 2003. The procedure takes into account the number of com-parisons being made, which is a function of the number of countries participating. Since this varies from assessment to assessment, the Bon-ferroni procedure makes it diffi cult to compare results from one assess-ment to the next. However, users of the reports should be aware that, following the logic of statistical hypothesis testing, on average, about fi ve percent of statistical tests will be signifi cant by chance alone.
Setting International Benchmarks of Student Achievement
In order to provide meaningful descriptions of what performance on the TIMSS mathematics scale could mean in terms of the mathematics that students know and can do, TIMSS identifi ed four points on the scale for use as international benchmarks. Selected to represent the range of performance shown by students internationally, the advanced benchmark is 625, the high benchmark is 550, the intermediate bench-mark is 475, and the low benchmark is 400. Although the fourth- and eighth-grade scales are different, the same benchmark points are used at both grades.
In order to interpret the TIMSS scale scores and analyze achieve-ment at the international benchmarks, TIMSS conducted a scale anchoring analysis to describe achievement of students at those four points on the scale. Scale anchoring is a way of describing students’

TIMSS & PIRLS INTERNATIONAL STUDY CENTER, LYNCH SCHOOL OF EDUCATION, BOSTON COLLEGE374
APPENDIX A: OVERVIEW OF TIMSS 2003 PROCEDURES: MATHEMATICS ACHIEVEMENT
performance at different points on a scale in terms of what they know and can do. It involves a statistical component, in which items that discriminate between successive points on the scale are identifi ed, and a judgmental component in which subject-matter experts examine the items and generalize to students’ knowledge and understandings.15
Calculator Use in the TIMSS 2003 Mathematics Assessment
Because calculators were permitted in TIMSS for the fi rst time in the 2003 assessment at the eighth grade (not the fourth grade), TIMSS placed all the trend items in the fi rst half of the test and only permitted eighth-grade students to use calculators for the second half. Neverthe-less, capitalizing on the counterbalanced TIMSS booklet design, one block of mathematics items was included in both the testing session before the break, when calculators were not permitted, and in the session after the break, when they were allowed. This enabled a com-parison of the mathematics achievement of those students having a calculator available and those that did not.
As shown in Exhibit A.14, calculator usage in the assessment was quite low. On average, internationally, 37 percent of students reported that they did not have a calculator for the test, and a further 47 percent that although they had them, they used them very little (39%) or not at all (8%). Most of the TIMSS mathematics items were designed so that they could be answered readily without the use of a calculator, and consequently having a calculator available may not be a great advantage. However, the Science and Mathematics Item Review Committee identifi ed fi ve items in the calculator block for which a cal-culator should be and was helpful, and Exhibit A.14 presents for each country the average percent correct across these fi ve calculator-sensi-tive items for students when they had a calculator and when they did not. On average, internationally, performance on the calculator-sensi-tive items was superior when students had calculators (66% correct with calculator vs 57% correct without a calculator). The difference was signifi cant in almost every country where calculators were used.
15 The scale-anchoring procedure is described fully in Gonzalez, E.J., Galia, J., Arora, A., Erberber, E., and Diaconu, D. (2004), “Reporting Student Achievement in Mathematics and Science” in M.O. Martin, I.V.S. Mullis, and S.J. Chrotowski (eds.), TIMSS 2003 Technical Report, Chestnut Hill, MA: Boston College. An application of the procedure to the 1995 TIMSS data may be found in Kelly, D.L., Mullis, I.V.S., and Martin, M.O. (2000), Profi les of Student Achievement in Mathematics at the TIMSS International Benchmarks: U.S. Performance and Stan-dards in an International Context, Chestnut Hill, MA: Boston College.

SOU
RCE:
IEA
's T
rend
s in
Inte
rnat
iona
l Mat
hem
atic
s an
d Sc
ienc
e St
udy
(TIM
SS) 2
003
APPENDIX A: OVERVIEW OF TIMSS 2003 PROCEDURES: MATHEMATICS ACHIEVEMENT TIMSS2003
GradeMATHEMATICS
TIMSS & PIRLS INTERNATIONAL STUDY CENTER, LYNCH SCHOOL OF EDUCATION, BOSTON COLLEGE 375
Armenia 3 (0.4) 4 (0.3) 15 (1.0) 2 (0.3) 75 (1.3) 57 (2.1) 67 (1.3) h
Australia 2 (0.3) 12 (1.0) 46 (1.6) 12 (0.7) 28 (2.2) 69 (1.7) h 53 (1.6)
Bahrain 3 (0.3) 8 (0.5) 38 (0.9) 14 (0.6) 37 (1.1) 45 (1.7) h 36 (1.2)
Belgium (Flemish) 1 (0.2) 16 (0.8) 54 (1.3) 11 (0.5) 18 (1.6) 82 (1.2) h 65 (1.3)
Botswana 10 (0.6) 17 (0.8) 45 (1.0) 22 (0.9) 6 (0.9) 57 (1.3) h 34 (0.9)
Bulgaria 1 (0.2) 5 (0.6) 16 (1.3) 4 (0.5) 74 (1.8) 64 (2.0) 62 (1.6)
Chile 1 (0.2) 11 (0.8) 44 (1.7) 13 (0.6) 31 (2.4) 55 (1.6) h 39 (1.1)
Chinese Taipei 0 (0.1) 2 (0.3) 12 (1.1) 5 (0.5) 80 (1.6) 83 (1.3) 83 (1.0)
Cyprus 3 (0.4) 10 (0.6) 29 (0.8) 5 (0.4) 52 (1.0) 60 (1.7) h 51 (1.0)
Egypt 20 (0.9) 36 (0.9) 37 (0.9) 4 (0.3) 3 (0.3) 56 (1.6) 58 (1.1)
England 1 (0.2) 9 (0.8) 48 (1.9) 15 (1.1) 27 (2.5) 62 (1.9) h 44 (1.2)
Estonia 1 (0.2) 12 (0.8) 57 (1.2) 2 (0.3) 27 (1.3) 85 (1.0) h 73 (0.9)
Ghana 10 (0.6) 12 (0.8) 15 (0.8) 10 (0.7) 54 (1.6) 30 (1.7) h 26 (1.1)
Hong Kong, SAR 2 (0.4) 18 (1.0) 51 (1.3) 6 (0.5) 23 (1.8) 88 (1.0) h 81 (0.9)
Hungary 1 (0.3) 12 (0.9) 60 (1.4) 10 (0.6) 17 (1.6) 84 (1.1) h 75 (1.3)
Indonesia 3 (0.3) 10 (0.9) 18 (1.5) 1 (0.1) 69 (2.3) 57 (1.8) 55 (1.5)
Iran, Islamic Rep. of 2 (0.3) 4 (0.4) 11 (1.2) 4 (0.5) 79 (1.9) 48 (1.6) 48 (1.1)
Israel 2 (0.3) 15 (0.8) 52 (1.4) 13 (0.7) 18 (1.4) 74 (1.4) h 59 (1.4)
Italy 1 (0.2) 13 (0.8) 49 (1.4) 0 (0.1) 36 (1.7) 71 (1.4) h 60 (1.3)
Japan 1 (0.1) 12 (0.6) 47 (1.3) 22 (1.1) 19 (2.0) 85 (1.1) h 77 (0.9)
Jordan 3 (0.3) 7 (0.5) 26 (1.6) 7 (0.6) 56 (2.0) 50 (1.9) 48 (1.5)
Korea, Rep. of 0 (0.0) 0 (0.1) 5 (0.9) 0 (0.0) 95 (0.9) 79 (1.0) 81 (0.8)
Latvia 1 (0.2) 12 (0.9) 43 (1.4) 6 (0.6) 38 (1.9) 81 (1.4) h 67 (1.5)
Lebanon 8 (0.8) 18 (1.0) 43 (1.2) 15 (0.9) 17 (1.1) 70 (1.7) h 61 (1.4)
Lithuania 2 (0.3) 17 (0.8) 49 (1.1) 5 (0.5) 26 (1.4) 82 (1.2) h 67 (1.1)
Macedonia, Rep. of 3 (0.4) 13 (1.0) 33 (1.3) 8 (0.6) 43 (2.1) 61 (1.5) 60 (1.4)
Malaysia 2 (0.3) 19 (0.8) 47 (1.6) 1 (0.2) 31 (1.9) 82 (0.9) h 73 (1.2)
Moldova, Rep. of 1 (0.2) 11 (0.9) 39 (1.5) 4 (0.5) 45 (1.9) 65 (1.9) 65 (1.4)
Morocco 1 (0.2) 6 (0.6) 19 (1.6) 3 (0.5) 71 (2.2) 54 (2.0) h 48 (1.4)
Netherlands 4 (0.4) 25 (1.2) 51 (1.2) 0 (0.1) 19 (1.3) 80 (1.8) h 68 (1.4)
New Zealand 2 (0.5) 14 (0.7) 49 (1.6) 8 (0.6) 27 (1.9) 68 (1.9) h 50 (1.8)
Norway 1 (0.1) 7 (0.6) 54 (1.3) 18 (0.7) 20 (1.5) 59 (1.4) h 40 (1.1)
Palestinian Nat’l Auth. 6 (0.4) 13 (0.6) 46 (1.2) 11 (0.6) 24 (1.5) 48 (1.7) h 41 (1.2)
Philippines 7 (0.6) 12 (0.7) 19 (1.1) 8 (0.7) 54 (1.9) 51 (1.5) 48 (1.6)
Romania 2 (0.3) 9 (0.6) 31 (1.6) 5 (0.5) 53 (2.2) 69 (2.1) h 62 (1.8)
Russian Federation 1 (0.2) 15 (0.8) 49 (1.3) 6 (0.6) 29 (1.3) 83 (1.1) h 72 (1.3)
Saudi Arabia 4 (0.4) 11 (0.7) 48 (1.9) 2 (0.4) 35 (1.9) 29 (1.7) h 21 (1.2)
Scotland 1 (0.2) 7 (0.5) 55 (2.0) 17 (1.0) 19 (2.2) 65 (1.6) h 48 (1.1)
Serbia 0 (0.1) 4 (0.4) 29 (1.6) 11 (0.8) 57 (2.1) 69 (1.6) h 61 (1.2)
Singapore 5 (0.4) 20 (0.7) 53 (0.8) 9 (0.4) 12 (0.5) 87 (1.0) h 78 (0.8)
Slovak Republic 2 (0.3) 15 (0.9) 52 (1.4) 15 (1.0) 16 (1.1) 77 (2.0) h 66 (1.3)
Slovenia 2 (0.3) 8 (0.7) 34 (1.6) 3 (0.3) 53 (1.9) 71 (1.6) 68 (1.3)
South Africa 9 (0.5) 12 (0.6) 23 (1.0) 12 (0.6) 45 (1.4) 26 (1.4) h 19 (0.9)
Sweden 1 (0.2) 14 (0.7) 58 (1.0) 15 (0.6) 11 (0.9) 66 (1.3) h 45 (1.0)
Tunisia 6 (0.5) 16 (1.0) 36 (1.5) 7 (0.5) 35 (2.4) 64 (1.5) 62 (1.1)
United States 3 (0.2) 22 (0.6) 61 (0.8) 11 (0.4) 4 (0.4) 75 (1.3) h 65 (1.1)
International Avg. 3 (0.1) 12 (0.1) 39 (0.2) 8 (0.1) 37 (0.3) 66 (0.2) h 57 (0.2)
Benchmarking Participants
Basque Country, Spain 1 (0.2) 10 (0.8) 58 (1.7) 14 (0.9) 17 (1.8) 76 (1.5) h 65 (1.4)
Indiana State, US 2 (0.3) 23 (1.1) 59 (1.0) 13 (0.9) 4 (0.5) 78 (1.9) h 70 (1.5)
Ontario Province, Can. 1 (0.3) 15 (0.9) 62 (1.2) 11 (0.9) 10 (0.9) 78 (1.4) h 59 (1.5)
Quebec Province, Can. 3 (0.5) 21 (0.9) 59 (1.2) 6 (0.4) 10 (1.0) 85 (1.2) h 71 (1.3)
Not at All
Percentage of Students Using a Calculator During the TIMSS Test
Did Not Havea Calculatorfor the Test
Average Percent Correct for theFive Calculator-Sensitive
Items*
WithCalculator
WithoutCalculator
Countries
Quite a Lot Somewhat Very Little
Significantlyhigher
h
* Five calculator-sensitive items are M05_02, M06_07, M06_11, M06_12, M06_13.
( ) Standard errors appear in parentheses. Because results are rounded to the nearest whole number, some totals may appear inconsistent.
Exhibit A.14: Students' Reports on the Frequency of Calculator Use During the TIMSS 2003 Test 88

TIMSS & PIRLS INTERNATIONAL STUDY CENTER, LYNCH SCHOOL OF EDUCATION, BOSTON COLLEGE376
APPENDIX A: OVERVIEW OF TIMSS 2003 PROCEDURES: MATHEMATICS ACHIEVEMENT
In scaling the mathematics achievement test, each of the fi ve cal-culator-sensitive items was treated as two distinct items – one item when a calculator was available and the other item when a calculator was unavailable.