Embed Size (px)
Citation preview
Atmos. Chem. Phys., 16, 3979–4003, 2016
www.atmos-chem-phys.net/16/3979/2016/
doi:10.5194/acp-16-3979-2016
© Author(s) 2016. CC Attribution 3.0 License.
Overview of VOC emissions and chemistry from PTR-TOF-MS
measurements during the SusKat-ABC campaign: high
acetaldehyde, isoprene and isocyanic acid in wintertime air of the
Kathmandu Valley
Chinmoy Sarkar1, Vinayak Sinha1, Vinod Kumar1, Maheswar Rupakheti2,3, Arnico Panday4, Khadak S. Mahata2,
Dipesh Rupakheti5, Bhogendra Kathayat3, and Mark G. Lawrence2
1Department of Earth and Environmental Sciences, Indian Institute of Science Education and Research Mohali, Sector 81, S.
A. S. Nagar, Manauli PO, Punjab, 140306, India2Institute for Advanced Sustainability Studies (IASS), Berliner Str. 130, 14467 Potsdam, Germany3Himalayan Sustainability Institute (HIMSI), Kathmandu, Nepal4International Centre for Integrated Mountain Development (ICIMOD), Khumaltar, Lalitpur, Nepal5Key Laboratory of Tibetan Environment Changes and Land Surface Processes, Institute of Tibetan Plateau Research,
Chinese Academy of Sciences, Beijing, 100101, China
Correspondence to: Vinayak Sinha ([email protected])
Received: 10 August 2015 – Published in Atmos. Chem. Phys. Discuss.: 15 September 2015
Revised: 19 February 2016 – Accepted: 8 March 2016 – Published: 24 March 2016
Abstract. The Kathmandu Valley in Nepal suffers from
severe wintertime air pollution. Volatile organic compounds
(VOCs) are key constituents of air pollution, though their
specific role in the valley is poorly understood due to
insufficient data. During the SusKat-ABC (Sustainable
Atmosphere for the Kathmandu Valley–Atmospheric Brown
Clouds) field campaign conducted in Nepal in the winter
of 2012–2013, a comprehensive study was carried out to
characterise the chemical composition of ambient Kath-
mandu air, including the determination of speciated VOCs,
by deploying a proton transfer reaction time-of-flight mass
spectrometer (PTR-TOF-MS) – the first such deployment
in South Asia. In the study, 71 ion peaks (for which mea-
sured ambient concentrations exceeded the 2σ detection
limit) were detected in the PTR-TOF-MS mass scan data,
highlighting the chemical complexity of ambient air in the
valley. Of the 71 species, 37 were found to have campaign
average concentrations greater than 200 ppt and were
identified based on their spectral characteristics, ambient
diel profiles and correlation with specific emission tracers
as a result of the high mass resolution (m/1m> 4200)
and temporal resolution (1 min) of the PTR-TOF-MS. The
concentration ranking in the average VOC mixing ratios dur-
ing our wintertime deployment was acetaldehyde (8.8 ppb)
> methanol (7.4 ppb) > acetone + propanal (4.2 ppb) >
benzene (2.7 ppb) > toluene (1.5 ppb) > isoprene (1.1 ppb)
> acetonitrile (1.1 ppb) > C8-aromatics (∼1 ppb) > furan
(∼0.5 ppb)>C9-aromatics (0.4 ppb). Distinct diel profiles
were observed for the nominal isobaric compounds isoprene
(m/ z= 69.070) and furan (m/ z= 69.033). Comparison
with wintertime measurements from several locations else-
where in the world showed mixing ratios of acetaldehyde
(∼ 9 ppb), acetonitrile (∼ 1 ppb) and isoprene (∼ 1 ppb)
to be among the highest reported to date. Two “new”
ambient compounds, namely formamide (m/ z= 46.029)
and acetamide (m/ z= 60.051), which can photochemically
produce isocyanic acid in the atmosphere, are reported in this
study along with nitromethane (a tracer for diesel exhaust),
which has only recently been detected in ambient studies.
Two distinct periods were selected during the campaign
for detailed analysis: the first was associated with high
wintertime emissions of biogenic isoprene and the second
with elevated levels of ambient acetonitrile, benzene and
isocyanic acid from biomass burning activities. Emissions
from biomass burning and biomass co-fired brick kilns
were found to be the dominant sources for compounds such
Published by Copernicus Publications on behalf of the European Geosciences Union.
3980 C. Sarkar et al.: Wintertime high acetaldehyde, isoprene and isocyanic acid in Kathmandu Valley
as propyne, propene, benzene and propanenitrile, which
correlated strongly with acetonitrile (r2 > 0.7), a chemical
tracer for biomass burning. The calculated total VOC OH
reactivity was dominated by acetaldehyde (24.0 %), isoprene
(20.2 %) and propene (18.7 %), while oxygenated VOCs
and isoprene collectively contributed to more than 68 %
of the total ozone production potential. Based on known
secondary organic aerosol (SOA) yields and measured
ambient concentrations in the Kathmandu Valley, the
relative SOA production potential of VOCs were ben-
zene> naphthalene> toluene> xylenes>monoterpenes>
trimethylbenzenes> styrene> isoprene. The first ambient
measurements from any site in South Asia of compounds
with significant health effects such as isocyanic acid,
formamide, acetamide, naphthalene and nitromethane
have been reported in this study. Our results suggest that
mitigation of intense wintertime biomass burning activities,
in particular point sources such biomass co-fired brick kilns,
would be important to reduce the emission and formation
of toxic VOCs (such as benzene and isocyanic acid) in the
Kathmandu Valley.
1 Introduction
The Kathmandu Valley is a bowl-shaped basin at an alti-
tude of ∼ 1300 m that is surrounded by the Shivapuri, Phul-
chowki, Nagarjun and Chandragiri mountains, which have
an altitude range of 2000–2800 m above mean sea level,
(a.m.s.l.) and is prone to poor air quality and air pollution
episodes (Panday et al., 2009). In particular during the win-
ter mornings, due to the combination of suppressed mix-
ing, katabatic wind flows and the topography of the basin,
pollutants remain trapped under an inversion layer close to
the surface of the valley (Kitada et al., 2003; Regmi et al.,
2003). Previous studies in similar valley sites such as Santi-
ago de Chile and Mexico City have investigated the coupling
of topography, meteorology, atmospheric dynamics, emis-
sions and chemical processes in exacerbating air pollution
episodes and suggested ways to mitigate the air pollution and
improve air quality (Molina et al., 2007; de Foy et al., 2006;
Schmitz, 2005; Rappenglück et al., 2005). In contrast, only
few such studies have been carried out within the Kathmandu
Valley. Previous studies in the Kathmandu Valley have exam-
ined pollution in relation to carbon monoxide (CO), nitrogen
oxides (NOx), sulfur dioxide (SO2), ozone (O3) (Panday and
Prinn, 2009; Larssen et al., 1997; Yu et al., 2009; Ramana
et al., 2004; Pudasainee et al., 2006) and particulate matter
(Gurung and Bell, 2012; Sharma et al., 2012). An early study
by Davidson et al. (1986) reported ambient average concen-
trations of 2 ppm CO during the winter season of 1982–1983.
Offline measurements of nitrogen dioxide (NO2) and sulfur
dioxide (SO2) performed by Larssen et al. (1997) examined
the average pollution exposure in different regions of the val-
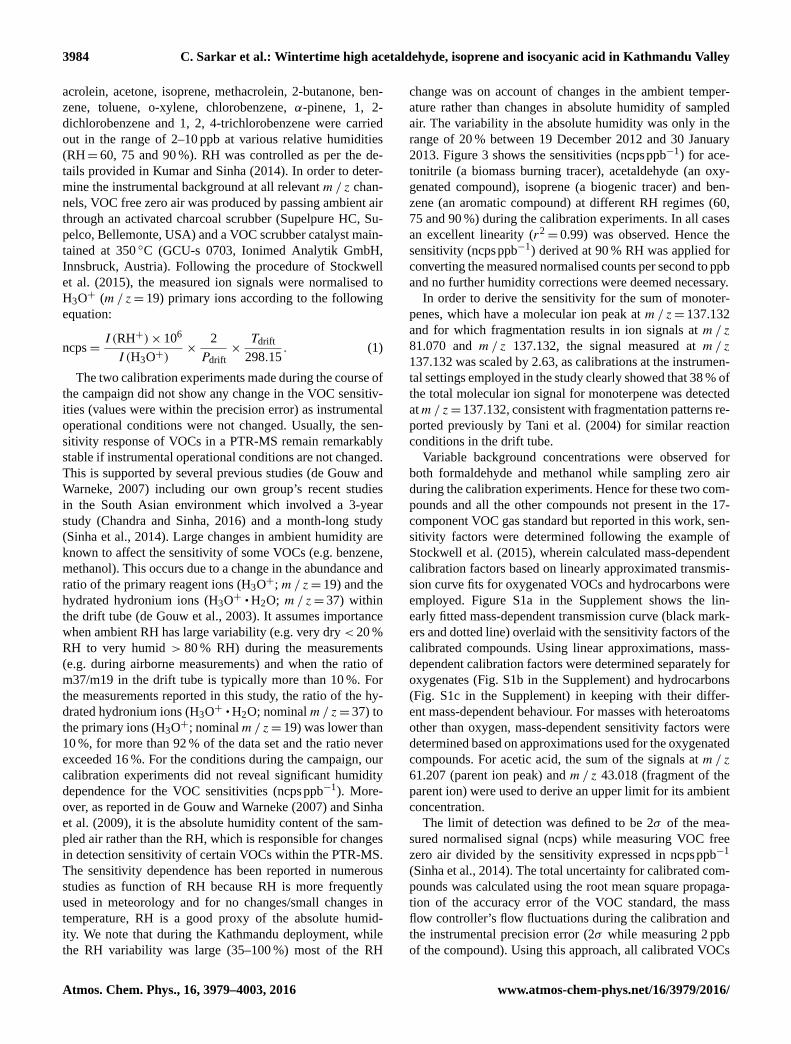
Table 1. Principal operational settings for PTR-TOF-MS parame-
ters.
Parameter Value
Overall drift voltage (Udrift) 600 V
Temperature at drift tube (Tdrift) 60 ◦C
Pressure at drift tube (Pdrift) 2.2 mbar
Length of the drift tube (Ldrift) 9.3 cm
Reaction time (t) 92 µs
Field strength of the drift tube (E/N )∗ 135 Td
∗ E is the electric field strength (V cm−1) and N is the gas number
density (molecule cm−3). 1 Td= 10−17 V cm2 molecule−1.
ley and found that the brick kiln region south-east of the
valley and cities were most severely affected. With regard
to quantification of volatile organic compounds (VOCs) in
downtown Kathmandu and a rural site in Nagarkot, data per-
taining to light C2–C6 compounds were obtained in a study
in November 1998 using 38 whole air samples analysed of-
fline with a GC-FID (Sharma et al., 2000). Subsequently Yu
et al. (2008) measured mixing ratios of seven monocyclic
aromatic hydrocarbons, using long-path differential optical
absorption spectroscopy (DOAS) at a suburban site in Kath-
mandu during January–February 2003. All these initial stud-
ies highlighted that traffic sources were major contributors
to air pollution in the Kathmandu Valley (Yu et al., 2008).
In the time since these studies, due to rapid urbanisation and
population growth over the last decade, the wintertime air
quality has deteriorated severely. However, very little infor-
mation is currently available with regard to the emissions and
chemistry of volatile organic compounds in the Kathmandu
Valley. Except for a handful of species, most of which were
measured only periodically using offline sampling methods,
virtually no in situ data are available from the region with re-
gard to the concentration and speciation of several important
volatile organic compounds.
VOCs, in particular the reactive ones, have atmospheric
lifetimes ranging from minutes to days (Atkinson, 2000) and
exert a profound influence on regional air quality through
their participation in chemical reactions leading to the forma-
tion of secondary pollutants such as tropospheric ozone and
secondary organic aerosol (SOA). Both tropospheric ozone
and secondary organic aerosol are important from the stand-
point of air quality and climate due to their impact on health
and the radiative forcing of the atmosphere (IPCC, 2013).
Further, through reactions with the hydroxyl radicals (the de-
tergent of the atmosphere; Lelieveld et al., 2004), photodis-
sociation reactions and radical recycling reactions, VOCs
strongly influence ambient OH reactivity and the budget of
HOx (OH, HO2) radicals which control the removal rates of
gaseous pollutants, including most greenhouse gases from
the atmosphere. Inhalation of certain VOCs present in air
also produces direct adverse health effects. For example ben-
Atmos. Chem. Phys., 16, 3979–4003, 2016 www.atmos-chem-phys.net/16/3979/2016/

C. Sarkar et al.: Wintertime high acetaldehyde, isoprene and isocyanic acid in Kathmandu Valley 3981
Figure 1. Location of the measurement site (Bode, red circle) along with surrounding cities (Kathmandu, brown circle; Patan, blue circle;
Bhaktapur, pink circle), brick kilns (white markers), major industries (yellow triangles), forest areas (green tree symbols), airport (blue
marker) and major river paths (sky blue) in the Google Earth image of the Kathmandu Valley (obtained on 22 May 2015 at 14:55 LT).
zene and nitromethane are reported to be human carcinogens
by the World Health Organization (WHO, 2010).
In order to address gaps in our scientific understanding
of the air pollution in the Kathmandu Valley, a large scale
scientific experiment called the Sustainable Atmosphere for
the Kathmandu Valley–Atmospheric Brown Clouds (SusKat-
ABC) campaign was carried out in the winter of 2012–2013
by an international team of scientists. An overview of the
campaign objectives, measurement suite and sites will be
presented in an overview paper (Rupakheti et al., 2016) while
the overview of meteorology and pollution transport pro-
cesses will be presented in a second paper (Panday et al.,
2016). Here we present results derived from the in situ mea-
surements of speciated VOCs using a proton transfer reac-
tion time-of-flight mass spectrometer (PTR-TOF-MS), the
first such deployment in South Asia. Another version of
this type of instrument, which has lower mass resolution,
namely a proton transfer reaction quadrupole mass spectrom-
eter (PTR-Q-MS), has been previously deployed in the north-
western Indo-Gangetic Plain in Mohali, India (Sarkar et al.,
2013; Sinha et al., 2014).
With a mass resolving power (m/1m) of more than 4200,
PTR-TOF-MS measurements enable identification of sev-
eral compounds based on their exact monoisotopic mass
(molecular formula) and have fast time response (∼ 1 min).
These attributes were leveraged to quantify a suite of ambi-
ent VOCs at a suburban site (Bode: 27.689◦ N, 85.395◦ E;
1345 ma.m.s.l.) in the Kathmandu Valley during December
2012–January 2013. Oxygenated VOCs such as methanol,
acetaldehyde, sum of acetone and propanal, aromatic VOCs
such as benzene, toluene, sum of C8-aromatics and sum of
C9-aromatics, isoprene, furan and acetonitrile were quan-
tified every minute and their diel emission profiles anal-
ysed to constrain major sources. Careful analysis of the
ambient mass spectra from 21 to 210 Th was undertaken
to identify several “new” or rarely quantified VOCs based
on their monoisotopic masses (and therefore molecular for-
mula), spectral characteristics observed at a particular m/ z
in a 0.005 amu bin relative to the ion peak, ambient diel pro-
files and correlation with specific emission tracer molecules
such as acetonitrile (a tracer for biomass burning). By con-
trasting periods in the chemical data set based on the domi-
nance of biogenic emission sources and emissions from brick
kilns co-fired with biomass respectively, VOCs emitted from
brick kilns were constrained. The measured VOC concentra-
tions in the Kathmandu Valley were compared with previous
wintertime measurements from other urban/suburban sites
and megacities. The diel profiles of rarely detected and mea-
sured VOCs such as nitromethane and isocyanic acid were
correlated with tracer VOCs. The major VOC contributors
to the total measured reactive carbon, the VOC OH reactiv-
ity, ozone production potential and secondary organic aerosol
formation potential were elucidated through detailed analy-
ses. Finally, information pertaining to direct health impacts
of some of the quantified VOCs detected in this complex
www.atmos-chem-phys.net/16/3979/2016/ Atmos. Chem. Phys., 16, 3979–4003, 2016

3982 C. Sarkar et al.: Wintertime high acetaldehyde, isoprene and isocyanic acid in Kathmandu Valley
chemical environment is discussed with conclusions and out-
look for future VOC studies in the region.
2 Experimental
2.1 Site description and prevalent meteorology
The Kathmandu Valley is a bowl-shaped basin in the Hi-
malayan foothills. The average altitude of the valley is
1300 m a.m.s.l. It is encircled by a ring of mountains that
range from 2000 to 2800 ma.m.s.l., with about five mountain
passes approximately 1500–1550 ma.m.s.l. (Panday et al.,
2009). VOC measurements during this study were performed
in the winter season from 19 December 2012 to 30 January
2013 at Bode (27.689◦ N, 85.395◦ E; 1345 ma.m.s.l.), which
is a suburban site located in the westerly outflow of Kath-
mandu city.
Figure 1 shows a zoomed view of the land use in the vicin-
ity of the measurement site (Bode, red circle; image derived
using Google Earth on 22 May 2015 at 14:55 LT (local time))
in relation to the surrounding cities – Kathmandu (∼ 10 km
to the west; brown circle), Patan (∼ 12 km south-west of the
site; blue circle) and Bhaktapur (∼ 5 km south-east of the
site; pink circle), major point sources and forested areas.
Most of the agricultural fields near the site have unpaved
tracks and were sold as small plots and are largely unculti-
vated. At some distance, there are agricultural fields on which
rice is sown in the summer and either potatoes/vegetables or
wheat is sown in winter. The major road (Bhaktapur road) is
about 1 km south of the site. In 2011, the total populations of
Kathmandu, Patan and Bhaktapur cities were 1 003 285 (pop-
ulation density: 20 289 km−2), 226 728 (population density:
14 966 km−2) and 83 658 (population density: 12 753 km−2)
respectively according to Central Bureau of Statistics (2011).
The region east of the site was usually downwind but it is
important to note that several brick kilns (white marker in
Fig. 1; around 10 brick kilns) were located south-east of the
site at about 1 km distance. Major industries (yellow trian-
gles in Fig. 1) were concentrated primarily in the cities of
Kathmandu (Balaju industrial area) and Patan (Patan indus-
trial area), while Bhaktapur industrial area was located in the
south-eastern direction within 2 km of the measurement site.
About 20 small industries, mainly pharmaceuticals, plastic,
tin, electronics and fabrics were located in this industrial
area. Also a few plastic, electronics, wood, aluminium and
iron industries were located within 3 km from the Bode site
in the south-eastern direction. The Tribhuvan international
airport was located west of the site (∼ 4 km from Bode).
The region north of the site has a small forested area (Nil
Barahi jungle in Fig. 1; ∼ 0.5 km2 area) and a reserve for-
est (Gokarna reserve forest in Fig. 1; ∼ 1.8 km2 area) at ap-
proximately 1.5 and 7 km from the measurement site respec-
tively. Other nearby forest areas were located adjacent to the
international airport (Mrigasthali and Bhandarkhal jungles;
8–10 km from the site). The forests in the Kathmandu Val-
ley consist of broad-leaved evergreen mixed forest of Schima
castanopsis at the base (up to 1800 ma.m.s.l.), oak-laurel
forest in the middle (1800 to 2400 ma.m.s.l.) and oak for-
est at the top, while the conifer tree species Pinus roxiburghii
(Khote Salla) and Pinus wallichiana (Gobre Salla) are also
found (Department of Plant Resources, Nepal, 2015). Other
major tree species are Melia azedarach (Bakaino), Schima
wallichii (Chilaune), Castanopsis indica (Dhale Katus), Pip-
tanthus nepalensis (Suga Phul), Persea bombycina (Kaulo),
Madhuca longifolia (Mauwa), Celtis australis (Khari), Quer-
cus semecarpifolia (Khasru) and Cryptomeria japonica
(Dhupi salla) (Department of Plant Resources, Nepal, 2015).
The general meteorological conditions within the Kath-
mandu Valley remain fairly similar throughout the winter
season (Regmi et al., 2003; Panday et al., 2009) and it is
worth mentioning that the winter of 2012–2013 was not
anomalous. Conditions were calm during the mornings with
shallow boundary layer and therefore what we see in the
morning hours are emissions from the previous night and
emissions from morning activities around the measurement
site within a radius of few km, rather than regional emissions.
Cold pooling of air at night resulting in dilution of pollution
was observed in the diel profiles of VOCs for period 1 when
the 24/7 brick kilns were largely un-operational (for exam-
ple between midnight and 05:00 LT). Shortly after sunrise,
the surface air mixes in with air that was aloft. Finally during
the afternoon (10:00–15:00 LT), westerly winds sweep the
valley from west to east at wind speeds of 3–4 ms−1, advect-
ing the emissions, some of which may get transported across
the mountain passes (Kitada et al., 2003; Regmi et al., 2003;
Panday et al., 2009).
Figure 2b shows the box and whisker plots for the mete-
orological parameters measured at Bode from 16 to 30 Jan-
uary 2013 derived from the 1 min temporal resolution data
acquired using meteorological sensors (Campbell Scientific
Loughborough, UK) installed on the rooftop (∼ 25 m above
ground and ∼ 5 m away from the instrument inlet). Day-
time (08:00–17:00 LT) average ambient temperature for the
measurement period was observed to be 12.2± 4.5 ◦C. It
is worth mentioning that most mornings were associated
with dense fog (average ambient RH> 90 % with visibility
< 100 m) whereas the afternoons were associated with high-
speed westerly winds (> 4 ms−1). Wind speeds from other
wind sectors were generally lower (average wind speeds
∼ 1 ms−1). The early morning wind flow was normally from
the south-eastern wind sector which comprised of several
brick kilns and Bhaktapur city. Evening hours were also as-
sociated with dense fog and the relative humidity (RH) was
generally greater than 90 % throughout the night. Minimum
RH levels (∼ 35 %) were observed during midday. The sun-
rise typically occurred between 07:00 and 08:00 and sunset
timings were around 17:00 Nepal standard time (NST). The
range of atmospheric pressure during the campaign was 856–
866 hPa.
Atmos. Chem. Phys., 16, 3979–4003, 2016 www.atmos-chem-phys.net/16/3979/2016/

C. Sarkar et al.: Wintertime high acetaldehyde, isoprene and isocyanic acid in Kathmandu Valley 3983
Figure 2. (a) Schematic of wind flow during different times of the day in the Kathmandu Valley. (b) Box and whisker plots of the measured
meteorological parameters (wind speed, wind direction, solar radiation, relative humidity and ambient temperature) at the Bode site (16–
30 January 2013).
2.2 VOC measurements using PTR-TOF-MS
VOCs over the mass range (21–210 amu) were measured
using a commercial high-sensitivity PTR-TOF-MS (model
8000; Ionicon Analytic GmbH, Innsbruck, Austria). This in-
strument has been described in detail by Jordan et al. (2009)
and is a more recent development of the PTR technique
(Lindinger et al., 1998) that enables higher mass resolution
at ppt level detection limit (Ruuskanen et al., 2011; Müller
et al., 2010; Park et al., 2013; Stockwell et al., 2015). Briefly,
the instrument consists of a hollow cathode ion source which
produces a pure flow of the H3O+ reagent ions, a drift tube
where analyte VOCs undergo ionisation and an orthogo-
nal acceleration reflectron time-of-flight mass analyzer and
multi-channel plate detector. The instrument was operated at
a drift tube pressure of 2.2 mbar, drift tube temperature of
600 ◦C and drift tube voltage of 600 V, resulting in an operat-
ing E /N ratio of∼ 135 Td (1 Td= 10−17 Vcm−2; de Gouw
and Warneke, 2007). Table 1 summarizes the relevant instru-
mental details. The high mass resolution of the instrument
(m/1m> 4200 atm/ z 21.022 and> 4800 atm/ z 205.195)
and detection limit of few tens of ppt permitted identification
of several rarely measured or previously unmeasured com-
pounds based on their monoisotopic masses.
The PTR-TOF-MS 8000 used in this work was installed in
a room on the second floor of a building at the suburban mea-
surement site at Bode, Kathmandu. Ambient air was sam-
pled continuously from the rooftop (∼ 20 m above ground)
through a Teflon inlet line that was protected with a Teflon
membrane particle filter to ensure that dust and debris did
not enter the sampling inlet. Teflon membrane particle fil-
ters similar to the ones used in the Kathmandu study have
been used without issues in several previous PTR-MS VOC
studies by some of the authors (e.g. Sinha et al., 2010), in-
cluding at another South Asian site in Mohali, India (Sinha
et al., 2014). The filters were changed on seven occasions
during the 40-day deployment from 19 December 2012 to
30 January 2013. The inlet lines used in Kathmandu were
prepared prior to deployment by continuous purging at dif-
ferent flow rates in the laboratory at Mohali for more than
three days and zero air was sampled through these lines. Af-
ter purging, the background signals were always compara-
ble to background signals observed during direct injection
of zero air without a long inlet line for the m/ z ion peaks
reported in this work. Bearing in mind that the ambient air
(range of ambient temperature: 5–15 ◦C) was drawn in un-
der 25 seconds (residence + sampling time; determined by
spiking the inlet with sesquiterpenes emitted from an orange
peel) into the PTR-TOF-MS, the probability of inlet effects
for sticky compounds is not high. In any case, the part of
the inlet line that was indoors was well insulated and heated
to 40 ◦C all the time to ensure there were no condensation
effects. Instrumental background checks using zero air were
performed at intervals of 3–4 days during the campaign.
Data acquisition of mass spectra was accomplished using
the TofDaq software (version 1.89; Tofwerk AG, Switzer-
land). This software controls the timing of the pulser (used
to pulse the ions produced in the drift tube and chan-
nel them into the time-of-flight region) and stores the raw
data as a series of mass spectra in HDF5 format along
with relevant instrumental metadata. The raw mass spec-
tral data were then analysed using the PTR-MS-viewer soft-
ware (version 3.1; Ionicon Analytic GmbH, Innsbruck, Aus-
tria) enabling peak search, peak fits and mass assignments.
Mass axis calibration was accomplished using the follow-
ing intrinsic ions: H183 O+ (monoisotopic mass 21.022) and
H183 O+ qH2O (monoisotopic mass 39.033). In addition, the
transmission values of benzene (m/ z= 79.054), toluene
(m/ z= 93.070), xylenes (m/ z= 107.086), trimethylben-
zenes (m/ z= 121.101), dichlorobenzene (m/ z= 146.976)
and trichlorobenzene (m/ z= 180.937) were employed. Fur-
ther analysis of the data set was carried out using the IGOR
Pro software (version 6.0; WaveMetrics, Inc.).
The instrument was calibrated twice (10 and 15 January
2013) during the field deployment by dynamic dilution of
VOCs using a 17-component VOC gas standard (Ionimed
Analytik GmbH, Austria at ∼ 1 ppm; stated accuracy bet-
ter than 8 %). Calibration for these seventeen VOCs namely
formaldehyde, methanol, acetonitrile, acetaldehyde, ethanol,
www.atmos-chem-phys.net/16/3979/2016/ Atmos. Chem. Phys., 16, 3979–4003, 2016
3984 C. Sarkar et al.: Wintertime high acetaldehyde, isoprene and isocyanic acid in Kathmandu Valley
acrolein, acetone, isoprene, methacrolein, 2-butanone, ben-
zene, toluene, o-xylene, chlorobenzene, α-pinene, 1, 2-
dichlorobenzene and 1, 2, 4-trichlorobenzene were carried
out in the range of 2–10 ppb at various relative humidities
(RH= 60, 75 and 90 %). RH was controlled as per the de-
tails provided in Kumar and Sinha (2014). In order to deter-
mine the instrumental background at all relevant m/ z chan-
nels, VOC free zero air was produced by passing ambient air
through an activated charcoal scrubber (Supelpure HC, Su-
pelco, Bellemonte, USA) and a VOC scrubber catalyst main-
tained at 350 ◦C (GCU-s 0703, Ionimed Analytik GmbH,
Innsbruck, Austria). Following the procedure of Stockwell
et al. (2015), the measured ion signals were normalised to
H3O+ (m/ z= 19) primary ions according to the following
equation:
ncps=I (RH+)× 106
I (H3O+)×
2
Pdrift
×Tdrift
298.15. (1)
The two calibration experiments made during the course of
the campaign did not show any change in the VOC sensitiv-
ities (values were within the precision error) as instrumental
operational conditions were not changed. Usually, the sen-
sitivity response of VOCs in a PTR-MS remain remarkably
stable if instrumental operational conditions are not changed.
This is supported by several previous studies (de Gouw and
Warneke, 2007) including our own group’s recent studies
in the South Asian environment which involved a 3-year
study (Chandra and Sinha, 2016) and a month-long study
(Sinha et al., 2014). Large changes in ambient humidity are
known to affect the sensitivity of some VOCs (e.g. benzene,
methanol). This occurs due to a change in the abundance and
ratio of the primary reagent ions (H3O+; m/ z= 19) and the
hydrated hydronium ions (H3O+ qH2O; m/ z= 37) within
the drift tube (de Gouw et al., 2003). It assumes importance
when ambient RH has large variability (e.g. very dry < 20 %
RH to very humid > 80 % RH) during the measurements
(e.g. during airborne measurements) and when the ratio of
m37/m19 in the drift tube is typically more than 10 %. For
the measurements reported in this study, the ratio of the hy-
drated hydronium ions (H3O+ qH2O; nominal m/ z= 37) to
the primary ions (H3O+; nominalm/ z= 19) was lower than
10 %, for more than 92 % of the data set and the ratio never
exceeded 16 %. For the conditions during the campaign, our
calibration experiments did not reveal significant humidity
dependence for the VOC sensitivities (ncpsppb−1). More-
over, as reported in de Gouw and Warneke (2007) and Sinha
et al. (2009), it is the absolute humidity content of the sam-
pled air rather than the RH, which is responsible for changes
in detection sensitivity of certain VOCs within the PTR-MS.
The sensitivity dependence has been reported in numerous
studies as function of RH because RH is more frequently
used in meteorology and for no changes/small changes in
temperature, RH is a good proxy of the absolute humid-
ity. We note that during the Kathmandu deployment, while
the RH variability was large (35–100 %) most of the RH
change was on account of changes in the ambient temper-
ature rather than changes in absolute humidity of sampled
air. The variability in the absolute humidity was only in the
range of 20 % between 19 December 2012 and 30 January
2013. Figure 3 shows the sensitivities (ncpsppb−1) for ace-
tonitrile (a biomass burning tracer), acetaldehyde (an oxy-
genated compound), isoprene (a biogenic tracer) and ben-
zene (an aromatic compound) at different RH regimes (60,
75 and 90 %) during the calibration experiments. In all cases
an excellent linearity (r2= 0.99) was observed. Hence the
sensitivity (ncpsppb−1) derived at 90 % RH was applied for
converting the measured normalised counts per second to ppb
and no further humidity corrections were deemed necessary.
In order to derive the sensitivity for the sum of monoter-
penes, which have a molecular ion peak at m/ z= 137.132
and for which fragmentation results in ion signals at m/ z
81.070 and m/ z 137.132, the signal measured at m/ z
137.132 was scaled by 2.63, as calibrations at the instrumen-
tal settings employed in the study clearly showed that 38 % of
the total molecular ion signal for monoterpene was detected
atm/ z= 137.132, consistent with fragmentation patterns re-
ported previously by Tani et al. (2004) for similar reaction
conditions in the drift tube.
Variable background concentrations were observed for
both formaldehyde and methanol while sampling zero air
during the calibration experiments. Hence for these two com-
pounds and all the other compounds not present in the 17-
component VOC gas standard but reported in this work, sen-
sitivity factors were determined following the example of
Stockwell et al. (2015), wherein calculated mass-dependent
calibration factors based on linearly approximated transmis-
sion curve fits for oxygenated VOCs and hydrocarbons were
employed. Figure S1a in the Supplement shows the lin-
early fitted mass-dependent transmission curve (black mark-
ers and dotted line) overlaid with the sensitivity factors of the
calibrated compounds. Using linear approximations, mass-
dependent calibration factors were determined separately for
oxygenates (Fig. S1b in the Supplement) and hydrocarbons
(Fig. S1c in the Supplement) in keeping with their differ-
ent mass-dependent behaviour. For masses with heteroatoms
other than oxygen, mass-dependent sensitivity factors were
determined based on approximations used for the oxygenated
compounds. For acetic acid, the sum of the signals at m/ z
61.207 (parent ion peak) and m/ z 43.018 (fragment of the
parent ion) were used to derive an upper limit for its ambient
concentration.
The limit of detection was defined to be 2σ of the mea-
sured normalised signal (ncps) while measuring VOC free
zero air divided by the sensitivity expressed in ncpsppb−1
(Sinha et al., 2014). The total uncertainty for calibrated com-
pounds was calculated using the root mean square propaga-
tion of the accuracy error of the VOC standard, the mass
flow controller’s flow fluctuations during the calibration and
the instrumental precision error (2σ while measuring 2 ppb
of the compound). Using this approach, all calibrated VOCs
Atmos. Chem. Phys., 16, 3979–4003, 2016 www.atmos-chem-phys.net/16/3979/2016/

C. Sarkar et al.: Wintertime high acetaldehyde, isoprene and isocyanic acid in Kathmandu Valley 3985
Figure 3. Compound specific normalised sensitivities at different relative humidities (RH 60, 75 and 90 %) for acetonitrile, acetaldehyde,
isoprene and benzene during the calibration experiment performed on 10 January 2013. Horizontal bars reflect the error due to the MFC
flows and the accuracy of the VOC gas standard whereas vertical bars reflect the precision error (2σ ) of the measurements.
had a total uncertainty of < 20 % (e.g. acetaldehyde 9.9 %,
acetone 9.6 %, isoprene 15.4 %, benzene 9.4 % and toluene
8.9 %), whereas for the other compounds reported in this
work that could not be calibrated we estimate an overall
uncertainty of ∼ 50 % as also proposed by Stockwell et al.
(2015) using a similar approach for quantification.
3 Results and discussion
3.1 Identification of VOCs present in ambient air using
PTR-TOF-MS mass scans
The PTR-TOF-MS deployed in this study was operated over
the range of 21–210 Th, with a mass resolution (m/1m>
4200 atm/ z= 21.022 and> 4800 atm/ z= 205.195) suffi-
cient to identify several compounds based on their monoiso-
topic masses. A maximum of 71 ion peaks (m/ z) were ob-
served in the mass spectra during the measurement period for
which the measured ambient concentrations exceeded the de-
tection limit. Among these 71 species, 37 compounds/species
had an average concentration greater than or equal to 200 ppt
during the study period. The molecular formula of com-
pounds/species corresponding to these 37 ion peaks are listed
in Table S1 in the Supplement. Additionally Table S1 in
the Supplement also provides the (1) identity of plausible
organic/fragment ions (e.g. NO+2 due to C1–C5 alkyl ni-
trates), (2) sensitivity, (3) limit of detection and (4) average
±1σ variability of ambient mixing ratios observed during the
study period.
In order to minimise ambiguity arising due to multiple
species or fragment ions contributing to ion peaks at a given
m/ z ratio, the following quality control measures were em-
ployed for attribution of mass identifications to the observed
ion peaks. (1) Ion peaks for which the observed mass spec-
tra had competing/major shoulder peaks in a mass bin width
of 0.005 amu centred at the relevant monoisotopic ion peak
were excluded from exclusive mass assignments. (2) Next,
the ambient time series of the observed ion peak assigned
after step 1 was carefully examined and cases where the
concentration profile was completely flat/showed no ambient
variability were also excluded from mass assignments. (3)
Finally, the concentration profiles of the ion peaks ascribed
to rarely reported or new compounds after step 1 and step 2
were compared to the ambient time series and diel profiles
www.atmos-chem-phys.net/16/3979/2016/ Atmos. Chem. Phys., 16, 3979–4003, 2016
3986 C. Sarkar et al.: Wintertime high acetaldehyde, isoprene and isocyanic acid in Kathmandu Valley
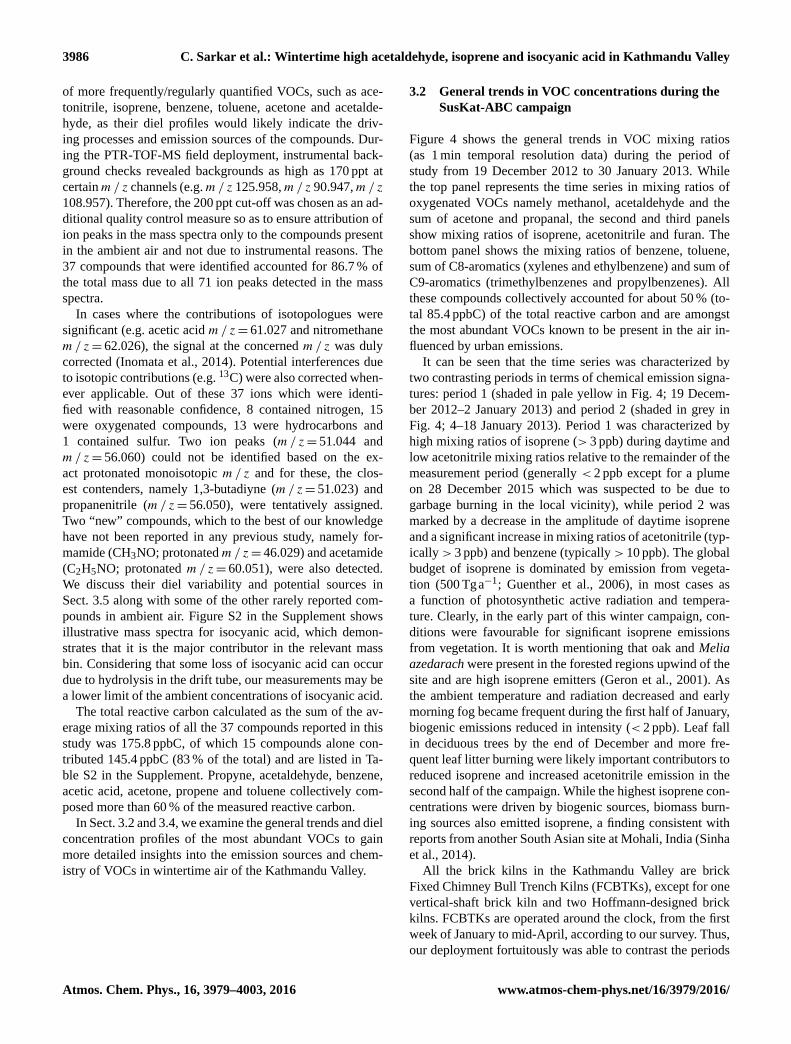
of more frequently/regularly quantified VOCs, such as ace-
tonitrile, isoprene, benzene, toluene, acetone and acetalde-
hyde, as their diel profiles would likely indicate the driv-
ing processes and emission sources of the compounds. Dur-
ing the PTR-TOF-MS field deployment, instrumental back-
ground checks revealed backgrounds as high as 170 ppt at
certainm/ z channels (e.g.m/ z 125.958,m/ z 90.947,m/ z
108.957). Therefore, the 200 ppt cut-off was chosen as an ad-
ditional quality control measure so as to ensure attribution of
ion peaks in the mass spectra only to the compounds present
in the ambient air and not due to instrumental reasons. The
37 compounds that were identified accounted for 86.7 % of
the total mass due to all 71 ion peaks detected in the mass
spectra.
In cases where the contributions of isotopologues were
significant (e.g. acetic acid m/ z= 61.027 and nitromethane
m/ z= 62.026), the signal at the concerned m/ z was duly
corrected (Inomata et al., 2014). Potential interferences due
to isotopic contributions (e.g. 13C) were also corrected when-
ever applicable. Out of these 37 ions which were identi-
fied with reasonable confidence, 8 contained nitrogen, 15
were oxygenated compounds, 13 were hydrocarbons and
1 contained sulfur. Two ion peaks (m/ z= 51.044 and
m/ z= 56.060) could not be identified based on the ex-
act protonated monoisotopic m/ z and for these, the clos-
est contenders, namely 1,3-butadiyne (m/ z= 51.023) and
propanenitrile (m/ z= 56.050), were tentatively assigned.
Two “new” compounds, which to the best of our knowledge
have not been reported in any previous study, namely for-
mamide (CH3NO; protonatedm/ z= 46.029) and acetamide
(C2H5NO; protonated m/ z= 60.051), were also detected.
We discuss their diel variability and potential sources in
Sect. 3.5 along with some of the other rarely reported com-
pounds in ambient air. Figure S2 in the Supplement shows
illustrative mass spectra for isocyanic acid, which demon-
strates that it is the major contributor in the relevant mass
bin. Considering that some loss of isocyanic acid can occur
due to hydrolysis in the drift tube, our measurements may be
a lower limit of the ambient concentrations of isocyanic acid.
The total reactive carbon calculated as the sum of the av-
erage mixing ratios of all the 37 compounds reported in this
study was 175.8 ppbC, of which 15 compounds alone con-
tributed 145.4 ppbC (83 % of the total) and are listed in Ta-
ble S2 in the Supplement. Propyne, acetaldehyde, benzene,
acetic acid, acetone, propene and toluene collectively com-
posed more than 60 % of the measured reactive carbon.
In Sect. 3.2 and 3.4, we examine the general trends and diel
concentration profiles of the most abundant VOCs to gain
more detailed insights into the emission sources and chem-
istry of VOCs in wintertime air of the Kathmandu Valley.
3.2 General trends in VOC concentrations during the
SusKat-ABC campaign
Figure 4 shows the general trends in VOC mixing ratios
(as 1 min temporal resolution data) during the period of
study from 19 December 2012 to 30 January 2013. While
the top panel represents the time series in mixing ratios of
oxygenated VOCs namely methanol, acetaldehyde and the
sum of acetone and propanal, the second and third panels
show mixing ratios of isoprene, acetonitrile and furan. The
bottom panel shows the mixing ratios of benzene, toluene,
sum of C8-aromatics (xylenes and ethylbenzene) and sum of
C9-aromatics (trimethylbenzenes and propylbenzenes). All
these compounds collectively accounted for about 50 % (to-
tal 85.4 ppbC) of the total reactive carbon and are amongst
the most abundant VOCs known to be present in the air in-
fluenced by urban emissions.
It can be seen that the time series was characterized by
two contrasting periods in terms of chemical emission signa-
tures: period 1 (shaded in pale yellow in Fig. 4; 19 Decem-
ber 2012–2 January 2013) and period 2 (shaded in grey in
Fig. 4; 4–18 January 2013). Period 1 was characterized by
high mixing ratios of isoprene (> 3 ppb) during daytime and
low acetonitrile mixing ratios relative to the remainder of the
measurement period (generally < 2 ppb except for a plume
on 28 December 2015 which was suspected to be due to
garbage burning in the local vicinity), while period 2 was
marked by a decrease in the amplitude of daytime isoprene
and a significant increase in mixing ratios of acetonitrile (typ-
ically > 3 ppb) and benzene (typically > 10 ppb). The global
budget of isoprene is dominated by emission from vegeta-
tion (500 Tga−1; Guenther et al., 2006), in most cases as
a function of photosynthetic active radiation and tempera-
ture. Clearly, in the early part of this winter campaign, con-
ditions were favourable for significant isoprene emissions
from vegetation. It is worth mentioning that oak and Melia
azedarach were present in the forested regions upwind of the
site and are high isoprene emitters (Geron et al., 2001). As
the ambient temperature and radiation decreased and early
morning fog became frequent during the first half of January,
biogenic emissions reduced in intensity (< 2 ppb). Leaf fall
in deciduous trees by the end of December and more fre-
quent leaf litter burning were likely important contributors to
reduced isoprene and increased acetonitrile emission in the
second half of the campaign. While the highest isoprene con-
centrations were driven by biogenic sources, biomass burn-
ing sources also emitted isoprene, a finding consistent with
reports from another South Asian site at Mohali, India (Sinha
et al., 2014).
All the brick kilns in the Kathmandu Valley are brick
Fixed Chimney Bull Trench Kilns (FCBTKs), except for one
vertical-shaft brick kiln and two Hoffmann-designed brick
kilns. FCBTKs are operated around the clock, from the first
week of January to mid-April, according to our survey. Thus,
our deployment fortuitously was able to contrast the periods
Atmos. Chem. Phys., 16, 3979–4003, 2016 www.atmos-chem-phys.net/16/3979/2016/
C. Sarkar et al.: Wintertime high acetaldehyde, isoprene and isocyanic acid in Kathmandu Valley 3987
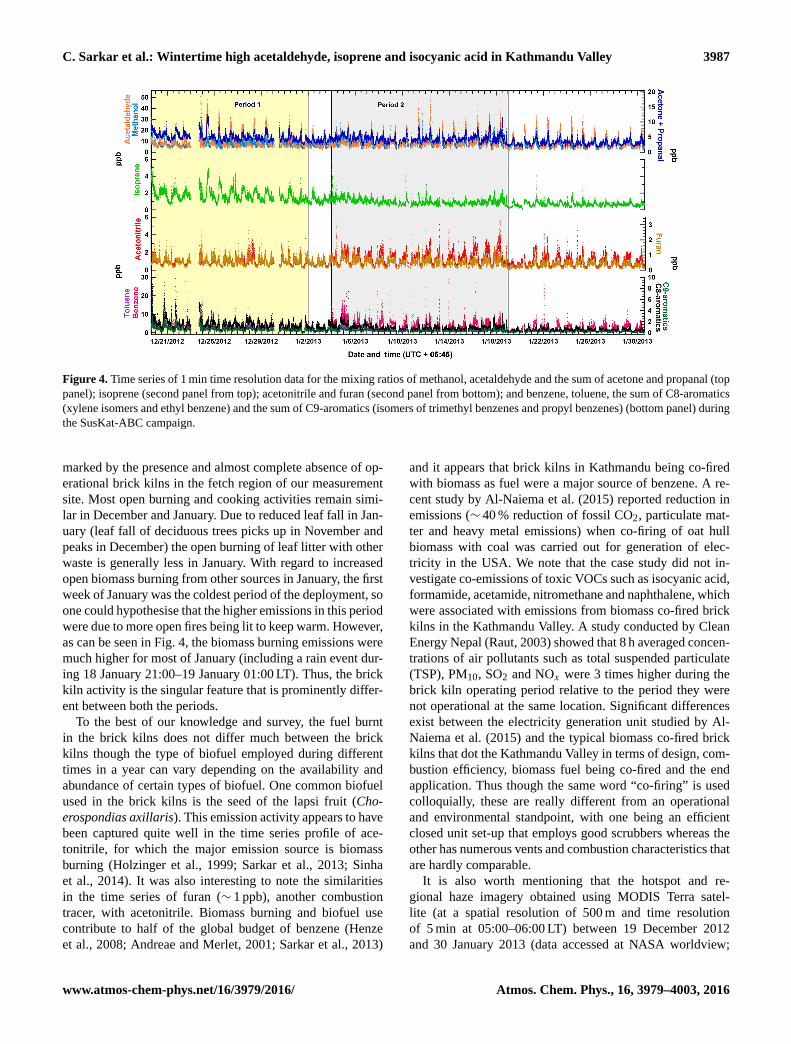
Figure 4. Time series of 1 min time resolution data for the mixing ratios of methanol, acetaldehyde and the sum of acetone and propanal (top
panel); isoprene (second panel from top); acetonitrile and furan (second panel from bottom); and benzene, toluene, the sum of C8-aromatics
(xylene isomers and ethyl benzene) and the sum of C9-aromatics (isomers of trimethyl benzenes and propyl benzenes) (bottom panel) during
the SusKat-ABC campaign.
marked by the presence and almost complete absence of op-
erational brick kilns in the fetch region of our measurement
site. Most open burning and cooking activities remain simi-
lar in December and January. Due to reduced leaf fall in Jan-
uary (leaf fall of deciduous trees picks up in November and
peaks in December) the open burning of leaf litter with other
waste is generally less in January. With regard to increased
open biomass burning from other sources in January, the first
week of January was the coldest period of the deployment, so
one could hypothesise that the higher emissions in this period
were due to more open fires being lit to keep warm. However,
as can be seen in Fig. 4, the biomass burning emissions were
much higher for most of January (including a rain event dur-
ing 18 January 21:00–19 January 01:00 LT). Thus, the brick
kiln activity is the singular feature that is prominently differ-
ent between both the periods.
To the best of our knowledge and survey, the fuel burnt
in the brick kilns does not differ much between the brick
kilns though the type of biofuel employed during different
times in a year can vary depending on the availability and
abundance of certain types of biofuel. One common biofuel
used in the brick kilns is the seed of the lapsi fruit (Cho-
erospondias axillaris). This emission activity appears to have
been captured quite well in the time series profile of ace-
tonitrile, for which the major emission source is biomass
burning (Holzinger et al., 1999; Sarkar et al., 2013; Sinha
et al., 2014). It was also interesting to note the similarities
in the time series of furan (∼ 1 ppb), another combustion
tracer, with acetonitrile. Biomass burning and biofuel use
contribute to half of the global budget of benzene (Henze
et al., 2008; Andreae and Merlet, 2001; Sarkar et al., 2013)
and it appears that brick kilns in Kathmandu being co-fired
with biomass as fuel were a major source of benzene. A re-
cent study by Al-Naiema et al. (2015) reported reduction in
emissions (∼ 40 % reduction of fossil CO2, particulate mat-
ter and heavy metal emissions) when co-firing of oat hull
biomass with coal was carried out for generation of elec-
tricity in the USA. We note that the case study did not in-
vestigate co-emissions of toxic VOCs such as isocyanic acid,
formamide, acetamide, nitromethane and naphthalene, which
were associated with emissions from biomass co-fired brick
kilns in the Kathmandu Valley. A study conducted by Clean
Energy Nepal (Raut, 2003) showed that 8 h averaged concen-
trations of air pollutants such as total suspended particulate
(TSP), PM10, SO2 and NOx were 3 times higher during the
brick kiln operating period relative to the period they were
not operational at the same location. Significant differences
exist between the electricity generation unit studied by Al-
Naiema et al. (2015) and the typical biomass co-fired brick
kilns that dot the Kathmandu Valley in terms of design, com-
bustion efficiency, biomass fuel being co-fired and the end
application. Thus though the same word “co-firing” is used
colloquially, these are really different from an operational
and environmental standpoint, with one being an efficient
closed unit set-up that employs good scrubbers whereas the
other has numerous vents and combustion characteristics that
are hardly comparable.
It is also worth mentioning that the hotspot and re-
gional haze imagery obtained using MODIS Terra satel-
lite (at a spatial resolution of 500 m and time resolution
of 5 min at 05:00–06:00 LT) between 19 December 2012
and 30 January 2013 (data accessed at NASA worldview;
www.atmos-chem-phys.net/16/3979/2016/ Atmos. Chem. Phys., 16, 3979–4003, 2016
3988 C. Sarkar et al.: Wintertime high acetaldehyde, isoprene and isocyanic acid in Kathmandu Valley
http://worldview.earthdata.nasa.gov/) were similar except for
a 6-day period (12–17 January 2013), wherein the regional
haze was stronger. We note that calmer meteorological con-
ditions could be a potential contributory factor for stronger
haze in this period. The MODIS satellite image did not de-
tect any active fire counts (at greater than 85 % confidence
limit) over the Kathmandu Valley (latitude 27.7 ◦N) during
the whole campaign period (19 December 2012–30 January
2013). Thus, the higher chemical concentrations observed
from 4 to 18 January and even later appear to be linked to
the re-start of the biomass co-fired brick kilns and cannot be
explained by linkages with regional haze or increased open
burning of biomass, considering the available evidence. We
analyse the diel profiles for the two contrasting periods and
some of these aspects in detail in Sect. 3.4.
In the time series it can also be seen that 19 January
2013 was characterized by the lowest VOC concentrations
because of an intense rain event during the previous night.
When considering the entire study period, high concen-
trations of OVOCs were typically observed in the early
morning hours between 08:00 and 10:00 LT and, surpris-
ingly, acetaldehyde, which is the most reactive VOC among
the OVOCs, frequently reached concentrations as high as
40 ppb. In contrast methanol and the sum of acetone and
propanal were generally below 20 and 10 ppb respectively.
Peak acetaldehyde concentrations of about 30–40 ppb
were observed in the time series. These often correlated
with peaks in the concentrations of acetonitrile and furan
(chemical tracers for combustion) between 4 January 2013
and 30 January 2013 and occasionally with peaks in daytime
isoprene concentrations before 2 January 2013. Biomass
burning sources and photooxidation of precursor compounds
co-emitted from the biomass burning appear to contribute
significantly to the high concentrations of oxygenated VOCs.
This points to the fact that the major sources of oxygenated
VOCs during wintertime in Kathmandu are different from
what are generally considered to be the most important
sources based on studies conducted in several other regions
of the world, where photooxidation and industrial sources
dominate and have large implications for wintertime oxi-
dation chemistry in the valley, as these species play a key
role in radical chemistry (Singh et al., 1995). For example,
the observed ranking in oxygenated VOCs is different from
the ranking observed during wintertime in megacities like
Paris and London (methanol> acetaldehyde> acetone)
(Dolgorouky et al., 2012; Langford et al., 2010). Fur-
thermore the ranking observed for aromatic VOCs
during this study (benzene> toluene> sum of C8-
aromatics> sum of C9-aromatics) was in contrast to the
ranking (toluene> benzene> sum of C8-aromatics> sum
of C9-aromatics) observed in several urban sites such as
Paris, London and Tokyo (Dolgorouky et al., 2012; Langford
et al., 2010; Yoshino et al., 2012). This exemplifies that
the nature and strength of emission sources for oxygenated
and aromatic VOCs in the Kathmandu Valley differ from
several urban areas in other parts of the world. Biomass
burning sources and the manner in which regulation of
benzene occurs are likely the major causes for the observed
differences.
3.3 Comparison with wintertime VOC mixing ratios
elsewhere
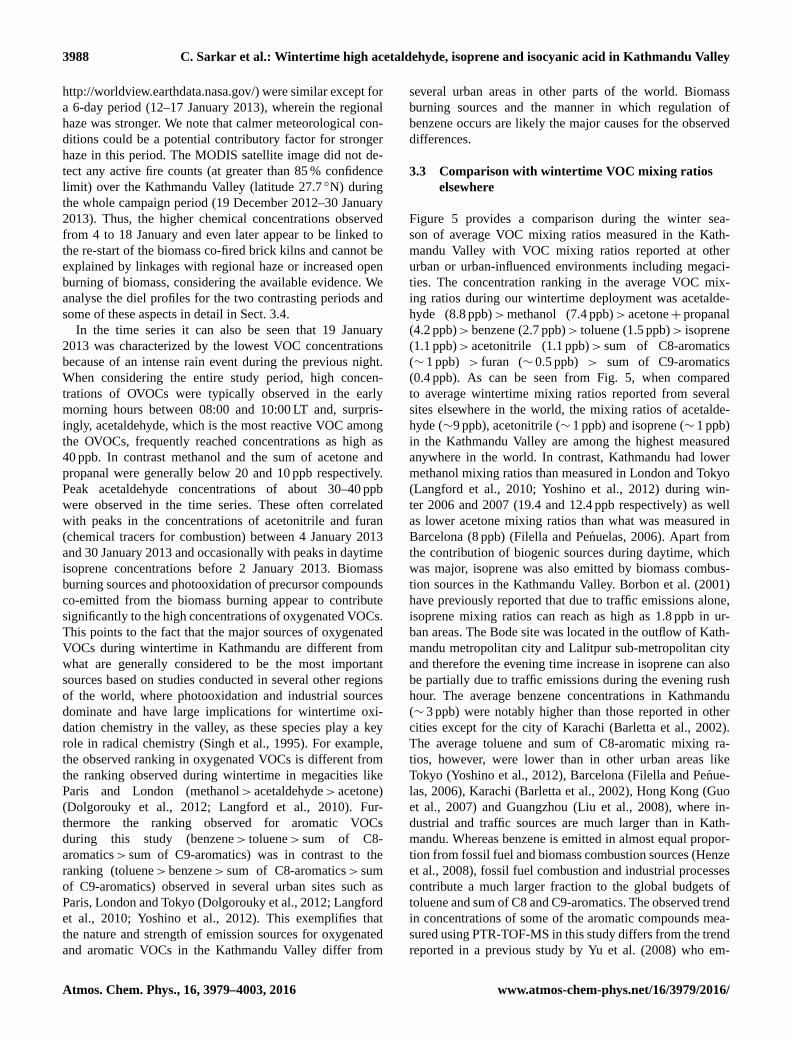
Figure 5 provides a comparison during the winter sea-
son of average VOC mixing ratios measured in the Kath-
mandu Valley with VOC mixing ratios reported at other
urban or urban-influenced environments including megaci-
ties. The concentration ranking in the average VOC mix-
ing ratios during our wintertime deployment was acetalde-
hyde (8.8 ppb)>methanol (7.4 ppb)> acetone+ propanal
(4.2 ppb)> benzene (2.7 ppb)> toluene (1.5 ppb)> isoprene
(1.1 ppb)> acetonitrile (1.1 ppb)> sum of C8-aromatics
(∼ 1 ppb) > furan (∼ 0.5 ppb) > sum of C9-aromatics
(0.4 ppb). As can be seen from Fig. 5, when compared
to average wintertime mixing ratios reported from several
sites elsewhere in the world, the mixing ratios of acetalde-
hyde (∼9 ppb), acetonitrile (∼ 1 ppb) and isoprene (∼ 1 ppb)
in the Kathmandu Valley are among the highest measured
anywhere in the world. In contrast, Kathmandu had lower
methanol mixing ratios than measured in London and Tokyo
(Langford et al., 2010; Yoshino et al., 2012) during win-
ter 2006 and 2007 (19.4 and 12.4 ppb respectively) as well
as lower acetone mixing ratios than what was measured in
Barcelona (8 ppb) (Filella and Penuelas, 2006). Apart from
the contribution of biogenic sources during daytime, which
was major, isoprene was also emitted by biomass combus-
tion sources in the Kathmandu Valley. Borbon et al. (2001)
have previously reported that due to traffic emissions alone,
isoprene mixing ratios can reach as high as 1.8 ppb in ur-
ban areas. The Bode site was located in the outflow of Kath-
mandu metropolitan city and Lalitpur sub-metropolitan city
and therefore the evening time increase in isoprene can also
be partially due to traffic emissions during the evening rush
hour. The average benzene concentrations in Kathmandu
(∼ 3 ppb) were notably higher than those reported in other
cities except for the city of Karachi (Barletta et al., 2002).
The average toluene and sum of C8-aromatic mixing ra-
tios, however, were lower than in other urban areas like
Tokyo (Yoshino et al., 2012), Barcelona (Filella and Penue-
las, 2006), Karachi (Barletta et al., 2002), Hong Kong (Guo
et al., 2007) and Guangzhou (Liu et al., 2008), where in-
dustrial and traffic sources are much larger than in Kath-
mandu. Whereas benzene is emitted in almost equal propor-
tion from fossil fuel and biomass combustion sources (Henze
et al., 2008), fossil fuel combustion and industrial processes
contribute a much larger fraction to the global budgets of
toluene and sum of C8 and C9-aromatics. The observed trend
in concentrations of some of the aromatic compounds mea-
sured using PTR-TOF-MS in this study differs from the trend
reported in a previous study by Yu et al. (2008) who em-
Atmos. Chem. Phys., 16, 3979–4003, 2016 www.atmos-chem-phys.net/16/3979/2016/
C. Sarkar et al.: Wintertime high acetaldehyde, isoprene and isocyanic acid in Kathmandu Valley 3989
Figure 5. Comparison of wintertime VOC mixing ratios measured in the Kathmandu Valley with wintertime VOC mixing ratios at selected
urban sites elsewhere in the world.
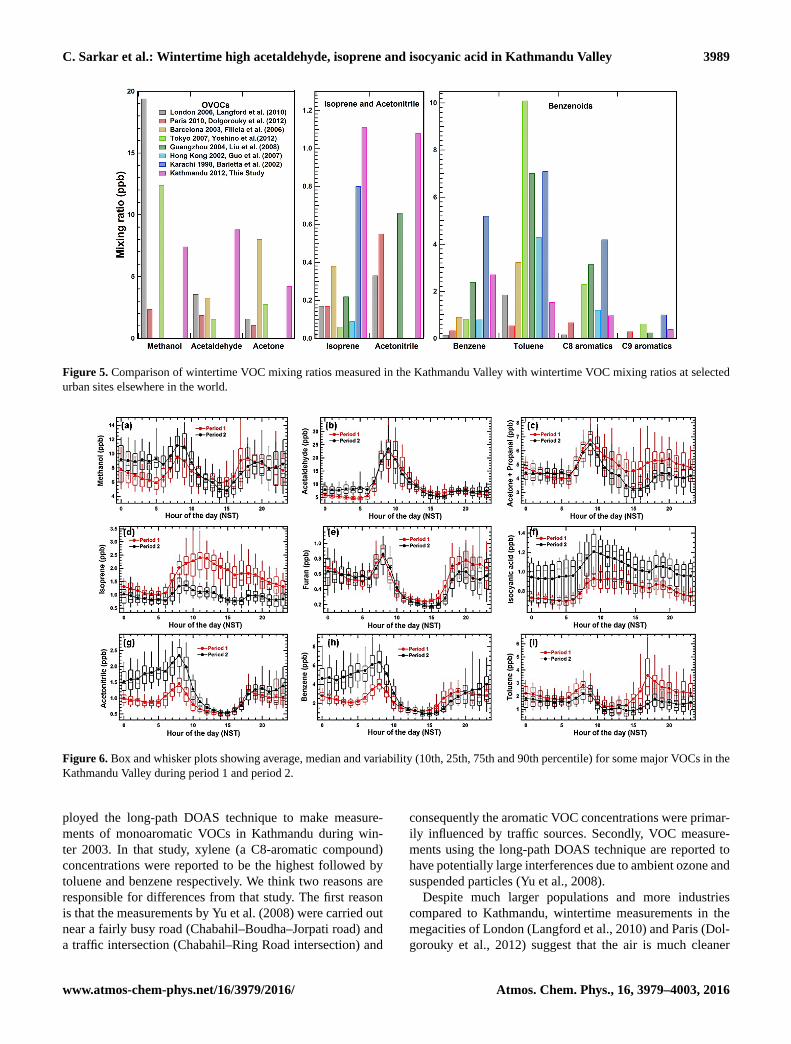
Figure 6. Box and whisker plots showing average, median and variability (10th, 25th, 75th and 90th percentile) for some major VOCs in the
Kathmandu Valley during period 1 and period 2.
ployed the long-path DOAS technique to make measure-
ments of monoaromatic VOCs in Kathmandu during win-
ter 2003. In that study, xylene (a C8-aromatic compound)
concentrations were reported to be the highest followed by
toluene and benzene respectively. We think two reasons are
responsible for differences from that study. The first reason
is that the measurements by Yu et al. (2008) were carried out
near a fairly busy road (Chabahil–Boudha–Jorpati road) and
a traffic intersection (Chabahil–Ring Road intersection) and
consequently the aromatic VOC concentrations were primar-
ily influenced by traffic sources. Secondly, VOC measure-
ments using the long-path DOAS technique are reported to
have potentially large interferences due to ambient ozone and
suspended particles (Yu et al., 2008).
Despite much larger populations and more industries
compared to Kathmandu, wintertime measurements in the
megacities of London (Langford et al., 2010) and Paris (Dol-
gorouky et al., 2012) suggest that the air is much cleaner
www.atmos-chem-phys.net/16/3979/2016/ Atmos. Chem. Phys., 16, 3979–4003, 2016

3990 C. Sarkar et al.: Wintertime high acetaldehyde, isoprene and isocyanic acid in Kathmandu Valley
for many of the VOCs shown in Fig. 5. The combination of
the topography of Kathmandu (which results in suppressed
ventilation) and the anthropogenic and biogenic emissions
within the valley appear to cause high ambient wintertime
concentrations for several VOCs (e.g. acetonitrile, acetalde-
hyde, benzene and isoprene).
3.4 Diel profiles as a tool to constrain emission sources:
VOCs emitted from biomass burning activities in
the Kathmandu Valley
In order to contrast the role of diverse emission sources dur-
ing period 1 and period 2, we analysed the diel profiles of
a number of VOCs. These are shown in Fig. 6 as box and
whisker plots for period 1 (derived from total number of mea-
surements > 20 500) and period 2 (derived from total num-
ber of measurements > 21 500) for methanol, acetaldehyde,
sum of acetone and propanal, isoprene, furan, isocyanic acid,
acetonitrile, benzene and toluene. The time stamp is the start
time of respective hourly data bin (e.g. 9 for data averaged
between 9 and 10).
We note that the concentrations of acetonitrile (a chemi-
cal tracer for biomass combustion), methanol, benzene and
isocyanic acid are significantly higher in period 2 relative
to period 1, indicating that for all of them, the biomass co-
fired brick kilns that became operational in the first week
of January and other forms of biomass burning (e.g. leaves
and branches, garden waste and garbage) were major con-
tributory sources. In contrast, isoprene and toluene concen-
trations were markedly higher during period 1 as compared
to period 2. Acetaldehyde and furan did not differ much be-
tween period 1 and period 2. The high acetaldehyde concen-
trations suggest the possibility of high levels of peroxy acetyl
nitrate. The campaign average concentration of 1.08 ppb ob-
served at m/ z 45.990 and attributed to NO+2 (Table S1 in
the Supplement), which is a fragment ion of C1–C5 alkyl ni-
trates (Aoki et al., 2007), appears to be consistent with the
presence of a large pool of gaseous organic nitrate species
too. Except for isoprene, isocyanic acid and acetaldehyde,
which did not show a marked bimodal profile (morning and
evening maxima), all the other VOCs shown in Fig. 6 exhib-
ited bimodal diel profiles to some degree, indicating the com-
mon influence of urban emission activities and biomass com-
bustion sources for these compounds. Bimodal profiles for
VOCs have previously been reported from several sites in-
fluenced by urban emissions (Staehelin et al., 1998; Stemm-
ler et al., 2005), including our recent work in Mohali, India
(Sinha et al., 2014), another site in South Asia that is some-
what closer to Kathmandu in terms of emission sources. Such
bimodal profiles typically arise because morning and evening
emissions get mixed into a shallow boundary layer, while
the afternoon emissions are diluted under a rapidly growing
boundary layer due to the surface heat flux, giving rise to
a daytime minima in the diel profile. This holds for VOCs
which are not formed photochemically or emitted anoma-
lously during the daytime in large measure. Thus, bimodal
diel profiles were not observed for isoprene which is emit-
ted by terrestrial vegetation during daytime, and acetalde-
hyde and isocyanic acid, which are known to be emitted from
biomass fires and produced photochemically from precursor
compounds (Millet et al., 2010; Roberts et al., 2014). In gen-
eral, for both period 1 and period 2, the features of diel pro-
files in terms of rise and fall of concentrations are similar
for all the VOCs shown in Fig. 6. The diel profiles of all
VOCs also reveal that, at about 06:00 LT, emission activities
pertaining to cooking (use of biofuel and fossil fuel such as
liquefied petroleum gas) and traffic pick up, which in combi-
nation with the brick kiln emissions appears to drive the diel
peaks for almost all VOCs occur at around 08:00–09:00 LT.
In addition to the typical boundary layer dynamics and
emissions driving concentration profiles, the mountain mete-
orology appears to play a key role in the concentration peaks
observed after sunrise around 08:00–09:00 LT. If one exam-
ines the diel pattern for wind speed, wind direction, temper-
ature and solar radiation data (available for part of the study
and shown in Fig. 2b), it is clear that the diel meteorologi-
cal conditions (e.g. surface wind flow, direction, temperature,
RH) were very consistent even on different days as there is
a very narrow spread in the values for each hour and the av-
erage and median always converged. The wind speeds were
typically lower than 1 ms−1 for almost all hours of the day
except between 10:00 and 16:00 LT, when westerly winds
from the mountain passes lying west of the site swept across
the valley, attaining wind speeds of 3–4 ms−1 and causing
rapid venting and dilution. The wind direction was very con-
sistent on daily timescales. During the evening and at night,
the horizontal wind flow was mainly from the south-east di-
rection, which changed to a westerly flow during the day.
Downslope mountain winds during nighttime result in pool-
ing of cleaner cold air. Then shortly after sunrise, convec-
tive mixing of surface air with residual air commences the
growth of the well-mixed daytime boundary layer (Panday
and Prinn, 2009).
The highest mixing ratios for acetaldehyde (average value
of ∼ 25 ppb for both period 1 and period 2) and acetone (av-
erage value of ∼ 7 ppb for both period 1 and period 2) and
indeed for most of the other VOCs were observed during
morning hours about 1 h after sunrise (09:00–10:00 LT). The
breaking of the nocturnal boundary layer and entrainment
of air masses rich in accumulated oxygenated VOCs, which
were displaced by cold air from the mountain slopes after
midnight, contribute towards the peaks observed in all VOCs
between 09:00 and 10:00 LT. In mountain basins such as the
Kathmandu Valley, katabatic winds are generated at night
due to radiative cooling of mountains that lead to pooling of
cold air to the valley bottom (Fig. 2a). Due to this katabatic
flow, less cold and less dense air parcels in the valley bot-
tom containing the entire valley’s surface emissions rise up-
ward during nighttime, while relatively clean cold air parcels
flow underneath. After sunrise, downward mixing of the up-
Atmos. Chem. Phys., 16, 3979–4003, 2016 www.atmos-chem-phys.net/16/3979/2016/
C. Sarkar et al.: Wintertime high acetaldehyde, isoprene and isocyanic acid in Kathmandu Valley 3991
lifted accumulated VOCs occurs with new surface emissions,
as a growing mixed layer entrains the elevated layers of the
polluted air. Therefore during morning hours, mixing of oxy-
genated VOCs and their precursors, which had accumulated
during nighttime and the kickstart to their photochemical
production after sunrise, contributes to sharp peaks (e.g. for
acetaldehyde and acetone). It should also be noted that the
majority of the population in Kathmandu Valley cook their
main meals in the morning and evening hours using fuel such
as liquefied petroleum gas, kerosene and firewood (Panday
et al., 2009).
Contributions from biogenic sources and oxidation of
alkenes to acetaldehyde are also important. The reaction
of oxygenated VOCs like ethanol and methyl ethyl ketone
with hydroxyl (OH) radicals and the reaction of tropospheric
ozone (O3) with alkenes can significantly contribute to pho-
tochemical formation of acetaldehyde (Sommariva et al.,
2011; Grosjean et al., 1994). After the morning peak (09:00–
10:00 LT), a sharp decrease was observed in the average
acetaldehyde mixing ratios (from ∼ 25 to ∼ 8 ppb during
10:00–13:00 LT) relative to methanol and acetone, which is
not surprising considering its much higher OH reactivity.
The highest isoprene concentrations were observed during
daytime for both period 1 and period 2 but the average con-
centrations were much higher during period 1 when ambient
temperature and solar radiation were comparatively higher
and deciduous trees had not shed much of their leaves. This
clearly points to daytime biogenic emission sources of iso-
prene in the Kathmandu Valley. In Sect. 3.6 we investigate
the spatial and temporal location of the biogenic sources. We
note that while the isoprene emission profile was dominated
by biogenic sources, biomass burning (Christian et al., 2003;
Andreae and Merlet, 2001; Warneke et al., 2011) and traf-
fic (Borbon et al., 2001) also contributed to the ambient iso-
prene as can be seen from the nighttime peaks and discussed
in previous sections. Thus, the contribution of both biogenic
and anthropogenic sources resulted in high isoprene even in
winter in the Kathmandu Valley, which is different from what
has been observed at high-latitude sites in winter (Seco et al.,
2011).
Apart from the biomass burning practices typical of de-
veloping regions of the world, the brick kilns in the Kath-
mandu Valley burn not only coal but also large quantities of
wood and crop residues, ca. 90 t per month per brick factory
(Stone et al., 2010; Rupakheti et al., 2016), which can emit
acetonitrile and benzene (Sarkar et al., 2013). Both acetoni-
trile and benzene levels were much higher during nighttime
and morning hours in period 2 as compared to period 1 due
to more intense biomass burning in period 2. During 08:00–
09:00 LT (when the highest ambient acetonitrile and benzene
were observed), average mixing ratios were approximately
1 and 2 ppb higher for acetonitrile and benzene respectively
during period 2 relative to period 1.
Unlike acetonitrile and benzene, toluene concentrations
were higher during period 1 in comparison to period 2. De-
spite the dilution effect of cold air descending from the
mountain slopes, benzene concentrations increased during
the night in period 2, whereas toluene concentrations did not
show any increase during the night in both period 1 and pe-
riod 2, suggesting that biofuel and biomass burning sources
(including the brick kilns co-fired with biomass) and not traf-
fic were the driving factors responsible for nighttime increase
in benzene during period 2, probably due to varied forms
of biomass combustion, including the biomass co-fired brick
kilns. The emission ratios of benzene/toluene from previous
studies show that, for a wide variety of commonly occurring
fuels, the emission of benzene can be more than twice as high
as the emission of toluene (Tsai et al., 2003; Lemieux et al.,
2004; Stockwell et al., 2015). The use of large number of
diesel generators as an alternative power source in the Kath-
mandu Valley, which suffers from scheduled daily power out-
ages in some quarters of the city, could also have significant
contributions to the observed high mixing ratios for aromatic
VOCs.
To our knowledge, this paper reports the first measure-
ments of isocyanic acid from any site in South Asia. Iso-
cyanic acid has only recently been measured in ambient
air using novel mass spectrometric methods (Roberts et al.,
2011), and much remains to be understood regarding its
sources and sinks in different environments. The high iso-
cyanic acid concentrations observed during the daytime sug-
gest a strong photochemical source from hydroxyl radical
initiated oxidation of alkyl amines and amides with hydroxyl
radicals (Roberts et al., 2011, 2014; Zhao et al., 2014). Iso-
cyanic acid has also been detected in diesel exhaust (Wentzell
et al., 2013), tobacco smoke and wild fires and in emissions
from low-temperature combustion of coal (Nelson et al.,
1996). From the diel profile, it is clear that around evening
time there are primary emissions too, but overall the sec-
ondary source dominates the ambient concentrations of iso-
cyanic acid in this environment. Currently, global models of
isocyanic acid (Young et al., 2012) do not incorporate a pho-
tochemical source. The recent model-based estimates of iso-
cyanic acid (HNCO) by Young et al. (2012) showed annual
mean concentrations of HNCO over the Indo-Gangetic Plain
and Nepal to be in the range of 0.2–0.5 ppb (values read
from Fig. 4 of Young et al., 2012). The average concentra-
tions measured during winter in Kathmandu and in the post-
monsoon season in Mohali were∼1 ppb (Chandra and Sinha,
2016) with clear daytime maxima. Our in situ field data from
the Kathmandu Valley suggest that inclusion of isocyanic
acid’s photochemical sources is necessary for deriving bet-
ter estimates of the global isocyanic acid budget, as these are
likely to be significant over South Asia where biomass burn-
ing and agricultural activities can emit alkyl amines (Roberts
et al., 2011). Serious health impairments can occur upon ex-
posure to isocyanic acid at concentrations greater than 1 ppb,
which occurred during our study for several hours during pe-
riod 2. These health impacts have been previously mentioned
in Roberts et al. (2011) and are also discussed in Sect. 3.9.
www.atmos-chem-phys.net/16/3979/2016/ Atmos. Chem. Phys., 16, 3979–4003, 2016
3992 C. Sarkar et al.: Wintertime high acetaldehyde, isoprene and isocyanic acid in Kathmandu Valley
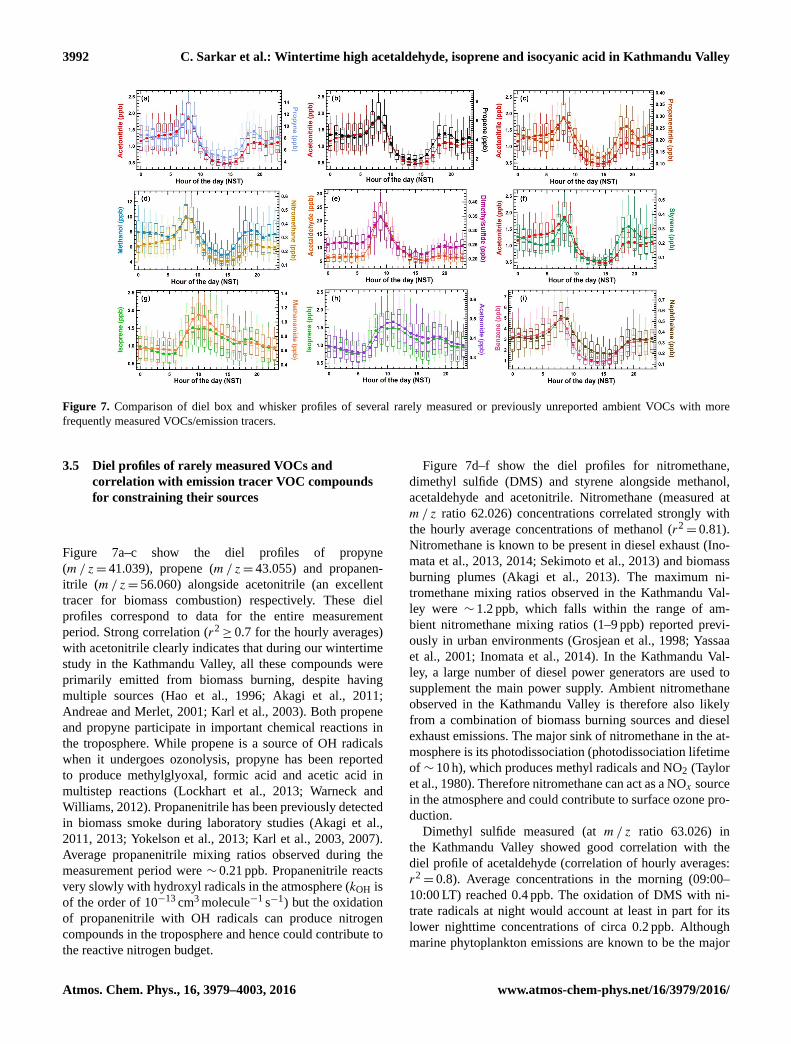
Figure 7. Comparison of diel box and whisker profiles of several rarely measured or previously unreported ambient VOCs with more
frequently measured VOCs/emission tracers.
3.5 Diel profiles of rarely measured VOCs and
correlation with emission tracer VOC compounds
for constraining their sources
Figure 7a–c show the diel profiles of propyne
(m/ z= 41.039), propene (m/ z= 43.055) and propanen-
itrile (m/ z= 56.060) alongside acetonitrile (an excellent
tracer for biomass combustion) respectively. These diel
profiles correspond to data for the entire measurement
period. Strong correlation (r2≥ 0.7 for the hourly averages)
with acetonitrile clearly indicates that during our wintertime
study in the Kathmandu Valley, all these compounds were
primarily emitted from biomass burning, despite having
multiple sources (Hao et al., 1996; Akagi et al., 2011;
Andreae and Merlet, 2001; Karl et al., 2003). Both propene
and propyne participate in important chemical reactions in
the troposphere. While propene is a source of OH radicals
when it undergoes ozonolysis, propyne has been reported
to produce methylglyoxal, formic acid and acetic acid in
multistep reactions (Lockhart et al., 2013; Warneck and
Williams, 2012). Propanenitrile has been previously detected
in biomass smoke during laboratory studies (Akagi et al.,
2011, 2013; Yokelson et al., 2013; Karl et al., 2003, 2007).
Average propanenitrile mixing ratios observed during the
measurement period were ∼ 0.21 ppb. Propanenitrile reacts
very slowly with hydroxyl radicals in the atmosphere (kOH is
of the order of 10−13 cm3 molecule−1 s−1) but the oxidation
of propanenitrile with OH radicals can produce nitrogen
compounds in the troposphere and hence could contribute to
the reactive nitrogen budget.
Figure 7d–f show the diel profiles for nitromethane,
dimethyl sulfide (DMS) and styrene alongside methanol,
acetaldehyde and acetonitrile. Nitromethane (measured at
m/ z ratio 62.026) concentrations correlated strongly with
the hourly average concentrations of methanol (r2= 0.81).
Nitromethane is known to be present in diesel exhaust (Ino-
mata et al., 2013, 2014; Sekimoto et al., 2013) and biomass
burning plumes (Akagi et al., 2013). The maximum ni-
tromethane mixing ratios observed in the Kathmandu Val-
ley were ∼ 1.2 ppb, which falls within the range of am-
bient nitromethane mixing ratios (1–9 ppb) reported previ-
ously in urban environments (Grosjean et al., 1998; Yassaa
et al., 2001; Inomata et al., 2014). In the Kathmandu Val-
ley, a large number of diesel power generators are used to
supplement the main power supply. Ambient nitromethane
observed in the Kathmandu Valley is therefore also likely
from a combination of biomass burning sources and diesel
exhaust emissions. The major sink of nitromethane in the at-
mosphere is its photodissociation (photodissociation lifetime
of ∼ 10 h), which produces methyl radicals and NO2 (Taylor
et al., 1980). Therefore nitromethane can act as a NOx source
in the atmosphere and could contribute to surface ozone pro-
duction.
Dimethyl sulfide measured (at m/ z ratio 63.026) in
the Kathmandu Valley showed good correlation with the
diel profile of acetaldehyde (correlation of hourly averages:
r2= 0.8). Average concentrations in the morning (09:00–
10:00 LT) reached 0.4 ppb. The oxidation of DMS with ni-
trate radicals at night would account at least in part for its
lower nighttime concentrations of circa 0.2 ppb. Although
marine phytoplankton emissions are known to be the major
Atmos. Chem. Phys., 16, 3979–4003, 2016 www.atmos-chem-phys.net/16/3979/2016/
C. Sarkar et al.: Wintertime high acetaldehyde, isoprene and isocyanic acid in Kathmandu Valley 3993
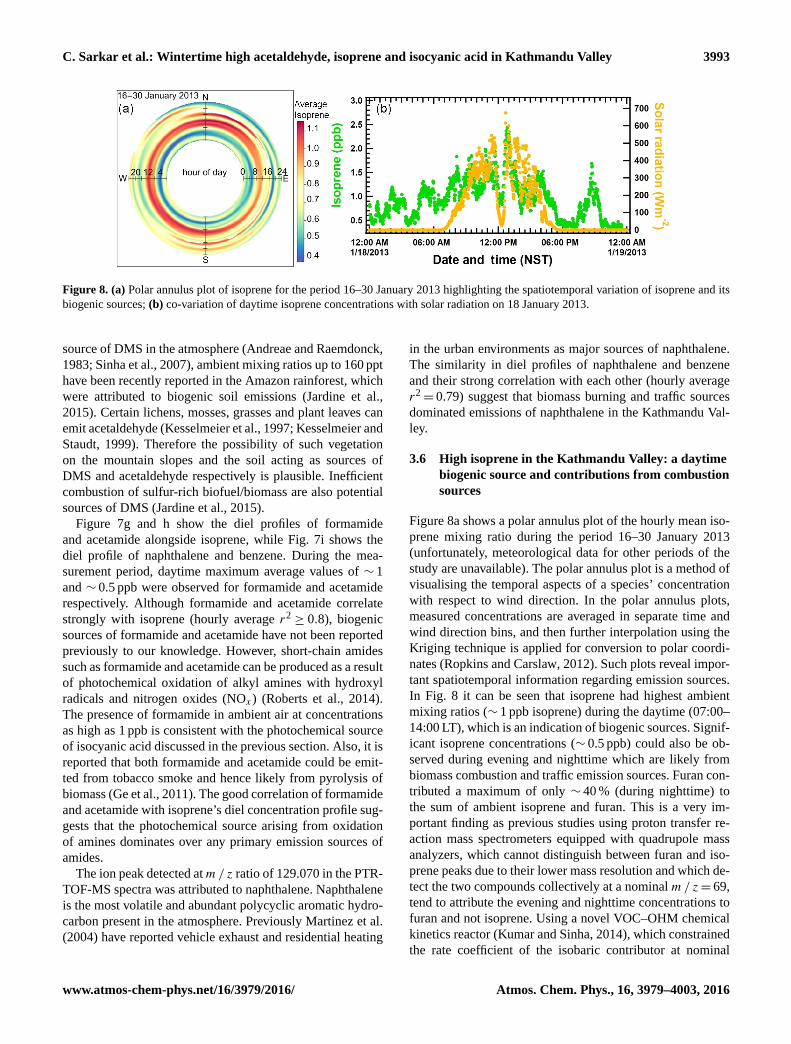
Figure 8. (a) Polar annulus plot of isoprene for the period 16–30 January 2013 highlighting the spatiotemporal variation of isoprene and its
biogenic sources; (b) co-variation of daytime isoprene concentrations with solar radiation on 18 January 2013.
source of DMS in the atmosphere (Andreae and Raemdonck,
1983; Sinha et al., 2007), ambient mixing ratios up to 160 ppt
have been recently reported in the Amazon rainforest, which
were attributed to biogenic soil emissions (Jardine et al.,
2015). Certain lichens, mosses, grasses and plant leaves can
emit acetaldehyde (Kesselmeier et al., 1997; Kesselmeier and
Staudt, 1999). Therefore the possibility of such vegetation
on the mountain slopes and the soil acting as sources of
DMS and acetaldehyde respectively is plausible. Inefficient
combustion of sulfur-rich biofuel/biomass are also potential
sources of DMS (Jardine et al., 2015).
Figure 7g and h show the diel profiles of formamide
and acetamide alongside isoprene, while Fig. 7i shows the
diel profile of naphthalene and benzene. During the mea-
surement period, daytime maximum average values of ∼ 1
and ∼ 0.5 ppb were observed for formamide and acetamide
respectively. Although formamide and acetamide correlate
strongly with isoprene (hourly average r2≥ 0.8), biogenic
sources of formamide and acetamide have not been reported
previously to our knowledge. However, short-chain amides
such as formamide and acetamide can be produced as a result
of photochemical oxidation of alkyl amines with hydroxyl
radicals and nitrogen oxides (NOx) (Roberts et al., 2014).
The presence of formamide in ambient air at concentrations
as high as 1 ppb is consistent with the photochemical source
of isocyanic acid discussed in the previous section. Also, it is
reported that both formamide and acetamide could be emit-
ted from tobacco smoke and hence likely from pyrolysis of
biomass (Ge et al., 2011). The good correlation of formamide
and acetamide with isoprene’s diel concentration profile sug-
gests that the photochemical source arising from oxidation
of amines dominates over any primary emission sources of
amides.
The ion peak detected atm/ z ratio of 129.070 in the PTR-
TOF-MS spectra was attributed to naphthalene. Naphthalene
is the most volatile and abundant polycyclic aromatic hydro-
carbon present in the atmosphere. Previously Martinez et al.
(2004) have reported vehicle exhaust and residential heating
in the urban environments as major sources of naphthalene.
The similarity in diel profiles of naphthalene and benzene
and their strong correlation with each other (hourly average
r2= 0.79) suggest that biomass burning and traffic sources
dominated emissions of naphthalene in the Kathmandu Val-
ley.
3.6 High isoprene in the Kathmandu Valley: a daytime
biogenic source and contributions from combustion
sources
Figure 8a shows a polar annulus plot of the hourly mean iso-
prene mixing ratio during the period 16–30 January 2013
(unfortunately, meteorological data for other periods of the
study are unavailable). The polar annulus plot is a method of
visualising the temporal aspects of a species’ concentration
with respect to wind direction. In the polar annulus plots,
measured concentrations are averaged in separate time and
wind direction bins, and then further interpolation using the
Kriging technique is applied for conversion to polar coordi-
nates (Ropkins and Carslaw, 2012). Such plots reveal impor-
tant spatiotemporal information regarding emission sources.
In Fig. 8 it can be seen that isoprene had highest ambient
mixing ratios (∼ 1 ppb isoprene) during the daytime (07:00–
14:00 LT), which is an indication of biogenic sources. Signif-
icant isoprene concentrations (∼ 0.5 ppb) could also be ob-
served during evening and nighttime which are likely from
biomass combustion and traffic emission sources. Furan con-
tributed a maximum of only ∼ 40 % (during nighttime) to
the sum of ambient isoprene and furan. This is a very im-
portant finding as previous studies using proton transfer re-
action mass spectrometers equipped with quadrupole mass
analyzers, which cannot distinguish between furan and iso-
prene peaks due to their lower mass resolution and which de-
tect the two compounds collectively at a nominal m/ z= 69,
tend to attribute the evening and nighttime concentrations to
furan and not isoprene. Using a novel VOC–OHM chemical
kinetics reactor (Kumar and Sinha, 2014), which constrained
the rate coefficient of the isobaric contributor at nominal
www.atmos-chem-phys.net/16/3979/2016/ Atmos. Chem. Phys., 16, 3979–4003, 2016
3994 C. Sarkar et al.: Wintertime high acetaldehyde, isoprene and isocyanic acid in Kathmandu Valley
m/ z= 69, it has been demonstrated at another South Asian
site in the north-western Indo-Gangetic Plain (Mohali) that
isoprene is the major contributor to m/ z= 69. Thus it ap-
pears that isoprene has significant contributions from both
vegetation and biomass/biofuel burning sources in South
Asia, which has large implications for the atmospheric ox-
idation in this part of the world, as also discussed in Sinha
et al. (2014). While several previous studies have reported
significant contributions from anthropogenic sources to iso-
prene in urban areas elsewhere, especially in winter (Bor-
bon et al., 2001; Barletta et al., 2005; Hellèn et al., 2012),
the in situ measurements from Mohali and Kathmandu sug-
gest that the magnitude of the isoprene source from anthro-
pogenic sources may be quite important regionally in South
Asia. Recently, Gilman et al. (2015) showed that in direct
fire/smoke plumes from prescribed burns of selected biomass
fuels common for the south-eastern, south-western or north-
ern USA, the contributions of pentadienes and cyclopen-
tene to isoprene concentrations measured using a PTR-QMS
can be quite significant. Therefore, contributions from com-
pounds such as pentadienes and cyclopentene to the isoprene
concentrations measured in the Kathmandu Valley during
evening, nighttime or early morning may be significant. The
non-biogenic sources of isoprene acquire greater significance
in the evening, nighttime or early morning when combustion
emissions are more widespread and can accumulate under
shallow inversions.
What is remarkable is that in contrast to wintertime mea-
surements of isoprene from sites elsewhere in the world due
to the strong contribution from biogenic sources in the Kath-
mandu Valley, average wintertime concentrations of isoprene
in Kathmandu were observed to be above 1 ppb (see Fig. 5).
To emphasise that the daytime isoprene concentrations were
primarily controlled by biogenic emissions, we show real-
time data from a day (18 January 2013) when clear co-
variation of the daytime isoprene concentrations occurred
with changes in the solar radiation (Fig. 8b).
High values of isoprene were generally observed from
the western and northern sectors (north-north-east where Nil
Barahi jungle and Gokarna reserve forest are located) and at
appreciable wind speeds (> 3 ms−1). The advection of air
across the valley in the afternoon as they flow through the
mountain passes from west to east due to the high-speed
westerly winds has been previously described by Panday
and Prinn (2009). The forest areas on the mountain slopes
appear to contribute to the high ambient isoprene concen-
trations measured during the afternoon hours. The average
daytime (08:00–17:00 LT) isoprene concentrations observed
during SusKat-ABC campaign (1.35 ppb) are comparable
to the concentrations measured in south-east Asian tropical
rainforest sites (Bryan et al., 2012; Jones et al., 2011). As
mentioned in the site description section, the forested areas
contained tree species like oak and Melia azedarach which
have significant isoprene emission potentials (350 µg g−1 dry
leaf h−1 and 4.7 µgg−1 dry leaf h−1 respectively; Simon
et al., 2005; Padhy and Varshney, 2005). In Sect. 3.7 we ex-
amine the importance of VOCs measured during this study
in terms of their OH reactivity contributions and ozone for-
mation potential.
3.7 OH reactivity and ozone production potential of
VOCs
The oxidation of VOCs (and consequently their removal rate)
depends on the reactivity of VOCs with both ozone and hy-
droxyl radicals during daytime and the nitrate radical dur-
ing nighttime. For most of the VOCs reported in this work
and the typical maximum ozone concentrations observed
during winter in the Kathmandu Valley (∼60–70 ppb; Put-
ero et al., 2015), the daytime oxidation with hydroxyl radi-
cals is much faster relative to daytime oxidation with ozone
and nighttime oxidation with nitrate radicals as kVOC+OH >
kVOC+NO3> 103–1010
× kVOC+O3(Atkinson et al., 2006;
http://kinetics.nist.gov/kinetics). For dimethyl sulfide, night-
time oxidation with nitrate radical (NO3) can be as important
as daytime oxidation with OH as kDMS+NO3≈ kDMS+OH
(kDMS+NO3and kDMS+OH are 1.1 × 10⁻¹² and 5.1 ×
10−12 cm3 molec−1 s−1 respectively at T = 281.8 K). The
hydroxyl radical reactivity of an air mass reflects the total
reactive pollutant loading of the air mass and can be used to
infer its ozone formation potential (Sinha et al., 2012). While
direct total OH reactivity measurements were not performed
during the SusKat-ABC campaign, it is still instructive to ex-
amine the diel profile of the OH reactivity due to the suite of
measured VOCs and assess the relative contributions of indi-
vidual VOCs. For this analysis, we considered 33 out of the
37 species that were observed at average ambient concentra-
tions greater than 200 ppt, for which the rate coefficients with
the hydroxyl radical are known. Thus, out of the 37 species,
four – the nitronium ion (m/ z= 45.990), isocyanic acid and
assorted hydrocarbons detected at m/ z ratios of 83.085 and
97.102 – were excluded from this analysis.
The total VOC OH reactivity was calculated as follows
(Sinha et al., 2012):
total VOC OH reactivity=∑
kVOCi+OH [VOCi], (2)
where kVOCi+OH is the first-order rate coefficient for the re-
action of VOCi with OH radicals and [VOCi] is the measured
concentration of VOCi . The rate coefficients were taken from
Atkinson et al. (2006) and from the NIST chemical kinetics
database (kinetics.nist.gov/kinetics) and Barnes et al. (2010)
when they were unavailable in Atkinson et al. (2006).
Figure 9 shows the diel profile of the average sum of VOC
OH reactivity due to 33 ambient VOCs, along with the diel
profiles of the hourly averaged OH reactivity due to the top
three contributors. The grey shaded region in Fig. 9 rep-
resents the 10th and 90th percentiles of the sum of VOC
OH reactivities due to the 33 ambient VOCs. The average
diel profile is bimodal in nature with peaks of ca. 21 s−1
at 09:00 LT and ca. 13 s−1 at 18:00 LT. Interestingly, the
Atmos. Chem. Phys., 16, 3979–4003, 2016 www.atmos-chem-phys.net/16/3979/2016/
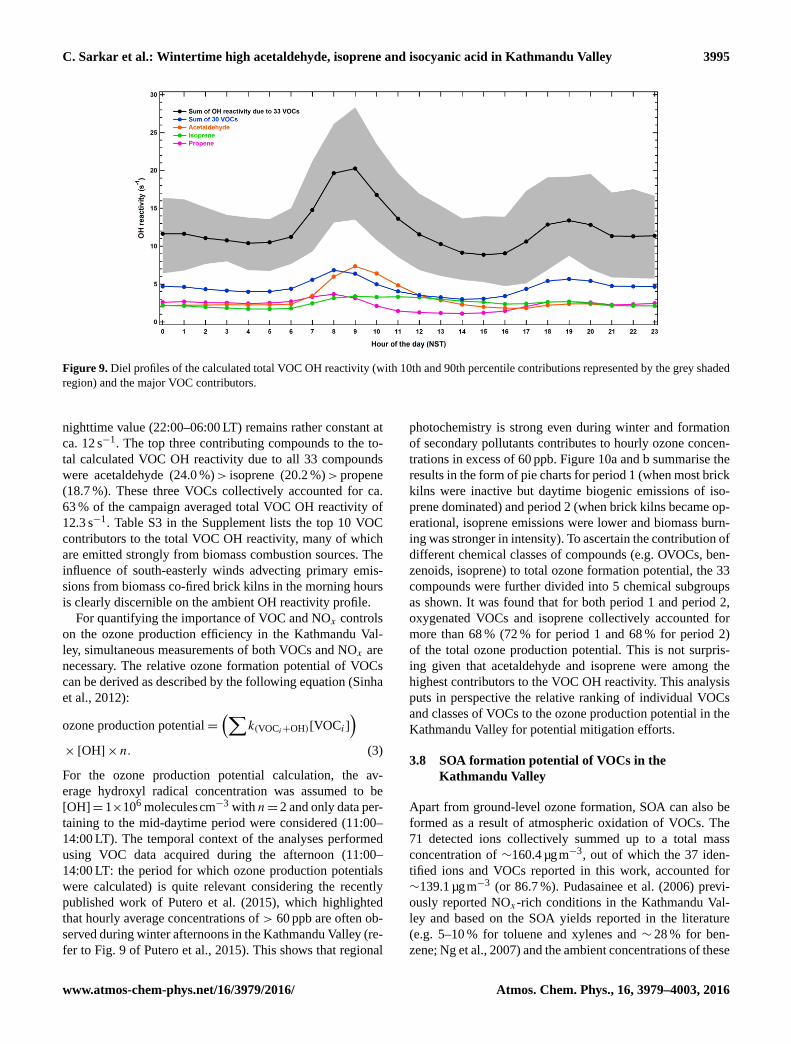
C. Sarkar et al.: Wintertime high acetaldehyde, isoprene and isocyanic acid in Kathmandu Valley 3995
Figure 9. Diel profiles of the calculated total VOC OH reactivity (with 10th and 90th percentile contributions represented by the grey shaded
region) and the major VOC contributors.
nighttime value (22:00–06:00 LT) remains rather constant at
ca. 12 s−1. The top three contributing compounds to the to-
tal calculated VOC OH reactivity due to all 33 compounds
were acetaldehyde (24.0 %)> isoprene (20.2 %)> propene
(18.7 %). These three VOCs collectively accounted for ca.
63 % of the campaign averaged total VOC OH reactivity of
12.3 s−1. Table S3 in the Supplement lists the top 10 VOC
contributors to the total VOC OH reactivity, many of which
are emitted strongly from biomass combustion sources. The
influence of south-easterly winds advecting primary emis-
sions from biomass co-fired brick kilns in the morning hours
is clearly discernible on the ambient OH reactivity profile.
For quantifying the importance of VOC and NOx controls
on the ozone production efficiency in the Kathmandu Val-
ley, simultaneous measurements of both VOCs and NOx are
necessary. The relative ozone formation potential of VOCs
can be derived as described by the following equation (Sinha
et al., 2012):
ozone production potential=(∑
k(VOCi+OH)[VOCi])
×[OH]× n. (3)
For the ozone production potential calculation, the av-
erage hydroxyl radical concentration was assumed to be
[OH]= 1×10⁶ moleculescm−3 with n= 2 and only data per-
taining to the mid-daytime period were considered (11:00–
14:00 LT). The temporal context of the analyses performed
using VOC data acquired during the afternoon (11:00–
14:00 LT: the period for which ozone production potentials
were calculated) is quite relevant considering the recently
published work of Putero et al. (2015), which highlighted
that hourly average concentrations of > 60 ppb are often ob-
served during winter afternoons in the Kathmandu Valley (re-
fer to Fig. 9 of Putero et al., 2015). This shows that regional
photochemistry is strong even during winter and formation
of secondary pollutants contributes to hourly ozone concen-
trations in excess of 60 ppb. Figure 10a and b summarise the
results in the form of pie charts for period 1 (when most brick
kilns were inactive but daytime biogenic emissions of iso-
prene dominated) and period 2 (when brick kilns became op-
erational, isoprene emissions were lower and biomass burn-
ing was stronger in intensity). To ascertain the contribution of
different chemical classes of compounds (e.g. OVOCs, ben-
zenoids, isoprene) to total ozone formation potential, the 33
compounds were further divided into 5 chemical subgroups
as shown. It was found that for both period 1 and period 2,
oxygenated VOCs and isoprene collectively accounted for
more than 68 % (72 % for period 1 and 68 % for period 2)
of the total ozone production potential. This is not surpris-
ing given that acetaldehyde and isoprene were among the
highest contributors to the VOC OH reactivity. This analysis
puts in perspective the relative ranking of individual VOCs
and classes of VOCs to the ozone production potential in the
Kathmandu Valley for potential mitigation efforts.
3.8 SOA formation potential of VOCs in the
Kathmandu Valley
Apart from ground-level ozone formation, SOA can also be
formed as a result of atmospheric oxidation of VOCs. The
71 detected ions collectively summed up to a total mass
concentration of ∼160.4 µgm−3, out of which the 37 iden-
tified ions and VOCs reported in this work, accounted for
∼139.1 µgm−3 (or 86.7 %). Pudasainee et al. (2006) previ-
ously reported NOx-rich conditions in the Kathmandu Val-
ley and based on the SOA yields reported in the literature
(e.g. 5–10 % for toluene and xylenes and ∼ 28 % for ben-
zene; Ng et al., 2007) and the ambient concentrations of these
www.atmos-chem-phys.net/16/3979/2016/ Atmos. Chem. Phys., 16, 3979–4003, 2016
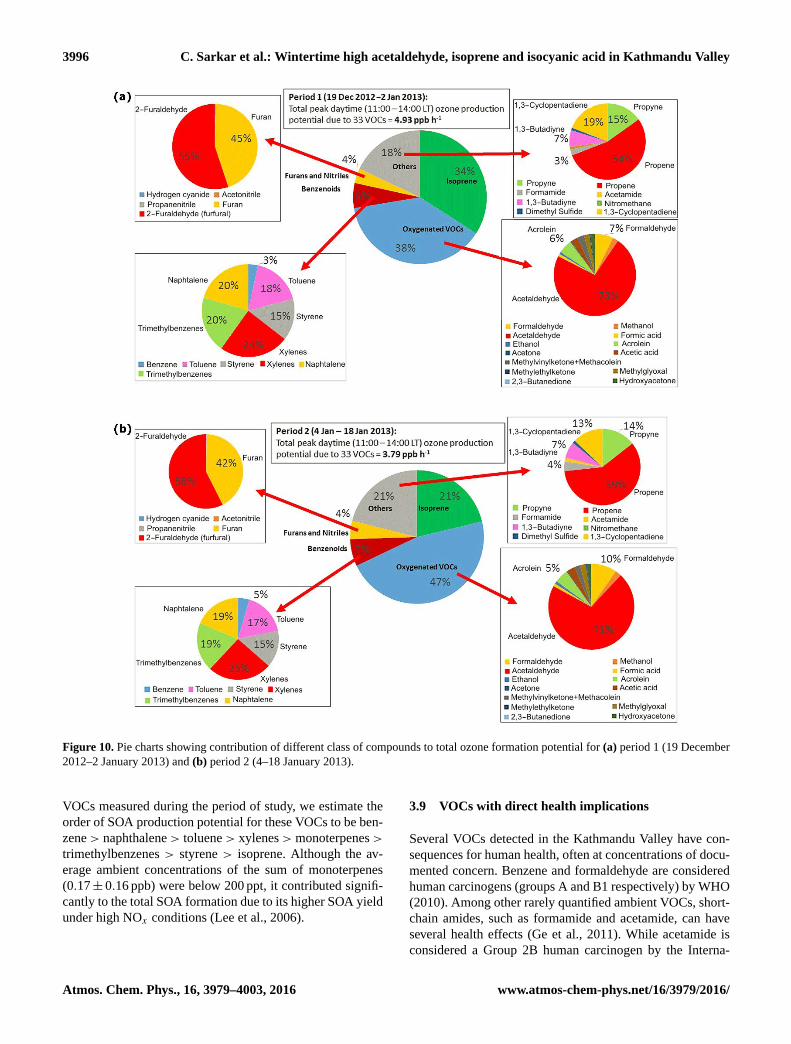
3996 C. Sarkar et al.: Wintertime high acetaldehyde, isoprene and isocyanic acid in Kathmandu Valley
Figure 10. Pie charts showing contribution of different class of compounds to total ozone formation potential for (a) period 1 (19 December
2012–2 January 2013) and (b) period 2 (4–18 January 2013).
VOCs measured during the period of study, we estimate the
order of SOA production potential for these VOCs to be ben-
zene> naphthalene> toluene> xylenes>monoterpenes>
trimethylbenzenes > styrene > isoprene. Although the av-
erage ambient concentrations of the sum of monoterpenes
(0.17± 0.16 ppb) were below 200 ppt, it contributed signifi-
cantly to the total SOA formation due to its higher SOA yield
under high NOx conditions (Lee et al., 2006).
3.9 VOCs with direct health implications
Several VOCs detected in the Kathmandu Valley have con-
sequences for human health, often at concentrations of docu-
mented concern. Benzene and formaldehyde are considered
human carcinogens (groups A and B1 respectively) by WHO
(2010). Among other rarely quantified ambient VOCs, short-
chain amides, such as formamide and acetamide, can have
several health effects (Ge et al., 2011). While acetamide is
considered a Group 2B human carcinogen by the Interna-
Atmos. Chem. Phys., 16, 3979–4003, 2016 www.atmos-chem-phys.net/16/3979/2016/

C. Sarkar et al.: Wintertime high acetaldehyde, isoprene and isocyanic acid in Kathmandu Valley 3997
tional Agency for Research on Cancer http://www.iarc.fr/),
nitromethane is also a Group 2B carcinogen and has been
reported as a possible carcinogen to humans (Inomata et al.,
2014). Some gases can result in formation of toxic secondary
VOCs. For example, naphthalene is not considered to be
a human carcinogen, but it can form mutagenic nitronaph-
thalenes by OH and NO3 initiated reactions (Sasaki et al.,
1997; Zhang et al., 2012). Atmospheric oxidation of amide
compounds such as formamide and acetamide with hydroxyl
radicals also contributes to the formation of isocyanic acid
(Barnes et al., 2010). Ambient isocyanic acid was present at
exposure levels of documented concern that can enhance hu-
man health risks for cataracts, cardiovascular diseases and
rheumatoid arthritis via protein carbamylation (Wang et al.,
2007; Roberts et al., 2011). Thus long-term monitoring of
these gases (isocyanic acid, formamide, acetamide, benzene,
formaldehyde, nitromethane, naphthalene), which can cause
adverse effects upon sustained exposure even at concentra-
tions of few ppb, is warranted to establish exposure and as-
sessing health risks due to these VOCs in the Kathmandu
Valley.
4 Conclusions
This study has comprehensively characterized the chemi-
cal composition of air in the Kathmandu Valley in terms
of speciated volatile organic compounds during the SusKat-
ABC wintertime campaign. The measurements performed at
high time resolution (every minute) and high mass resolution
(m/1m> 4200) enabled us to identify a multitude of com-
pounds based on their monoisotopic masses and hence exact
molecular formula. Novel insights could be acquired regard-
ing chemical processes related to ozone and secondary or-
ganic aerosol formation in a complex chemical environment
affected by mountain meteorology and both anthropogenic
and biogenic sources (even in winter).
A total of 71 ion peaks were observed in the mass spec-
tra of PTR-TOF-MS that were above the detection limit of
the instrument. Out of these, 37 species that had average
ambient concentrations greater than 200 ppt during the cam-
paign could be identified with reasonable confidence based
on (1) spectral characteristics observed at a particular m/ z
in a 0.005 amu bin relative to the ion peak, (2) ambient
diel profiles and (3) correlation with specific emission tracer
molecules such as acetonitrile (a biomass burning tracer). A
200 ppt cut off was also chosen as an additional quality con-
trol measure so as to ensure attribution of ion peaks in the
mass spectra only to the compounds present in the ambi-
ent air and not due to instrumental reasons. Among these
37 species, 8 contained nitrogen, 15 contained oxygen, 13
were hydrocarbons and 1 contained sulfur. Based on chem-
ical signatures of tracer compounds such as acetonitrile and
isoprene, two periods with contrasting emission influences
were identified during the campaign and investigated in de-
tail. Period 1 (19 December 2012–2 January 2013) was char-
acterized by high daytime biogenic emissions of isoprene
(average isoprene concentrations in period 1 and period 2
were 1.66 and 0.97 ppb respectively) and the absence of op-
erational brick kilns (and hence their emissions); period 2
(4 January 2013–18 January 2013) was marked by high
acetonitrile (average concentration during this Period was
1.34 ppb), benzene (3.46 ppb) and isocyanic acid (1.03 ppb)
due to emissions from the biomass co-fired brick kilns and
other biofuel/biomass burning activities. A clear distinction
of isoprene from furan, which had distinct emission profiles,
highlighted the importance of deploying a PTR-TOF-MS for
VOC measurements in the Kathmandu Valley.
Two “new” compounds which have not been reported in
any previous ambient study, namely formamide (CH3NO;
protonated m/ z= 46.029; campaign average 0.76 ppb) and
acetamide (C2H5NO; protonated m/ z= 60.051; campaign
average 0.39 ppb), which are involved in photochemical for-
mation of isocyanic acid, were also detected. The average
total reactive carbon (sum of the average mixing ratios of
all the 37 species reported in this study) was 175.8 ppbC to
which propyne, acetaldehyde, benzene, acetic acid, acetone,
propene and toluene collectively contributed more than 60 %.
Isoprene concentrations as high as 3 ppb were observed fre-
quently during the daytime in the early part of the campaign
(December 2012) and could be traced to biogenic emissions
from vegetation in fetch regions upwind of the site.
The concentration ranking in the average VOC mix-
ing ratios during our wintertime deployment was acetalde-
hyde (8.8 ppb) > methanol (7.4 ppb) > acetone + propanal
(4.2 ppb) > benzene (2.7 ppb) > toluene (1.5 ppb) > iso-
prene (1.1 ppb) > acetonitrile (1.1 ppb) > C8-aromatics
(∼1 ppb)> furan (∼ 0.5 ppb)> C9-aromatics (0.4 ppb). The
results suggest that the emission sources of oxygenated and
aromatic VOCs in the Kathmandu Valley are different com-
pared to several cities such as Paris and London, likely due to
the emissions from biomass co-fired brick kilns, open burn-
ing of biomass (e.g. garden waste, agro-residue burning and
garbage burning) and extensive use of diesel generators. In
comparison to wintertime mixing ratios reported from sev-
eral sites elsewhere in the world, the mixing ratios of ac-
etaldehyde (∼ 9 ppb), acetonitrile (∼ 1 ppb) and isoprene (∼
1 ppb) in the Kathmandu Valley are among the highest mea-
sured anywhere in the world. The major sources of propyne,
propene, benzene and propanenitrile in the valley appeared to
be biomass burning as concentrations of all these compounds
correlated well with the biomass burning tracer acetonitrile
(r2 > 0.7) and had diel emission profiles similar to that of
acetonitrile.
The top three contributing compounds to the total cal-
culated VOC OH reactivity due to 33 compounds were
acetaldehyde (24.0 %), isoprene (20.2 %) and propene
(18.7 %), which collectively accounted for ca. 63 % of the
campaign averaged total VOC OH reactivity of 12.3 s−1.
Oxygenated VOCs and isoprene collectively accounted for
www.atmos-chem-phys.net/16/3979/2016/ Atmos. Chem. Phys., 16, 3979–4003, 2016

3998 C. Sarkar et al.: Wintertime high acetaldehyde, isoprene and isocyanic acid in Kathmandu Valley
more than 68 % (72 % for period 1 and 68 % for period 2) of
the total ozone production potential. Based on known SOA
yields of compounds and the ambient concentrations mea-
sured in the Kathmandu Valley, it was estimated that the rel-
ative SOA production potential of VOCs was in the follow-
ing order: benzene > naphthalene > toluene > xylenes >
monoterpenes > trimethylbenzenes > styrene > isoprene.
Several VOCs known to increase health risks of cancer,
cataract and pulmonary diseases were detected in the ambient
air. The synergistic effect of these VOCs on air toxicity is dif-
ficult to quantify but likely significant. The prominent ones
were isocyanic acid, formamide, acetamide, naphthalene and
nitromethane, for which this study presents the first measure-
ments in ambient air from South Asia along with benzene,
a human carcinogen.
Although, like all urban environments, the contribution of
traffic sources to ambient VOCs is significant in the Kath-
mandu Valley, another anthropogenic source which occupies
central importance in the Kathmandu Valley (due to ineffi-
cient combustion) is the biomass co-fired brick kiln. While
we did not measure particulate matter emissions from the
biomass co-fired brick kilns in the Kathmandu Valley dur-
ing our deployment, previous studies by Pariyar et al. (2013)
and Raut (2003) have reported and documented massive in-
creases in PM10 and TSP for periods marked by the operation
of the brick kilns relative to periods when they were not oper-
ational. The study conducted by Clean Energy Nepal (Raut,
2003) showed that 8 h averaged concentrations of air pollu-
tants such as TSP, PM10, SO2 and NOx were 3 times higher
during the brick kiln operating period relative to the period
they were not operational at the same location. The mass con-
centration of PM10 increased from 218 to 603 µgm−3 while
TSP increased from 265 to 634 µgm−3. Note that these were
primarily FCBTKs, similar to the ones that impacted our
measurements. The FCBTKs are an old and inefficient tech-
nology which have been banned even in their place of origin,
India, but continue to dominate the Kathmandu Valley land-
scape. Thus a major conclusion of this study is that replacing
the existing brick kiln technology with cleaner and more effi-
cient brick kiln technology would aid air pollution mitigation
efforts significantly. While much has been learnt about win-
tertime VOC speciation in Kathmandu from this study, and
the first comprehensive data set has been acquired, long-term
measurements and further field intensives are required.
Future studies need to focus on what happens in the valley
on seasonal and interannual timescales. Of particular interest
would be assessing the concentrations of isoprene and ac-
etaldehyde in summer and their atmospheric chemistry. As-
sessment of source specific emission ratios (inter VOC) for
the major sources (brick kilns, diesel generator exhaust, leaf
litter fires, etc.) and improvement of existing emission inven-
tories using the in situ data should be undertaken. The com-
parison and estimation of the fraction of isoprene from vege-
tation and combustion will also be presented in a companion
paper (Sarkar et al., 2016) in which source apportionment of
VOCs will be performed using positive matrix factorisation
model. Comprehensive air quality and policy recommenda-
tions based on all the data acquired during the SusKat-ABC
study and from other sites in the Kathmandu Valley will be
summarised in future submissions to this Special Issue (Ru-
pakheti et al., 2016; Panday et al., 2016).
The Supplement related to this article is available online
at doi:10.5194/acp-16-3979-2016-supplement.
Acknowledgements. Chinmoy Sarkar, Vinod Kumar and
Vinayak Sinha acknowledge the support extended by the
Founding Director of IISER Mohali, N. Sathyamurthy to enable
participation of the IISER Mohali team in the SusKat-ABC
campaign. Chinmoy Sarkar and Vinod Kumar acknowledge the
Ministry of Human Resources and Development (MHRD), India,
and Department of Science and Technology (INSPIRE program),
India, respectively for their PhD fellowships. We thank Joost de
Gouw and Rui Li for helpful discussions regarding detection of
isocyanic acid using the PTR-TOF-MS technique and Achim
Edtbauer and Ionicon Analytik for their support. Bob Yokelson is
thanked for input regarding detection of ketene and acetic acid. We
thank the anonymous reviewer 1 and the editor for their extremely
helpful suggestions. We dedicate this work to the memory of the
victims of the devastating earthquake that hit Nepal in 2015.
All the data reported in this article can be obtained from the cor-
responding author by sending an email to [email protected].
Edited by: J. Roberts
References
Akagi, S. K., Yokelson, R. J., Wiedinmyer, C., Alvarado, M. J.,
Reid, J. S., Karl, T., Crounse, J. D., and Wennberg, P. O.: Emis-
sion factors for open and domestic biomass burning for use
in atmospheric models, Atmos. Chem. Phys., 11, 4039–4072,
doi:10.5194/acp-11-4039-2011, 2011.
Akagi, S. K., Yokelson, R. J., Burling, I. R., Meinardi, S., Simp-
son, I., Blake, D. R., McMeeking, G. R., Sullivan, A., Lee, T.,
Kreidenweis, S., Urbanski, S., Reardon, J., Griffith, D. W. T.,
Johnson, T. J., and Weise, D. R.: Measurements of reactive trace
gases and variable O3 formation rates in some South Carolina
biomass burning plumes, Atmos. Chem. Phys., 13, 1141–1165,
doi:10.5194/acp-13-1141-2013, 2013.
Al-Naiema, I., Estillore, A. D., Mudunkotuwa, I. A., Gras-
sian, V. H., and Stone, E. A.: Impacts of co-firing biomass on
emissions of particulate matter to the atmosphere, Fuel, 162,
111–120, doi:10.1016/j.fuel.2015.08.054, 2015.
Andreae, M. O. and Merlet, P.: Emission of trace gases and aerosols
from biomass burning, Global Biogeochem. Cy., 15, 955–966,
doi:10.1029/2000gb001382, 2001.
Andreae, M. O. and Raemdonck, H.: Dimethyl sulfide in the surface
ocean and the marine atmosphere – a global view, Science, 221,
744–747, 1983.
Atmos. Chem. Phys., 16, 3979–4003, 2016 www.atmos-chem-phys.net/16/3979/2016/

C. Sarkar et al.: Wintertime high acetaldehyde, isoprene and isocyanic acid in Kathmandu Valley 3999
Aoki, N., Inomata, S., and Tanimoto, H.: Detection of C1–
C5 alkyl nitrates by proton transfer reaction time-of-flight
mass spectrometry, Int. J. Mass Spectrom., 263, 12–21,
doi:10.1016/j.ijms.2006.11.018, 2007.
Atkinson, R.: Atmospheric chemistry of VOCs and NOx , Atmos.
Environ., 34, 2063–2101, doi:10.1016/S1352-2310(99)00460-4,
2000
Atkinson, R., Baulch, D. L., Cox, R. A., Crowley, J. N., Hamp-
son, R. F., Hynes, R. G., Jenkin, M. E., Rossi, M. J., Troe, J.,
and IUPAC Subcommittee: Evaluated kinetic and photochemi-
cal data for atmospheric chemistry: Volume II – gas phase re-
actions of organic species, Atmos. Chem. Phys., 6, 3625–4055,
doi:10.5194/acp-6-3625-2006, 2006.
Barletta, B., Meinardi, S., Simpson, I. J., Khwaja, H. A.,
Blake, D. R., and Rowland, F. S.: Mixing ratios of volatile
organic compounds (VOCs) in the atmosphere of Karachi,
Pakistan, Atmos. Environ., 36, 3429–3443, doi:10.1016/S1352-
2310(02)00302-3, 2002.
Barletta, B., Meinardi, S., Sherwood Rowland, F., Chan, C. Y.,
Wang, X., Zou, S., Yin Chan, L., and Blake, D. R.: Volatile
organic compounds in 43 Chinese cities, Atmos. Environ., 39,
5979–5990, doi:10.1016/j.atmosenv.2005.06.029, 2005.
Barnes, I., Solignac, G., Mellouki, A., and Becker, K. H.: Aspects
of the atmospheric chemistry of amides, Chem. Phys. Chem., 11,
3844–3857, doi:10.1002/cphc.201000374, 2010.
Borbon, A., Fontaine, H., Veillerot, M., Locoge, N., Galloo, J. C.,
and Guillermo, R.: An investigation into the traffic-related frac-
tion of isoprene at an urban location, Atmos. Environ., 35, 3749–
3760, doi:10.1016/S1352-2310(01)00170-4, 2001.
Bryan, A. M., Bertman, S. B., Carroll, M. A., Dusanter, S.,
Edwards, G. D., Forkel, R., Griffith, S., Guenther, A. B.,
Hansen, R. F., Helmig, D., Jobson, B. T., Keutsch, F. N.,
Lefer, B. L., Pressley, S. N., Shepson, P. B., Stevens, P. S.,
and Steiner, A. L.: In-canopy gas-phase chemistry during CAB-
INEX 2009: sensitivity of a 1-D canopy model to vertical mix-
ing and isoprene chemistry, Atmos. Chem. Phys., 12, 8829–8849,
doi:10.5194/acp-12-8829-2012, 2012.
Central Bureau of Statistics: Nepal Population and Housing Census
Report, National Planning Commission Secretariat, Government
of Nepal, Kathmandu, 2011, 1–262, 2011.
Chandra, B. P., and Sinha, V.: Contribution of post-harvest
agricultural paddy residue fires in the N.W. Indo–Gangetic
Plain to ambient carcinogenic benzenoids, toxic isocyanic
acid and carbon monoxide, Environ. Int., 88, 187–197,
doi:10.1016/j.envint.2015.12.025, 2016.
Christian, T. J., Kleiss, B., Yokelson, R. J., Holzinger, R.,
Crutzen, P. J., Hao, W. M., Saharjo, B. H., and Ward, D. E.: Com-
prehensive laboratory measurements of biomass-burning emis-
sions: 1. Emissions from Indonesian, African, and other fuels, J.
Geophys. Res.-Atmos., 108, 4719, doi:10.1029/2003jd003704,
2003.
Davidson, C. I., Lin, S. F., Osborn, J. F., Pandey, M. R., Ras-
mussen, R. A., and Khalil, M. A. K.: Indoor and outdoor air
pollution in the Himalayas, Environ. Sci. Technol., 20, 561–567,
doi:10.1021/es00148a003, 1986.
de Foy, B., Varela, J. R., Molina, L. T., and Molina, M. J.:
Rapid ventilation of the Mexico City basin and regional fate
of the urban plume, Atmos. Chem. Phys., 6, 2321–2335,
doi:10.5194/acp-6-2321-2006, 2006.
de Gouw, J. and Warneke, C.: Measurements of volatile organic
compounds in the earth’s atmosphere using proton-transfer-
reaction mass spectrometry, Mass Spectrom. Rev., 26, 223–257,
doi:10.1002/mas.20119, 2007.
de Gouw, J. A., Goldan, P. D., Warneke, C., Kuster, W. C.,
Roberts, J. M., Marchewka, M., Bertman, S. B.,
Pszenny, A. A. P., and Keene, W. C.: Validation of proton
transfer reaction-mass spectrometry (PTR-MS) measurements
of gas-phase organic compounds in the atmosphere during the
New England Air Quality Study (NEAQS) in 2002, J. Geophys.
Res.-Atmos., 108, 4682, doi:10.1029/2003jd003863, 2003.
Department of Plant Resources, Nepal: Bulletin of Department of
Plant Resources, Nepal 37, Ministry of Forests and Soil Conser-
vation, Kathmandu, 1–122, 2015.
Dolgorouky, C., Gros, V., Sarda-Esteve, R., Sinha, V., Williams, J.,
Marchand, N., Sauvage, S., Poulain, L., Sciare, J., and Bon-
sang, B.: Total OH reactivity measurements in Paris during the
2010 MEGAPOLI winter campaign, Atmos. Chem. Phys., 12,
9593–9612, doi:10.5194/acp-12-9593-2012, 2012.
Filella, I. and Penuelas, J.: Daily, weekly, and seasonal
time courses of VOC concentrations in a semi-urban
area near Barcelona, Atmos. Environ., 40, 7752–7769,
doi:10.1016/j.atmosenv.2006.08.002, 2006.
Ge, X., Wexler, A. S., and Clegg, S. L.: Atmospheric
amines – Part I. A review, Atmos. Environ., 45, 524–546,
doi:10.1016/j.atmosenv.2010.10.012, 2011.
Geron, C., Harley, P., and Guenther, A.: Isoprene emission ca-
pacity for US tree species, Atmos. Environ., 35, 3341–3352,
doi:10.1016/S1352-2310(00)00407-6, 2001.
Gilman, J. B., Lerner, B. M., Kuster, W. C., Goldan, P. D.,
Warneke, C., Veres, P. R., Roberts, J. M., de Gouw, J. A., Burl-
ing, I. R., and Yokelson, R. J.: Biomass burning emissions and
potential air quality impacts of volatile organic compounds and
other trace gases from fuels common in the US, Atmos. Chem.
Phys., 15, 13915–13938, doi:10.5194/acp-15-13915-2015, 2015.
Grosjean, D., Grosjean, E., and Williams, E. L.: Atmospheric chem-
istry of olefins: a product study of the ozone-alkene reaction with
cyclohexane added to scavenge hydroxyl radical, Environ. Sci.
Technol., 28, 186–196, doi:10.1021/es00050a026, 1994.
Grosjean, E., Rasmussen, R. A., and Grosjean, D.: Ambient levels
of gas phase pollutants in Porto Alegre, Brazil, Atmos. Environ.,
32, 3371–3379, doi:10.1016/S1352-2310(98)00007-7, 1998.
Guenther, A., Karl, T., Harley, P., Wiedinmyer, C., Palmer, P. I.,
and Geron, C.: Estimates of global terrestrial isoprene emissions
using MEGAN (Model of Emissions of Gases and Aerosols from
Nature), Atmos. Chem. Phys., 6, 3181–3210, doi:10.5194/acp-6-
3181-2006, 2006.
Guo, H., So, K. L., Simpson, I. J., Barletta, B., Meinardi, S.,
and Blake, D. R.: C1–C8 volatile organic compounds in the
atmosphere of Hong Kong: overview of atmospheric process-
ing and source apportionment, Atmos. Environ., 41, 1456–1472,
doi:10.1016/j.atmosenv.2006.10.011, 2007.
Gurung, A. and Bell, M. L.: Exposure to airborne particulate matter
in Kathmandu Valley, Nepal, J. Expos. Sci. Environ. Epidemiol.,
22, 235–242, 2012.
Hao, W. M., Ward, D. E., Olbu, G., and Baker, S. P.: Emissions
of CO2, CO, and hydrocarbons from fires in diverse African sa-
vanna ecosystems, J. Geophys. Res.-Atmos., 101, 23577–23584,
1996.
www.atmos-chem-phys.net/16/3979/2016/ Atmos. Chem. Phys., 16, 3979–4003, 2016
4000 C. Sarkar et al.: Wintertime high acetaldehyde, isoprene and isocyanic acid in Kathmandu Valley
Hellèn, H., Tykkä, T., and Hakola, H.: Importance of monoterpenes
and isoprene in urban air in northern Europe, Atmos. Environ.,
59, 59–66, doi:10.1016/j.atmosenv.2012.04.049, 2012.
Henze, D. K., Seinfeld, J. H., Ng, N. L., Kroll, J. H., Fu, T.-M.,
Jacob, D. J., and Heald, C. L.: Global modeling of secondary
organic aerosol formation from aromatic hydrocarbons: high-
vs. low-yield pathways, Atmos. Chem. Phys., 8, 2405–2420,
doi:10.5194/acp-8-2405-2008, 2008.
Holzinger, R., Warneke, C., Hansel, A., Jordan, A., Lindinger, W.,
Scharffe, D. H., Schade, G., and Crutzen, P. J.: Biomass burn-
ing as a source of formaldehyde, acetaldehyde, methanol, ace-
tone, acetonitrile, and hydrogen cyanide, Geophys. Res. Lett., 26,
1161–1164, doi:10.1029/1999gl900156, 1999.
Inomata, S., Tanimoto, H., Fujitani, Y., Sekimoto, K., Sato, K.,
Fushimi, A., Yamada, H., Hori, S., Kumazawa, Y., Shi-
mono, A., and Hikida, T.: On-line measurements of gaseous
nitro-organic compounds in diesel vehicle exhaust by proton-
transfer-reaction mass spectrometry, Atmos. Environ., 73, 195–
203, doi:10.1016/j.atmosenv.2013.03.035, 2013.
Inomata, S., Fujitani, Y., Fushimi, A., Tanimoto, H., Sekimoto, K.,
and Yamada, H.: Field measurement of nitromethane from au-
tomotive emissions at a busy intersection using proton-transfer-
reaction mass spectrometry, Atmos. Environ., 96, 301–309,
doi:10.1016/j.atmosenv.2014.07.058, 2014.
IPCC: Impacts, Adaptation and Vulnerability: Working Group II
Contribution to the Intergovernmental Panel on Climate Change:
Fifth Assessment Report: Summary for Policymakers, Intergov-
ernmental Panel on Climate Change. Working Group Impacts,
Cambridge University Press, Cambridge, UK and New York, NY,
USA, 1–32, 2013.
Jardine, K., Yañez-Serrano, A. M., Williams, J., Kunert, N., Jar-
dine, A., Taylor, T., Abrell, L., Artaxo, P., Guenther, A., He-
witt, C. N., House, E., Florentino, A. P., Manzi, A., Higuchi, N.,
Kesselmeier, J., Behrendt, T., Veres, P. R., Derstroff, B.,
Fuentes, J. D., Martin, S. T., and Andreae, M. O.: Dimethyl sul-
fide in the Amazon rain forest, Global Biogeochem. Cy., 29, 19–
32, doi:10.1002/2014gb004969, 2015.
Jones, C. E., Hopkins, J. R., and Lewis, A. C.: In situ mea-
surements of isoprene and monoterpenes within a south-east
Asian tropical rainforest, Atmos. Chem. Phys., 11, 6971–6984,
doi:10.5194/acp-11-6971-2011, 2011.
Jordan, A., Haidacher, S., Hanel, G., Hartungen, E., Märk, L., See-
hauser, H., Schottkowsky, R., Sulzer, P., and Märk, T. D.: A high
resolution and high sensitivity proton-transfer-reaction time-of-
flight mass spectrometer (PTR-TOF-MS), Int. J. Mass Spec-
trom., 286, 122–128, doi:10.1016/j.ijms.2009.07.005, 2009.
Karl, T., Jobson, T., Kuster, W. C., Williams, E., Stutz, J., Shet-
ter, R., Hall, S. R., Goldan, P., Fehsenfeld, F., and Lindinger, W.:
Use of proton-transfer-reaction mass spectrometry to character-
ize volatile organic compound sources at the La Porte super
site during the Texas Air Quality Study 2000, J. Geophys. Res.-
Atmos., 108, 4508, doi:10.1029/2002jd003333, 2003.
Karl, T. G., Christian, T. J., Yokelson, R. J., Artaxo, P., Hao, W. M.,
and Guenther, A.: The Tropical Forest and Fire Emissions
Experiment: method evaluation of volatile organic compound
emissions measured by PTR-MS, FTIR, and GC from trop-
ical biomass burning, Atmos. Chem. Phys., 7, 5883–5897,
doi:10.5194/acp-7-5883-2007, 2007.
Kesselmeier, J., Bode, K., Hofmann, U., Müller, H., Schäfer, L.,
Wolf, A., Ciccioli, P., Brancaleoni, E., Cecinato, A., Frattoni, M.,
Foster, P., Ferrari, C., Jacob, V., Fugit, J. L., Dutaur, L., Si-
mon, V., and Torres, L.: Emission of short chained organic
acids, aldehydes and monoterpenes from Quercus ilex L., and
Pinus pinea L. in relation to physiological activities, carbon bud-
get and emission algorithms, Atmos. Environ., 31, 119–133,
doi:10.1016/S1352-2310(97)00079-4, 1997.
Kesselmeier, J. and Staudt, M.: Biogenic Volatile Or-
ganic Compounds (VOC): an overview on emission,
physiology and ecology, J. Atmos. Chem., 33, 23–88,
doi:10.1023/a:1006127516791, 1999.
Kitada, T. and Regmi, R. P.: Dynamics of air pollution transport
in late wintertime over Kathmandu Valley, Nepal: as revealed
with numerical simulation, J. Appl. Meteorol., 42, 1770–1798,
doi:10.1175/1520-0450(2003)042<1770:DOAPTI>2.0.CO;2,
2003.
Kumar, V. and Sinha, V.: VOC–OHM: A new technique for
rapid measurements of ambient total OH reactivity and volatile
organic compounds using a single proton transfer reaction
mass spectrometer, Int. J. Mass Spectrom., 374, 55–63,
doi:10.1016/j.ijms.2014.10.012, 2014.
Langford, B., Nemitz, E., House, E., Phillips, G. J., Famu-
lari, D., Davison, B., Hopkins, J. R., Lewis, A. C., and He-
witt, C. N.: Fluxes and concentrations of volatile organic com-
pounds above central London, UK, Atmos. Chem. Phys., 10,
627–645, doi:10.5194/acp-10-627-2010, 2010.
Larssen, S., F. Gram, I. Haugsbakk, J. Huib, X. Olsthoorn, A. S.
Giri, R. Shah, M. L. Shrestha, A., and Shrestha, B.: Urban Air
Quality Management Strategy in Asia: Kathmandu Valley Re-
port, World Bank, Washington, D.C., USA, 1–173, 1997.
Lee, A., Goldstein, A. H., Kroll, J. H., Ng, N. L., Varut-
bangkul, V., Flagan, R. C., and Seinfeld, J. H.: Gas-phase prod-
ucts and secondary aerosol yields from the photooxidation of
16 different terpenes, J. Geophys. Res.-Atmos., 111, D17305,
doi:10.1029/2006jd007050, 2006.
Lelieveld, J., Dentener, F. J., Peters, W., and Krol, M. C.: On the
role of hydroxyl radicals in the self-cleansing capacity of the tro-
posphere, Atmos. Chem. Phys., 4, 2337–2344, doi:10.5194/acp-
4-2337-2004, 2004.
Lemieux, P. M., Lutes, C. C., and Santoianni, D. A.: Emissions
of organic air toxics from open burning: a comprehensive re-
view, Progress in Energy and Combustion Science, 30, 1-32,
doi:10.1016/j.pecs.2003.08.001, 2004.
Lindinger, W., Hansel, A., and Jordan, A.: On-line monitoring of
volatile organic compounds at pptv levels by means of proton-
transfer-reaction mass spectrometry (PTR-MS) medical appli-
cations, food control and environmental research, Int. J. Mass
Spectrom., 173, 191–241, doi:10.1016/s0168-1176(97)00281-4,
1998.
Liu, Ying, Shao, Min, Lu, Sihua, Chang, Chih-chung, Wang, Jia-
Lin, and Chen, Gao: Volatile Organic Compound (VOC) mea-
surements in the Pearl River Delta (PRD) region, China, At-
mos. Chem. Phys., 8, 1531–1545, doi:10.5194/acp-8-1531-2008,
2008.
Lockhart, J., Blitz, M. A., Heard, D. E., Seakins, P. W., and Shan-
non, R. J.: The mechanism of the reaction of OH with alkynes
in the presence of oxygen, J. Phys. Chem. A, 117, 5407–5418,
doi:10.1021/jp404233b, 2013.
Atmos. Chem. Phys., 16, 3979–4003, 2016 www.atmos-chem-phys.net/16/3979/2016/

C. Sarkar et al.: Wintertime high acetaldehyde, isoprene and isocyanic acid in Kathmandu Valley 4001
Martinez, M., Harder, H., Ren, X., Lesher, R. L., and Brune, W. H.:
Measuring atmospheric naphthalene with laser-induced fluores-
cence, Atmos. Chem. Phys., 4, 563–569, doi:10.5194/acp-4-563-
2004, 2004.
Millet, D. B., Guenther, A., Siegel, D. A., Nelson, N. B.,
Singh, H. B., de Gouw, J. A., Warneke, C., Williams, J.,
Eerdekens, G., Sinha, V., Karl, T., Flocke, F., Apel, E.,
Riemer, D. D., Palmer, P. I., and Barkley, M.: Global atmospheric
budget of acetaldehyde: 3-D model analysis and constraints from
in-situ and satellite observations, Atmos. Chem. Phys., 10, 3405–
3425, doi:10.5194/acp-10-3405-2010, 2010.
Molina, L. T., Kolb, C. E., de Foy, B., Lamb, B. K., Brune, W. H.,
Jimenez, J. L., Ramos-Villegas, R., Sarmiento, J., Paramo-
Figueroa, V. H., Cardenas, B., Gutierrez-Avedoy, V., and
Molina, M. J.: Air quality in North America’s most populous city
– overview of the MCMA-2003 campaign, Atmos. Chem. Phys.,
7, 2447–2473, doi:10.5194/acp-7-2447-2007, 2007.
Müller, M., Graus, M., Ruuskanen, T. M., Schnitzhofer, R., Bam-
berger, I., Kaser, L., Titzmann, T., Hörtnagl, L., Wohlfahrt, G.,
Karl, T., and Hansel, A.: First eddy covariance flux mea-
surements by PTR-TOF, Atmos. Meas. Tech., 3, 387–395,
doi:10.5194/amt-3-387-2010, 2010.
Nelson, P. F., Li, C. Z., and Ledesma, E.: Formation of HNCO
from the rapid pyrolysis of coals, Energy and Fuels, 10, 264–
265, doi:10.1021/ef950183o, 1996.
Ng, N. L., Chhabra, P. S., Chan, A. W. H., Surratt, J. D., Kroll, J. H.,
Kwan, A. J., McCabe, D. C., Wennberg, P. O., Sorooshian, A.,
Murphy, S. M., Dalleska, N. F., Flagan, R. C., and Seinfeld, J. H.:
Effect of NOx level on secondary organic aerosol (SOA) forma-
tion from the photooxidation of terpenes, Atmos. Chem. Phys.,
7, 5159–5174, doi:10.5194/acp-7-5159-2007, 2007.
Padhy, P. K. and Varshney, C. K.: Emission of volatile
organic compounds (VOC) from tropical plant
species in India, Chemosphere, 59, 1643–1653,
doi:10.1016/j.chemosphere.2005.01.046, 2005.
Panday, A. K. and Prinn, R. G.: Diurnal cycle of air pollution in
the Kathmandu Valley, Nepal: observations, J. Geophys. Res.-
Atmos., 114, D09305, doi:10.1029/2008jd009777, 2009.
Panday, A. K., Prinn, R. G., and Schär, C.: Diurnal cy-
cle of air pollution in the Kathmandu Valley, Nepal: 2.
Modeling results, J. Geophys. Res.-Atmos., 114, D21308,
doi:10.1029/2008jd009808, 2009.
Panday, A. K., Adhikary, B., Praveen, P. S., Mahata, K. S., and
Rupakheti, M.: Meteorology and Air Pollution Transport in the
Kathmandu Valley, Nepal, Atmos. Chem. Phys. Discuss., in
preparation, 2016.
Pariyar, S. K., Das, T., and Ferdous, T.: Environment and Health
Impact for Brick Kilns in Kathmandu Valley, Int. J. Sci. Technol.
Res., 2, 184–187, 2013.
Park, J.-H., Goldstein, A. H., Timkovsky, J., Fares, S., Weber, R.,
Karlik, J., and Holzinger, R.: Eddy covariance emission and de-
position flux measurements using proton transfer reaction – time
of flight – mass spectrometry (PTR-TOF-MS): comparison with
PTR-MS measured vertical gradients and fluxes, Atmos. Chem.
Phys., 13, 1439–1456, doi:10.5194/acp-13-1439-2013, 2013.
Pudasainee, D., Sapkota, B., Shrestha, M. L., Kaga, A., Kondo, A.,
and Inoue, Y.: Ground level ozone concentrations and its
association with NOx and meteorological parameters in
Kathmandu Valley, Nepal, Atmos. Environ., 40, 8081–8087,
doi:10.1016/j.atmosenv.2006.07.011, 2006.
Putero, D., Cristofanelli, P., Marinoni, A., Adhikary, B., Duchi, R.,
Shrestha, S. D., Verza, G. P., Landi, T. C., Calzolari, F.,
Busetto, M., Agrillo, G., Biancofiore, F., Di Carlo, P., Pan-
day, A. K., Rupakheti, M., and Bonasoni, P.: Seasonal variation
of ozone and black carbon observed at Paknajol, an urban site in
the Kathmandu Valley, Nepal, Atmos. Chem. Phys., 15, 13957–
13971, doi:10.5194/acp-15-13957-2015, 2015.
Ramana, M. V., Ramanathan, V., Podgorny, I. A., Pradhan, B. B.,
and Shrestha, B.: The direct observations of large aerosol radia-
tive forcing in the Himalayan region, Geophys. Res. Lett., 31,
L05111, doi:10.1029/2003gl018824, 2004.
Rappenglück, B., Schmitz, R., Bauerfeind, M., Cereceda-Balic, F.,
von Baer, D., Jorquera, H., Silva, Y., and Oyola, P.: An urban
photochemistry study in Santiago de Chile, Atmos. Environ., 39,
2913–2931, doi:10.1016/j.atmosenv.2004.12.049, 2005.
Raut, A. K.: Brick Kilns in Kathmandu Valley: Current status, en-
vironmental impacts and future options, Himal. J. Sci., 1, 59–61,
doi:10.3126/hjs.v1i1.189, 2003.
Regmi, R. P., Kitada, T., and Kurata, G.: Numerical simulation of
late wintertime local flows in Kathmandu Valley, Nepal: impli-
cation for air pollution transport, J. Appl. Meteorol., 42, 389–
403, doi:10.1175/1520-0450(2003)042<0389:nsolwl>2.0.CO;2,
2003.
Roberts, J. M., Veres, P. R., Cochran, A. K., Warneke, C., Burl-
ing, I. R., Yokelson, R. J., Lerner, B., Gilman, J. B., Kuster, W. C.,
Fall, R., and de Gouw, J.: Isocyanic acid in the atmosphere and its
possible link to smoke-related health effects, P. Natl. Acad. Sci.
USA, 108, 8966–8971, doi:10.1073/pnas.1103352108, 2011.
Roberts, J. M., Veres, P., VandenBoer, T. C., Warneke, C.,
Graus, M., Williams, E. J., Lefer, B. L., Brock, C. A.,
Bahreini, R., Öztürk, F., Middlebrook, A. M., Wagner, N. L.,
Dubè, W. P. A., and de Gouw, J. A.: New insights into atmo-
spheric sources and sinks of isocyanic acid, HNCO, from recent
urban and regional observations, J. Geophys. Res.-Atmos., 119,
1060–1072, doi:10.1002/2013JD019931, 2014.
Ropkins, K. and Carslaw, D. C.: Openair – Data Analysis Tools for
the Air Quality Community, The R Journal, 4, 20–29, 2012.
Rupakheti, M., Panday, A. K., Lawrence, M. G., Kim, S. W.,
Sinha, V., Kang, S. C., Naja, M., Park, J. S., Hoor, P., Holben, B.,
Sharma, R. K., Mues, A., Mahata, K. S., Bhardwaj, P., Sarkar, C.,
Rupakheti, D., Regmi, R. P., and Gustafsson, Ö.: Air pollution
in the Himalayan foothills: overview of the SusKat-ABC inter-
national air pollution measurement campaign in Nepal, Atmos.
Chem. Phys. Discuss., in preparation, 2016.
Ruuskanen, T. M., Müller, M., Schnitzhofer, R., Karl, T., Graus, M.,
Bamberger, I., Hörtnagl, L., Brilli, F., Wohlfahrt, G., and
Hansel, A.: Eddy covariance VOC emission and deposition
fluxes above grassland using PTR-TOF, Atmos. Chem. Phys., 11,
611–625, doi:10.5194/acp-11-611-2011, 2011.
Sarkar, C., Kumar, V., and Sinha, V.: Massive emissions of carcino-
genic benzenoids from paddy residue burning in North India,
Curr. Sci. India, 104, 1703–1709, 2013.
Sarkar, C., Sinha, V., Rupakheti, M., Panday, A. K., Bhave, P.,
Sinha, B., and Lawrence, M. G.: Source apportionment of VOCs
in the Kathmandu Valley during the SusKat-ABC international
field campaign using positive matrix factorization, Atmos. Chem.
Phys. Discuss., in preparation, 2016.
www.atmos-chem-phys.net/16/3979/2016/ Atmos. Chem. Phys., 16, 3979–4003, 2016

4002 C. Sarkar et al.: Wintertime high acetaldehyde, isoprene and isocyanic acid in Kathmandu Valley
Sasaki, J., Aschmann, S. M., Kwok, E. S. C., Atkinson, R., and
Arey, J.: Products of the gas-phase OH and NO3 radical-initiated
reactions of naphthalene, Environ. Sci. Technol., 31, 3173–3179,
doi:10.1021/es9701523, 1997.
Schmitz, R.: Modelling of air pollution dispersion in
Santiago de Chile, Atmos. Environ., 39, 2035–2047,
doi:10.1016/j.atmosenv.2004.12.033, 2005.
Seco, R., Peñuelas, J., Filella, I., Llusià, J., Molowny-Horas, R.,
Schallhart, S., Metzger, A., Müller, M., and Hansel, A.: Contrast-
ing winter and summer VOC mixing ratios at a forest site in the
Western Mediterranean Basin: the effect of local biogenic emis-
sions, Atmos. Chem. Phys., 11, 13161–13179, doi:10.5194/acp-
11-13161-2011, 2011.
Sekimoto, K., Inomata, S., Tanimoto, H., Fushimi, A., Fujitani, Y.,
Sato, K., and Yamada, H.: Characterization of nitromethane
emission from automotive exhaust, Atmos. Environ., 81, 523–
531, doi:10.1016/j.atmosenv.2013.09.031, 2013.
Sharma, R. K., Bhattarai, B. K., Sapkota, B. K., Gewali, M. B.,
and Kjeldstad, B.: Black carbon aerosols variation in
Kathmandu Valley, Nepal, Atmos. Environ., 63, 282–288,
doi:10.1016/j.atmosenv.2012.09.023, 2012.
Sharma, U. K., Kajii, Y., and Akimoto, H.: Characterization
of NMHCs in downtown urban center Kathmandu and ru-
ral site Nagarkot in Nepal, Atmos. Environ., 34, 3297–3307,
doi:10.1016/S1352-2310(99)00485-9, 2000.
Simon, V., Dumergues, L., Bouchou, P., Torres, L., and Lopez, A.:
Isoprene emission rates and fluxes measured above a Mediter-
ranean oak (Quercus pubescens) forest, Atmos. Res., 74, 49–63,
doi:10.1016/j.atmosres.2004.04.005, 2005.
Singh, H. B., Kanakidou, M., Crutzen, P. J., and Jacob, D. J.: High
concentrations and photochemical fate of oxygenated hydrocar-
bons in the global troposphere, Nature, 378, 50–54, 1995.
Sinha, V., Williams, J., Meyerhöfer, M., Riebesell, U.,
Paulino, A. I., and Larsen, A.: Air-sea fluxes of methanol, ace-
tone, acetaldehyde, isoprene and DMS from a Norwegian fjord
following a phytoplankton bloom in a mesocosm experiment,
Atmos. Chem. Phys., 7, 739–755, doi:10.5194/acp-7-739-2007,
2007.
Sinha, V., Williams, J., Lelieveld, J., Ruuskanen, T. M., Ka-
jos, M. K., Patokoski, J., Hellen, H., Hakola, H., Mogensen, D.,
Boy, M., Rinne, J., and Kulmala, M.: OH Reactivity Mea-
surements within a Boreal Forest: Evidence for Unknown
Reactive Emissions, Environ. Sci. Technol., 44, 6614–6620,
doi:10.1021/es101780b, 2010.
Sinha, V., Custer, T. G., Klüpfel, T., and Williams, J. The effect of
relative humidity on the detection of pyrrole by PTR-MS for OH
reactivity measurements, Int. J. Mass Spectrom., 282, 108–111,
doi:10.1016/j.ijms.2009.02.019, 2009.
Sinha, V., Williams, J., Diesch, J. M., Drewnick, F., Martinez, M.,
Harder, H., Regelin, E., Kubistin, D., Bozem, H., Hosaynali-
Beygi, Z., Fischer, H., Andrés-Hernández, M. D., Kartal, D.,
Adame, J. A., and Lelieveld, J.: Constraints on instantaneous
ozone production rates and regimes during DOMINO derived
using in-situ OH reactivity measurements, Atmos. Chem. Phys.,
12, 7269–7283, doi:10.5194/acp-12-7269-2012, 2012.
Sinha, V., Kumar, V., and Sarkar, C.: Chemical composition of pre-
monsoon air in the Indo-Gangetic Plain measured using a new
air quality facility and PTR-MS: high surface ozone and strong
influence of biomass burning, Atmos. Chem. Phys., 14, 5921–
5941, doi:10.5194/acp-14-5921-2014, 2014.
Sommariva, R., de Gouw, J. A., Trainer, M., Atlas, E., Goldan, P. D.,
Kuster, W. C., Warneke, C., and Fehsenfeld, F. C.: Emissions
and photochemistry of oxygenated VOCs in urban plumes in
the Northeastern United States, Atmos. Chem. Phys., 11, 7081–
7096, doi:10.5194/acp-11-7081-2011, 2011.
Staehelin, J., Keller, C., Stahel, W., Schläpfer, K., and Wunderli, S.:
Emission factors from road traffic from a tunnel study (Gubrist
tunnel, Switzerland). Part III: Results of organic compounds,
SO2 and speciation of organic exhaust emission, Atmos. Envi-
ron., 32, 999–1009, doi:10.1016/S1352-2310(97)00339-7, 1998.
Stemmler, K., Bugmann, S., Buchmann, B., Reimann, S.,
and Staehelin, J.: Large decrease of VOC emissions of
Switzerland’s car fleet during the past decade: results from
a highway tunnel study, Atmos. Environ., 39, 1009–1018,
doi:10.1016/j.atmosenv.2004.10.010, 2005.
Stockwell, C. E., Veres, P. R., Williams, J., and Yokelson, R. J.:
Characterization of biomass burning emissions from cooking
fires, peat, crop residue, and other fuels with high-resolution
proton-transfer-reaction time-of-flight mass spectrometry, At-
mos. Chem. Phys., 15, 845–865, doi:10.5194/acp-15-845-2015,
2015.
Stone, E. A., Schauer, J. J., Pradhan, B. B., Dangol, P. M., Habib, G.,
Venkataraman, C., and Ramanathan, V.: Characterization of
emissions from South Asian biofuels and application to source
apportionment of carbonaceous aerosol in the Himalayas, J. Geo-
phys. Res.-Atmos., 115, D06301, doi:10.1029/2009jd011881,
2010.
Tani, A., Hayward, S., Hansel, A., and Hewitt, C. N.: Effect of
water vapour pressure on monoterpene measurements using pro-
ton transfer reaction-mass spectrometry (PTR-MS), Int. J. Mass
Spectrom., 239, 161–169, doi:10.1016/j.ijms.2004.07.020, 2004.
Taylor, W. D., Allston, T. D., Moscato, M. J., Fazekas, G. B., Ko-
zlowski, R., and Takacs, G. A.: Atmospheric photodissociation
lifetimes for nitromethane, methyl nitrite, and methyl nitrate, Int.
J. Chem. Kinet., 12, 231–240, doi:10.1002/kin.550120404, 1980.
Tsai, S. M., Zhang, J., Smith, K. R., Ma, Y., Rasmussen, R. A.,
and Khalil, M. A. K.: Characterization of non-methane hydro-
carbons emitted from various cookstoves used in China, Environ.
Sci. Technol., 37, 2869–2877, doi:10.1021/es026232a, 2003.
Wang, Z., Nicholls, S. J., Rodriguez, E. R., Kummu, O., Hórkko, S.,
Barnard, J., Reynolds, W. F., Topol, E. J., DiDonato, J. A., and
Hazen, S. L.: Protein carbamylation links infammation,smoking,
uremia, and atherogenesis, Nat. Med., 13, 1176–1184, 2007
Warneck, P. and Williams, J.: The Atmospheric Chemist’s Com-
panion: Numerical Data for use in the Atmospheric Sciences,
Springer, Dordrecht, Heidelberg, London, New York, 1, 1–436,
doi:10.1007/978-94-007-2275-0, 2012.
Warneke, C., Roberts, J. M., Veres, P., Gilman, J., Kuster, W. C.,
Burling, I., Yokelson, R., and de Gouw, J. A.: VOC identifica-
tion and inter-comparison from laboratory biomass burning us-
ing PTR-MS and PIT-MS, Int. J. Mass Spectrom., 303, 6–14,
doi:10.1016/j.ijms.2010.12.002, 2011.
Wentzell, J. J. B., Liggio, J., Li, S. M., Vlasenko, A., Staebler, R.,
Lu, G., Poitras, M. J., Chan, T., and Brook, J. R.: Measurements
of gas phase acids in diesel exhaust: a relevant source of HNCO?,
Environ. Sci. Technol., 47, 7663–7671, doi:10.1021/es401127j,
2013.
Atmos. Chem. Phys., 16, 3979–4003, 2016 www.atmos-chem-phys.net/16/3979/2016/

C. Sarkar et al.: Wintertime high acetaldehyde, isoprene and isocyanic acid in Kathmandu Valley 4003
WHO Guidelines for Indoor Air Quality: Selected Pollutants, edited
by: Theakston, F., World Health Organization: WHO Regional
Office for Europe, Copenhagen, Denmark, 1–454, 2010.
Yassaa, N., Meklati, B. Y., Brancaleoni, E., Frattoni, M., and Cicci-
oli, P.: Polar and non-polar volatile organic compounds (VOCs)
in urban Algiers and saharian sites of Algeria, Atmos. Environ.,
35, 787–801, doi:10.1016/S1352-2310(00)00238-7, 2001.
Yokelson, R. J., Burling, I. R., Gilman, J. B., Warneke, C., Stock-
well, C. E., de Gouw, J., Akagi, S. K., Urbanski, S. P., Veres, P.,
Roberts, J. M., Kuster, W. C., Reardon, J., Griffith, D. W. T.,
Johnson, T. J., Hosseini, S., Miller, J. W., Cocker III, D. R.,
Jung, H., and Weise, D. R.: Coupling field and laboratory mea-
surements to estimate the emission factors of identified and
unidentified trace gases for prescribed fires, Atmos. Chem. Phys.,
13, 89–116, doi:10.5194/acp-13-89-2013, 2013.
Yoshino, A., Nakashima, Y., Miyazaki, K., Kato, S., Suthawaree, J.,
Shimo, N., Matsunaga, S., Chatani, S., Apel, E., Greenberg, J.,
Guenther, A., Ueno, H., Sasaki, H., Hoshi, J. Y., Yokota, H.,
Ishii, K., and Kajii, Y.: Air quality diagnosis from compre-
hensive observations of total OH reactivity and reactive trace
species in urban central Tokyo, Atmos. Environ., 49, 51–59,
doi:10.1016/j.atmosenv.2011.12.029, 2012.
Young, P. J., Emmons, L. K., Roberts, J. M., Lamarque, J. F.,
Wiedinmyer, C., Veres, P., and VandenBoer, T. C.: Isocyanic
acid in a global chemistry transport model: tropospheric dis-
tribution, budget, and identification of regions with poten-
tial health impacts, J. Geophys. Res.-Atmos., 117, D10308,
doi:10.1029/2011jd017393, 2012.
Yu, Y., Panday, A., Hodson, E., Galle, B., and Prinn, R.: Monocyclic
aromatic hydrocarbons in Kathmandu during the winter season,
Water Air Soil Poll., 191, 71–81, doi:10.1007/s11270-007-9607-
6, 2008.
Yu, Y., Galle, B., Panday, A., Hodson, E., Prinn, R., and Wang, S.:
Observations of high rates of NO2-HONO conversion in the noc-
turnal atmospheric boundary layer in Kathmandu, Nepal, At-
mos. Chem. Phys., 9, 6401–6415, doi:10.5194/acp-9-6401-2009,
2009.
Zhang, Z., Lin, L., and Wang, L.: Atmospheric oxidation
mechanism of naphthalene initiated by OH radical. A the-
oretical study, Phys. Chem. Chem. Phys., 14, 2645–2650,
doi:10.1039/c2cp23271e, 2012.
Zhao, R., Lee, A. K. Y., Wentzell, J. J. B., McDonald, A. M., Toom-
Sauntry, D., Leaitch, W. R., Modini, R. L., Corrigan, A. L.,
Russell, L. M., Noone, K. J., Schroder, J. C., Bertram, A. K.,
Hawkins, L. N., Abbatt, J. P. D., and Liggio, J.: Cloud partition-
ing of isocyanic acid (HNCO) and evidence of secondary source
of HNCO in ambient air, Geophys. Res. Lett., 41, 6962–6969,
doi:10.1002/2014gl061112, 2014.
www.atmos-chem-phys.net/16/3979/2016/ Atmos. Chem. Phys., 16, 3979–4003, 2016