Embed Size (px)
Citation preview
Overview on transport data and MRV potential in Asia
Bert FabianClean Air Initiative for Asian Cities Center (CAI-Asia Center)
Transport Sector and NAMAs: Assessing Data Readiness for MRVPasig, Philippines
9 February 2012
• Background and context
• Overview on transport data management in Asian countries and cities
• Parameters necessary for emissions estimation
• Transport planning – national, regional, and city plans –country experiences
Outline
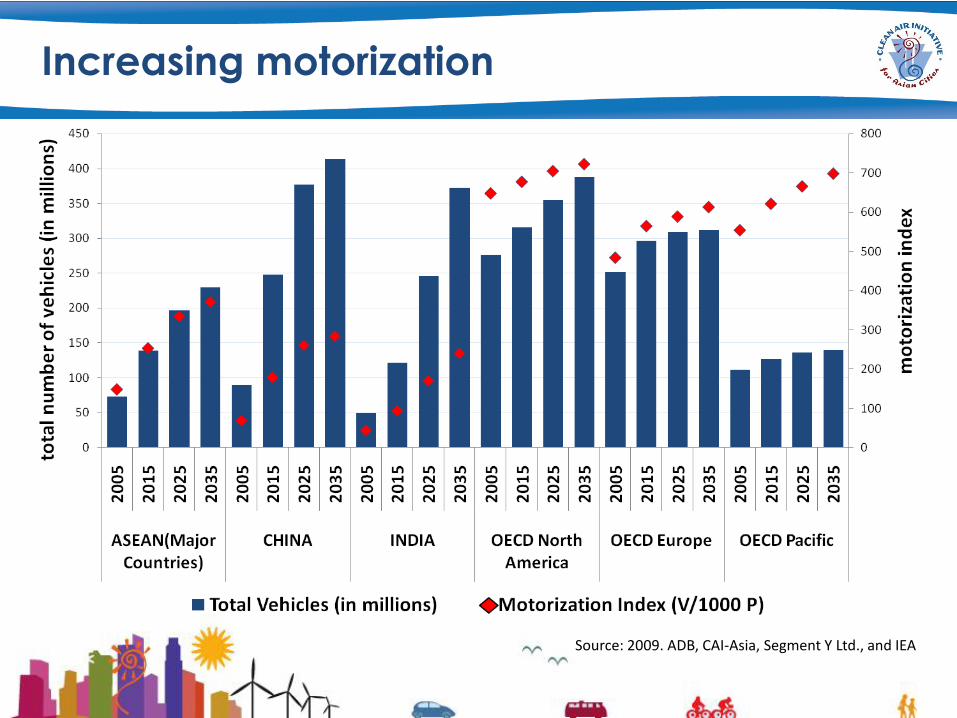
Increasing motorization
Source: 2009. ADB, CAI-Asia, Segment Y Ltd., and IEA
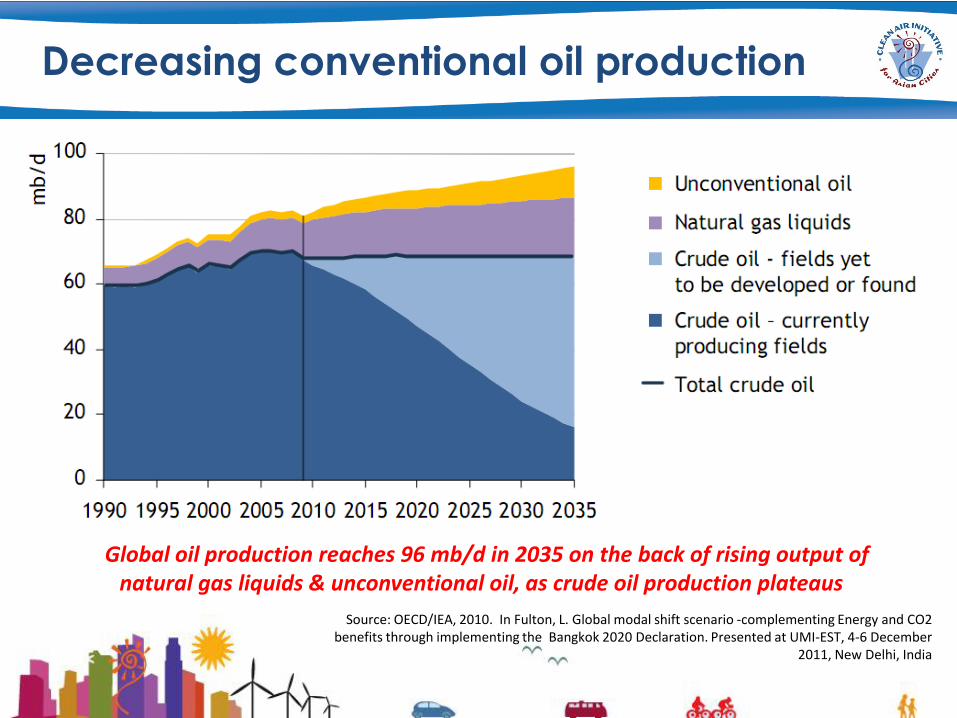
Decreasing conventional oil production
Global oil production reaches 96 mb/d in 2035 on the back of rising output ofnatural gas liquids & unconventional oil, as crude oil production plateaus
Source: OECD/IEA, 2010. In Fulton, L. Global modal shift scenario ‐complementing Energy and CO2benefits through implementing the Bangkok 2020 Declaration. Presented at UMI-EST, 4-6 December
2011, New Delhi, India
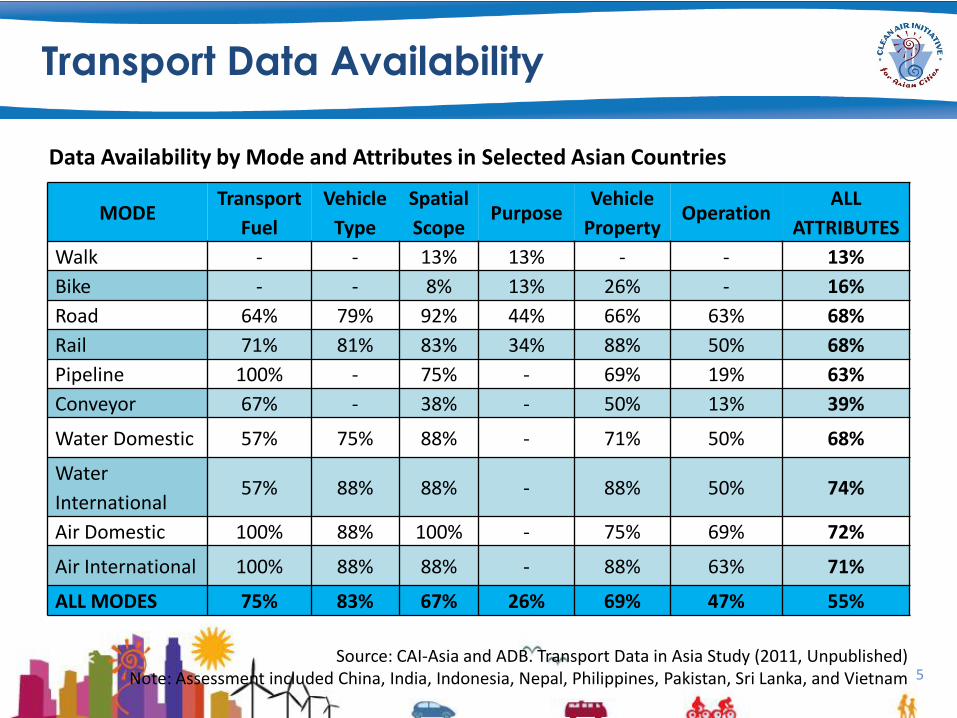
Transport Data Availability
5
MODETransport
Fuel
Vehicle
Type
Spatial
ScopePurpose
Vehicle
PropertyOperation
ALL
ATTRIBUTES
Walk - - 13% 13% - - 13%
Bike - - 8% 13% 26% - 16%
Road 64% 79% 92% 44% 66% 63% 68%
Rail 71% 81% 83% 34% 88% 50% 68%
Pipeline 100% - 75% - 69% 19% 63%
Conveyor 67% - 38% - 50% 13% 39%
Water Domestic 57% 75% 88% - 71% 50% 68%
Water
International57% 88% 88% - 88% 50% 74%
Air Domestic 100% 88% 100% - 75% 69% 72%
Air International 100% 88% 88% - 88% 63% 71%
ALL MODES 75% 83% 67% 26% 69% 47% 55%
Source: CAI-Asia and ADB. Transport Data in Asia Study (2011, Unpublished)Note: Assessment included China, India, Indonesia, Nepal, Philippines, Pakistan, Sri Lanka, and Vietnam
Data Availability by Mode and Attributes in Selected Asian Countries
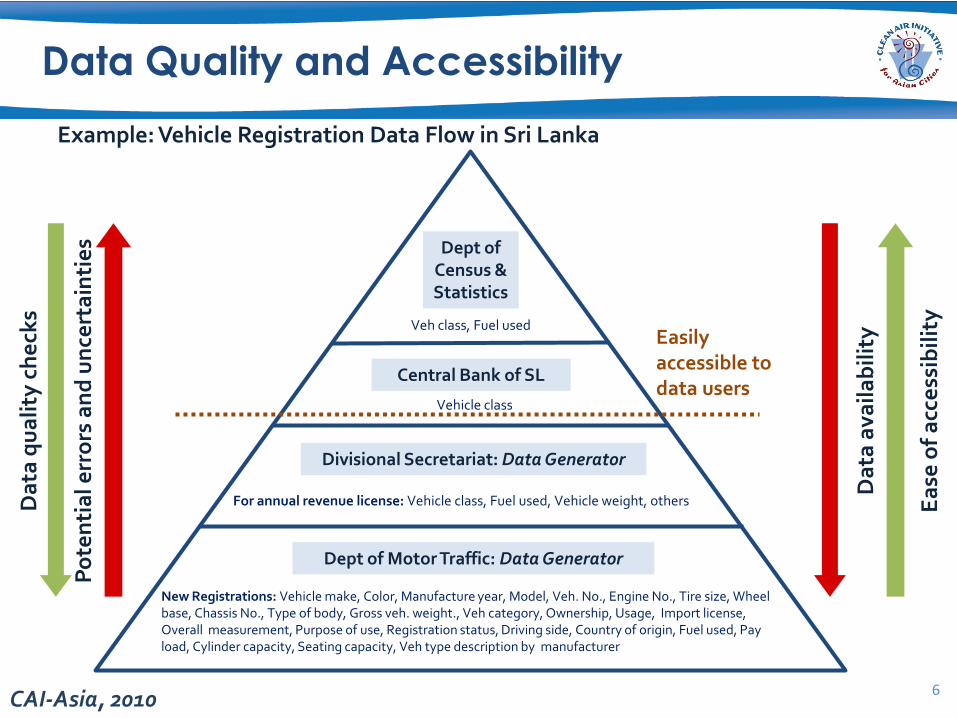
Data Quality and Accessibility
66
Dept of Census & Statistics
Dept of Motor Traffic: Data Generator
New Registrations: Vehicle make, Color, Manufacture year, Model, Veh. No., Engine No., Tire size, Wheel base, Chassis No., Type of body, Gross veh. weight., Veh category, Ownership, Usage, Import license,Overall measurement, Purpose of use, Registration status, Driving side, Country of origin, Fuel used, Pay load, Cylinder capacity, Seating capacity, Veh type description by manufacturer
Divisional Secretariat: Data Generator
Example: Vehicle Registration Data Flow in Sri Lanka
For annual revenue license: Vehicle class, Fuel used, Vehicle weight, othersDa
ta q
ua
lity
ch
eck
s
Da
ta a
vaila
bil
ity
Central Bank of SL
Vehicle class
Veh class, Fuel usedEasily accessible to data users
Po
ten
tia
l err
ors
an
d u
nce
rta
inti
es
Ea
se o
f a
cce
ssib
ilit
y
CAI-Asia, 2010
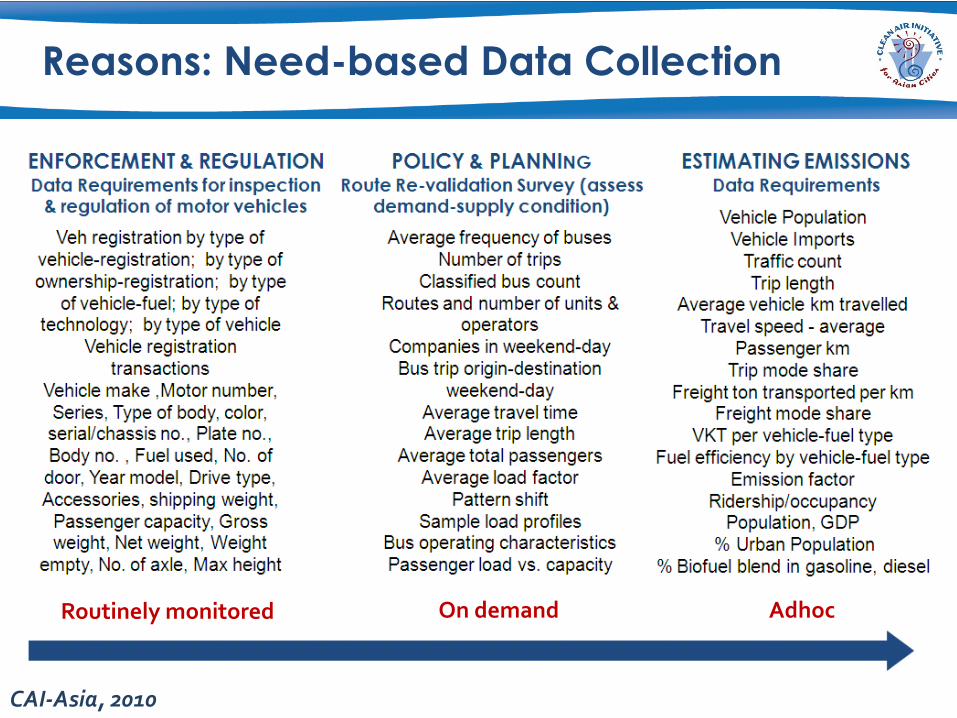
Reasons: Need-based Data Collection
CAI-Asia, 2010
On demand AdhocRoutinely monitored
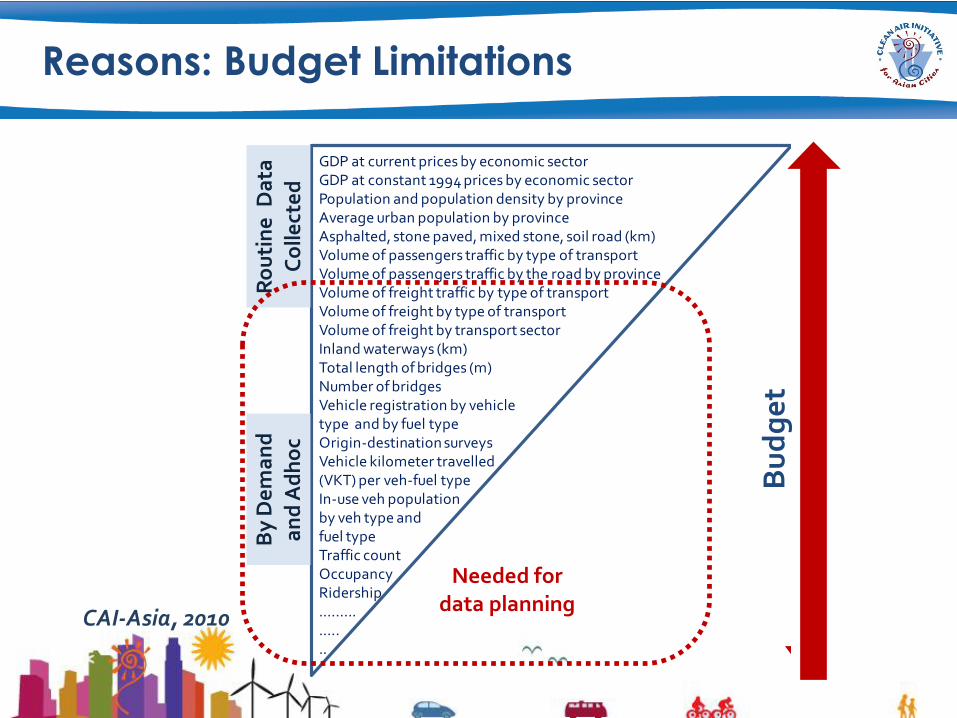
Reasons: Budget Limitations
CAI-Asia, 2010
GDP at current prices by economic sectorGDP at constant 1994 prices by economic sectorPopulation and population density by provinceAverage urban population by provinceAsphalted, stone paved, mixed stone, soil road (km)Volume of passengers traffic by type of transportVolume of passengers traffic by the road by provinceVolume of freight traffic by type of transportVolume of freight by type of transportVolume of freight by transport sectorInland waterways (km)Total length of bridges (m)Number of bridgesVehicle registration by vehicle type and by fuel typeOrigin-destination surveysVehicle kilometer travelled (VKT) per veh-fuel typeIn-use veh populationby veh type and fuel typeTraffic countOccupancyRidership.……...…...
By
De
ma
nd
a
nd
Ad
ho
cR
ou
tin
e D
ata
C
olle
cte
d
Inve
stm
ent
Needed for data planning
Bu
dg
et
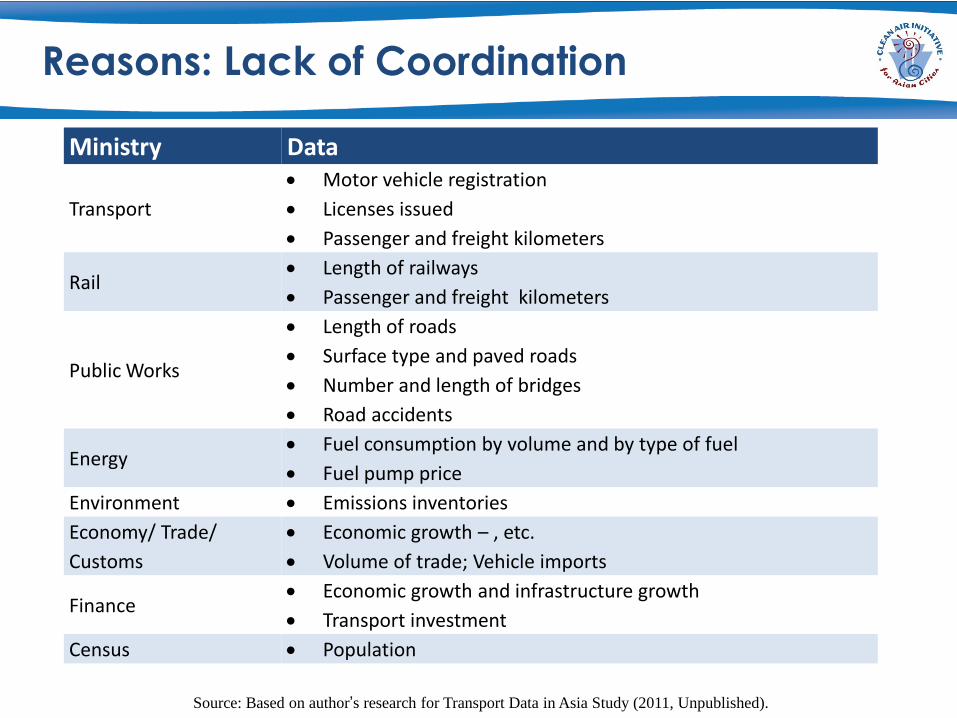
Reasons: Lack of Coordination
Ministry Data
Transport
Motor vehicle registration
Licenses issued
Passenger and freight kilometers
Rail Length of railways
Passenger and freight kilometers
Public Works
Length of roads
Surface type and paved roads
Number and length of bridges
Road accidents
Energy Fuel consumption by volume and by type of fuel
Fuel pump price
Environment Emissions inventories
Economy/ Trade/
Customs
Economic growth – , etc.
Volume of trade; Vehicle imports
Finance Economic growth and infrastructure growth
Transport investment
Census Population
Source: Based on author’s research for Transport Data in Asia Study (2011, Unpublished).
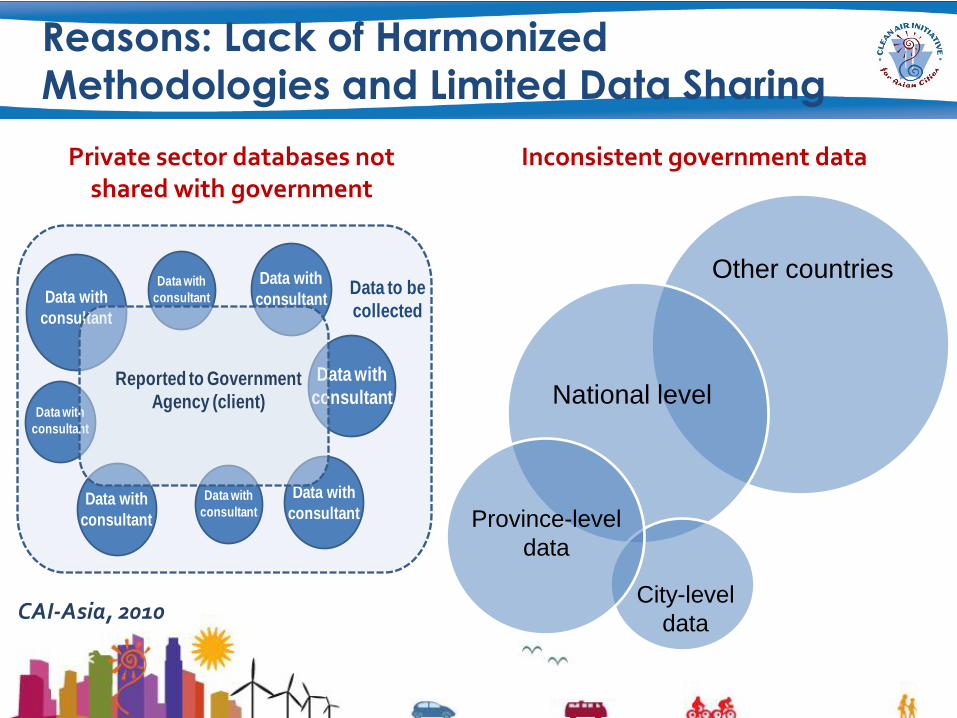
Reasons: Lack of Harmonized
Methodologies and Limited Data Sharing
Private sector databases not shared with government
CAI-Asia, 2010
Data with
consultant
Data with
consultantData with
consultant
Data with
consultant
Data with
consultant
Data with
consultant
Data with
consultant
Data with
consultant
Reported to Government
Agency (client)
Data to be
collected
Inconsistent government data
National level
Province-level
data
Other countries
City-level
data
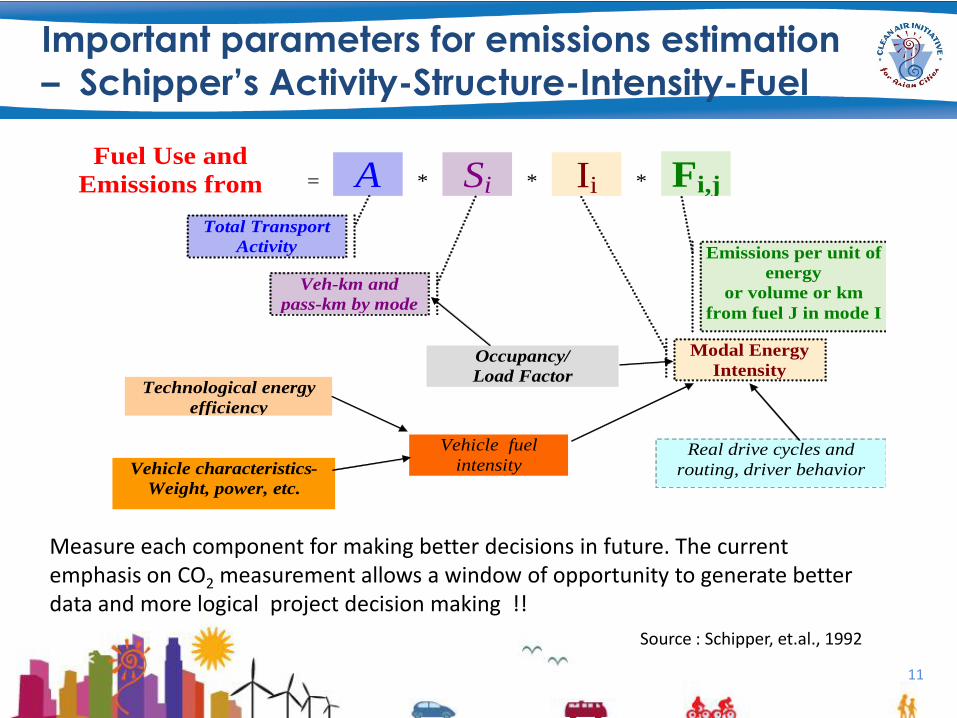
Important parameters for emissions estimation
– Schipper’s Activity-Structure-Intensity-Fuel
11
= A Si Ii Fi,j Fuel Use and
Emissions from
Transport
* * *
Occupancy/
Load Factor
Vehicle fuel
intensity Vehicle characteristics-
Weight, power, etc.
Technological energy
efficiency
Real drive cycles and
routing, driver behavior
Veh-km and
pass-km by mode
Modal Energy
Intensity
Emissions per unit of
energy
or volume or km
from fuel J in mode I
Total Transport
Activity
Measure each component for making better decisions in future. The current emphasis on CO2 measurement allows a window of opportunity to generate better data and more logical project decision making !!
Source : Schipper, et.al., 1992
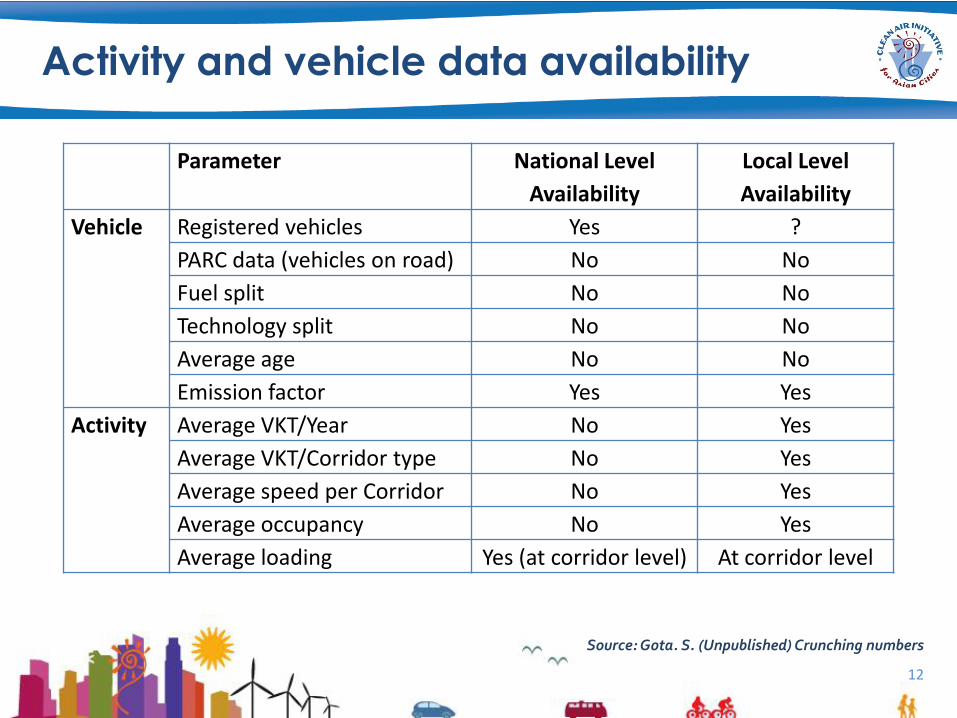
Parameter National Level
Availability
Local Level
Availability
Vehicle Registered vehicles Yes ?
PARC data (vehicles on road) No No
Fuel split No No
Technology split No No
Average age No No
Emission factor Yes Yes
Activity Average VKT/Year No Yes
Average VKT/Corridor type No Yes
Average speed per Corridor No Yes
Average occupancy No Yes
Average loading Yes (at corridor level) At corridor level
Activity and vehicle data availability
12
Source: Gota. S. (Unpublished) Crunching numbers
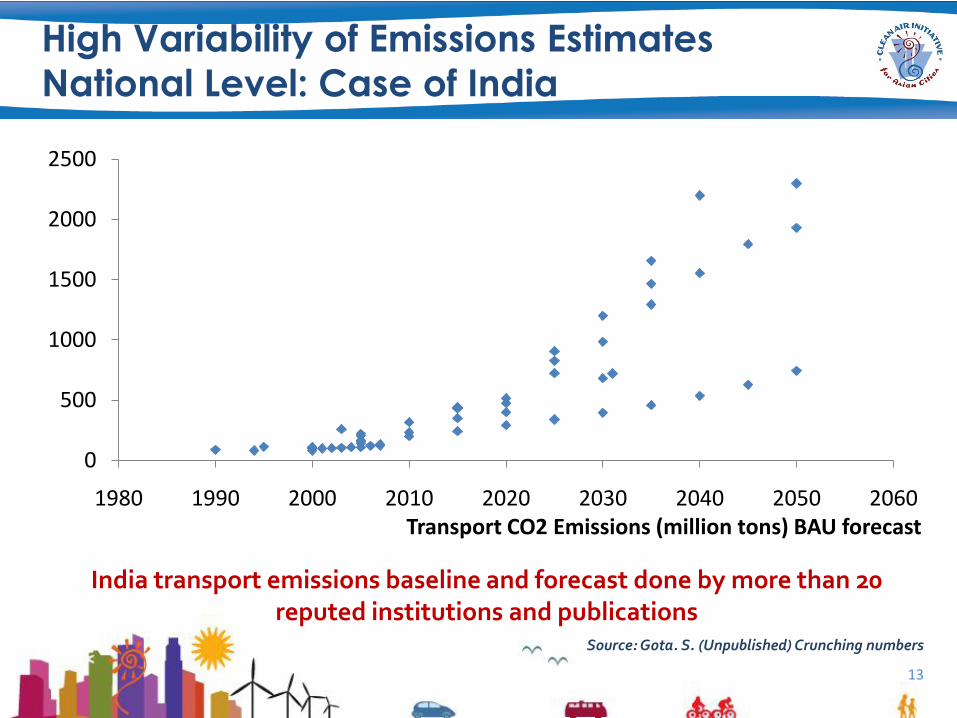
High Variability of Emissions Estimates
National Level: Case of India
India transport emissions baseline and forecast done by more than 20 reputed institutions and publications
13
0
500
1000
1500
2000
2500
1980 1990 2000 2010 2020 2030 2040 2050 2060Transport CO2 Emissions (million tons) BAU forecast
Source: Gota. S. (Unpublished) Crunching numbers
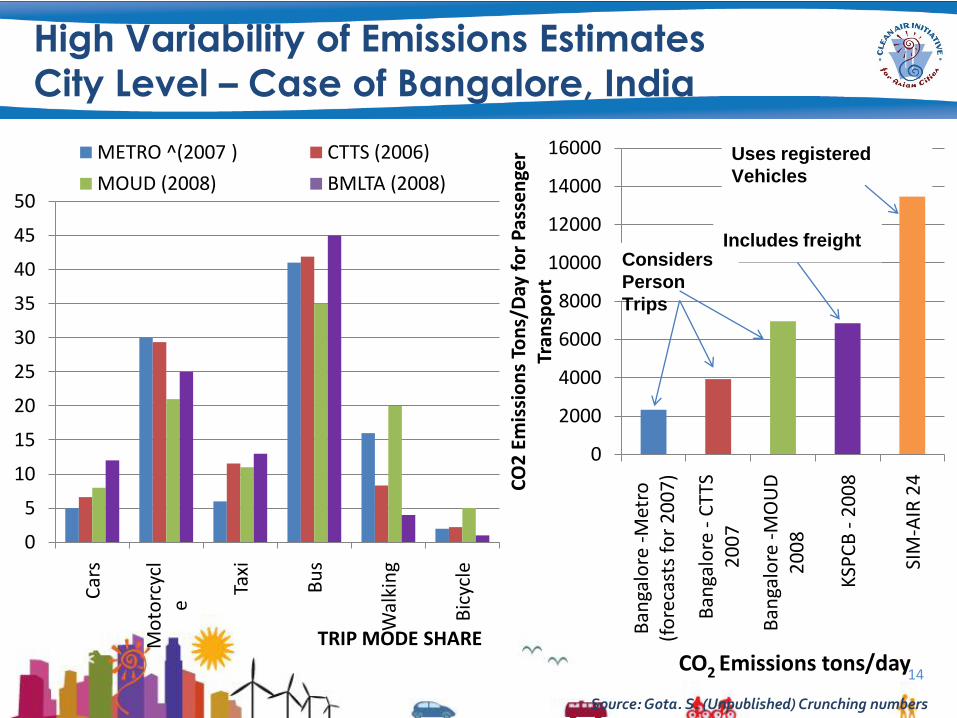
High Variability of Emissions Estimates
City Level – Case of Bangalore, India
14
0
5
10
15
20
25
30
35
40
45
50
Car
s
Mo
torc
ycl
e
Taxi
Bu
s
Wal
kin
g
Bic
ycle
METRO ^(2007 ) CTTS (2006)
MOUD (2008) BMLTA (2008)
TRIP MODE SHARECO2 Emissions tons/day
0
2000
4000
6000
8000
10000
12000
14000
16000
Ban
galo
re -
Met
ro
(fo
reca
sts
for
20
07
)
Ban
galo
re -
CT
TS
20
07
Ban
galo
re -
MO
UD
2
00
8
KSP
CB
-2
00
8
SIM
-AIR
24CO
2 E
mis
sio
ns
Ton
s/D
ay f
or
Pas
sen
ger
Tran
spo
rt
Considers
Person
Trips
Uses registered
Vehicles
Includes freight
Source: Gota. S. (Unpublished) Crunching numbers
TEEMP City - Evaluating impact of city investments
15
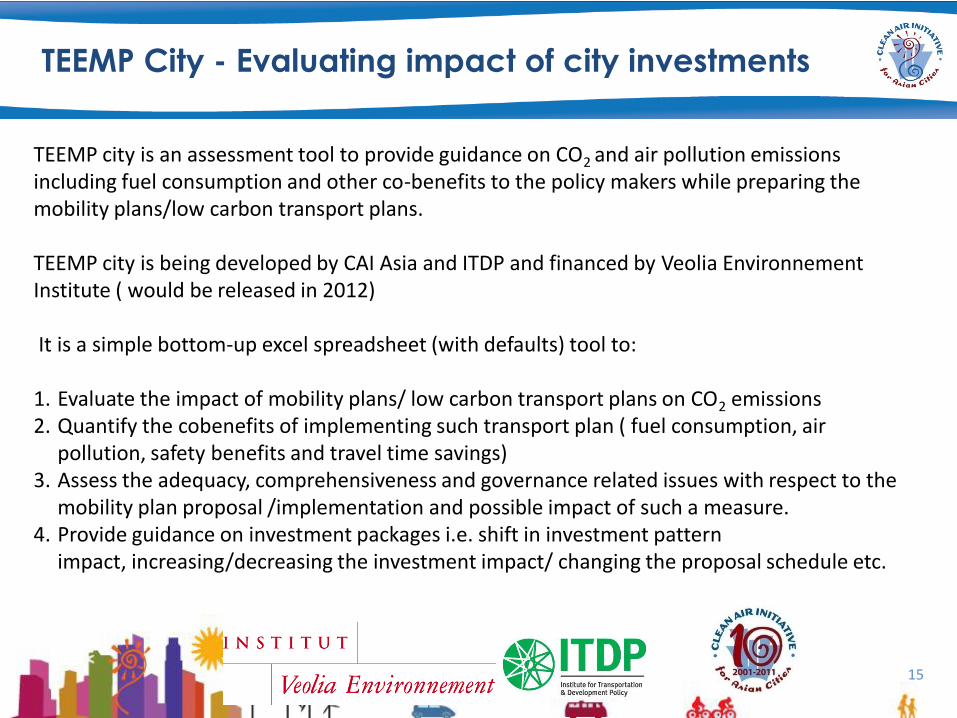
TEEMP city is an assessment tool to provide guidance on CO2 and air pollution emissions including fuel consumption and other co-benefits to the policy makers while preparing the mobility plans/low carbon transport plans.
TEEMP city is being developed by CAI Asia and ITDP and financed by Veolia EnvironnementInstitute ( would be released in 2012)
It is a simple bottom-up excel spreadsheet (with defaults) tool to:
1. Evaluate the impact of mobility plans/ low carbon transport plans on CO2 emissions2. Quantify the cobenefits of implementing such transport plan ( fuel consumption, air
pollution, safety benefits and travel time savings)3. Assess the adequacy, comprehensiveness and governance related issues with respect to the
mobility plan proposal /implementation and possible impact of such a measure. 4. Provide guidance on investment packages i.e. shift in investment pattern
impact, increasing/decreasing the investment impact/ changing the proposal schedule etc.
16
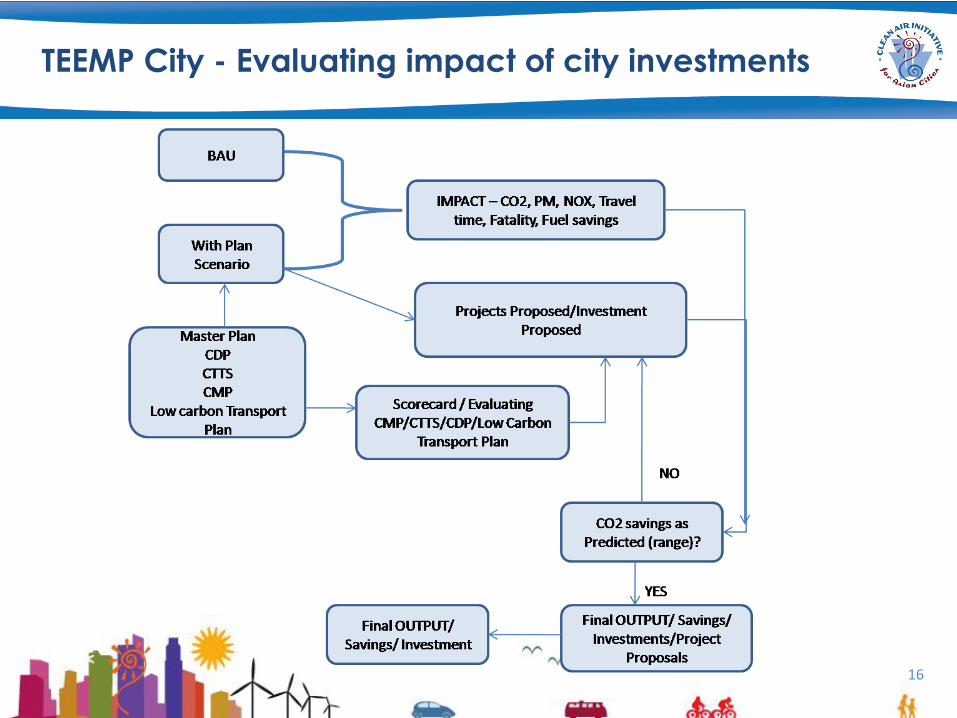
TEEMP City - Evaluating impact of city investments
17
-
5,000
10,000
15,000
20,000
25,000
30,000
35,000
40,000
Project Scenario Revised Project Scenario
Tho
usa
nd
s
Total CO2 Savings (tons)
0%
10%
20%
30%
40%
50%
60%
70%
80%
90%
100%
2009 Baseline 2030
Mobility Plan 2030
% of Motorized Trips
0
Metro/Monorail
BRT
Bus
Taxi
3W
2W
Car5,069
5,070
5,070
5,071
5,071
5,072
5,072
5,073
5,073
5,074
Project Scenario Revised Project Scenario
Total Cost (million)
-
2,000
4,000
6,000
8,000
10,000
2009 2014 2019 2024 2029
VKT (millions) BAU VKT (millions) Mobility
-
200
400
600
800
1,000
2009 2014 2019 2024 2029
Fatalities BAU Fatalities Mobility
-
500
1,000
1,500
2,000
2009 2014 2019 2024 2029
Hours(millions) BAU Hours(millions) Mobility
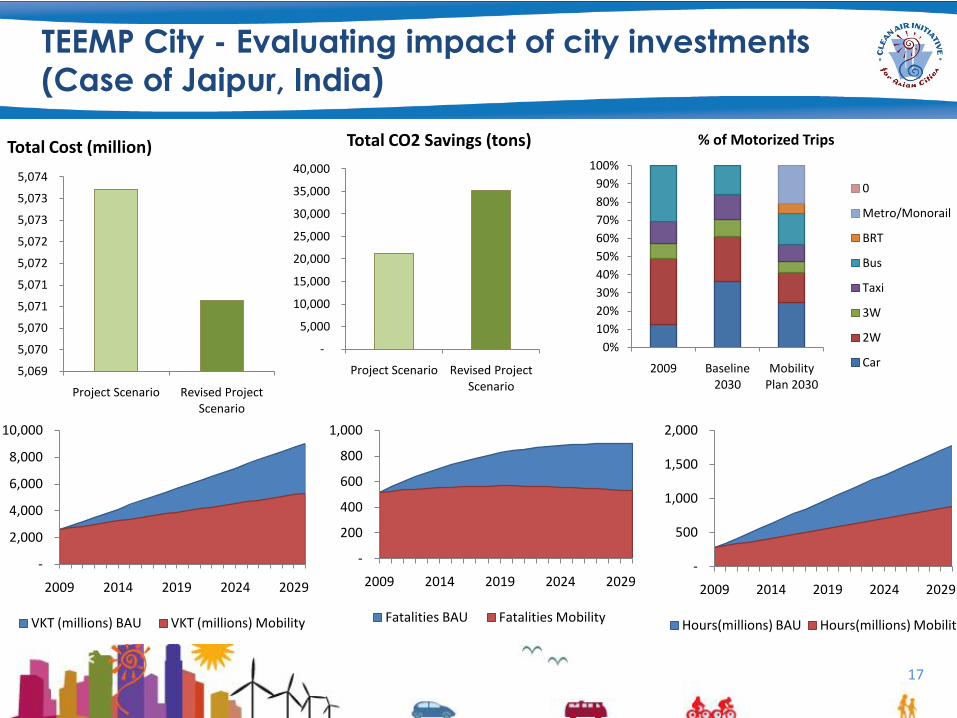
TEEMP City - Evaluating impact of city investments
(Case of Jaipur, India)
• Improve transport data collection and management
– Need for consolidated transport database
– Better coordination among various government agencies
– Harmonization of methodologies and definitions
• Use ASIF as a basis for measuring and monitoring emissions – transparent, practical, and logical methodology
• Evaluating implications of city transport plans on emissions and other co-benefits
Key issues
18
For more information
19
[email protected] 3505 Robinsons-Equitable Tower
ADB Avenue, Pasig CityMetro Manila 1605
Philippines
CAI-Asia Center
[email protected] Reignwood Building,
No. 8 YongAnDongLiJianguomenwai Avenue Beijing
China
CAI-Asia China Office
[email protected] Elegance
Elegance Tower, Mathura Road, Jasola Vihar, New Delhi
India
CAI-Asia India Office
CAI-Asia Country Networks
China . India . Indonesia . Nepal . Pakistan . Philippines . Sri Lanka . Vietnam
CAI-Asia Center Members 229 CAI-Asia Partnership Members
• 45 Cities
• 19 Environment ministries
• 13 Other Government agencies
• 17 Development agencies and foundations
• 66 NGOs
• 37 Academic and research institutes
• 32 Private sector companies
Donors in 2011Asian Development Bank ClimateWorks Foundation Energy Foundation
Fredskorpset Norway Fu Tak Iam Foundation German International
Cooperation (GIZ) Guangdong Government Institute for Global
Environmental Strategies (IGES) Institute for Transport Policy Studies
Institute for Transportation and Development Policy International Union for
Conservation of Nature Korea Transport Institute MAHA Philippine
Business for the Environment United Nations Centre for Regional
Development (UNCRD) United Nations Environment Program Partnership
for Clean Fuels and Vehicles (UNEP PCFV) Veolia World Bank
www.cleanairinitiative.org