Embed Size (px)
Citation preview

1
The Differential Ability Scales–Second Edition (DAS- II; Elliott, 2007a), developed and standardized in the United States, is a modern psychologi-cal assessment instrument with a longer history than its publication date
would suggest (see Rapid Reference 1.1). It is based upon its predecessor, the Differential Ability Scales (DAS; Elliott, 1990a, 1990b), which had as its origin the British Ability Scales (BAS; Elliott, 1983). As its name suggests, the DAS- II was developed with a primary focus on specifi c cognitive abilities rather than on general “intelligence.”
STRUCTURE OF THE DAS
The DAS- II consists of a cognitive battery of 20 subtests, covering an age range of 2 years, 6 months through 17 years, 11 months (2:6 through 17:11). The bat-tery is divided into two overlapping age levels: (1) The Early Years battery is normed from age 2:6 through 8:11, with a usual age range of 2:6 through 6:11; (2) The School- Age battery is normed from age 5:0 through 17:11, and has a usual age range of 7:0 through 17:11. With those overlaps between the Early Years and the School Age batteries, it will be seen that the DAS- II Early Years and School- Age batteries were conormed for children ages 5:0 through 8:11 and therefore have a four- year normative overlap. (See Rapid Reference 1.2 for a description of the DAS- II subtests.)
The Early Years battery is further divided into two levels, lower and upper. The Lower Early Years level is most appropriate for young children ages 2:6 through 3:5, although it may also be used with older children with special needs. The Upper Early Years level is suitable for children normally in the age range of 3:6–6:11, although it may also be used with children up to age 8:11 if they have diffi culty with the materials in the School- Age battery.
The DAS- II battery yields a composite score called General Conceptual
One
OVERVIEW
COPYRIG
HTED M
ATERIAL

2 ESSENTIALS OF DAS-II® ASSESSMENT
DAS- II Batteries
Author: Colin ElliottPublication date: 2007What the test measures: Verbal (Gc), Nonverbal Reasoning (Gf ), Spatial (Gv), Working Memory (Gsm), Processing Speed (Gs), Phonological Processing (Ga), Recall of Objects (Glr), and General Conceptual Ability (GCA), which is a measure of the general factor g. Age range: 2:6–17:11Average Administration time: Six core subtests to obtain three clusters and GCA score = 31–40 minutes. Diagnostic subtests—School Readiness = 17 minutes, Working Memory = 12 minutes, Processing Speed = 9 minutes, Pho-nological Processing = 10 minutes. Qualifi cation of examiners: Graduate- or professional- level training in psy-chological assessmentComputer program: Scoring program included as well as a CD, which in-cludes help in administering the Phonological Processing subtest and also useful demonstrations of administering the test using American Sign Language.Publisher: The Psychological Corporation
A division of Pearson555 Academic CourtSan Antonio, TX 78204-2498Ordering phone number: 800-211-8378http: // www.psychcorp.comWeb site: www.DAS- II.com
Rapid Reference 1.1
DAS- II Subtests
Verbal Subtests• Verbal Comprehension: following oral instructions to point to or move pictures
and toys. • Naming Vocabulary: naming pictures. • Word Defi nitions: explaining the meaning of each word. Words are spoken by
the evaluator. • Verbal Similarities: explaining how three things or concepts go together, what
they all are (e.g., house, tent, igloo; love, hate, fear)
Rapid Reference 1.2

Nonverbal Reasoning Subtests• Picture Similarities: multiple- choice matching of pictures on the basis of re-
lationships, both concrete (e.g., two round things among other shapes) and abstract (e.g., map with globe from among other round things). [Nonverbal Cluster in Lower Early Years battery]
• Matrices: solving visual puzzles by choosing the correct picture or design to complete a logical pattern.
• Sequential and Quantitative Reasoning: fi guring out sequential patterns in pic-tures or geometric fi gures, or common rules in numerical relationships.
Spatial Subtests• Copying: drawing pencil copies of abstract, geometric designs.• Recall of Designs: drawing pencil copies of abstract, geometric designs from
memory after a fi ve- second view of each design. • Pattern Construction: imitating constructions made by the examiner with
wooden blocks, copying geometric designs with colored tiles or patterned cubes. There are time limits and bonus points for fast work. An alternative, “un-timed” procedure uses time limits but no speed bonuses. [Nonverbal Cluster in Lower Early Years battery]
Diagnostic Subtests• Early Number Concepts: oral math questions with illustrations—counting,
number concepts, and simple arithmetic. • Matching Letter- Like Forms: multiple- choice matching of shapes that are similar
to letters. • Recall of Digits Forward: repeating increasingly long series of digits dictated at
two digits per second.• Recall of Digits Backward: repeating, in reverse order, increasingly long series
of digits dictated at two digits per second. • Recognition of Pictures: seeing one, two, or three pictures for fi ve seconds or
four pictures for ten seconds and then trying to fi nd those pictures within a group of four to seven similar pictures.
• Recall of Objects—Immediate: viewing a page of 20 pictures, hearing them named by the evaluator, trying to name the pictures from memory, seeing them again, trying again to name all the pictures, and repeating the process once more. The score is the total of all the pictures recalled on each of the three trials, including pictures recalled two or three times.
• Recall of Objects—Delayed: trying to recall the pictures again on a surprise retest 15 to 20 minutes later.
• Speed of Information Processing: the student scans rows of fi gures or numbers and marks the fi gure with the most parts or the greatest number in each row. The score is based on speed. Accuracy does not count unless it is very poor.
• Phonological Processing: rhyming, blending sounds, deleting sounds, and identi-fying the individual sounds in words.
• Rapid Naming: naming colors or pictures as quickly as possible without making mistakes. The score is based on speed and accuracy
• Recall of Sequential Order: sequencing, from highest to lowest, increasingly long series of words that include body parts, and for more diffi cult items, non- body parts.

4 ESSENTIALS OF DAS-II® ASSESSMENT
Ability (GCA), which provides an estimate of overall reasoning and concep-tual abilities. In addition, for ages 3:6 to 17:11, a Special Nonverbal Composite (SNC) is available and derived from the nonverbal core subtests appropriate for each battery level. The DAS- II also provides lower- level composite scores called cluster scores that are derived from highly g- saturated core subtests. Finally, there are numerous diagnostic subtests and clusters that measure other specifi c abili-ties. These diagnostic subtests do not contribute to the GCA or SNC, but give additional information about cognitive strengths and weaknesses. The overall structure is summarized in Figure 1.1.
Battery Usual Age Range Full Normative Age Range
Lower Early Years 2:6 – 3:5 2:6 – 8:11 Core Clusters
GCAVerbalNonverbal
Upper Early Years 3:6 – 6:11 3:6 – 8:11 Core Clusters
GCASpecial Nonverbal Composite VerbalNonverbal Reasoning Spatial
Diagnostic Clusters School Readiness Working Memory Processing Speed
School Age 7:0 – 17:11 5:0 – 17:11 Core Clusters
GCASpecial Nonverbal Composite VerbalNonverbal Reasoning Spatial
Diagnostic Clusters Working Memory Processing Speed
Figure 1.1 DAS- II Clusters by Battery
OVERVIEW 5
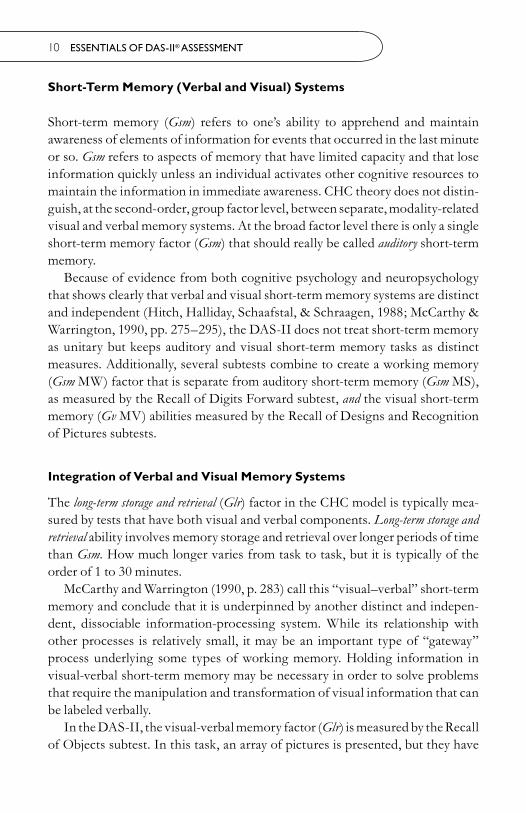
THEORETICAL UNDERPINNINGS
The DAS- II was not developed solely to refl ect a single model of cognitive abilities but was designed to address processes that often underlie children’s diffi culties in learning and what scientists know about neurological structures underlying these abilities. The selection of the abilities to be measured by the DAS- II was in-fl uenced by a variety of theoretical points of view, but the end result is consistent with Gf- Gc theory (now commonly referred to as the Cattell- Horn- Carroll the-ory, or simply CHC). This is probably the best known and most widely accepted theory of intellectual factors among practitioners of individual psychological assessment and is derived from the Horn- Cattell Gf- Gc model [e.g., Cattell (1941, 1971, 1987), Cattell & Horn (1978), Horn (1988, 1991), Horn & Noll (1997)]. Gf
and Gc refer, respectively, to “fl uid” and “crystallized” intelligence, but current versions of the theory recognize as many as seven different broad cognitive fac-tors or abilities. See Carroll (1993); Flanagan and McGrew (1997); Flanagan, McGrew, and Ortiz (2000); Flanagan and Ortiz (2001); Flanagan, Ortiz, and Alfonso (2007); Flanagan, Ortiz, Alfonso, and Mascolo (2002); Horn (1985, 1988, 1991); Horn and Cattell (1966); Horn and Noll (1997); McGrew (1997); McGrew and Flanagan (1998); Woodcock (1990); and Woodcock and Mather (1989) for discussions of Gf- Gc, now usually called the Cattell- Horn- Carroll (CHC) theory. Carroll’s monumental (1993) review and re- analysis of hundreds of factor analytic studies of many psychological tests provided a solid empiri-cal foundation for CHC theory. The factor structure that Carroll devised on the basis of his research was remarkably congruent with the theoretical struc-ture developed by Cattell and Horn (1978; Horn, 1988, 1991), which lent fur-ther credence to the amalgamated CHC theory as subsequently developed by Woodcock, McGrew, Flanagan, and others [e.g., Flanagan & McGrew (1997); Flanagan, McGrew, & Ortiz (2000); Flanagan & Ortiz (2001); Flanagan, Ortiz, & Alfonso (2007); Flanagan, Ortiz, Alfonso, & Mascolo (2002); Horn (1991); McGrew (1997); McGrew & Flanagan (1998); McGrew, Werder, & Woodcock (1991); Woodcock (1990, 1993); and Woodcock & Mather (1989)]. However, even with a growing consensus as to the nature and structure of human cognitive abilities, there remains substantive debate regarding the number of factors rep-resenting independent abilities in a cognitive model, the precise nature of each of those factors (Horn & Blankson, 2005; Carroll, 2005), and to what extent, if any, subtests from different test batteries that purport to measure a given factor actually do so (Alfonso, Flanagan, & Radwan, 2005).
Despite the fact that no single theory or model has universal acceptance, there is a common core of theory and research that supported the development of the

6 ESSENTIALS OF DAS-II® ASSESSMENT
DAS- II. Such research indicates that human abilities are complex and often are not best explained solely in terms of a single cognitive factor (g), or even in terms of several lower- order factors. These abilities are presented as multiple dimen-sions on which individuals show reliably observable differences, and are related to how children learn, achieve, and solve problems. Although these abilities are interrelated, they do not completely overlap, thus making many of them distinct (Carroll, 1993). The wide range of human abilities represents a number of inter-linked subsystems of information processing that have structural correlates in the central nervous system, in which some functions are distinct and others are integrated. Some formulations of CHC theory (e.g., Carroll, 1993, 2005) include an overarching, single factor, g , at the top of the hierarchy. Others (e.g., Horn, 1991; Horn & Blankson, 2005) dispute the importance, or even the existence, of a single, overall level of cognitive ability and emphasize the importance of the separate abilities. Yet others (e.g., Flanagan & McGrew, 1997; Flanagan, McGrew, & Ortiz, 2000) do not take a rigid stand on the question of an overall g , but operationalize the theory on the basis of the separate factors. All of these versions of CHC theory maintain at least two strata of abilities: several broad abilities each including several narrow abilities. In the three- stratum model (e.g., Carroll, 2005), the narrow abilities are called Stratum I, the broad abilities Stra-tum II, and g , at the top of the hierarchy, Stratum III.
Flanagan and McGrew (1997); Flanagan, McGrew, and Ortiz (2000); Flana-gan and Ortiz (2001); Flanagan, Ortiz, and Alfonso (2007); Flanagan, Ortiz, Al-fonso, and Mascolo (2002); Horn (1991); McGrew (1997); McGrew and Flana-gan (1998); McGrew, Werder, and Woodcock (1991); Woodcock (1990, 1993); and Woodcock and Mather (1989) have adopted a notation system, largely based on that of Carroll (1993). Symbols for broad (Stratum II) abilities are written with a capital G and italicized, lowercase letters (e.g., Ga is auditory processing, and Glr is long- term storage and retrieval). Symbols for narrow (Stratum I) abili-ties within the various broad abilities are usually written with one or two capital letters or a capital letter and a digit (e.g., SR is spatial relations within Gv, I is induction within Gf, and K1 is general science information within Gc). Other notations are used occasionally (e.g., PC:A and PC:S are, respectively, phonetic coding: analysis and phonetic coding: synthesis). Several similar, but not identi-cal, verbal labels are given to the abilities (e.g., Gv has been called “visual pro-cessing,” “visual / spatial processing,” and “visual / spatial thinking”), so the more- or- less agreed- upon symbols function as a valuable common notation with less risk of misunderstanding.
The following section outlines some links between the DAS- II ability con-structs and neuropsychological structures in the areas of verbal and spatial

OVERVIEW 7
abilities, fl uid reasoning abilities, several aspects of memory, and processing speed.
Broad Verbal and Spatial Abilities
The DAS- II Verbal and Spatial ability clusters refl ect major systems through which individuals receive, perceive, remember, and process information. Both systems are linked to auditory and visual modalities and factorially represent verbal [crystallized intelligence (Gc)] and visual [visual- spatial (Gv)] thinking.
Neuropsychologically, there is strong evidence for the existence of these systems. They tend to be localized in the left and right cerebral hemispheres, respectively, although the localization is complicated (see, for example, Hale & Fiorello, 2004, pp. 67–78) and there are individual differences in areas of localization of function. Moreover, the systems are doubly dissociated—that is, they represent two distinct, independent systems of information processing (McCarthy & Warrington, 1990; Springer & Deutsch, 1989). The systems are independent insofar as each one may remain intact if the other is damaged. In the DAS- II, the two factors (verbal and spatial) are measured by the Verbal and Spatial clusters in both the Early Years and School- Age batteries.
Crystallized ability (Gc) refers to the application of acquired knowledge and learned skills to answering questions and solving problems presenting at least broadly familiar materials and processes. Virtually all tests of Gc are verbal, as that is the nature of many crystallized tasks: language is the primary means by which we express and use acquired knowledge. Most verbal subtests of intelligence scales primarily involve crystallized intelligence. Subtests of general knowledge and vocabulary are relatively pure measures of crystallized intelligence. The over-lap between crystallized intelligence and verbal information processing is indeed so strong that we believe that the meaning of the factor and the test scores that measure it is best expressed as “Verbal,” as in the DAS- II cluster score.
We note here that within the area of auditory- verbal processing there are dis-tinctions that have to be made between different types of cognitive processes. Most of the tasks that are included under the Gc factor are concerned with ver-bal knowledge (including vocabulary), comprehension of single or multiple sen-tences, and verbal reasoning. All these are relatively high- level cognitive tasks, requiring complex processing, analysis of meaning, and retrieval of information that has been stored in long- term verbal memory. In contrast, there are other verbal factors that require immediate, less complex verbal processing. Auditory
short- term memory (Gsm) is measured by tasks that entail repeating words that have been heard, with little or no processing of the meaning of the words themselves.

8 ESSENTIALS OF DAS-II® ASSESSMENT
We can characterize this as relatively simple information processing. Similarly, auditory processing ability (Ga) is measured by tasks that require the individual to analyze the component sounds of words that are presented. Again, such tasks do not require the meaning of those words to be an important component of the task. Both Gsm and Ga will be discussed below.
Visual- spatial thinking (Gv) involves a range of visual processes, ranging from fairly simple visual perceptual tasks to higher level, visual, cognitive processes. Woodcock and Mather (1989) defi ne Gv in part: “In Horn- Cattell theory, ‘broad visualization’ requires fl uent thinking with stimuli that are visual in the mind’s eye. . . .” Although Gv tasks are often complex and mentally challenging, Gv pri-marily relies on visual processing that involves the perception of and ability to vi-sualize mental rotations and reversals of visual fi gures. It is not dependent on the ability of the individual to use internal verbal language to help solve problems.
Again, we note at this point that not all “nonverbal” tasks measure Gv. Be-cause we have stipulated the condition (which is borne out by factor- analytic research) that Gv tasks are not dependent upon the ability of the individual to use internal language in solving a problem, it follows that tasks that require this are measuring a different cognitive process. Gv tasks do not include the aspect of dealing with novel stimuli or applying novel mental processes, or using internal language to reason out the solution to a visually- presented problem, all of which characterize Gf tasks. This will be discussed below in the section on Integration of Complex Information Processing.
Auditory Processing Ability: Is it a Component of Verbal Ability?
It should be noted that Horn and Carroll both accepted that there is a separate factor of auditory processing (Ga) that is distinct from the verbal or Gc infor-mation processing system. Auditory processing is concerned with the analysis of sound patterns such as in speech sounds, rhythm, and sequences of sounds (Carroll, 2005; Horn & Blankson, 2005). Auditory processing ability is certainly related to the development of complex higher- order language skills. It is neces-sary but not suffi cient for language development. It seems reasonable to suppose that auditory processing is mediated by a separate processing system that handles the analysis of auditory sensory input, and because of this, children with hearing impairment are likely to have diffi culties with Ga tasks.
In the DAS- II, auditory processing (Ga) is measured by the Phonological Processing subtest, comprising four distinct components: Rhyming, Blending, Deletion, and Phoneme Identifi cation and Segmentation.

OVERVIEW 9
Integration of Complex Information Processing
For normal cognitive functioning, the verbal and visual- spatial abilities operate as an integrated information processing system that is necessary for complex mental activity. Factorially, this integrative system is represented by the fl uid rea-
soning (Gf ) ability. Fluid reasoning refers to inductive and deductive reasoning, presenting problems that are new to the person doing the reasoning. The vast majority of fl uid reasoning tests use nonverbal (that is, visual) stimuli using pic-tures or fi gures. These require an integration of verbal and nonverbal thinking. Indeed, it seems likely that the best measures of Gf always require integrated analysis of both verbal and visual information. This is achieved through the presentation of visual problems that, for most effi cient solution, require the in-dividual (1) to encode the components of the visual stimulus, (2) to use internal language to generate hypotheses, (3) to test the hypotheses, and (4) to identify the correct solution.
Neuropsychologically, it seems that the integrative function of frontal lobe systems is central to executive function, which is involved in planning and other complex mental processes (Hale & Fiorello, 2004, pp. 64–67; Luria, 1973; dis-cussed by McCarthy & Warrington, 1990, pp. 343–364), and it is therefore rea-sonable to hypothesize that it may provide a structural correlate for Gf. Similarly, it is clear that the corpus callosum has a major role in connecting the right and left cerebral hemispheres, and that limitations in callosal transmission may be implicated in cases of poor visual- verbal integration. Whatever the localization of specifi c mechanisms may be, the fact that our brains have an integrative func-tion seems incontrovertible. The best tests of Gf require that integrative pro-cess.
In the DAS- II, the Gf factor is measured in the Upper Early Years and School- Age batteries by the Nonverbal Reasoning cluster.1 The subtests measur-ing this ability require integrated analysis and complex transformation of both visual and verbal information, and verbal mediation is critical for the solution of these visually presented problems for most individuals.
1In the Lower Early Years battery (ages 2:6 through 3:5 only), fl uid reasoning (Gf ) and visual-spatial thinking (Gv) are measured by one subtest each. The Nonverbal cluster combines these two subtests. Therefore the factors are only differentiated at the subtest level and not at the cluster level.
10 ESSENTIALS OF DAS-II® ASSESSMENT
Short- Term Memory (Verbal and Visual) Systems
Short- term memory (Gsm) refers to one’s ability to apprehend and maintain awareness of elements of information for events that occurred in the last minute or so. Gsm refers to aspects of memory that have limited capacity and that lose information quickly unless an individual activates other cognitive resources to maintain the information in immediate awareness. CHC theory does not distin-guish, at the second- order, group factor level, between separate, modality- related visual and verbal memory systems. At the broad factor level there is only a single short- term memory factor (Gsm) that should really be called auditory short- term memory.
Because of evidence from both cognitive psychology and neuropsychology that shows clearly that verbal and visual short- term memory systems are distinct and independent (Hitch, Halliday, Schaafstal, & Schraagen, 1988; McCarthy & Warrington, 1990, pp. 275–295), the DAS- II does not treat short- term memory as unitary but keeps auditory and visual short- term memory tasks as distinct measures. Additionally, several subtests combine to create a working memory (Gsm MW) factor that is separate from auditory short- term memory (Gsm MS), as measured by the Recall of Digits Forward subtest, and the visual short- term memory (Gv MV) abilities measured by the Recall of Designs and Recognition of Pictures subtests.
Integration of Verbal and Visual Memory Systems
The long- term storage and retrieval (Glr) factor in the CHC model is typically mea-sured by tests that have both visual and verbal components. Long- term storage and
retrieval ability involves memory storage and retrieval over longer periods of time than Gsm. How much longer varies from task to task, but it is typically of the order of 1 to 30 minutes.
McCarthy and Warrington (1990, p. 283) call this “visual–verbal” short- term memory and conclude that it is underpinned by another distinct and indepen-dent, dissociable information- processing system. While its relationship with other processes is relatively small, it may be an important type of “gateway” process underlying some types of working memory. Holding information in visual- verbal short- term memory may be necessary in order to solve problems that require the manipulation and transformation of visual information that can be labeled verbally.
In the DAS- II, the visual- verbal memory factor (Glr) is measured by the Recall of Objects subtest. In this task, an array of pictures is presented, but they have

OVERVIEW 11
to be recalled verbally. Sequential order is not important, and the child is able to organize and associate pictures in any way that helps in remembering them.
Processing Speed
The DAS- II Processing Speed cluster measures the CHC processing speed factor (Gs). This factor refers to the ability to automatically and fl uently perform rela-tively easy or over- learned cognitive tasks, especially when high mental effi ciency (i.e., attention and focused concentration) is required. It is typically measured by tests that require relatively simple operations that must be performed quickly—speed of decision, speed of naming, clerical speed, and so on. These types of timed activities are more complex than those involved in simple reaction- time paradigms, which seem to form their own factor (Gt ), a factor not assessed by the DAS- II, nor by most cognitive ability tests.
While individual differences in neural speed may be one of the determinants of performance on processing speed tasks, it is clear that other determinants are involved. Speed of response may refl ect not only neural speed but also per-haps effi ciency in accessing information, effi ciency in holding information in short- term memory, effi ciency in visual- verbal integration, and willingness to commit to a decision and threshold for doing so. Performance on Gs tasks is not easily improved with practice. Prior experience on similar tasks is unlikely to be helpful. Therefore, measures on such tasks do refl ect some function of the underlying speed and effi ciency of processing systems.
DESCRIPTION OF DAS- II
The Differential Ability Scales—Second Edition (DAS- II; Elliott, 2007a) is an individually administered battery of cognitive tests for children and adolescents aged 2 years, 6 months (2:6) through 17 years, 11 months (17:11). Because the DAS- II covers such a wide age range, it is divided into three levels: Lower Early Years (ages 2:6 through 3:5); Upper Early Years (normally covering ages 3:6 through 6:11, but normed through 8:11); and School- Age (normally covering ages 7:0 through 17:11, but also normed for ages 5:0 through 6:11). The three levels allow both items and clusters that are appropriate to the several age ranges. It was designed to measure specifi c, defi nable abilities and to provide reliable, interpretable profi les of strengths and weaknesses. These profi les may lead to individualized interventions or treatments for students with learning concerns or issues. The DAS- II is considered suitable for use in any setting in which the cognitive abilities of children and adolescents are to be evaluated, although sev-

12 ESSENTIALS OF DAS-II® ASSESSMENT
eral of the DAS- II subtests may not be appropriate for students with se-vere sensory or motor disabilities. The DAS- II cognitive battery yields a composite score labeled General
Conceptual Ability (GCA) that is a measure of psychometric g , defi ned
as “the general ability of an individual to perform complex mental processing that involves conceptualization and transformation of information” (Elliott, 2007b, p. 17).
Organization of the DAS- II
The DAS- II contains a total of 20 subtests grouped into Core or Diagnostic sub-tests. The Core subtests are those used to compute the GCA and three cluster scores: Verbal Ability, Nonverbal Reasoning Ability, and Spatial Ability. The Diagnostic subtests measure aspects of memory, speed of processing and early concepts taught in schools. They yield three cluster scores: Processing Speed, Working Memory, and School Readiness. These diagnostic subtests are consid-ered important and useful in the interpretation of an individual’s strengths and weaknesses in information processing, but they do not contaminate the GCA with subtests that have low g loadings.
This separation of Core and Diagnostic subtests is one of the strengths of the DAS- II. For a point of comparison, the Wechsler Intelligence Scale for Children, 4th ed. (WISC- IV; Wechsler, 2003) excludes the Information, Word Reasoning, Arithmetic, Picture Completion, and Cancellation subtests from the FSIQ and Indices, but does include in the IQs subtests such as Coding and Symbol Search, which are not good measures of complex mental processing or intellectual ability
( g ). The Stanford- Binet Intelligence Scale, 5th ed. (SB5; Roid, 2003) in-cludes all subtests in the total score. The Woodcock- Johnson III Cogni-tive battery (WJ III; Woodcock, McGrew, & Mather, 2001) includes low- g- loading tests, but only in pro-portion to their g loading
The Lower Early Years battery of the DAS- II consists of four core subtests that combine to yield the
C A U T I O N
Several of the DAS- II subtests may not be appropriate for students with severe sensory or motor disabilities.
DON’T FORGET
The separation of the DAS- II into Core and Diagnostic subtests can be helpful in reducing the overall admin-istration time and a student’s fatigue since examiners can tailor their as-sessments, administering only those subtests that are relevant based on the specifi c and different referral questions.

OVERVIEW 13
GCA and three diagnostic subtests that may be administered. The Upper Early Years battery includes six core subtests and an additional 11 optional diagnostic subtests. The School- Age battery includes six core subtests and nine additional diagnostic subtests. Some of the Early Years subtests can also be used at the school- age level, especially at younger ages, for diagnostic purposes. For the Up-per Early Years and the School- Age batteries, the subtests not only combine to produce the GCA but also yield fi ve or six cluster scores. For Upper Early Years children, these cluster scores represent Verbal (Gc), Nonverbal Reasoning (Gf ), and Spatial (Gv) abilities along with School Readiness, Working Memory (Gsm), and Processing Speed (Gs). For School- Age children, the cluster scores repre-sent Verbal (Gc), Nonverbal Reasoning [(Gf ) fl uid reasoning (Keith, 1990)], and Spatial (Gv) abilities along with Working Memory (Gsm) and Processing Speed (Gs) (see Rapid Reference 1.2 and Figure 1.1). Although the “typical” Upper Early Years battery is given to children aged 3 years, 6 months through 6 years, 11 months and the “typical” School- Age battery to children 7 years, 0 months through 17 years, 11 months, the Upper Early Years and School- Age batteries were also normed for an overlapping age range (5 years, 0 months through 8 years, 11 months).
Normative Overlaps
Depending on the examinee’s age, if an examinee of low ability has little suc-cess at the ages covered by the battery you initially selected, you may be able to administer subtests from a lower level of the test. Conversely, if an examinee has high ability and has few failures at the ages covered by the battery you initially selected, you can administer subtests from a higher level of the test. All subtests at the Upper Early Years and School- Age Level have overlapping normative data for children ages 5:0 to 8:11. This overlap provides the examiner fl exibility when testing bright younger children or less able older children. In these cases, subtests appropriate for the individual’s abilities are available. For example, the Upper Early Years subtests can be administered to children ages 6:0 to 8:11 for whom the School- Age Level is too diffi cult. Similarly, the School- Age subtests can be administered to children ages 5:0 to 6:11 for whom the Upper Early Years is insuffi ciently challenging. In such cases, the examinee’s raw scores can be converted to ability scores and then to T scores in the normal way.
DON’T FORGET
If a student has little success at the ages covered by the battery you ini-tially selected, you may be able to ad-minister subtests from a lower level of the test.

14 ESSENTIALS OF DAS-II® ASSESSMENT
For children in the overlapping age range, examiners may choose to give either battery or choose one battery and administer additional subtests from the other battery.
Changes from DAS to DAS- II
Several goals were accomplished with the revision of the DAS to the DAS- II. Rapid Reference 1.3 lists the key features that were accomplished and changes made for this second edition.
In the DAS- II, many of the core subtests will be recognizable to DAS exam-iners, but there have been signifi cant changes and modifi cations to some. For example, Block Building and Pattern Construction have been combined into one subtest; Recall of Digits has been expanded to two subtests: Recall of Digits–Forward and Recall of Digits–Backward; and Early Number Concepts has been
DAS- II Key Revisions
• Updating of norms• CHC interpretative basis now noted explicitly in manual and record form• Development of three new Diagnostic Clusters (Working Memory, Pro-
cessing Speed, School Readiness)• Addition of four new subtests (Phonological Processing, Recall of Digits Back-
ward, Recall of Sequential Order, Rapid Naming)• Downward extension of Matrices subtest to age 3 years, 6 months, enabling
the Nonverbal Reasoning cluster to be measured at the Early Years level.• Core cluster scores (Verbal, Nonverbal Reasoning, Spatial) are now the same
throughout the age range from 3:6 through 17:11 • Block Building and Pattern Construction combined into one subtest• Revising content of 13 subtests• Updating artwork• Eliminating three achievement tests• Linking DAS- II to the WIAT- II and providing correlational data also for the
K- TEA- II and the WJ- III Achievement batteries• Providing Spanish translation for nonverbal subtests• Providing American Sign Language translation for nonverbal subtests in every
kit for use by, and the training of, interpreters• Publishing with Scoring Assistant computer software
Rapid Reference 1.3

OVERVIEW 15
removed from the GCA and is now included in the School Readiness cluster. There are four new diagnostic subtests (Phonological Processing, Recall of Dig-its–Backward, Recall of Sequential Order, Rapid Naming). The major structural changes in the DAS- II are the inclusion of separate Nonverbal Reasoning and Spatial Ability clusters at the Upper Early Years and the creation of three new clusters (Working Memory, Processing Speed, School Readiness), developed to help examiners assess the skills of the child.
Rapid Reference 1.4 compares the number of items on the DAS and DAS- II and the number of items retained and added. The DAS- II has increased the
DAS to DAS- II Changes
Subtest DAS DAS- II
Number of DAS Items Retained on DAS- II
Number of New Items Written or Reworded for DAS- II
Core Cognitive Subtests Verbal Comprehension 36 42 28 14 Picture Similarities 32 32 14 18 Naming Vocabulary 26 34 21 13 Block Building* 12 12 8 4 Pattern Construction* 26 26 26 0 Copying 20 20 19 1 Matrices 35 56 25 31 Recall of Designs 21 22 21 1 Word Defi nitions 42 35 29 6 Verbal Similarities** 34 33 23 10 Seq. & Quantitative Reasoning 39 50 20 30Diagnostic Cognitive Subtests Recall of Digits Forward** 36 38 36 2 Recognition of Pictures 20 20 20 0 Early Number Concepts 26 33 14 19 Recall of Objects 20 20 20 0 Matching Letter- Like Forms 27 27 27 0 Phonological Processing 53 53 Recall of Sequential Order 32 32 Recall of Digits Backward 30 30 Speed of Information Processing 6 6 6 0 Rapid Naming 105 105
Rapid Reference 1.4
(continued )
Number of Items on

16 ESSENTIALS OF DAS-II® ASSESSMENT
number of items on fi ve of the core tests, and two of the diagnostic tests and decreased the number on two subtests. The greatest increase in items came on the Matrices subtest (35 items to 56 items, a 60 percent increase) while the larg-est decrease came on Word Defi nitions (42 items decreased to 35, a 17 percent decrease). The regionally problematic word “wicked” was removed from Word Defi nitions. Four subtests (Recognition of Pictures, Recall of Objects, Matching Letter- Like Forms, and Speed of Information Processing) remain exactly the same on the DAS- II.
All DAS- II subtests have also been aligned with Cattell- Horn- Carroll (CHC) abilities (see Rapid Reference 1.5). This allows the examiner to use commonly understood and agreed- upon terminology when interpreting what the DAS- II is measuring. CHC theory provides for the interpretation of both Broad and Nar-row abilities. The DAS- II provides measures of each of the seven most robust and replicable factors derived from research.
Subtest DAS DAS- II
Number of DAS Items Retained on DAS- II
Number of New Items Written or Reworded for DAS- II
Lower Early Years Verbal 62 76 49 27 Nonverbal 44 58 22 18 GCA 132 146 97 49Upper Early Years Verbal 62 76 49 27 Nonverbal 78 88 59 49 Spatial 46 1 GCA 166 210 122 77School- age Verbal 76 68 52 16 Nonverbal Reasoning 74 106 45 61 Spatial 47 48 47 1 GCA 197 222 144 78
Note: Subtests in Italics are new to the DAS- II.
* Block Building and Pattern Construction have been combined into one subtest.
** Similarities was renamed Verbal Similarities, and Recall of Digits was renamed Recall of Digits Forward.
Number of Items on

OVERVIEW 17
DAS- II Subtests by CHC classifi cation
Broad Abilities Narrow Abilities
Verbal AbilityVerbal Comprehension Gc Listening AbilityNaming Vocabulary Gc Lexical KnowledgeWord Defi nitions Gc Language Development /
Lexical KnowledgeVerbal Similarities Gc Language DevelopmentNonverbal Reasoning AbilityPicture Similarities Gf InductionMatrices Gf InductionSequential and Quantitative Reasoning
Gf Induction / Quantitative Reasoning
Spatial AbilityPattern Construction Gv Spatial RelationsPattern Construction–Alternative Gv Spatial RelationsRecall of Designs Gv Visual MemoryCopying Gv VisualizationMatching Letter- Like Forms Gv VisualizationRecognition of Pictures Gv Visual MemoryRetrievalRecall of Objects–Immediate Glr Free- recall MemoryRecall of Objects–Delayed Glr Free- recall MemoryMemoryRecall of Digits Forward Gsm Memory SpanRecall of Digits Backward Gsm Working MemoryRecall of Sequential Order Gsm Working MemoryProcessing SpeedSpeed of Information Processing Gs Perceptual Speed: ScanningRapid Naming Gs Perceptual Speed: ComplexAuditory ProcessingPhonological Processing Ga Phonetic CodingAdditionalEarly Number Concepts Gc / Gf Lexical Knowledge /
General knowledge / Piagetian reasoning
Rapid Reference 1.5

18 ESSENTIALS OF DAS-II® ASSESSMENT
Wider Score Ranges
The DAS- II has a wider range of possible T scores for the subtests and Standard Scores for the clusters in comparison with the DAS fi rst edition. In the DAS, T scores ranged from 30 to 70 (that is, two standard deviations (SDs) on either side of the mean of 50), whereas in the DAS- II the range is 20 to 80 (three SDs on either side of the mean). Similarly, for the GCA, SNC and the cluster scores, the maximum DAS range was 45 to 165, whereas in the DAS- II the maximum range is 30 to 170 (that is, 4.67 SDs on either side of the mean).
RELATIONSHIPS BETWEEN THE DAS AND THE DAS- II
Rapid Reference 1.6 provides the results of comparisons of scores obtained on the fi rst- edition DAS and the DAS- II. The major study presented in the DAS- II Introductory and Technical Handbook gave children the two batteries with a short interval between tests. We also present a clinical study carried out on children identifi ed as ADHD in which the assessments were carried out over a period of years.
Over Short Periods of Time
The relationship between the DAS and the DAS- II was examined in a sample of 313 children aged 2:6 to 17:11 (Elliott, 2007b). Each test was administered in counterbalanced order with 6 to 68 days between testing. The overall correlation coeffi cients show that the Verbal Ability scores for the DAS and the DAS- II were the most highly related (r = .84) followed by the GCA (r = .81) and the Special Nonverbal composite (r = .78). As shown in Rapid Reference 1.6, the average DAS- II GCA is 2.7 points lower than the GCA of the DAS. The difference be-tween the two tests is small for the Verbal Ability (0.1 points), while the Nonver-bal Reasoning and Spatial abilities differ by 4 to 5 points. These differences, both in size and direction, are generally somewhat lower than expected according to the Flynn Effect (Flynn, 1984, 1987, 1998). The results indicate that if examinees continue to be assessed using the fi rst edition of the DAS, their scores may be infl ated by up to 4 or 5 standard score points in comparison with the DAS- II.
Over Long Periods of Time
In a small sample (N = 26) of children with ADHD who were administered the DAS fi rst and then, after 3 to 6 years, were given the DAS- II, small changes in test

Com
pari
son
of S
core
s fr
om D
AS
and
DA
S- II
Sta
nd
ard
izat
ion
Sam
ple
AD
HD
Sam
ple
Tim
e in
terv
al 6
to
68
days
Tim
e in
terv
al 3
to
6 y
ears
DA
SD
AS
- II
DA
SD
AS
- II
Mea
nS
DM
ean
SD
dif
fM
ean
SD
Mea
nS
Dd
iff
Wor
d D
efi n
ition
s51
.59.
651
.48.
5–
0.1
54.6
8.3
53.8
7.6
–0.
8Ve
rbal
Sim
ilari
ties
52.2
11.0
51.7
8.8
–0.
554
.810
.950
.07.
6–4
.8M
atric
es54
.910
.351
.48.
5–3
.553
.210
.153
.99.
50.
7Se
q. &
Qua
ntita
tive
Rea
soni
ng53
.99.
351
.39.
4–2
.653
.89.
853
.27.
2–
0.6
Rec
all o
f Des
igns
54.3
11.7
51.1
8.8
–3.2
54.2
10.0
50.4
11.7
–3.9
Patt
ern
Con
stru
ctio
n54
.29.
252
.19.
1–2
.153
.710
.352
.79.
2–1
.0
Rec
all o
f Obj
ects
–Im
med
iate
53.4
10.6
53.3
11.6
–0.
150
.712
.950
.79.
50.
1R
ecal
l of O
bjec
ts–D
elay
ed52
.010
.653
.410
.51.
450
.513
.749
.88.
4–
0.6
Rec
all o
f Dig
its F
orw
ard
49.8
9.9
51.0
10.2
1.2
50.4
9.8
48.8
10.2
–1.6
Spee
d of
Info
rmat
ion
Proc
essin
g52
.710
.150
.99.
0–1
.854
.29.
752
.910
.1–1
.3
Ver
bal
102.
515
.010
2.4
12.8
–0.
110
5.5
17.8
102.
710
.8–2
.8N
onv
erb
al R
easo
nin
g10
7.2
15.0
101.
913
.4–5
.310
7.1
14.1
105.
211
.1–1
.8S
pat
ial
106.
814
.810
2.5
12.6
–4.3
104.
815
.310
2.3
16.0
–2.4
Sch
oo
l- A
ge G
CA
105.
415
.010
2.7
12.6
–2.7
108.
014
.210
4.0
12.6
–3.9
N fo
r St
anda
rdiz
atio
n Sa
mpl
ing
rang
ed fr
om 2
09 to
313
; N fo
r A
DH
D S
ampl
ing
= 2
6
Tim
e be
twee
n te
stin
g: S
tand
ardi
zatio
n Sa
mpl
ing
= 6
to 6
8 da
ys; A
DH
D S
ampl
ing:
3.4
to 6
.8 y
ears
Rapid
Refer
ence
1.6

20 ESSENTIALS OF DAS-II® ASSESSMENT
scores were observed (Schlachter, Dumont, & Willis, unpublished manuscript). In almost all cases, the test scores on the DAS- II were lower than their earlier scores on the original DAS. Only Matrices and Recall of Objects– Immediate were higher on the DAS- II, and in each case by less than 1 point. The smallest mean difference in composite scores was shown by the Nonverbal Reasoning cluster, with a mean score on the DAS- II 1.8 points lower than that on the DAS. The greatest difference in composite scores was shown by the GCA, with the mean score on the DAS- II being 3.9 points lower than that on the DAS. For individual subtests, the largest change between the DAS and the DAS- II was on Verbal Similarities and Recall of Designs (–4.8 and –3.9 points, respectively).
STANDARDIZATION AND PSYCHOMETRIC PROPERTIES
The DAS- II was standardized and normed on 3,480 children selected to be rep-resentative of non- institutionalized, English- profi cient children aged 2 years 6 months through 17 years 11 months living in the United States during the period of data collection (2005). Although the DAS- II standardization excluded those children with severe disabilities (since for these children the DAS- II would be inappropriate), it did include children with mild perceptual, speech, and motor impairments, if the examiner judged that the impairments did not prevent the valid administration of the test. The demographic characteristics used to obtain a stratifi ed sample were age, sex, race / ethnicity, parental educational level, and geographic region.
Additional samples of children, ranging in size from 54 to 313, were tested during standardization with three additional cognitive measures, three achieve-ment measures, and two measures of school readiness, to provide evidence of validity. These additional children were not included in the norms calculation.
For the category of race / ethnicity, individuals were classifi ed as White (N = 2,176), African American (N = 538), Hispanic American (N = 595), Asian (N = 137) and Other (N = 34). The fi ve parental education categories ranged from one to eight years of education to 16 or more years of education. The four geographic regions sampled were Northeast, Midwest, South, and West. Demo-graphic characteristics were compared to the October 2005 U.S. Census popula-tions and were matched in three- way tables across categories and not just within single categories (i.e., age × race × parent education; age × sex × parent educa-tion; age × sex × race; and age × race × region). Total sample percentages of these categories and subcategories were very close to the Bureau of the Census data and seldom different by more than 1 percentage point.
In the standardization sample, there were 18 age groups: 2:6–2:11, 3:0–3:5,

OVERVIEW 21
3:6–3:11, 4:0–4:5, 4:6–4:11, 5, 6, 7, 8, 9, 10, 11, 12, 13, 14, 15, 16, and 17 years. In each six- month age group between 2 years 6 months and 4 years 11 months, there was a total of 176 children, while from ages 5 through 17 there were 200 children in each one- year age group. In each six- month age group between 2 years 6 months and 4 years 11 months, there were approximately equal numbers of males and females, while for all remaining age groups there were 100 males and 100 females per group. In our opinion, this sampling methodology was ex-cellent.
RELIABILITY OF THE DAS- II
The DAS- II has excellent reliability (see Rapid Reference 1.7 for the average in-ternal consistency reliability and standard error of measurement (SEm) for each Composite and Cluster). Average internal consistency reliability coeffi cients for the GCA and the Special Nonverbal Composites are above .90 for the Lower Early Years, Upper Early Years, and School- Age level. For the clusters, average internal consistency reliability coeffi cients for the Lower Early Years, Upper Early Years, and School- Age level are (a) .93, .89, and .89 for Verbal Ability (b) .87, .89,
Average DAS- II Cluster Reliabilities
Composites / ClusterAverage internal
consistency rxx SEm
GCA (Early Years, Lower) .94 3.82GCA (Early Years, Upper) .96 3.10GCA (School- Age) .96 2.91SNC (Early Years, Upper) .95 3.45SNC (School- Age) .96 3.00Verbal Ability (Early Years, Lower) .93 4.11Verbal Ability (Early Years, Upper) .89 4.94Verbal Ability (School- Age) .89 5.04Nonverbal Ability (Early Years, Lower) .87 5.41Nonverbal Reasoning Ability (Early Years, Upper) .89 5.07Nonverbal Reasoning Ability .92 4.22Spatial Ability (Early Years, Upper) .95 3.40Spatial Ability (School- Age) .95 3.45Working Memory (5–0 to 17–11) .95 3.53Processing Speed (5–0 to 17–11) .90 4.80School Readiness (5–0 to 8–11) .90 5.09
Rapid Reference 1.7

22 ESSENTIALS OF DAS-II® ASSESSMENT
and .92 for Nonverbal Reasoning Ability, (c) .95 for Spatial Ability, (d) .95 for Working Memory, (e) .90 for Processing Speed, and (f ) .90 for School Readiness. These numbers indicate that all of these overall cluster scores are “reliable,” the term “reliable” being defi ned by Sattler (2008) as a reliability coeffi cient with a value between .80 and .99.
Subtest Reliabilities
The internal consistency reliabilities for the subtests are lower than those for the GCA and the clusters, as would be expected (see Rapid Reference 1.8 for the average internal consistency reliability and SEm for each DAS- II subtest). Across all ages, the average internal consistency reliabilities range from a low of .77 for Picture Recognition to a high of .95 for Pattern Construction. Core
Average DAS- II Subtest Reliabilities
Subtest, cluster, and GCAAverage internal
consistency rxx Average SEm
CoreVerbal Comprehension .86 3.57Picture Similarities .83 4.25Naming Vocabulary .81 4.44Pattern Construction .95 2.38Pattern Construction–Alternative .94 2.63Matrices .84 4.09Copying .89 3.34Recall of Designs .86 3.79Word Defi nitions .81 4.44Verbal Similarities .81 4.36Sequential and Quantitative Reasoning .92 2.97
DiagnosticRecall of Objects–Immediate .82 4.34Recall of Digits Forward .92 2.98Recognition of Pictures .77 4.84Early Number Concepts .88 3.49Matching Letter- Like Forms .87 3.68Recall of Sequential Order .92 2.86Speed of Information Processing .91 3.05Recall of Digits Backward .90 3.20Phonological Processing .91 2.82Rapid Naming .81 4.38
Rapid Reference 1.8

OVERVIEW 23
subtests ranged from .81 (Naming Vocabulary, Word Defi nitions and Verbal Similarities) to .95 (Pattern Construction). Reliability of the Diagnostic subtests was also generally high, ranging from a low of .77 for Recognition of Pictures to a high of .92 for Recall of Digits Forward. Subtest reliabilities therefore range from “relatively reliable” (that is, between .70 and .79) to “reliable” (over .80; Sattler, 2008).
Standard Errors of Measurement
The average standard errors of measurement (SEm) in standard score points (that is, with a mean of 100 and standard deviation (SD) of 15) for the Early Years and School- Age batteries (respectively) were 3.82 and 2.91 for the GCA, 3.45 and 3.00 for the SNC, 5.04 and 4.11 for the Verbal clusters, 5.41 and 4.22 for the Non-verbal clusters, and 3.53 and 3.45 for the Spatial clusters. Diagnostic clusters had SEms that ranged from 3.53 (Working Memory) to 5.09 (School Readiness).
Across the 13 whole- age groups (5 to 17), the average standard errors of mea-surement for the subtests in T score units (that is, with a mean of 50 and a SD of 10) range from 2.38 (Pattern Construction) to 4.84 (Recognition of Pictures).
Test- Retest Reliability
In the standardization sample, the stability of the DAS- II was assessed by hav-ing 369 individuals retested after an interval ranging from 1 to 9 weeks. The re-sults of the test- retest study showed that for the age groups (3:6–4:11, 5:0–8:11, 10:0–10:11, 11:0–11:11, 14:0–14:11, and 15:0–15:11), reliability coeffi cients ranged from .92 for the GCA; .89 for the Verbal and Spatial Clusters; .88 for the School Readiness Cluster; .87 for Working Memory Cluster .83 for Processing Speed; and .81 for the Nonverbal Reasoning Cluster. Thus, the DAS- II provides reliable GCA and Cluster scores.
Stability coeffi cients for the DAS- II subtests ranged from a low of .63 for Matching Letter- Like Forms and Recognition of to a high of .91 for Naming Vocabulary. Subtest stability coeffi cients are therefore classifi ed according to Sattler’s (2008) system as ranging from “marginally reliable” (that is, between .60 and .69) to “reliable.”
Changes in Composite and Subtest Scores
An examination of the mean test- retest scores and standard deviations for the Verbal, Nonverbal, Spatial, and GCA for the age groups found the following.

24 ESSENTIALS OF DAS-II® ASSESSMENT
On average, from the fi rst to the sec-ond testing, the GCA increased by 5.1 points, the Verbal cluster by 3.7 points, the Nonverbal Reasoning 5.8 points, and the Spatial 3.3 points. Working Memory and Processing Speed had the lowest test- retest score
gains of all the composites (2.4 and 2.1 respectively) while the School Readiness cluster showed the greatest increase of 5.2 points.
As with the Composite and cluster scores, each of the DAS- II subtests showed modest gains on retest, ranging from a low of .5 (Rapid Naming) to 6.8 (Recall of Objects- Immediate) T score points. In general, test- retest gains are smallest for the subtests that contribute to the Working Memory and Processing Speed clusters.
When the DAS- II is administered a second time, within 1 to 9 weeks, children are likely to have greater gains on the Nonverbal Reasoning Ability subtests than on the Verbal or Spatial subtests. The magnitude of the gains from fi rst testing to second testing appears to account for the relative instability of the scores as well as the fact that children may be able to recall the types of items they were administered the fi rst time and the strategies they used to solve the problems. Unless there was an imperative reason for doing so, it would generally not be good practice to re- administer the DAS- II to a child after a short period of time. If such re- administration were needed for some reason, the examiner should take into account the average gains cited above.
VALIDITY OF THE DAS- II
Criterion Validity
The degree to which a test is related to an established criterion measure, when both instruments are administered at approximately the same time, refl ects con-current validity. The DAS- II Introductory and Technical Handbook (Elliott, 2007b), pp. 163–207, reports the fi ndings of a series of studies in which the DAS- II was given along with the original DAS, the Wechsler Preschool and Primary Scale of Intelligence–Third Edition (WPPSI- III; Wechsler, 2002), Wechsler In-telligence Scale for Children– Fourth Edition (WISC- IV; Wechsler, 2003), and the Bayley Scales of Infant and Toddler Development– Third Edition (Bayley- III; Bayley, 2006). The validity studies in these tables are based on samples that ranged in size from 42 to 313 and included samples of both nonclinical and clini-
C A U T I O N
It would generally not be good prac-tice to re- administer the DAS- II to a child after a short period of time.

OVERVIEW 25
cal populations. Below is a summary of some of those studies.
Rapid References 1.9 and 1.10 indi-cate that the DAS- II has satisfactory concurrent validity. The GCA cor-relates with other global measures of intelligence developed and published by PsychCorp, ranging from moder-ate (.59 with the Bayley- III) to high (.88 with the original DAS). Over-all, the mean correlation was high (Mr = .80).
For measures of academic achieve-ment, the DAS- II GCA correlated well with the Total scores of tests of academic achievement, ranging from .79 with the Wechsler Individual Achievement Test, 2nd ed. (WIAT- II; Psycho-logical Corporation, 2001) for a sample of children identifi ed with ADHD and LD, to .82 with the WIAT- II for a non- clinical sample.
Special Groups
The DAS- II Introductory and Technical Handbook presents 12 special group studies, summarized in Rapid Reference 1.11. Following are highlights of those tables:
Summary of DAS- II Correlations With Other Measures of Intelligence
Criterion GCA
DASGCA .88
WPPSI–IIIFull Scale .87
WISC–IVFull Scale .84
Bayley–IIICognitive .59
Rapid Reference 1.9
Summary of DAS- II GCA Correlations with Measures of Achievement
Reading MathWritten
LanguageTotal
Achievement
WIAT- II (Nonclinical) .72 .77 .66 .82WIAT- II (ADHD- LD) .62 .84 .30 .79WIAT- II (LD- R) .67WIAT- II (LD- M) .73KTEA-II .67 .74 .65 .81WJ III .70 .82 .71 .80
Rapid Reference 1.10

DA
S-II
Spe
cial
Gro
up S
tudy
Res
ults
Sp
ecia
l gro
up
Ver
bal
No
nver
bal
R
easo
nin
gS
pat
ial
Wo
rkin
g M
emo
ryP
roce
ssin
g S
pee
dS
cho
ol
Rea
din
ess
GC
A
Inte
llect
ually
gift
ed12
5.4
121.
411
7.8
116.
711
2.0
114.
612
5.4
Men
tal r
etar
datio
n54
.160
.758
.857
.367
.849
.951
.0R
eadi
ng d
isord
er92
.191
.293
.091
.489
.892
.990
.6R
eadi
ng a
nd w
ritt
en e
xpre
ssio
n di
s.93
.190
.489
.690
.287
.787
.889
.5M
athe
mat
ics
diso
rder
95.5
87.8
90.2
89.5
85.5
87.0
89.3
Lear
ning
diso
rder
& A
DH
D94
.293
.992
.788
.590
.390
.792
.5A
tten
tion-
defi c
it / hy
pera
ctiv
ity d
is.
102.
199
.798
.998
.195
.597
.910
0.2
Expr
essiv
e la
ngua
ge d
isord
er85
.791
.385
.985
.789
.383
.885
.7M
ixed
rec
eptiv
e-ex
pres
sive
lan.
dis
.80
.881
.781
.476
.286
.279
.278
.5D
eaf /
Har
d of
Hea
ring
98.5
101.
310
0.0*
Lim
ited
Engl
ish P
rofi c
ienc
y85
.697
.610
4.8
91.2
93.2
95.4
94.8
Dev
elop
men
tal D
isord
er94
.092
.895
.892
.5
*For
the
Dea
f / H
ard
of H
eari
ng, t
he S
NC
is u
sed.
Rapid
Refer
ence
1.11

OVERVIEW 27
• Intellectually gifted: The sample obtained a mean GCA score of 125.4. The individual Cluster scores ranged from 112.0 (Processing Speed) to 125.4 (Verbal).
• Mental retardation—mild or moderate: The sample obtained a Gen-eral Conceptual Ability score of 51.0. The individual Cluster scores ranged from 49.9 (School Readiness) to 67.8 (Processing Speed).
• Reading disorder: The sample obtained a mean General Conceptual Ability score of 90.6. The individual mean Cluster scores ranged from 89.8 (Processing Speed) to 93.0 (Spatial).
• Reading and written expression disorders: The sample obtained a mean General Conceptual Ability score of 89.5. The individual mean Cluster scores ranged from 87.7 (Processing Speed) to 93.1 (Verbal).
• Mathematics disorder: The sample obtained a mean General Concep-tual Ability score of 89.3. The individual mean Cluster scores ranged from 85.5 (Processing Speed) to 95.5 (Verbal).
• Attention- defi cit / hyperactivity disorder: The sample obtained a mean General Conceptual Ability score of 100.2. The individual mean Clus-ter scores ranged from 97.5 (Processing Speed) to 102.1 (Verbal).
• Attention- defi cit / hyperactivity disorder and Learning disorder: The sample obtained a mean General Conceptual Ability score of 92.5. The individual mean Cluster scores ranged from 88.5 (Working Memory) to 94.2 (Verbal).
• Expressive language disorder: The sample obtained a mean General Conceptual Ability score of 85.7. The individual mean Cluster scores ranged from 83.8 (School Readiness) to 91.3 (Nonverbal Reasoning).
• Mixed receptive- expressive language disorder: The sample obtained a mean General Conceptual Ability score of 78.5. The individual mean Cluster scores ranged from 76.2 (Working Memory) to 86.2 (Pro-cessing Speed).
• Limited English Profi ciency: The sample obtained a mean General Conceptual Ability score of 94.8. The individual mean Cluster scores ranged from 85.6 (Verbal) to 104.8 (Spatial).
• Developmentally At Risk: The sample obtained a mean General Conceptual Ability score of 92.5. The individual mean Cluster scores ranged from 92.8 (Nonverbal Reasoning) to 95.8 (Spatial).
• Deaf / Hard of Hearing: The sample obtained a mean Special Non-verbal Composite score of 100.0. The individual mean Cluster scores ranged from 98.5 (Nonverbal Reasoning) to 101.3 (Spatial).

28 ESSENTIALS OF DAS-II® ASSESSMENT
DAS- II SUBTESTS AS MEASURE OF g
Examination of the loadings of subtests on the general factor allows one to determine the extent to which the DAS- II subtests measure this general fac-tor, which is often referred to as psychometric g. The factor is also often—and misleadingly—referred to as general, global, or overall intelligence. As long ago as 1927, Charles Spearman, one of the great pioneers of the study and measure-ment of human abilities, observed that “in truth, ‘intelligence’ has become a mere vocal sound, a word with so many meanings that fi nally it has none” (p. 14). He went on, “For scientifi c purposes, then, ‘intelligence’ can best be thrown out altogether” (p. 196).
So what is the nature of psychometric g? Elliott (2007b, p. 17) states, “Psy-chometric g is the general ability of an individual to perform complex mental processing that involves conceptualization and the transformation of informa-tion.”
The DAS- II Introductory and Technical Handbook provides g loadings for all sub-tests for four age groups. These are derived from the confi rmatory factor analy-ses that were conducted on the DAS- II standardization data, and are arguably the best method of estimating g loadings. The traditional way of doing this has been by taking the fi rst unrotated loadings from either a principal components analysis or a factor analysis. This is the method favored by Sattler, and esti-mates using this method may be found in Sattler, Dumont, Willis, and Salerno (2008).
Across all ages for which each subtest is normed, the 20 DAS- II subtests had g loadings ranging from a low of .38 (Speed of Information Processing) to a high of .81 (Early Number Concepts). The best measures of g includes fi ve Core (Naming Vocabulary, Sequential and Quantitative Reasoning, Verbal Compre-hension, Pattern Construction, and Matrices) and two Diagnostic (Early Num-ber Concepts and Recall of Sequential Order) subtests. The poorest measures of g are Recall of Objects, Rapid Naming, and Speed of Information Processing, each a Diagnostic subtest (see Figure 1.2).
SUBTEST SPECIFICITY
Subtest specifi city refers to the proportion of a subtest’s variance that is both reliable (that is, not due to errors of measurement) and distinct to the subtest (that is, not overlapping with other subtests). Although individual subtests on the DAS- II overlap in their measurement properties (that is, one of the compo-nents of the reliable variance for most subtests is common factor variance), all

Good measure of g Fair measure of g Poor measure of g
Subtest Average loading
of g
Subtest Average loading
of g
Subtest Average loading
of g
ENC a .81 PC d .70 c .51
NVoc a .81 PhP c .70 d .49
SQR d .78 PSim b .68 RObjI b .44
ENC b .76 VSim d .68 RN c, d .43
SQR c .76 RDigB c .68 RPic b .42
VComp a .75 PC b .67 SIP c .41
PC c .72 WD c, d .67 SIP d .38
Mat c, d .72 VSim c .67
RSO c .72 RDes c .66
RDigB d .66
RSO d .66
NVoc b .65
RDes d .65
MLLF b .64
Copying b .62
RDigF b .62
VComp b .61
PSim a .60
RDigF a, c .60
PC a .59
RPic a .59
RPic b .57
Mat b .57
RDigF d .57
RPic c .53
PSim a .53 a Ages 2:6 to 3:5. b Ages 4:0 to 5:11. c Ages 6:0 to 12:11.d Ages 6:0 to 17:11.
ENC = Early Number Concepts; MLLF = Matching Letter-Like Forms; NVoc = Naming Vocabulary; PC = Pattern Construction; PhP = Phonological Processing; PSim = Picture Similarities; RDes = Recall of Designs; RDigB = Recall of Digits Backward; RDigF = Recall of Digits Forward; RN = Rapid Naming; RObjI = Recall of Objects-Immediate; RPic = Recognition of Pictures; RSO = Re call of Sequential Order; SIP = Speed of Information Processing; SQR = Sequential & Quantitative Reasoning; VComp. = Verbal Comprehension; VSim = Verbal Similarities; WD = Word Definitions
RObjI
RObjI
Figure 1.2 DAS- II Subtests as Measures of g at the Early Years and School- Age Levels
Source: Adapted from Elliott (2007b, p. 162). Differential Ability Scales–Second Edition. Adapted by permission. Reproduced by permission of the Publisher, The Psychological Corporation. All rights reserved. "Differential Ability Scales–Second Edition" and "DAS-II" are trademarks of The Psycho-logical Corporation.

30 ESSENTIALS OF DAS-II® ASSESSMENT
DAS- II subtests possess suffi cient (ample or adequate) specifi city to justify the interpretation of specifi c subtest functions. This important characteristic is not true of all tests of cognitive ability. In many tests of cognitive abilities, some or all of the subtests lack suffi cient specifi city to be interpreted individually. Those subtests do not stand alone, but only contribute to their scale or factor within the test or only to the total test score. Figure 1.3 shows the mean specifi city and ranges for various cognitive batteries. As noted, the DAS- II mean specifi cities of .43 for the Early Years battery and .41 for the School- Age battery are high. These mean specifi cities are similar to those of the KABC- II and the WJ III COG, but greater than those of the Wechsler scales or the Stanford- Binet 5.
RANGE OF GCAs, SNCs, CLUSTER STANDARD SCORES
The GCAs and SNCs can range from 30 to 170. Although this range is not available at all ages (Sattler, Dumont, Willis, & Salerno, 2008, pp. 623–624), the DAS- II does provide, at all ages, GCA and SNC scores that are between 48 and 170. For the Verbal, Nonverbal, Nonverbal Reasoning, and Spatial Clusters, at all ages the scores fall between 52 and 157. Across all ages, the Working Mem-ory Composite scores ranges from 69 to 150; the Processing Speed Composite from 57 to 170; and the School Readiness Composite from 42 to 108. Although
Battery
DAS-II Early YearsDAS-II School-AgeWPPSI-IIIWISC-IVKABC-IISB5 (ages 3-5)SB5 (ages 6-10)SB5 (ages 11-16)WJ III COG (ages 6-13)WJ III COG (ages 4-5)
.43
.41
.34
.38
.41
.28
.24
.25
.43
.44
.25 to .68
.17 to .75
.16 to .51
.18 to .60
.11 to .70
.14 to .47
.09 to .37
.11 to .41
.11 to .63
.00 to.76
Mean s Range of s
Figure 1.3 Specifi city of Various Cognitive Batteries
Note: s, specifi city (proportion of reliable specifi c variance)
These fi gures are adapted from Table 18.5 in Contemporary Intellectual Assessment, Flanagan and Harrison (2005)

OVERVIEW 31
there appears to be some ceiling effect on the School Readiness Composite, this restriction is mainly at the upper ages for which the composite can be admin-istered. As you would expect, the School Readiness Composite was designed primarily for use with children between the ages of fi ve and six, and at these ages the Composite scores range from 42 to 138. As far as the other composite scores are concerned, the restriction of range that is found is always at the extremes of the age range for the composite. For most ages, the full range of standard scores is available.
RANGE OF SUBTEST T SCORES
The DAS- II provides T scores that can range from 10 to 90 (–4 to +4 standard deviations from the mean, percentile ranks 0.01 to 99.99), but this range is not available for all subtests at all ages of the test (Sattler, Dumont, Willis, & Salerno, 2008, pp. 623–624). None of the 20 cognitive subtests provides a T score of 10 at the lowest ages administered, and only seven of the 20 cognitive subtests provide a T score of 90 at the highest ages administered. Although the score range limita-tions must be viewed carefully, you should remember that many subtests can be administered at either a typical age, an extended age, or at an out- of- level age. Examination of Core and Diagnostic subtest score range fi nds that when sub-tests are administered at the ages for which they are primarily intended, adequate fl oor and ceiling exists. Only a few Diagnostic subtests have range restrictions that must be viewed carefully. See Rapid Reference 1.12 and 1.13 for details of the range of subtest T scores by age.
On the Core subtests at the lower Early Years (Verbal Comprehension, Picture Similarities, Naming Vocabulary, and Pattern Construction), all have adequate ceiling. Each has some minor limits to their lowest T score (19 to 23, percentile ranks 0.1 to 0.3). On the Core subtests at the Upper Early Years (Verbal Com-prehension, Picture Similarities, Naming Vocabulary, Copying, Matrices, and Pattern Construction), all have adequate ceiling. All but Verbal Comprehension have some minor limits to their lowest T score (11 to 23, percentile ranks 0.01 to 0.3).
On the Core subtests of the School- Age level, four subtests (Pattern Con-struction, Matrices, Recall of Designs, and Verbal Similarities) provide the full range of subtest T scores at all ages. Word Defi nitions has some minor limitation of fl oor (minimum T score of 17, percentile rank 0.06 at age 7:0) and Sequen-tial and Quantitative Reasoning has minor limitations to its fl oor and ceiling T
scores (minimum and maximum T scores 18 to 81, percentile ranks 0.07 to 99.9).

Ran
ge o
f L
ower
and
Upp
er E
arly
Yea
rs S
ubte
st T
Sco
res
by A
ge
Age
s by
Yea
r an
d M
ont
h2
34
56
69
03
69
03
69
03
69
03
69
VC
omp
1917
1512
10-9
0PS
im23
2119
1715
1110
-90
NVo
c19
1715
1311
10-9
0PC
2018
1614
1210
-90
Cop
y23
2017
1411
10-9
0M
at23
2119
1716
1514
1311
10-9
0
RD
f30
2724
2219
1715
1310
-90
RPi
c30
2725
2321
1917
1513
1110
-90
ENC
2221
2019
1817
1615
1311
10-9
085
8075
70RO
i20
1814
1211
10-9
0M
LLF
3228
25-8
922
-88
18-8
515
-82
13-7
911
-76
10-7
472
7067
PhP
1611
10-8
987
8684
8281
RSO
2625
2423
2221
2019
RD
b34
3129
2624
2220
18SI
P37
3533
3129
2726
24R
N14
1210
-90
Not
e: C
ells
mar
ked
10-9
0 sh
ow a
ges
at w
hich
full
rang
e of
sco
res
is av
aila
ble.
Cel
ls w
ith T
sco
res
less
tha
n 50
sho
w lo
wes
t sco
re a
vaila
ble
at
that
age
. Cel
ls w
ith T
sco
res
grea
ter
than
50
show
hig
hest
sco
re a
vaila
ble
at t
hat a
ge.
VC
omp
= V
erba
l Com
preh
ensio
n; P
Sim
= P
ictu
re S
imila
ritie
s; N
Voc
= N
amin
g Vo
cabu
lary
; PC
= P
atte
rn C
onst
ruct
ion;
Cop
y =
Cop
ying
; M
at =
Mat
rices
; RD
f = R
ecal
l of D
igits
–For
war
d; R
Pic
= R
ecog
nitio
n of
Pic
ture
s; E
NC
= E
arly
Num
ber C
once
pts;
RO
i = R
ecal
l of O
bjec
ts –
Im
med
iate
; MLL
F =
Mat
chin
g Le
tter
- Lik
e Fo
rms;
PhP
= P
hono
logi
cal P
roce
ssin
g; R
SO =
Rec
all o
f Seq
. Ord
er; R
Db
= R
ecal
l of D
igits
–
Back
war
d; S
IP =
Spe
ed o
f Inf
orm
atio
n Pr
oces
sing
; RN
= R
apid
Nam
ing
Rapid
Refer
ence
1.12

Ran
ge o
f Sc
hool
- age
Sub
test
T S
core
s by
Age
Age
s by
Yea
r an
d M
ont
h7
89
1011
1213
1415
1617
03
69
03
69
06
06
06
06
06
06
06
06
06
PC10
-90
Mat
10-9
0R
Des
10-9
0W
Def
1715
1413
1110
-90
VSi
m10
-90
SQR
1817
1615
1413
1211
10-9
087
8481
RD
f10
-90
8988
87R
Pic
10-9
088
8684
8280
7874
7270
6866
6462
6160
ROi
10-9
0Ph
P80
7978
7776
7574
73R
SO18
1716
1514
1312
1110
-90
8683
81R
Db
1715
1412
1110
-90
8988
8786
8584
8382
8180
7978
SIP
2322
2120
1817
1615
1514
1312
10-9
090
8786
8584
RN
10-9
0N
ote:
Cel
ls m
arke
d 10
-90
show
age
s at
whi
ch fu
ll ra
nge
of s
core
s is
avai
labl
e. C
ells
with
T s
core
s le
ss t
han
50 s
how
low
est s
core
ava
ilabl
e at
tha
t age
. Cel
ls w
ith T
sco
res
grea
ter
than
50
show
hig
hest
sco
re a
vaila
ble
at t
hat a
ge.
PC =
Pat
tern
Con
stru
ctio
n; M
at =
Mat
rice
s; R
Des
= R
ecal
l of D
esig
ns; W
Def
= W
ord
Defi
niti
ons;
VSi
m =
Ver
bal S
imila
ritie
s; S
QR
=Se
quen
tial &
Qua
nti-
tativ
e R
easo
ning
; RD
f = R
ecal
l of D
igits
For
war
d; R
Pic
= R
ecog
nitio
n of
Pic
ture
s; R
Oi =
Rec
all o
f Obj
ects
–Im
med
iate
; PhP
= P
hono
logi
cal P
roce
ssin
g;
RSO
= R
ecal
l of S
eq. O
rder
; RD
b =
Rec
all o
f Dig
its B
ackw
ard
; SIP
= S
peed
of I
nfor
mat
ion
Proc
essi
ng; R
N =
Rap
id N
amin
g
Rapid
Refer
ence
1.13

34 ESSENTIALS OF DAS-II® ASSESSMENT
The range limitations at each level are, as you would expect, usually associated with the youngest and / or the oldest ages at which the subtests are adminis-tered.
Diagnostic subtests generally have more restriction in T score range than do the Core battery subtests. On the three Diagnostic subtests at the Lower Early Years level, each has a maximum T score of 90 and they have minimum T scores that range from 22 to 30 (percentile ranks 0.3 to 2). Of the 10 Diagnostic sub-tests at the Upper Early Years level, seven have a maximum T score of 90 (Early Number Concepts, Matching Letter- Like Forms, and Phonological Processing have maximum T scores of 70, 67, and 81, percentile ranks 98, 96, and 99.9, re-spectively, at the upper age of the battery), and none has a minimum T score of 10, although the minimum T score for each does range from 14 to 37 (percentile ranks 0.02 to 10). Of the eight Diagnostic subtests at the School- Age level, two (Recall of Objects and Rapid Naming) have a full range of subtest T scores. Of the remaining six subtests, three have a minimum T score of 10, while three have a minimum T score range of 17 to 23 (percentile ranks 0.06 to 0.3). These six sub-tests also have maximum T scores that range from 60 (percentile rank 84; Rec-ognition of Pictures) to 87 (percentile rank 99.98; Recall of Digits– Forward).
TEST YOURSELF
1. Which of the following clusters are included in the computation of the GCA for an 8- year- old child?
(a) Working Memory(b) Processing Speed(c) Spatial Ability(d) Verbal Ability(e) School Readiness(f ) Nonverbal Reasoning Ability
2. If you had to re- administer the DAS- II to the same child over a short period of time, on which Cluster would you expect the least amount of change to occur?
(a) Working Memory(b) Processing Speed(c) Spatial Ability(d) Verbal Ability(e) School Readiness(f ) Nonverbal Reasoning Ability
S S
OVERVIEW 35
3. The proportion of a subtest’s variance that is both reliable and distinct to the subtest is known as:
(a) Reliability(b) Specifi city(c) g loading(d) Standard Error of Measurement
4. You are testing a 7- year- old child believed to have below average intel-ligence, who is also suspected of having a language disorder. As you test, the child is having little success on the subtests and tasks you are admin-istering. Is it acceptable to administer the battery or subtests from a lower level of the test? Yes or No?
5. What is the typical age range for the DAS- II School- Age battery?
Answers: 1. c, d, and f; 2. b; 3. b; 4. Yes; 5. Ages 7 years 0 months to 17 years 11 months