Embed Size (px)
Citation preview
Ovostar Union N.V. Annual Report 2015 |

Ovostar Union N.V. Annual Report 2015 | 2
Ovostar Union N.V. Annual Report 2015 | 3
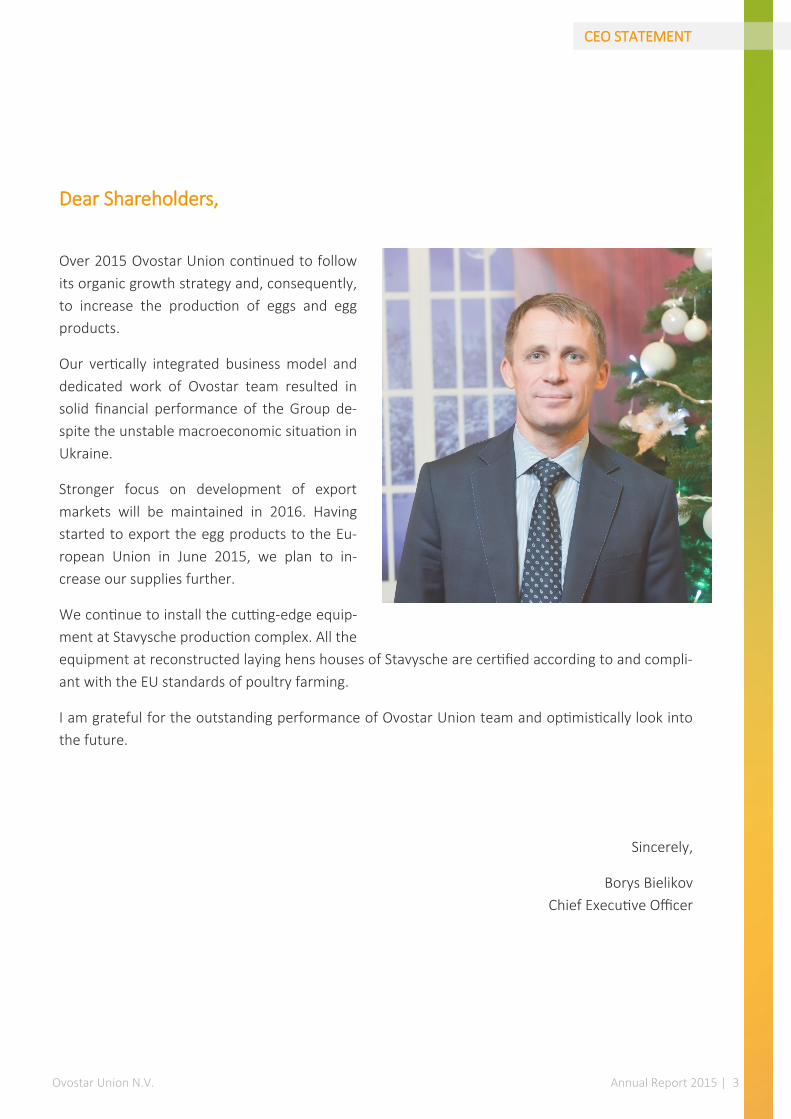
Dear Shareholders,
Over 2015 Ovostar Union continued to follow
its organic growth strategy and, consequently,
to increase the production of eggs and egg
products.
Our vertically integrated business model and
dedicated work of Ovostar team resulted in
solid financial performance of the Group de-
spite the unstable macroeconomic situation in
Ukraine.
Stronger focus on development of export
markets will be maintained in 2016. Having
started to export the egg products to the Eu-
ropean Union in June 2015, we plan to in-
crease our supplies further.
We continue to install the cutting-edge equip-
ment at Stavysche production complex. All the
equipment at reconstructed laying hens houses of Stavysche are certified according to and compli-
ant with the EU standards of poultry farming.
I am grateful for the outstanding performance of Ovostar Union team and optimistically look into
the future.
Sincerely,
Borys Bielikov
Chief Executive Officer
CEO STATEMENT
Ovostar Union N.V. Annual Report 2015 | 4
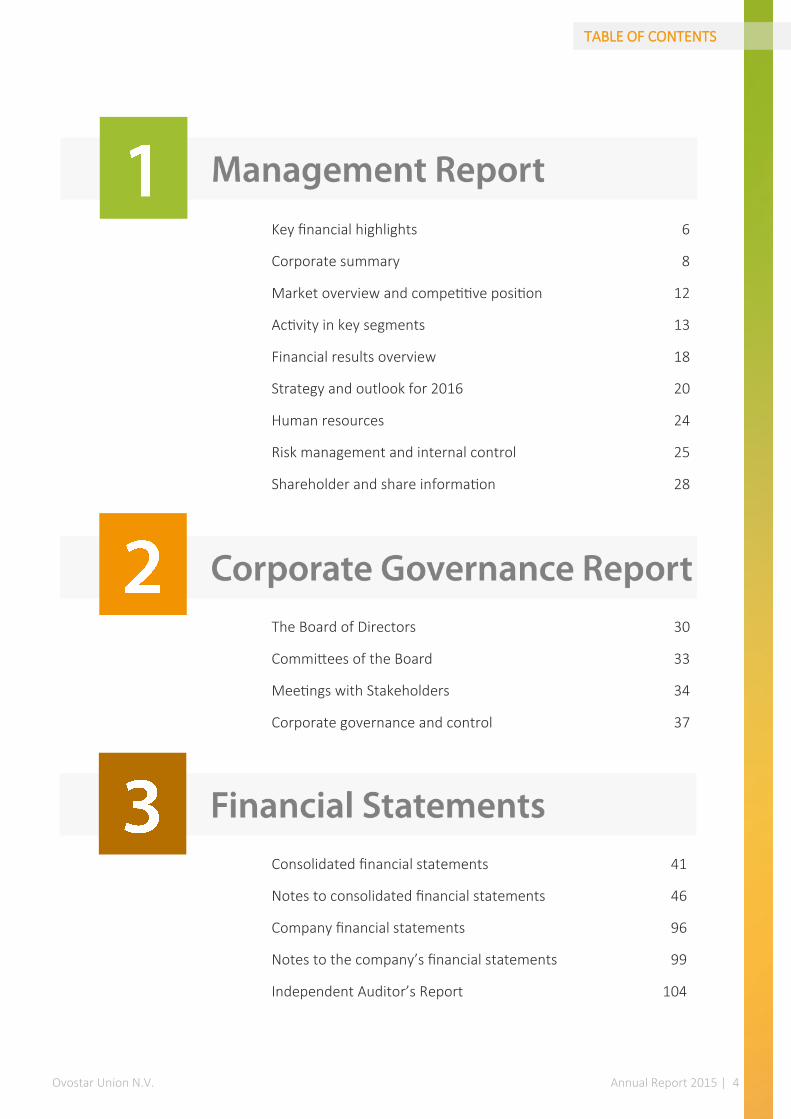
Key financial highlights 6
Corporate summary 8
Market overview and competitive position 12
Activity in key segments 13
Financial results overview 18
Strategy and outlook for 2016 20
Human resources 24
Risk management and internal control 25
Shareholder and share information 28
The Board of Directors 30
Committees of the Board 33
Meetings with Stakeholders 34
Corporate governance and control 37
Consolidated financial statements 41
Notes to consolidated financial statements 46
Company financial statements 96
Notes to the company’s financial statements 99
Independent Auditor’s Report 104
TABLE OF CONTENTS

Ovostar Union N.V. Annual Report 2015 | 5

Ovostar Union N.V. Annual Report 2015 | 6
Income Statement
2015 2014 YoY
Revenue 75.6 74.8 1%
Gross profit 32.4 26.8 21%
EBITDA 34.8 29.1 20%
Profit before tax 32.7 26.0 26%
Net profit 31.9 25.8 24%
Balance Sheet
2015 2014 YoY
Assets 100.7 101.6 (1%)
Non-current assets 59.5 68.2 (13%)
Current assets 41.2 33.4 23%
Equity and Liabilities 100.7 101.6 (1%)
Equity 78.5 85.0 (8%)
Non-current liabilities 14.2 7.6 87%
Current liabilities 8.0 8.9 (11%)
Key financials
MANAGEMENT REPORT
Governance Report
Financial Statements
Other Information
EBITDA and EBITDA margin Net profit and net profit margin
Ovostar Union N.V. Annual Report 2015 | 7
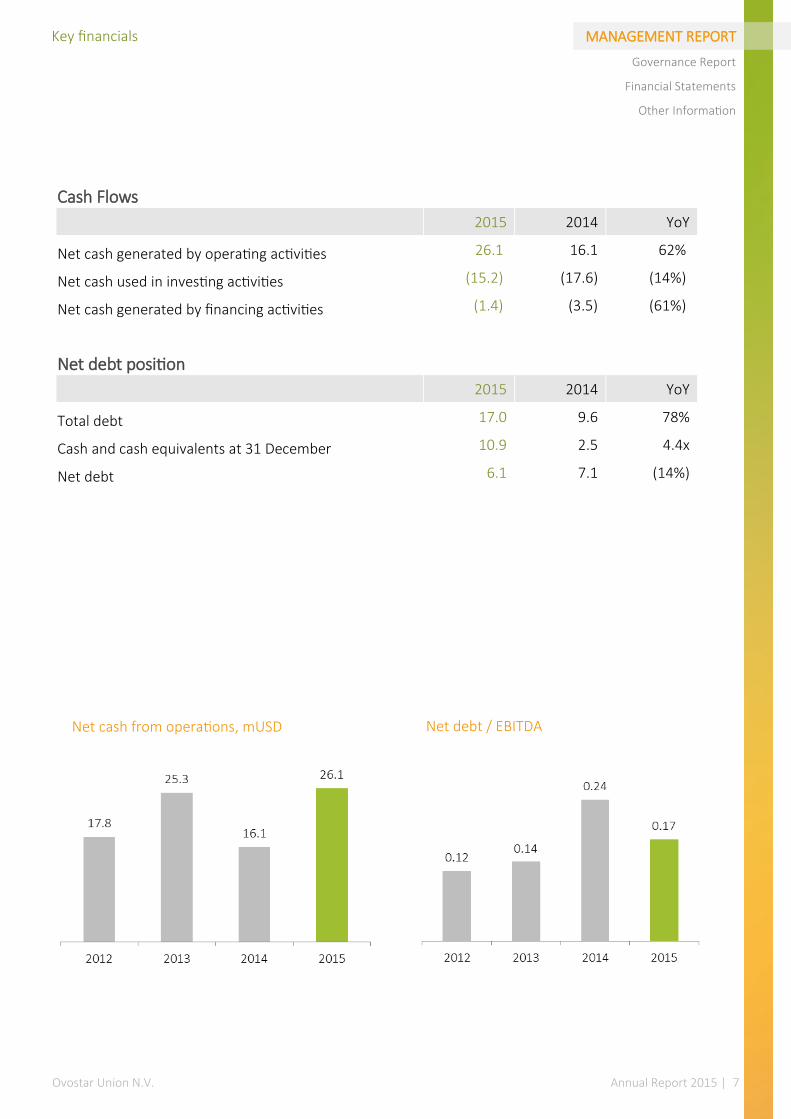
Cash Flows
2015 2014 YoY
Net cash generated by operating activities 26.1 16.1 62%
Net cash used in investing activities (15.2) (17.6) (14%)
Net cash generated by financing activities (1.4) (3.5) (61%)
Net debt position
2015 2014 YoY
Total debt 17.0 9.6 78%
Cash and cash equivalents at 31 December 10.9 2.5 4.4x
Net debt 6.1 7.1 (14%)
MANAGEMENT REPORT
Governance Report
Financial Statements
Other Information
Key financials
Net cash from operations, mUSD Net debt / EBITDA
Ovostar Union N.V. Annual Report 2015 | 8
Corporate Summary
MANAGEMENT REPORT
Governance Report
Financial Statements
Other Information
Ovostar Union N.V. is a holding entity incorporated under the laws of the Netherlands consoli-
dating companies with production assets located in Ukraine (hereinafter referred to as “we, us”).
Our shares have been quoted on the Warsaw Stock Exchange since June 2011.
Our mission is to produce ecologically clean and healthy food for Ukrainians. Also as we grow and
gradually increase the volume of eggs produced, we develop the export markets and supply the
shell eggs and egg products of consistently high quality to our international clients.
Within the egg segment, we constantly focus on meeting the demand of Ukrainian middle class
consumers. With the shell egg portfolio of over 20 sub-brands we supply branded eggs to the larg-
est retail chains in Ukraine. Additionally, as a result of gradually increasing egg production we are
developing the presence on export markets.
Within the egg products segment, we offer the full range of egg products of both liquid and dry
forms. By adjusting the products to the clients’ needs (while maintaining the superior quality) we
achieve the loyalty of largest food processing companies in Ukraine and outside.
It takes up to 24 hours to transport the
fresh eggs to egg processing plant
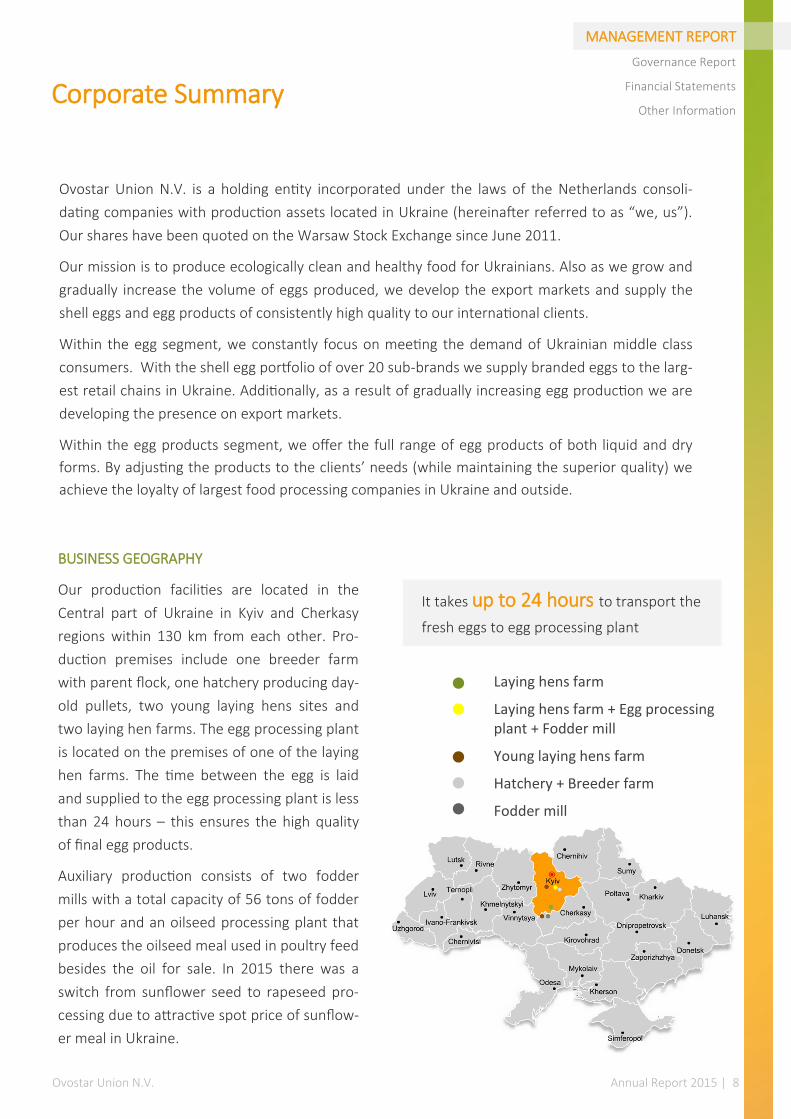
BUSINESS GEOGRAPHY
Our production facilities are located in the
Central part of Ukraine in Kyiv and Cherkasy
regions within 130 km from each other. Pro-
duction premises include one breeder farm
with parent flock, one hatchery producing day-
old pullets, two young laying hens sites and
two laying hen farms. The egg processing plant
is located on the premises of one of the laying
hen farms. The time between the egg is laid
and supplied to the egg processing plant is less
than 24 hours – this ensures the high quality
of final egg products.
Auxiliary production consists of two fodder
mills with a total capacity of 56 tons of fodder
per hour and an oilseed processing plant that
produces the oilseed meal used in poultry feed
besides the oil for sale. In 2015 there was a
switch from sunflower seed to rapeseed pro-
cessing due to attractive spot price of sunflow-
er meal in Ukraine.
Laying hens farm
Laying hens farm + Egg processing plant + Fodder mill
Young laying hens farm
Hatchery + Breeder farm
Fodder mill
Ovostar Union N.V. Annual Report 2015 | 9
MANAGEMENT REPORT
Governance Report
Financial Statements
Other Information
Corporate Summary
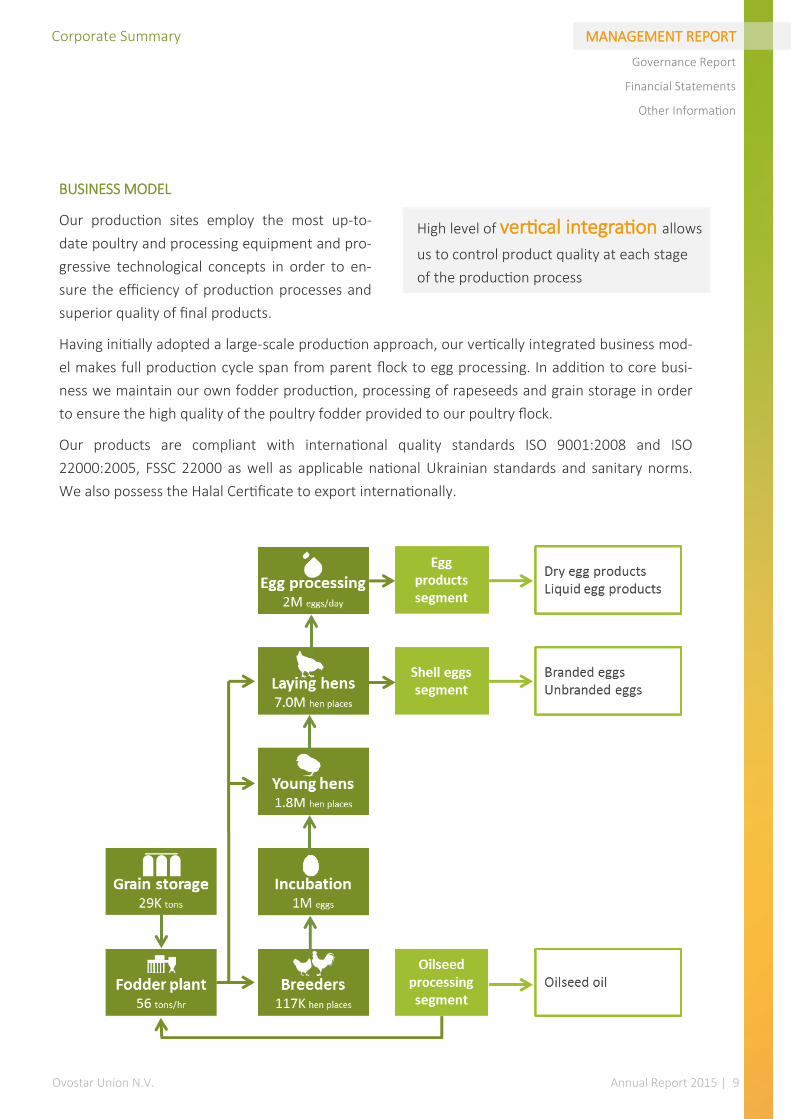
BUSINESS MODEL
Our production sites employ the most up-to-
date poultry and processing equipment and pro-
gressive technological concepts in order to en-
sure the efficiency of production processes and
superior quality of final products.
Having initially adopted a large-scale production approach, our vertically integrated business mod-
el makes full production cycle span from parent flock to egg processing. In addition to core busi-
ness we maintain our own fodder production, processing of rapeseeds and grain storage in order
to ensure the high quality of the poultry fodder provided to our poultry flock.
Our products are compliant with international quality standards ISO 9001:2008 and ISO
22000:2005, FSSC 22000 as well as applicable national Ukrainian standards and sanitary norms.
We also possess the Halal Certificate to export internationally.
High level of vertical integration allows
us to control product quality at each stage
of the production process
Ovostar Union N.V. Annual Report 2015 | 10
MANAGEMENT REPORT
Governance Report
Financial Statements
Other Information
Corporate Summary
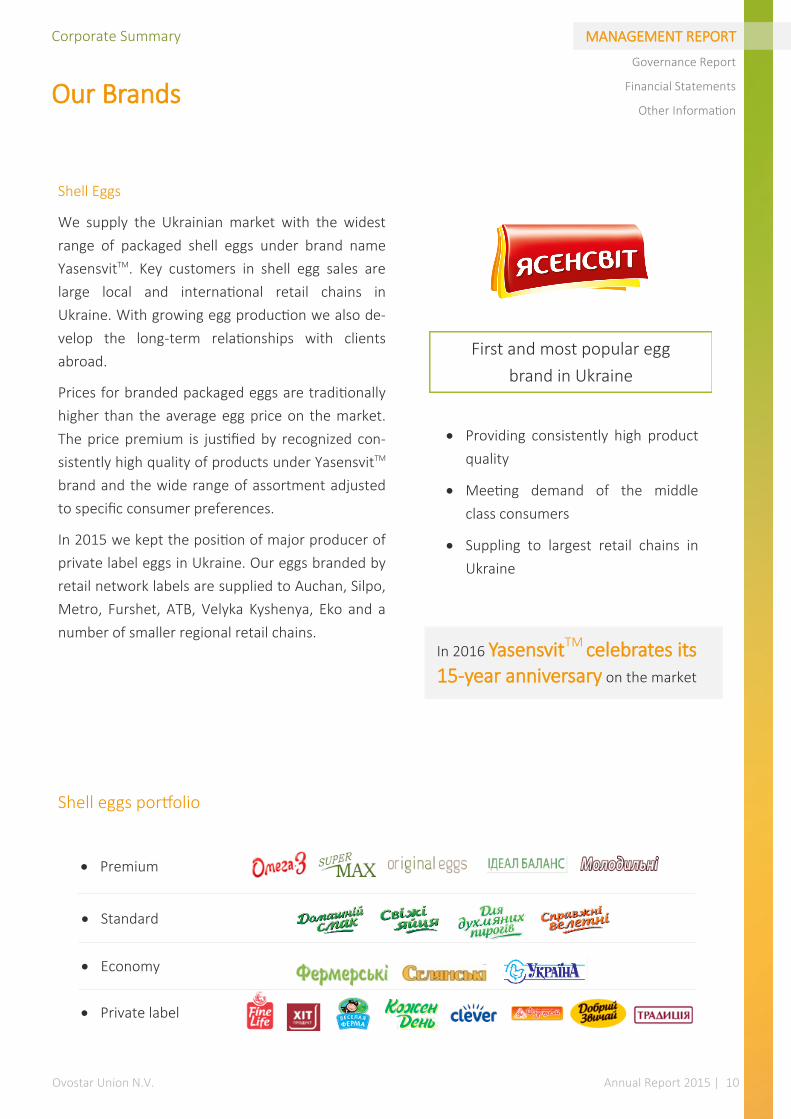
Shell Eggs
We supply the Ukrainian market with the widest
range of packaged shell eggs under brand name
YasensvitTM. Key customers in shell egg sales are
large local and international retail chains in
Ukraine. With growing egg production we also de-
velop the long-term relationships with clients
abroad.
Prices for branded packaged eggs are traditionally
higher than the average egg price on the market.
The price premium is justified by recognized con-
sistently high quality of products under YasensvitTM
brand and the wide range of assortment adjusted
to specific consumer preferences.
In 2015 we kept the position of major producer of
private label eggs in Ukraine. Our eggs branded by
retail network labels are supplied to Auchan, Silpo,
Metro, Furshet, ATB, Velyka Kyshenya, Eko and a
number of smaller regional retail chains. In 2016 YasensvitTM celebrates its 15-year anniversary on the market
Shell eggs portfolio
Providing consistently high product
quality
Meeting demand of the middle
class consumers
Suppling to largest retail chains in
Ukraine
Premium
Standard
Economy
Private label
First and most popular egg
brand in Ukraine
Our Brands
Ovostar Union N.V. Annual Report 2015 | 11
MANAGEMENT REPORT
Governance Report
Financial Statements
Other Information
Corporate Summary
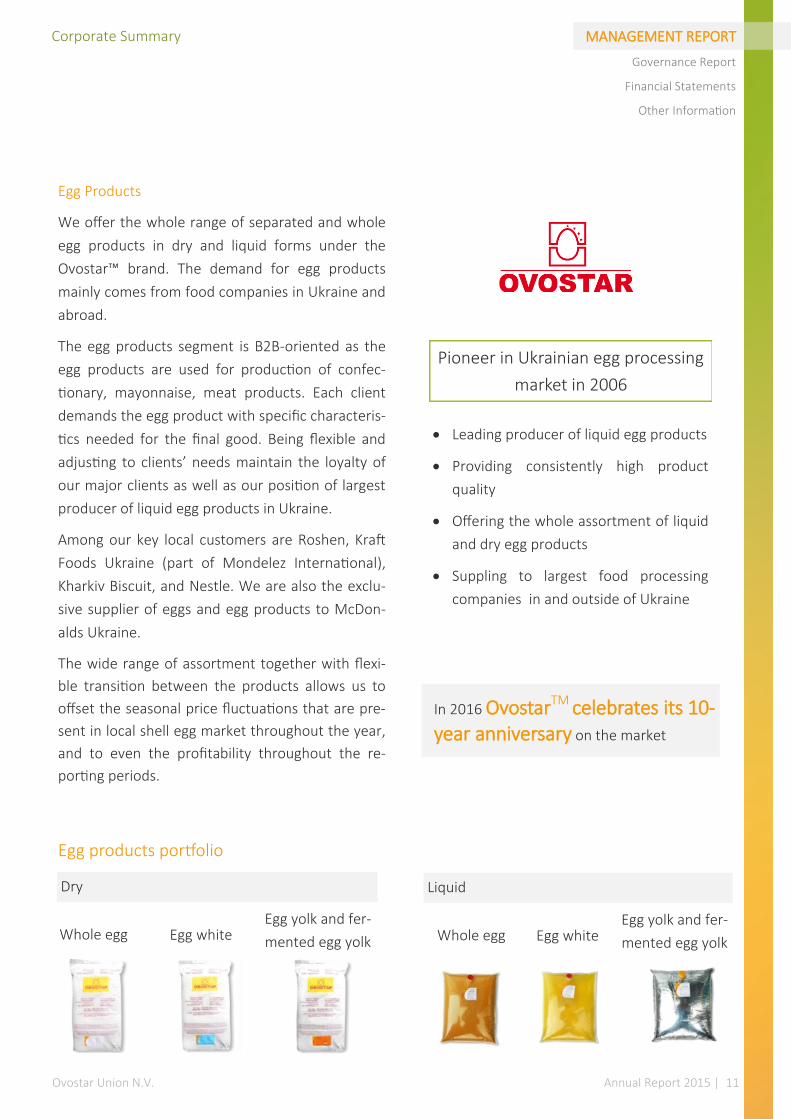
Egg Products
We offer the whole range of separated and whole
egg products in dry and liquid forms under the
Ovostar™ brand. The demand for egg products
mainly comes from food companies in Ukraine and
abroad.
The egg products segment is B2B-oriented as the
egg products are used for production of confec-
tionary, mayonnaise, meat products. Each client
demands the egg product with specific characteris-
tics needed for the final good. Being flexible and
adjusting to clients’ needs maintain the loyalty of
our major clients as well as our position of largest
producer of liquid egg products in Ukraine.
Among our key local customers are Roshen, Kraft
Foods Ukraine (part of Mondelez International),
Kharkiv Biscuit, and Nestle. We are also the exclu-
sive supplier of eggs and egg products to McDon-
alds Ukraine.
The wide range of assortment together with flexi-
ble transition between the products allows us to
offset the seasonal price fluctuations that are pre-
sent in local shell egg market throughout the year,
and to even the profitability throughout the re-
porting periods.
In 2016 OvostarTM celebrates its 10-year anniversary on the market
Leading producer of liquid egg products
Providing consistently high product
quality
Offering the whole assortment of liquid
and dry egg products
Suppling to largest food processing
companies in and outside of Ukraine
Egg products portfolio
Pioneer in Ukrainian egg processing
market in 2006
Dry Liquid
Whole egg Whole egg Egg white Egg white Egg yolk and fer-
mented egg yolk
Egg yolk and fer-
mented egg yolk
Ovostar Union N.V. Annual Report 2015 | 12
Market overview and competitive position
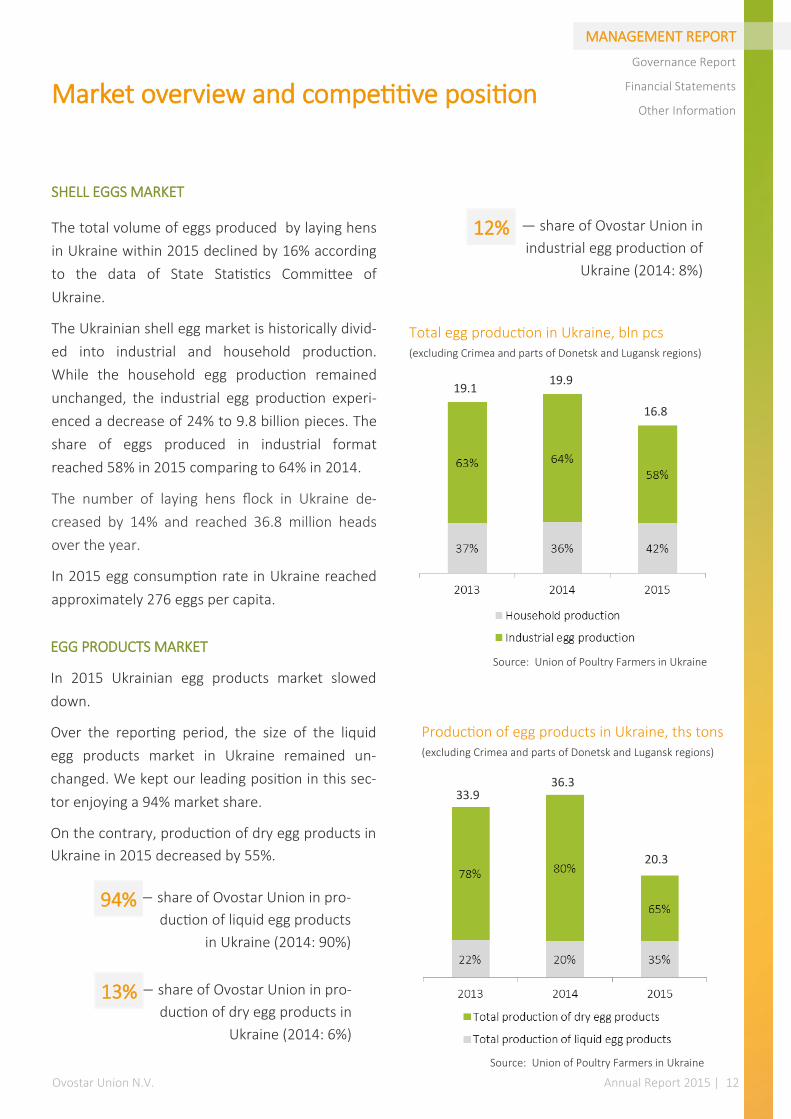
SHELL EGGS MARKET
The total volume of eggs produced by laying hens
in Ukraine within 2015 declined by 16% according
to the data of State Statistics Committee of
Ukraine.
The Ukrainian shell egg market is historically divid-
ed into industrial and household production.
While the household egg production remained
unchanged, the industrial egg production experi-
enced a decrease of 24% to 9.8 billion pieces. The
share of eggs produced in industrial format
reached 58% in 2015 comparing to 64% in 2014.
The number of laying hens flock in Ukraine de-
creased by 14% and reached 36.8 million heads
over the year.
In 2015 egg consumption rate in Ukraine reached
approximately 276 eggs per capita.
MANAGEMENT REPORT
Governance Report
Financial Statements
Other Information
— share of Ovostar Union in
industrial egg production of
Ukraine (2014: 8%)
12%
19.9
16.8
19.1
Total egg production in Ukraine, bln pcs (excluding Crimea and parts of Donetsk and Lugansk regions)
EGG PRODUCTS MARKET
In 2015 Ukrainian egg products market slowed
down.
Over the reporting period, the size of the liquid
egg products market in Ukraine remained un-
changed. We kept our leading position in this sec-
tor enjoying a 94% market share.
On the contrary, production of dry egg products in
Ukraine in 2015 decreased by 55%.
— share of Ovostar Union in pro-
duction of liquid egg products
in Ukraine (2014: 90%)
94%
— share of Ovostar Union in pro-
duction of dry egg products in
Ukraine (2014: 6%)
13%
Production of egg products in Ukraine, ths tons (excluding Crimea and parts of Donetsk and Lugansk regions)
20.3
36.3 33.9
Source: Union of Poultry Farmers in Ukraine
Source: Union of Poultry Farmers in Ukraine
Ovostar Union N.V. Annual Report 2015 | 13
MANAGEMENT REPORT
Governance Report
Financial Statements
Other Information Activity in key segments
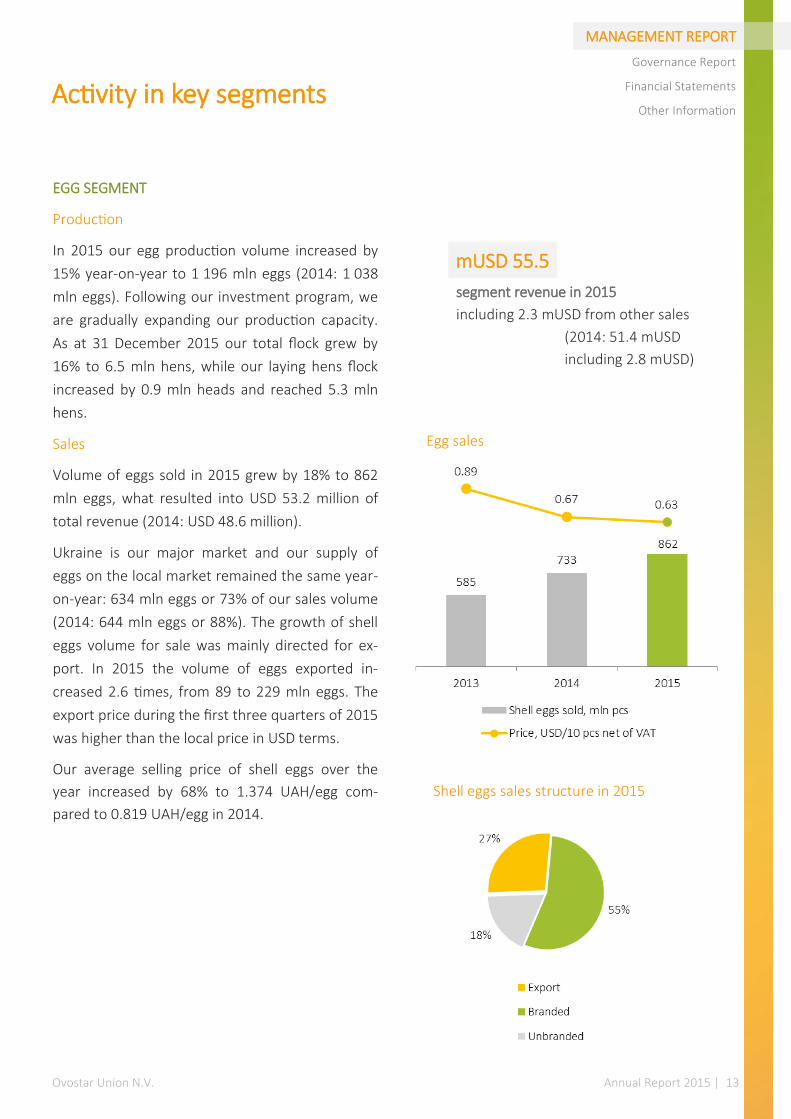
EGG SEGMENT
Production
In 2015 our egg production volume increased by
15% year-on-year to 1 196 mln eggs (2014: 1 038
mln eggs). Following our investment program, we
are gradually expanding our production capacity.
As at 31 December 2015 our total flock grew by
16% to 6.5 mln hens, while our laying hens flock
increased by 0.9 mln heads and reached 5.3 mln
hens.
Sales
Volume of eggs sold in 2015 grew by 18% to 862
mln eggs, what resulted into USD 53.2 million of
total revenue (2014: USD 48.6 million).
Ukraine is our major market and our supply of
eggs on the local market remained the same year-
on-year: 634 mln eggs or 73% of our sales volume
(2014: 644 mln eggs or 88%). The growth of shell
eggs volume for sale was mainly directed for ex-
port. In 2015 the volume of eggs exported in-
creased 2.6 times, from 89 to 229 mln eggs. The
export price during the first three quarters of 2015
was higher than the local price in USD terms.
Our average selling price of shell eggs over the
year increased by 68% to 1.374 UAH/egg com-
pared to 0.819 UAH/egg in 2014.
segment revenue in 2015
including 2.3 mUSD from other sales
(2014: 51.4 mUSD
including 2.8 mUSD)
mUSD 55.5
Egg sales
Shell eggs sales structure in 2015
Ovostar Union N.V. Annual Report 2015 | 14
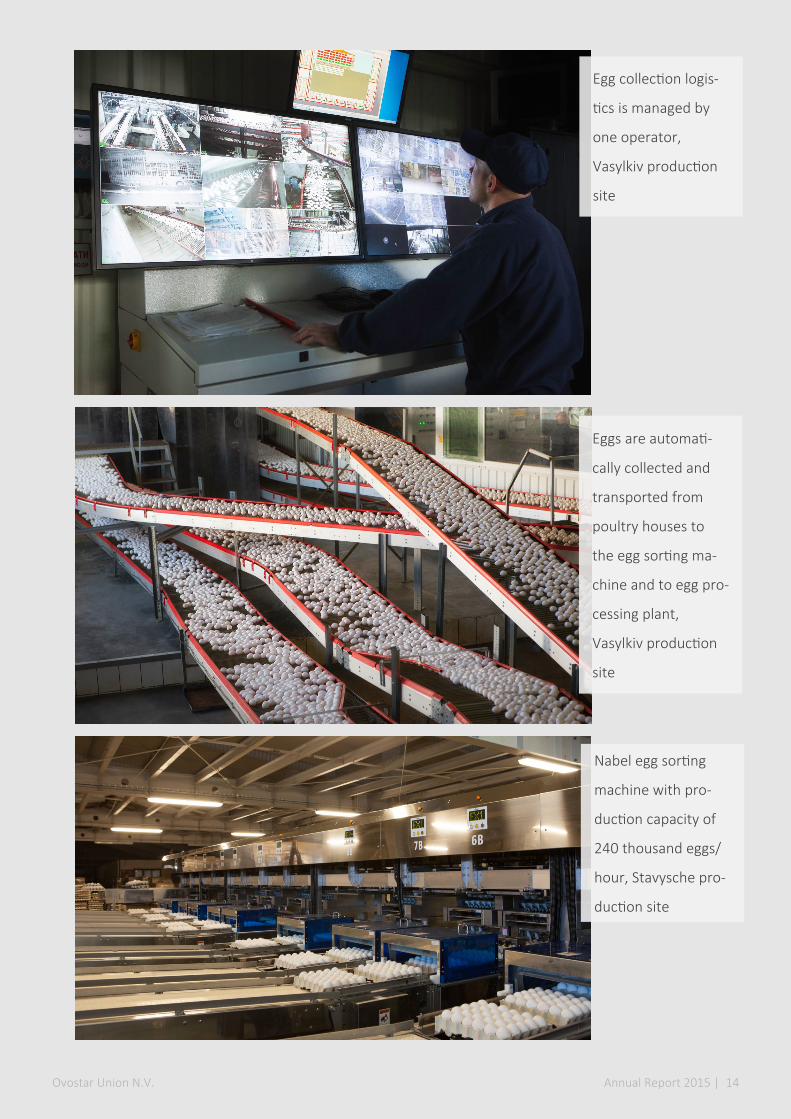
Eggs are automati-
cally collected and
transported from
poultry houses to
the egg sorting ma-
chine and to egg pro-
cessing plant,
Vasylkiv production
site
Nabel egg sorting
machine with pro-
duction capacity of
240 thousand eggs/
hour, Stavysche pro-
duction site
Egg collection logis-
tics is managed by
one operator,
Vasylkiv production
site
Ovostar Union N.V. Annual Report 2015 | 15
MANAGEMENT REPORT
Governance Report
Financial Statements
Other Information
Activity in key segments
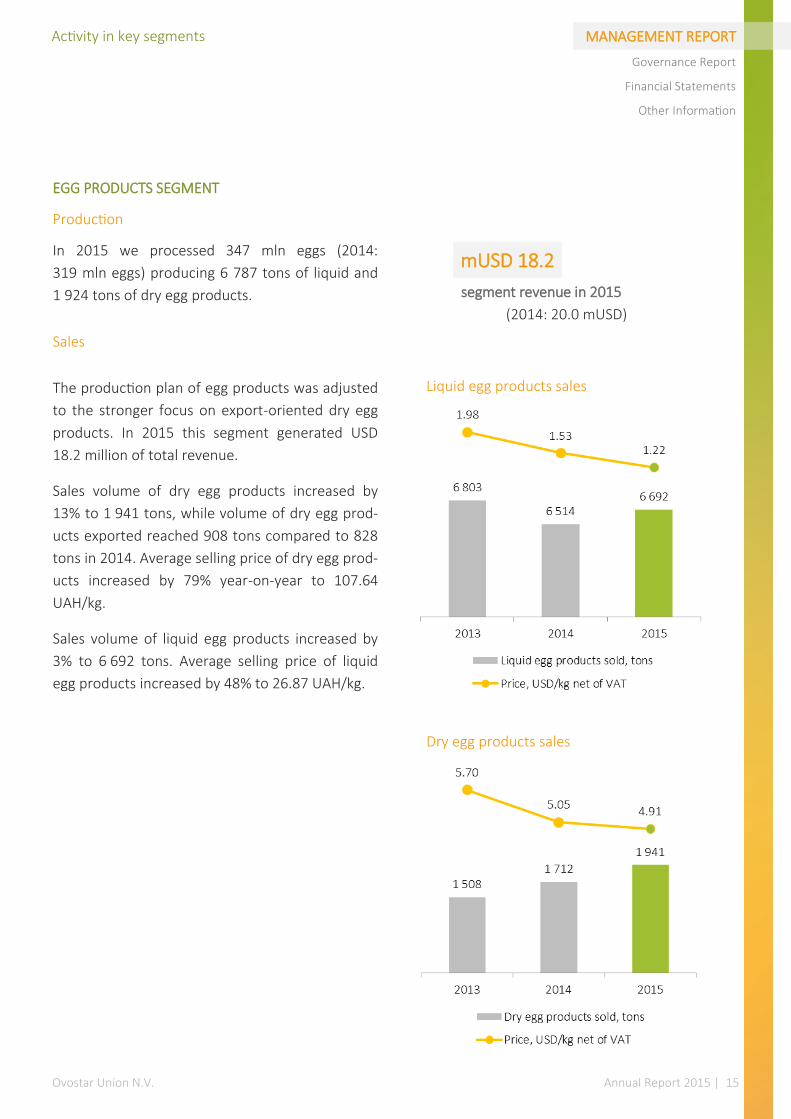
EGG PRODUCTS SEGMENT
Production
In 2015 we processed 347 mln eggs (2014:
319 mln eggs) producing 6 787 tons of liquid and
1 924 tons of dry egg products.
Sales
The production plan of egg products was adjusted
to the stronger focus on export-oriented dry egg
products. In 2015 this segment generated USD
18.2 million of total revenue.
Sales volume of dry egg products increased by
13% to 1 941 tons, while volume of dry egg prod-
ucts exported reached 908 tons compared to 828
tons in 2014. Average selling price of dry egg prod-
ucts increased by 79% year-on-year to 107.64
UAH/kg.
Sales volume of liquid egg products increased by
3% to 6 692 tons. Average selling price of liquid
egg products increased by 48% to 26.87 UAH/kg.
mUSD 18.2
segment revenue in 2015
(2014: 20.0 mUSD)
Liquid egg products sales
Dry egg products sales
Ovostar Union N.V. Annual Report 2015 | 16
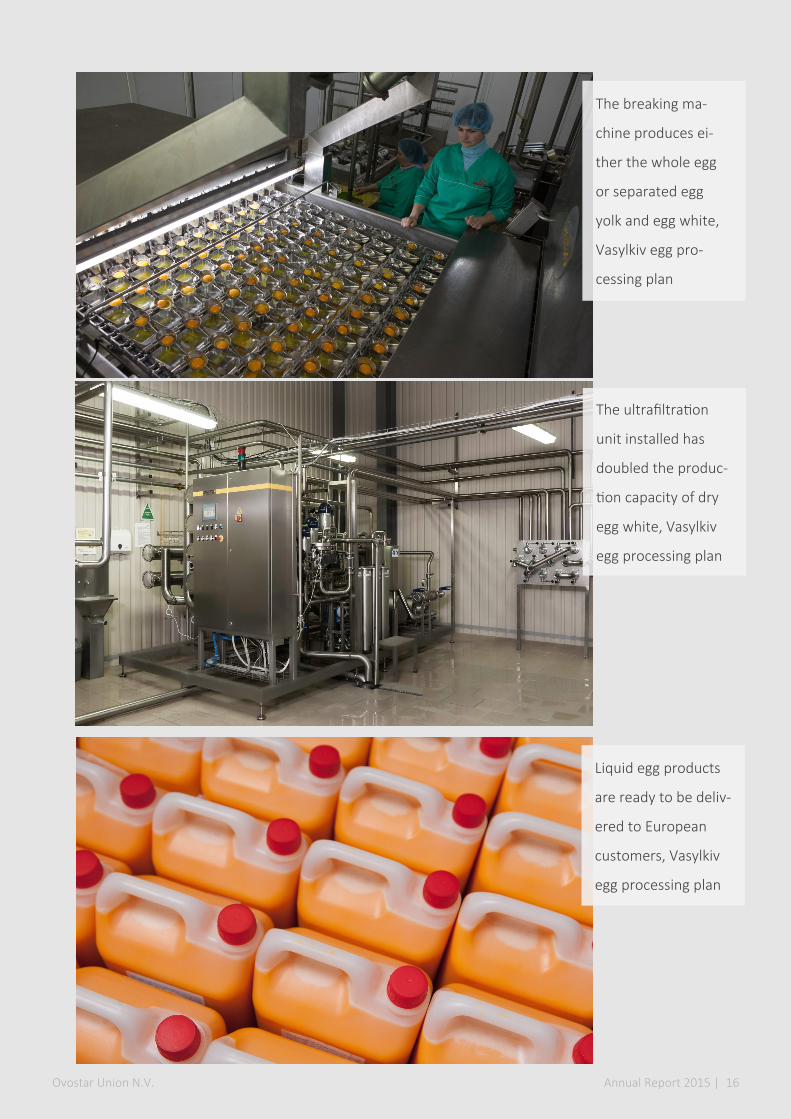
Liquid egg products
are ready to be deliv-
ered to European
customers, Vasylkiv
egg processing plan
The ultrafiltration
unit installed has
doubled the produc-
tion capacity of dry
egg white, Vasylkiv
egg processing plan
The breaking ma-
chine produces ei-
ther the whole egg
or separated egg
yolk and egg white,
Vasylkiv egg pro-
cessing plan
Ovostar Union N.V. Annual Report 2015 | 17
MANAGEMENT REPORT
Governance Report
Financial Statements
Other Information
Activity in key segments
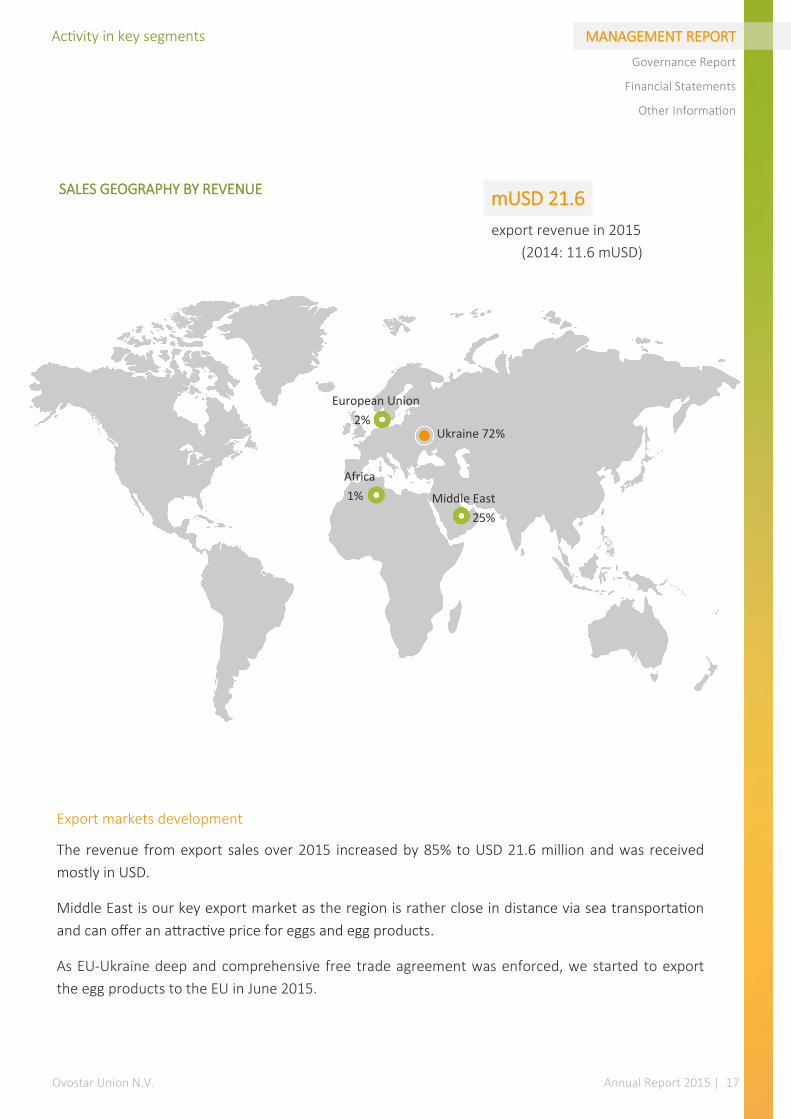
Export markets development
The revenue from export sales over 2015 increased by 85% to USD 21.6 million and was received
mostly in USD.
Middle East is our key export market as the region is rather close in distance via sea transportation
and can offer an attractive price for eggs and egg products.
As EU-Ukraine deep and comprehensive free trade agreement was enforced, we started to export
the egg products to the EU in June 2015.
SALES GEOGRAPHY BY REVENUE
mUSD 21.6
export revenue in 2015
(2014: 11.6 mUSD)
Middle East
25%
European Union
2%
Africa
1%
Ukraine 72%
Ovostar Union N.V. Annual Report 2015 | 18
MANAGEMENT REPORT
Governance Report
Financial Statements
Other Information Financial results overview
FINANCIAL POSITION
Assets, liabilities and equity
In 2015 value of our total assets decreased by 1% to USD 100.7 million. As a result of devaluation of
UAH the value of non-current assets declined by 13%, despite four newly constructed laying hens
houses and 20% increase in total flock. Accumulated cash reserve together with increased invento-
ries and prepayments to suppliers mostly compensated the decline.
The total equity declined by 8% mostly due to accumulated foreign currency translation reserve. On
the contrary, the export financing loan obtained for stage 1 of investment program has increased
the liabilities side by 34%.
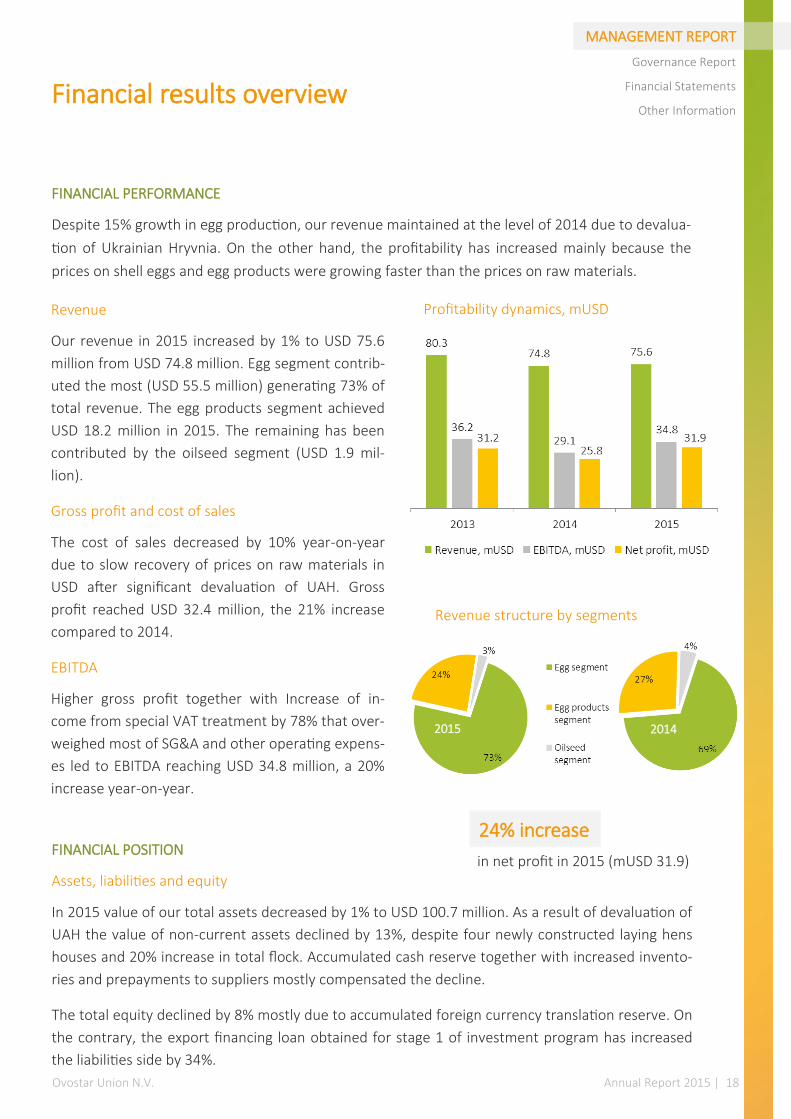
Revenue
Our revenue in 2015 increased by 1% to USD 75.6
million from USD 74.8 million. Egg segment contrib-
uted the most (USD 55.5 million) generating 73% of
total revenue. The egg products segment achieved
USD 18.2 million in 2015. The remaining has been
contributed by the oilseed segment (USD 1.9 mil-
lion).
Gross profit and cost of sales
The cost of sales decreased by 10% year-on-year
due to slow recovery of prices on raw materials in
USD after significant devaluation of UAH. Gross
profit reached USD 32.4 million, the 21% increase
compared to 2014.
EBITDA
Higher gross profit together with Increase of in-
come from special VAT treatment by 78% that over-
weighed most of SG&A and other operating expens-
es led to EBITDA reaching USD 34.8 million, a 20%
increase year-on-year.
FINANCIAL PERFORMANCE
Despite 15% growth in egg production, our revenue maintained at the level of 2014 due to devalua-
tion of Ukrainian Hryvnia. On the other hand, the profitability has increased mainly because the
prices on shell eggs and egg products were growing faster than the prices on raw materials.
in net profit in 2015 (mUSD 31.9)
24% increase
Profitability dynamics, mUSD
2015
Revenue structure by segments
2014
Ovostar Union N.V. Annual Report 2015 | 19
MANAGEMENT REPORT
Governance Report
Financial Statements
Other Information
Financial results overview
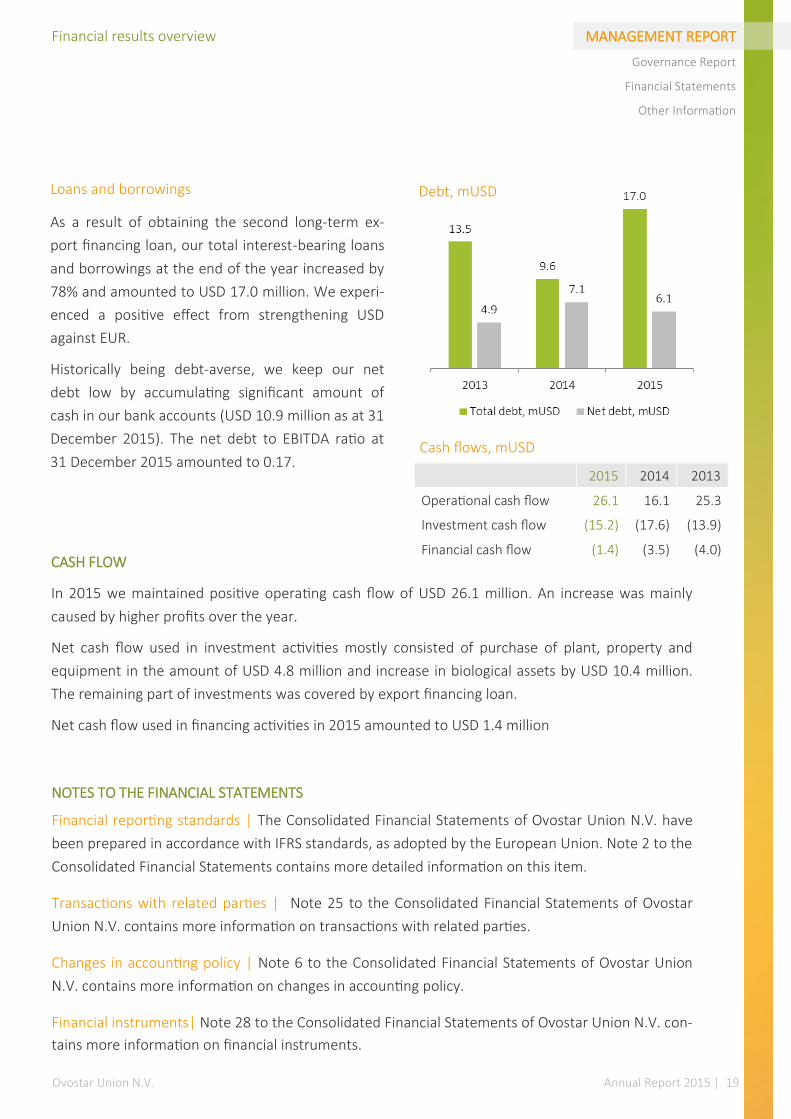
Loans and borrowings
As a result of obtaining the second long-term ex-
port financing loan, our total interest-bearing loans
and borrowings at the end of the year increased by
78% and amounted to USD 17.0 million. We experi-
enced a positive effect from strengthening USD
against EUR.
Historically being debt-averse, we keep our net
debt low by accumulating significant amount of
cash in our bank accounts (USD 10.9 million as at 31
December 2015). The net debt to EBITDA ratio at
31 December 2015 amounted to 0.17.
Debt, mUSD
NOTES TO THE FINANCIAL STATEMENTS
Financial reporting standards | The Consolidated Financial Statements of Ovostar Union N.V. have
been prepared in accordance with IFRS standards, as adopted by the European Union. Note 2 to the
Consolidated Financial Statements contains more detailed information on this item.
Transactions with related parties | Note 25 to the Consolidated Financial Statements of Ovostar
Union N.V. contains more information on transactions with related parties.
Changes in accounting policy | Note 6 to the Consolidated Financial Statements of Ovostar Union
N.V. contains more information on changes in accounting policy.
Financial instruments| Note 28 to the Consolidated Financial Statements of Ovostar Union N.V. con-
tains more information on financial instruments.
Cash flows, mUSD
2015 2014 2013
Operational cash flow 26.1 16.1 25.3
Investment cash flow (15.2) (17.6) (13.9)
Financial cash flow (1.4) (3.5) (4.0) CASH FLOW
In 2015 we maintained positive operating cash flow of USD 26.1 million. An increase was mainly
caused by higher profits over the year.
Net cash flow used in investment activities mostly consisted of purchase of plant, property and
equipment in the amount of USD 4.8 million and increase in biological assets by USD 10.4 million.
The remaining part of investments was covered by export financing loan.
Net cash flow used in financing activities in 2015 amounted to USD 1.4 million
Ovostar Union N.V. Annual Report 2015 | 20
MANAGEMENT REPORT
Governance Report
Financial Statements
Other Information Strategy and outlook for 2016
STRATEGY
We aim to strengthen our market position via gradual organic growth, adjusting to customers’
needs, expansion of our presence outside of Ukraine, and thorough quality control. Operating in
turbulent conditions of Ukrainian economic situation we focus on consistently high quality of our
products and long-term relationships with our clients.
Our vertically integrated business model provides the possibility to control the quality of eggs and
egg products at each stage of production cycle.
The results we deliver are based on commitment of every employee together with teamwork
across departments.
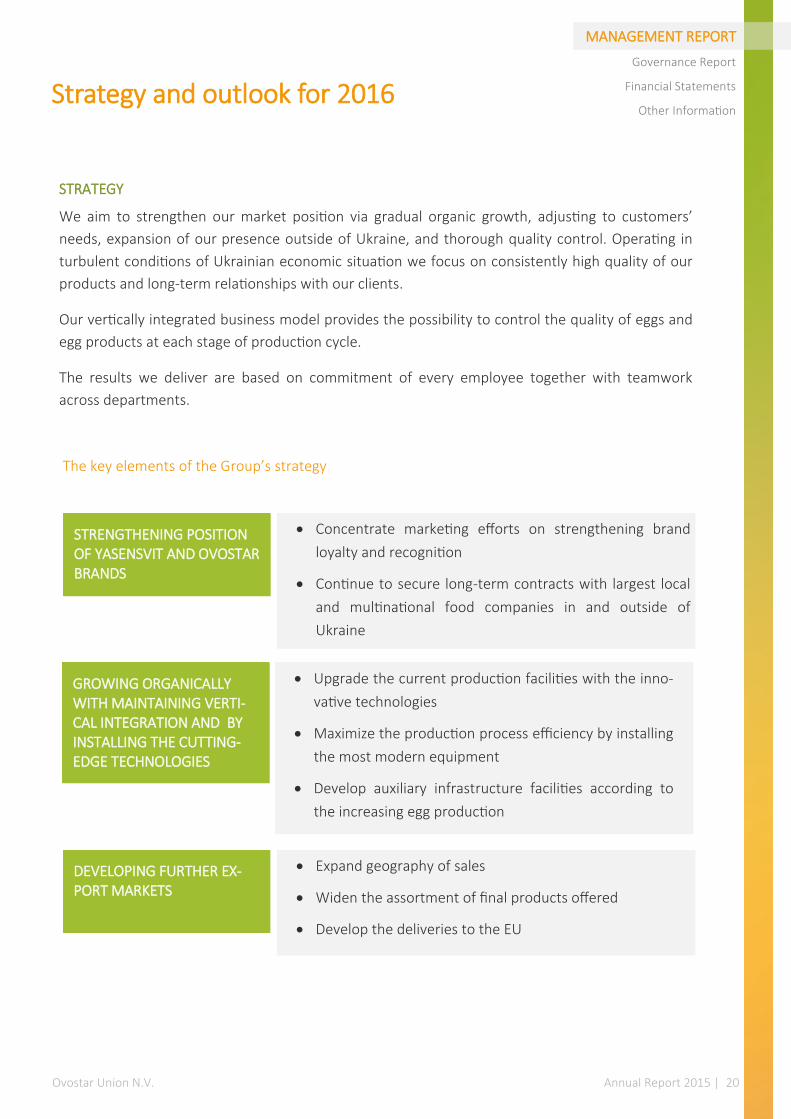
The key elements of the Group’s strategy
DEVELOPING FURTHER EX-PORT MARKETS
GROWING ORGANICALLY WITH MAINTAINING VERTI-CAL INTEGRATION AND BY INSTALLING THE CUTTING-EDGE TECHNOLOGIES
STRENGTHENING POSITION OF YASENSVIT AND OVOSTAR BRANDS
Expand geography of sales
Widen the assortment of final products offered
Develop the deliveries to the EU
Upgrade the current production facilities with the inno-
vative technologies
Maximize the production process efficiency by installing
the most modern equipment
Develop auxiliary infrastructure facilities according to
the increasing egg production
Concentrate marketing efforts on strengthening brand
loyalty and recognition
Continue to secure long-term contracts with largest local
and multinational food companies in and outside of
Ukraine
Ovostar Union N.V. Annual Report 2015 | 21
MANAGEMENT REPORT
Governance Report
Financial Statements
Other Information
OUTLOOK FOR 2016
Following our investment program we continue expanding our production capacities and, conse-
quently, increasing egg production volumes. As Ukrainian Hryvnia stayed volatile during the first
three months of 2016, we strongly focus on exporting shell eggs and dry egg products more. The
export revenue that is mostly generated in USD will hedge the currency risk and increase the pre-
dictability of our periodic financial results in the presentation currency.
In 2016 our export sales are expected to generate over 30% of our total revenue. We expect to
export over 30% of total sales volume of shell eggs and over 50% of total sales volume of dry egg
products.
INVESTMENT PROGRAM UPDATE
Following our organic growth program we continue our investment program at Stavysche produc-
tion site that consists of 16 laying hens houses and is divided in two stages. The Stage 1 covers
eight laying hens houses and the additional infrastructure and is planned to be completed by April
2016. Already in 2016 we plan to start the Stage 2. Overall, four laying hens houses are expected
to be finished by the end of 2016: two from Stage 1 and two from Stage 2.
Regarding the infrastructure, in January 2016 we installed a new Nabel egg sorting machine with
capacity of 240 thousand eggs per hour.
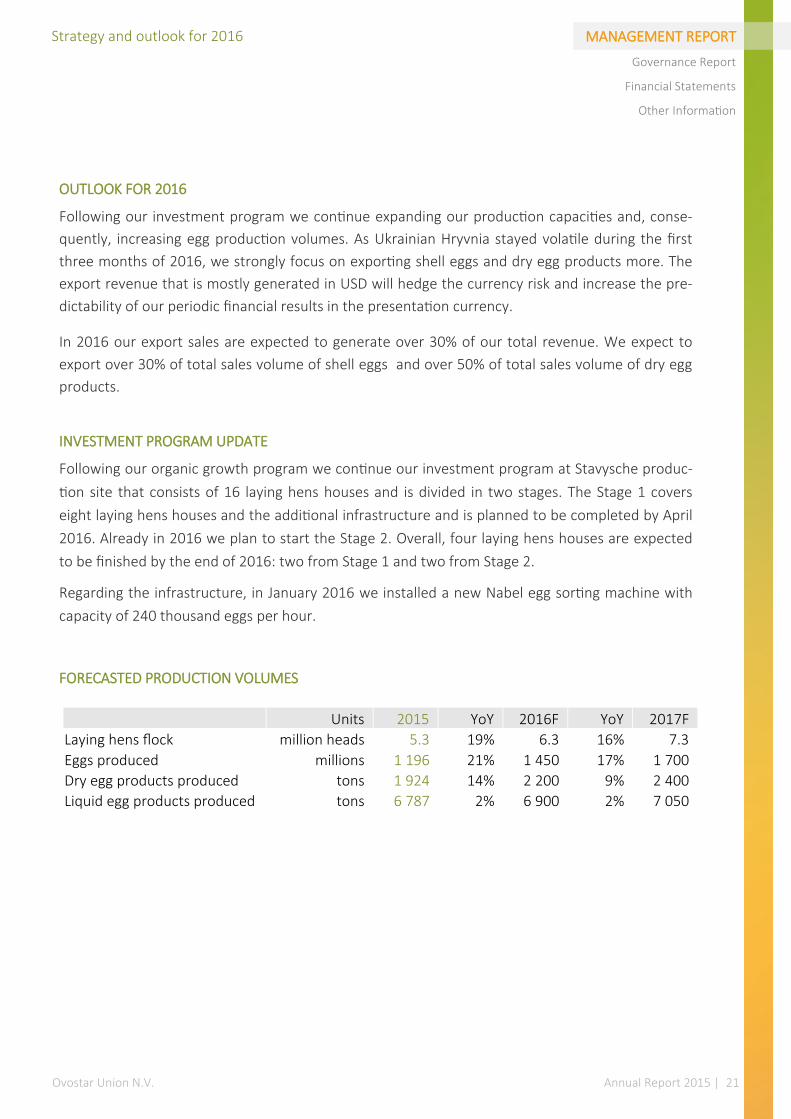
FORECASTED PRODUCTION VOLUMES
Units 2015 YoY 2016F YoY 2017F
Laying hens flock million heads 5.3 19% 6.3 16% 7.3
Eggs produced millions 1 196 21% 1 450 17% 1 700
Dry egg products produced tons 1 924 14% 2 200 9% 2 400
Liquid egg products produced tons 6 787 2% 6 900 2% 7 050
Strategy and outlook for 2016

Ovostar Union N.V. Annual Report 2015 | 22
Equipment is certi-
fied and compliant
with the EU standard
“enriched cage”
Poultry houses have
two floors of 6 tiers
each. The total pro-
duction capacity of
one poultry house is
320 thousand laying
hens
Stage 1 of current
investment program
at Stavysche produc-
tion site is finished.
Stage 2 starts
Ovostar Union N.V. Annual Report 2015 | 23
MANAGEMENT REPORT
Governance Report
Financial Statements
Other Information
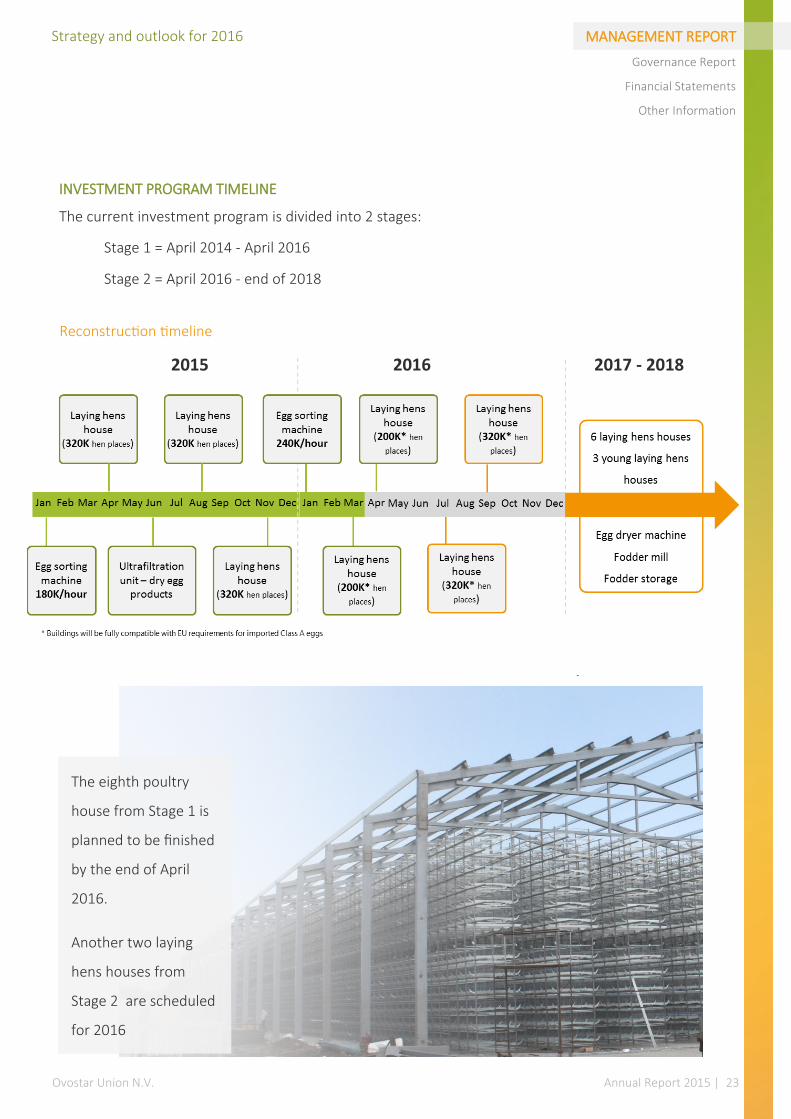
INVESTMENT PROGRAM TIMELINE
The current investment program is divided into 2 stages:
Stage 1 = April 2014 - April 2016
Stage 2 = April 2016 - end of 2018
Strategy and outlook for 2016
Reconstruction timeline
2015 2016 2017 - 2018
The eighth poultry
house from Stage 1 is
planned to be finished
by the end of April
2016.
Another two laying
hens houses from
Stage 2 are scheduled
for 2016
Ovostar Union N.V. Annual Report 2015 | 24
MANAGEMENT REPORT
Governance Report
Financial Statements
Other Information Human Resources
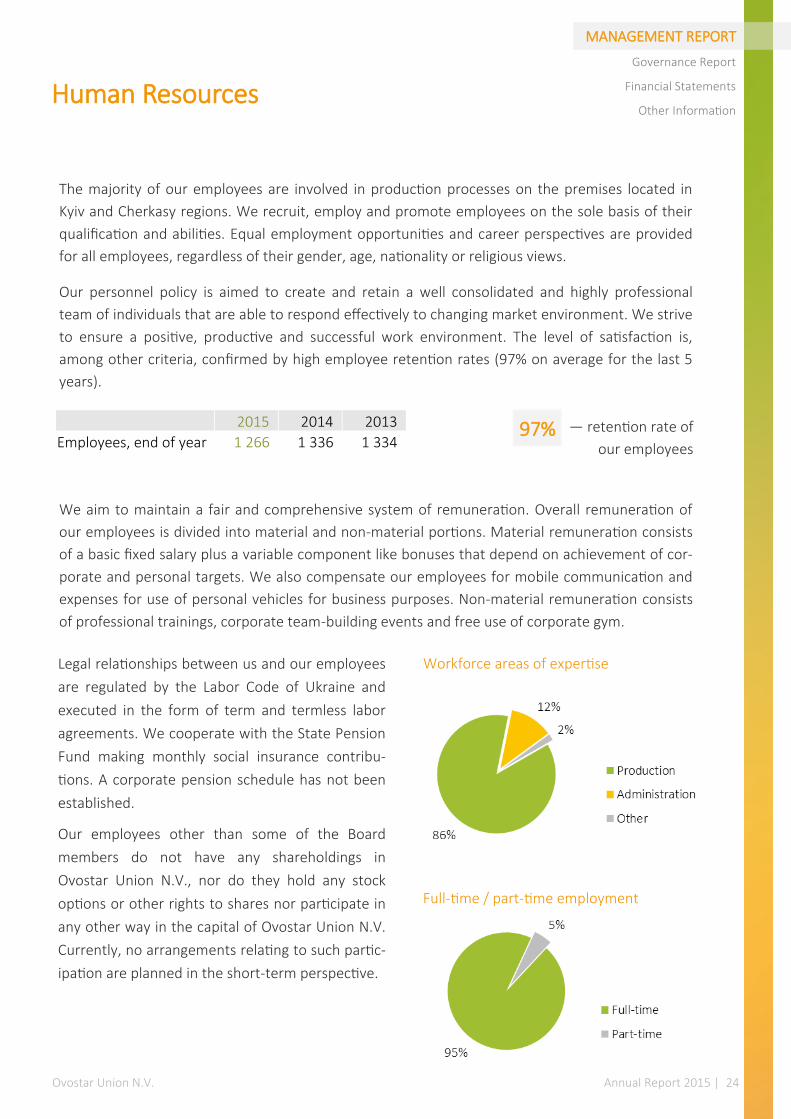
The majority of our employees are involved in production processes on the premises located in
Kyiv and Cherkasy regions. We recruit, employ and promote employees on the sole basis of their
qualification and abilities. Equal employment opportunities and career perspectives are provided
for all employees, regardless of their gender, age, nationality or religious views.
Our personnel policy is aimed to create and retain a well consolidated and highly professional
team of individuals that are able to respond effectively to changing market environment. We strive
to ensure a positive, productive and successful work environment. The level of satisfaction is,
among other criteria, confirmed by high employee retention rates (97% on average for the last 5
years).
We aim to maintain a fair and comprehensive system of remuneration. Overall remuneration of
our employees is divided into material and non-material portions. Material remuneration consists
of a basic fixed salary plus a variable component like bonuses that depend on achievement of cor-
porate and personal targets. We also compensate our employees for mobile communication and
expenses for use of personal vehicles for business purposes. Non-material remuneration consists
of professional trainings, corporate team-building events and free use of corporate gym.
Legal relationships between us and our employees
are regulated by the Labor Code of Ukraine and
executed in the form of term and termless labor
agreements. We cooperate with the State Pension
Fund making monthly social insurance contribu-
tions. A corporate pension schedule has not been
established.
Our employees other than some of the Board
members do not have any shareholdings in
Ovostar Union N.V., nor do they hold any stock
options or other rights to shares nor participate in
any other way in the capital of Ovostar Union N.V.
Currently, no arrangements relating to such partic-
ipation are planned in the short-term perspective.
2015 2014 2013
Employees, end of year 1 266 1 336 1 334 — retention rate of
our employees 97%
Workforce areas of expertise
Full-time / part-time employment
Ovostar Union N.V. Annual Report 2015 | 25
MANAGEMENT REPORT
Governance Report
Financial Statements
Other Information Risk management and internal control
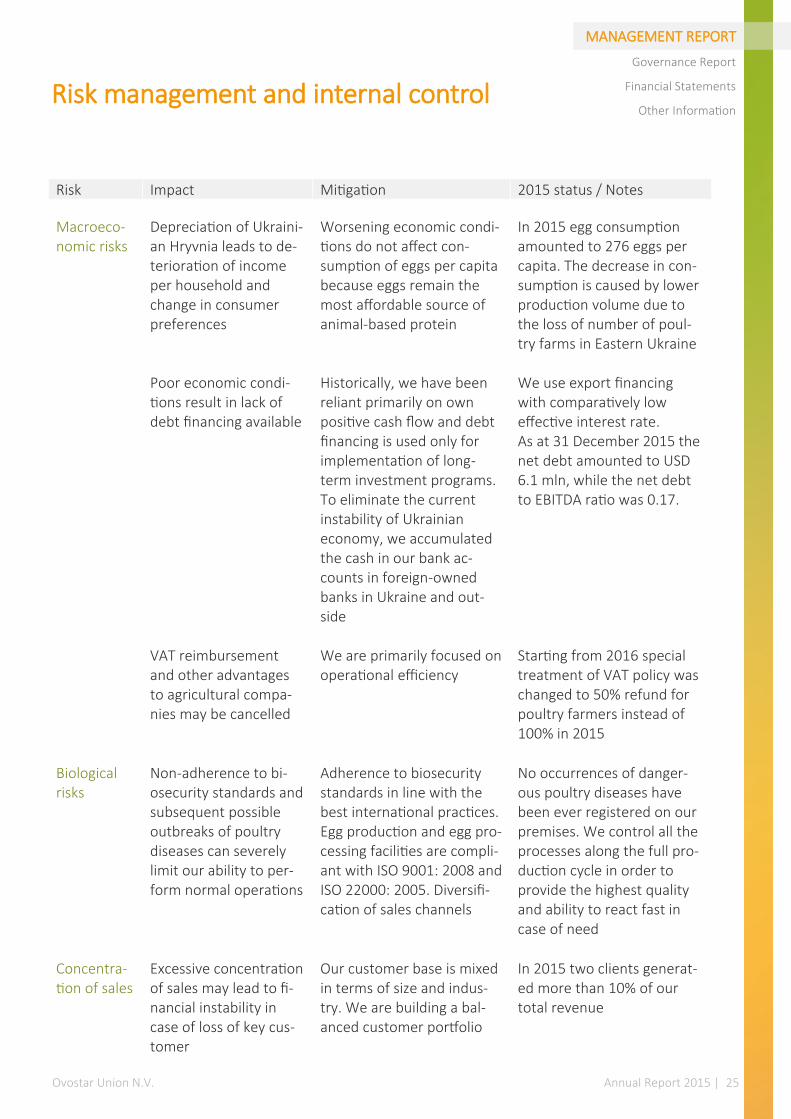
Risk Impact Mitigation 2015 status / Notes
Macroeco-nomic risks
Depreciation of Ukraini-an Hryvnia leads to de-terioration of income per household and change in consumer preferences Poor economic condi-tions result in lack of debt financing available VAT reimbursement and other advantages to agricultural compa-nies may be cancelled
Worsening economic condi-tions do not affect con-sumption of eggs per capita because eggs remain the most affordable source of animal-based protein Historically, we have been reliant primarily on own positive cash flow and debt financing is used only for implementation of long-term investment programs. To eliminate the current instability of Ukrainian economy, we accumulated the cash in our bank ac-counts in foreign-owned banks in Ukraine and out-side We are primarily focused on operational efficiency
In 2015 egg consumption amounted to 276 eggs per capita. The decrease in con-sumption is caused by lower production volume due to the loss of number of poul-try farms in Eastern Ukraine We use export financing with comparatively low effective interest rate. As at 31 December 2015 the net debt amounted to USD 6.1 mln, while the net debt to EBITDA ratio was 0.17. Starting from 2016 special treatment of VAT policy was changed to 50% refund for poultry farmers instead of 100% in 2015
Biological risks
Non-adherence to bi-osecurity standards and subsequent possible outbreaks of poultry diseases can severely limit our ability to per-form normal operations
Adherence to biosecurity standards in line with the best international practices. Egg production and egg pro-cessing facilities are compli-ant with ISO 9001: 2008 and ISO 22000: 2005. Diversifi-cation of sales channels
No occurrences of danger-ous poultry diseases have been ever registered on our premises. We control all the processes along the full pro-duction cycle in order to provide the highest quality and ability to react fast in case of need
Concentra-tion of sales
Excessive concentration of sales may lead to fi-nancial instability in case of loss of key cus-tomer
Our customer base is mixed in terms of size and indus-try. We are building a bal-anced customer portfolio
In 2015 two clients generat-ed more than 10% of our total revenue
Ovostar Union N.V. Annual Report 2015 | 26
MANAGEMENT REPORT
Governance Report
Financial Statements
Other Information
Risk and internal control
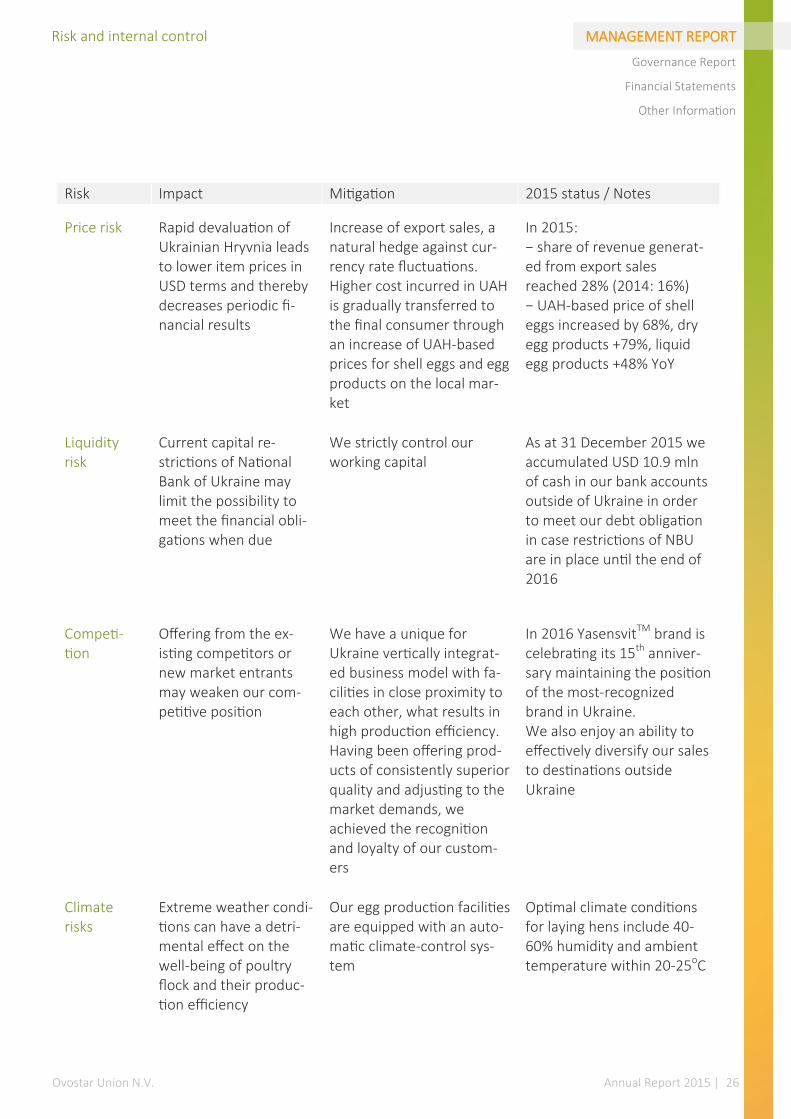
Risk Impact Mitigation 2015 status / Notes
Price risk Rapid devaluation of Ukrainian Hryvnia leads to lower item prices in USD terms and thereby decreases periodic fi-nancial results
Increase of export sales, a natural hedge against cur-rency rate fluctuations. Higher cost incurred in UAH is gradually transferred to the final consumer through an increase of UAH-based prices for shell eggs and egg products on the local mar-ket
In 2015: − share of revenue generat-ed from export sales reached 28% (2014: 16%) − UAH-based price of shell eggs increased by 68%, dry egg products +79%, liquid egg products +48% YoY
Liquidity risk
Current capital re-strictions of National Bank of Ukraine may limit the possibility to meet the financial obli-gations when due
We strictly control our working capital
As at 31 December 2015 we accumulated USD 10.9 mln of cash in our bank accounts outside of Ukraine in order to meet our debt obligation in case restrictions of NBU are in place until the end of 2016
Competi-tion
Offering from the ex-isting competitors or new market entrants may weaken our com-petitive position
We have a unique for Ukraine vertically integrat-ed business model with fa-cilities in close proximity to each other, what results in high production efficiency. Having been offering prod-ucts of consistently superior quality and adjusting to the market demands, we achieved the recognition and loyalty of our custom-ers
In 2016 YasensvitTM brand is celebrating its 15th anniver-sary maintaining the position of the most-recognized brand in Ukraine. We also enjoy an ability to effectively diversify our sales to destinations outside Ukraine
Climate risks
Extreme weather condi-tions can have a detri-mental effect on the well-being of poultry flock and their produc-tion efficiency
Our egg production facilities are equipped with an auto-matic climate-control sys-tem
Optimal climate conditions for laying hens include 40-60% humidity and ambient temperature within 20-25oC
Ovostar Union N.V. Annual Report 2015 | 27
MANAGEMENT REPORT
Governance Report
Financial Statements
Other Information
Risk and internal control
RISK MANAGEMENT
Risk management is an essential part of the decision-making process providing reasonable assur-
ance that risks are controlled to the furthest extent possible. Risk management and internal con-
trol systems are being regularly discussed with the executive management and the Audit Com-
mittee. In their review of our risk profile, the main focus is placed on principal risks that could sig-
nificantly deteriorate our operational and financial results.
It has to be noted that proper identification of risks significantly reduces but does not completely
eliminate the possibility of human error, poor judgment in decision making, fraud or occurrence of
unforeseeable events. The risks that we face in the course of regular operations are not limited to
the risks described above, but those above are regarded as the most significant in the short-term
perspective. Some risks are yet unknown and some risks that are insignificant at the moment could
become material in the future.
INTERNAL CONTROL SYSTEM
The Board of Directors is ultimately responsible for establishing, controlling and enhancing our in-
ternal control system. We consider risk management to be a continuous process of monitoring,
assessing and mitigating risks through internal control systems and procedures at each level within
the organization.
We use guidelines, instructions and procedures applied to operations, financial reporting, plan-
ning, human resource and customer management etc.; these are being reviewed and updated on
a regular basis. Our employees are trained to implement and comply with these guidelines, in-
structions and procedures.
Key elements of the internal control system are budgeting, investment management, operational
management and financial reporting. They monitor the progress and the actual results of the com-
pany’s operating activities. We also use a staff evaluation and appraisal system. The process of en-
hancement of the internal control sys-tem will be continued in 2016.
For more information on risks please refer to Note 27 of the 2015 Consolidated Financial State-
ments.
DEFICIENCIES OF THE SYSTEM
In 2015, we did not identify any material weaknesses of the internal control system that might ad-
versely impact our operational activity, financial results and financial position. The risks are clearly
identified and controlled to the highest possible extent by our top management within their rele-
vant function.

Ovostar Union N.V. Annual Report 2015 | 28
MANAGEMENT REPORT
Governance Report
Financial Statements
Other Information Shareholder and share information
SHARE CAPITAL STRUCTURE
According to publicly available information as at
31 December 2015, shareholders of Ovostar Un-
ion N.V. with substantial participation of at least
5% of all votes at the General Meeting of Ovostar
Union N.V. shareholders are listed in the table.
At 31 December 2015 total share capital of
Ovostar Union N.V. was 6 000 000 shares. Each
share has a nominal value of one vote at the Gen-
eral Meeting of Shareholders.
CHANGES IN SHAREHOLDERS’ STRUCTURE
On 2 December 2015 Prime One Capital Limited
decreased its share in Ovostar Union N.V. share
capital to 70.24% (4 214 617 shares) thereby in-
creasing the free float to 29.76%.
2015 2014 2013
Prime One Capital Ltd 70% 71% 71%
Generali 10% 10% 10%
Fairfax 5% - -
Aviva 5% 5% 5%
MetLife (Amplico) - 6% 6%
Others 10% 8% 8%
Total 100% 100% 100%
Share price, PLN 2015 2014 2013
Opening 72 100 98
Maximum 92 100 100
Minimum 67 59 98
Closing 91 72 100
Key quotation indicators of Ovostar Union N.V.
Share capital structure at 31 December
Market capitalization of Ovostar Union N.V. as
at 31 December, mPLN
Share price dynamics in 2015: OVO vs. WIG-index
Source: Warsaw Stock Exchange Source: Warsaw Stock Exchange
Source: Warsaw Stock Exchange

Ovostar Union N.V. Annual Report 2015 | 29

Ovostar Union N.V. Annual Report 2015 | 30
Management Report
GOVERNANCE REPORT
Financial Statements
Other Information The Board of Directors
COMPOSITION AND DUTIES OF THE BOARD
Our Board of Directors has a one-tier structure, consisting of executive and non-executive direc-
tors. The executive director is authorized to represent Ovostar Union Group in its everyday opera-
tions, while the non-executive directors monitor the activities, supervise and advise the executive
director. Currently, the Board consists of four members: one executive director Mr. Borys Bielikov
and three non-executive directors Mr. Vitalii Veresenko, Mr. Marc van Campen, and Mr. Sergii
Karpenko.
Duties of the non-executive directors include among other things supervision of the executive
management’s adherence to the established corporate strategy, proper compliance with best
practices of corporate governance and general operational issues. Performing their duties, the
non-executive directors have participated in the meetings of the Board of Directors in 2015. No
cases of non-compliance with rules and requirements that would have required the intervention
of the non-executive directors have been detected in 2015. The Terms of Reference, governing the
decision-making process of the Board, is available on our website: http://ovostar.ua/en/ipo/rules.
CHAIRMAN OF THE BOARD AND CORPORATE SECRETARY
The Chairman of the Board of Directors determines the agenda and heads the Board meetings and
is responsible for the proper functioning of the Board. This position is always selected among the
non-executive directors, and is appointed during the first meeting of the Board. Our Chairman of
the Board currently is Mr. Veresenko.
Chairman of the Board is assisted by the Group’s Corporate Secretary, whose duty is the ob-
servance of all necessary procedures for the Board of directors and compliance of their activities
with the requirements specified in the Group’s Articles of Association. The Corporate Secretary is
appointed and dismissed by the Board.
VOTING
Each member of the Board is entitled to one vote taking resolutions during the Board meeting. All
resolutions of the Board are taken by an absolute majority of votes. In the case of an absence of
absolute majority (when an even score is achieved during the voting), the Chairman of the Board
of Directors has a casting vote.
REPRESENTATION
Members of the Board represent Ovostar Union Group and the Board has the authority to appoint
any official as a representative, and to determine the list of his/her powers. The executive director
is authorized to represent the Group on his own and to sign documents on behalf of the Group.
Ovostar Union N.V. Annual Report 2015 | 31
Management Report
GOVERNANCE REPORT
Financial Statements
Other Information
The Board of Directors
In case of a conflict of interest between the Group and one of the directors, the conflicted director
may not participate in the decision-making process concerning the matter causing the conflict. In
case all members of the Board are in conflict with the interests of the Group, the decisions shall be
made by the General Meeting of Shareholders.
Members of the Board are appointed and may be suspended or dismissed from their position by
the General Meeting of Shareholders. Any suspension may be extended several times, but the to-
tal period of suspension from duties shall not exceed three months. The fact of suspension is void
if at the end of three months it has not been decided either to extend the suspension period, or to
dismiss the Director. Share ownership in the Group is not required to qualify as a member of the
Board.
SHAREHOLDING BY THE BOARD MEMBERS AND INSIDER TRADING
We have established the Securities Rules, followed by the Board members at the acquisition of se-
curities share and transactions with them. Regarding the acquisition of shares and equity participa-
tion, the Board members and other persons related to us follow the conditions and requirements
of the EU Market Abuse Directive and our Insider Trading Rules, which reflect the essence of this
directive. Securities Rules and Insider Trading Rules are available on our website:
http://ovostar.ua/en/ipo/rules.
STATEMENT OF THE BOARD OF DIRECTORS
The Board of Directors of Ovostar Union N.V. hereby confirms that (1) neither of the Board mem-
bers is a member of the Supervisory Board of - or holds the position of non-executive director at
more than two listed companies; (2) neither of the Board members holds the position of the Chair-
man of the Supervisory Board - or of the board of directors, in case such board consists of execu-
tive and non-executive directors - of other companies, except for our enterprises.
CHANGE IN THE BOARD STRUCTURE
During the Annual General Meeting of Shareholders, held in June 2015, the following resolutions
with respect to (the composition of) the Board have been adopted:
Mr. Oleksandr Bakumenko was officially dismissed from his position of non-executive mem-
ber of the Board;
Mr. Sergii Karpenko was officially appointed as a new non-executive member of the Board;
Mr. Borys Bielikov was re-appointed for the position of executive member of the Board; and
Mr. Vitalii Veresenko and Mr. Marc van Campen were re-appointed for the position of non-
executive member of the Board.
Ovostar Union N.V. Annual Report 2015 | 32
Management Report
GOVERNANCE REPORT
Financial Statements
Other Information The Board of Directors
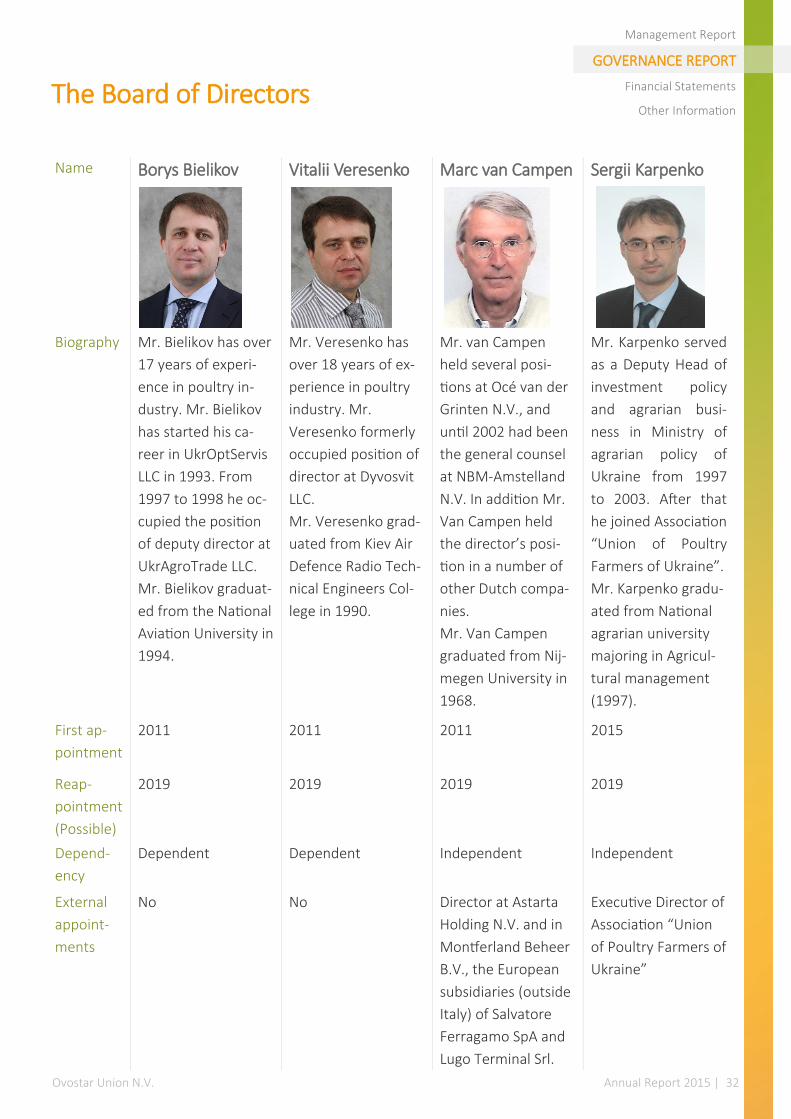
Name Borys Bielikov
Vitalii Veresenko Marc van Campen Sergii Karpenko
Biography Mr. Bielikov has over
17 years of experi-
ence in poultry in-
dustry. Mr. Bielikov
has started his ca-
reer in UkrOptServis
LLC in 1993. From
1997 to 1998 he oc-
cupied the position
of deputy director at
UkrAgroTrade LLC.
Mr. Bielikov graduat-
ed from the National
Aviation University in
1994.
Mr. Veresenko has
over 18 years of ex-
perience in poultry
industry. Mr.
Veresenko formerly
occupied position of
director at Dyvosvit
LLC.
Mr. Veresenko grad-
uated from Kiev Air
Defence Radio Tech-
nical Engineers Col-
lege in 1990.
Mr. van Campen
held several posi-
tions at Océ van der
Grinten N.V., and
until 2002 had been
the general counsel
at NBM-Amstelland
N.V. In addition Mr.
Van Campen held
the director’s posi-
tion in a number of
other Dutch compa-
nies.
Mr. Van Campen
graduated from Nij-
megen University in
1968.
Mr. Karpenko served
as a Deputy Head of
investment policy
and agrarian busi-
ness in Ministry of
agrarian policy of
Ukraine from 1997
to 2003. After that
he joined Association
“Union of Poultry
Farmers of Ukraine”.
Mr. Karpenko gradu-
ated from National
agrarian university
majoring in Agricul-
tural management
(1997).
First ap-
pointment
2011 2011 2011 2015
Reap-
pointment
(Possible)
2019 2019 2019 2019
Depend-
ency
Dependent Dependent Independent Independent
External
appoint-
ments
No No Director at Astarta
Holding N.V. and in
Montferland Beheer
B.V., the European
subsidiaries (outside
Italy) of Salvatore
Ferragamo SpA and
Lugo Terminal Srl.
Executive Director of
Association “Union
of Poultry Farmers of
Ukraine”

Ovostar Union N.V. Annual Report 2015 | 33
Management Report
GOVERNANCE REPORT
Financial Statements
Other Information
AUDIT COMMITTEE
The Board of Directors has established an Audit Committee in order to meet the necessary corpo-
rate governance requirements and to ensure our financial transparency.
The Audit Committee is responsible for advising and monitoring the activities of the Board of Di-
rectors in the areas of, among other things, the completeness of financial reporting, our financial
strategy, tax planning, including:
(i) functioning of control and internal risk management systems;
(ii) provision of financial information (including choice of the accounting policy, application of
new rules and evaluation of their impact on our performance, interaction with internal and
external auditors, etc.);
(iii) monitoring the compliance of our activities with the recommendations of internal and
external auditors;
(iv) interaction with external auditors, including control of the auditor’s independence, their
remuneration and provision of any services outside the audit scope;
(v) our tax planning policy;
(vi) sources of our funding;
(vii) review of the annual budget and capital investments of the Group.
At least one of the committee members must be a financial expert as defined in the Dutch Corpo-
rate Governance Code, and all committee members must be financially literate. Our Audit Com-
mittee satisfies these requirements.
The document describing Terms of Reference Governing the Audit Committee is available on our
website http://ovostar.ua/en/ipo/rules.
Mr. van Campen is the Chairman of the Committee and Mr. Karpenko is the second independent
member of the Audit Committee since June 2015.
Committees of the Board of Directors
Ovostar Union N.V. Annual Report 2015 | 34
Management Report
GOVERNANCE REPORT
Financial Statements
Other Information Meetings with Stakeholders
MEETINGS OF SHAREHOLDERS (THE “GENERAL MEETING”)
We, as a Dutch legal entity, must hold at least one annual General Meeting, to be held in the Neth-
erlands and not later than six (6) months after the end of the financial year. The annual General
Meeting is, among other things, entitled to discuss the annual report of the Board with respect to
the general state of affairs in the company, approve the financial statements for the previous fi-
nancial year, vote whether to grant discharge to members of the company’s corporate bodies,
and/or appoint members to fill any vacancies on any of the corporate bodies.
Notices of shareholders’ meetings must be published on the company’s website and via any other
electronic communication method in accordance with applicable regulations in Poland, at least
forty two (42) days before the day of the meeting.
The Board of Directors determines the items on the agenda for the General Meeting. Further-
more, the agenda shall contain such items as requested in writing by one or more persons entitled
to attend the general meeting, representing solely or jointly at least 1% of the issued capital or
holding shares of the company which according to the official price list of the regulated market
represent a value of at least EUR 50,000,000 at least sixty days before the date of the meeting. The
meeting shall not adopt resolutions on matters other than those that have been placed on the
agenda.
An extraordinary General Meeting may be convened as often as the Board of Directors or share-
holders together representing at least 10% of the issued capital deem necessary. Under Dutch law,
valid shareholders’ resolutions can be taken in a meeting outside the Netherlands, provided that
the entire issued share capital is represented at such meeting.
Voting at the General Meeting
Shareholders may participate in the General Meeting and exercise their voting right personally or
by written proxy. Each share in the capital of the company confers the right to cast one vote, sub-
ject to the relevant provisions of the Articles of Association. Every holder of shares and every other
party entitled to attend the General Meeting who derives his/her rights from such shares, is only
entitled to attend the General Meeting in person, or represented by a person holding a written
proxy, to address the General Meeting and, in as far as he/she has voting rights, to vote at the
meeting, if he/she has lodged documentary evidence of his/her voting rights. The requirement of a
written proxy is also met if the proxy is recorded electronically. For this purpose, Dutch law pre-
scribes a mandatory record date to establish which shareholders are entitled to attend and vote at
the General Meeting.
Ovostar Union N.V. Annual Report 2015 | 35
Management Report
GOVERNANCE REPORT
Financial Statements
Other Information
Such record date is fixed at the twenty eighth (28th) day before said General Meeting. The voting
rights and the right to attend the General Meeting shall accrue to those holding such entitlements
and are registered as such in a register designated for that purpose by the Board of Di-rectors on
this record date. The convocation to the General Meeting shall state the record date, the place
where and the manner in which registration shall take place.
The Chairman of the General Meeting shall further decide whether persons other than those who
are entitled to admittance pursuant to the aforementioned shall be admitted to the Meeting. The
Members of the Board of Directors shall have the right to attend the General Meeting. In these
Meetings they shall have an advisory vote. Unless provided otherwise in the Articles of Association
or the law, all resolutions are adopted by absolute majority of votes. The company must record
the voting results for each resolution adopted at a shareholders’ meeting. These results must be
posted on the company’s website not later than on the fifteenth (15th) day following the day of
the shareholders’ meeting and should be available on the website for at least one year.
We conducted one General Meeting of shareholders on 15 June 2015 in Amsterdam, the Nether-
lands. During the meeting the 2014 annual accounts have been adopted, the changes in the Board
were resolved (as set out earlier under “Change in the Board structure”), the Board has been au-
thorized to appoint the external auditor for the 2015 annual accounts, and a number of other
standard items have been discussed and approved.
Amendment of the Articles of Association
The General Meeting can resolve to amend the Articles of Association upon the proposal of the
Board of Directors. Such resolution is to be taken by an absolute majority of votes cast. If a pro-
posal to amend the Articles of Association is to be submitted to the General Meeting, the conven-
ing notice must state this fact. At the same time, if the proposal is for an amendment to the Arti-
cles of Association, a copy of the motion containing a verbatim text of the proposed amendment
must be deposited at the company’s office for inspection by the shareholders and depositary re-
ceipt holders until the meeting is adjourned.
Issuance of Shares
The company may only issue shares pursuant to a resolution of the General Meeting or of another
corporate body designated to do so by a resolution of the General Meeting for a fixed period not
exceeding five (5) years. Such designation must specify the maximum number of shares that may
be issued pursuant to the designation. The designation may each time be extended for a further
period of up to five (5) years. The designation may not be revoked, unless the designation provides
otherwise.
On 15 June 2015, by a resolution of the General Meeting the Board was designated to issue shares
and to limit or exclude any pre-emptive rights in connection with such share issue for a period of 5
(five) years.
Meetings with Stakeholders
Ovostar Union N.V. Annual Report 2015 | 36
Management Report
GOVERNANCE REPORT
Financial Statements
Other Information
Pre-emptive Rights
Each shareholder has a pre-emptive right in respect of all share issuances or grants of the right to
acquire shares, in proportion to the number of shares held by such holder. Shareholders, however,
have no pre-emptive right in respect of the issuance of shares, or the grant of the right to acquire
shares, which are issued or granted for a consideration other than cash, to employees of the com-
pany or of a group company of the company, or in respect of the issuance of shares to any person
who exercises a previously existing right to subscribe for shares. Pre-emptive rights may be re-
stricted or excluded by a resolution of the General Meeting. Pre-emptive rights may also be ex-
cluded or restricted by the corporate body to which the power to exclude or restrict pre-emptive
rights has been granted by a resolution of the General Meeting for a fixed period not exceeding
five (5) years.
Meetings with Stakeholders
BOARD OF DIRECTORS MEETINGS
In 2015 the Board of Directors held four meetings.
10 April 2015
The first meeting was convened on in Amsterdam,
the Netherlands. During the meeting the Board of
Directors approved the 2014 annual report of
Ovostar Union N.V.
14 May 2015
The second meeting was held in Kyiv, Ukraine. Dur-
ing the meeting the Board has approved the finan-
cial statements of Ovostar Union N.V. for the first
quarter of 2015.
27 August 2015
The third meeting was held in Kyiv, Ukraine. During
the meeting the Board approved the 2015 semi-
annual report of Ovostar Union N.V. and appointed
the external auditor for financial year 2015.
11 November 2015
The fourth meeting was held in Amsterdam, the
Netherlands. The Board of Directors has approved
the financial statements of Ovostar Union N.V. for
the nine months of 2015 and discussed the outlook
for the year 2015.
AUDIT COMMITTEE MEETINGS
In 2015 the Audit Committee held three
meetings.
06 April 2015
During the meeting Committee together
with Baker Tilly Berk, the auditor for the
year 2014, discussed the Group’s results
for 2014.
21 July 2015
Agenda of this meeting included discus-
sion on 2015 audit process and the Au-
dit committee proposed to approve
Baker Tilly Berk as the auditor for the
year 2015. Additionally, the operational
management updated the Audit com-
mittee on Ovostar Union’s plans for de-
velopment in the following 2-3 years
and outlook for the second half of the
year.
11 November 2015
During the meeting Committee dis-
cussed potential risks for the business
and their possible impact on the Group’s
operations and results in the year 2015.
Ovostar Union N.V. Annual Report 2015 | 37
Management Report
GOVERNANCE REPORT
Financial Statements
Other Information Corporate governance and control
Being a Dutch holding company listed on the Warsaw Stock Exchange, we have to comply both
with the applicable best practice provisions of the Dutch Corporate Governance Code (the “Code”)
and the requirements of the Code of Best Practice for WSE Listed Companies (the “Rules” and to-
gether referred to as the “Codes”).
DUTCH CORPORATE GOVERNANCE CODE
The Code includes the principles and describes the best practices for boards of directors, supervi-
sory boards and general meetings of share-holders, financial statements, auditors, standards com-
pliance and procedures of information disclosure. Dutch companies listed on the stock markets
are obligated, under Dutch law, to publish an annual report, regardless of whether they comply
with the Code fully, partially, or do not comply at all. If a company does not comply with the condi-
tions of the Code or does not meet the requirements and conditions described in the Code, it shall
specify the reasons for non-use and/or inconsistencies in the annual report. Please refer to section
“Deviations from the Dutch Corporate Governance Code” below for more information on the
Group’s compliance with the Code.
WSE CORPORATE GOVERNANCE RULES
Companies listed on the Warsaw Stock Exchange are guided by the Code of Best Practice for WSE
Listed Companies. To date, we meet all requirements of the Best Practice principles.
DEVIATIONS FROM THE DUTCH CORPORATE GOVERNANCE CODE
The Codes are similar in their requirements and we meet most of the applicable principles and re-
quirements of both. In case of non-compliance to certain requirements of the Codes, we under-
take to publish the non-compliance items stating the reasons for existing discrepancies.
Currently, we do not comply with the following requirements of the Code:
Best Practice Provision III
Since we have a one-tier governance structure the functions attributed to supervisory board mem-
bers in a two-tier governance structure are distributed among the non-executive directors of the
Group.
Best Practice Provision III.5
Since we have a one-tier governance structure and only two non-executive directors, we are not
obliged to have separate committees for audit, remuneration and appointment. Currently, we
have established the Audit Committee. The remuneration committee and appointment committee
have not been installed.
Ovostar Union N.V. Annual Report 2015 | 38
Management Report
GOVERNANCE REPORT
Financial Statements
Other Information
Best Practice Provision III.8.4
Under this requirement, most of the Board of Directors members shall be independent non-
executive directors. We partially comply with this requirement meaning that three out of four of
our directors are non-executive, but only two are independent. Mr. van Campen and Mr. Karpenko
are independent non-executive directors, while Mr. Veresenko is not an independent non-
executive director. The Board of Directors has decided not to overcome this non-compliance by
increasing of the number of Board members, as it may directly affect the efficiency and speed of
decision making by the Board.
Best Practice Provision IV.3.11
Currently we have no written survey of existing and potential anti-takeover measures in place, as
referred to in Best Practice Provision IV.3.11.
DEVIATIONS FROM THE WSE CORPORATE GOVERNANCE RULES
To date, we meet all requirements of the WSE Corporate Governance Rules.
CONFIRMATIONS REQUIRED BY THE CODES
The Board of Directors confirms that during 2015 no conflicts of interest between the Directors
and the Group occurred. In case of a conflict of interest, the Board would have acted in accord-
ance with the Best Practice Provisions II.3.2, II.3.3 and III.6.1 to III.6.3 of the Dutch Corporate Gov-
ernance Code.
The Board of Directors confirms that during 2015 no conflicts of interest between the Group and
the shareholders owning more than 10% equity share in the Group occurred. In case of such a situ-
ation, the Board would have acted in accordance with the Best Practice Provision III.6.4 of the
Dutch Corporate Governance Code.
OTHER ITEMS OF NON-COMPLIANCE
The Board of Directors hereby confirms that currently its composition is not balanced within the
meaning of the Simplification and Flexibilisation Act for the Dutch companies—the Flex BV Act. At
the date of publication of this report the Board (4 persons) consisted of 100% male members. At
the same time, 2 out of 5 key management personnel (excluding the Board members) are female.
The people are selected according to their qualifications, therefore, such composition is healthy
for the Group.
Corporate governance and control

Ovostar Union N.V. Annual Report 2015 | 39
Ovostar Union N.V. Annual Report 2015 | 40
Management Report
Governance Report
FINANCIAL STATEMENTS
Other Information Statement of Directors’ responsibilities
STATEMENT OF THE BOARD OF DIRECTORS ON COMPLIANCE OF THE ANNUAL FINANCIAL
STATEMENTS
With this statement the Board of Directors of Ovostar Union N.V. confirms that, as far as their
knowledge, the financial statements of the Group and its subsidiaries for the year ended 31 De-
cember 2015 have been prepared in accordance with all applicable accounting standards, and they
truly and fairly reflect the data on the assets, liabilities, financial position and results of the Group
and its subsidiaries, and the report of the Board of Directors for the year ended 31 December 2015
truly and fairly reflects the position of the Group and its subsidiaries as of 31 December 2015 and
includes a description of the key events and results and the key risks faced by the Group and its
subsidiaries during the year 2015.
STATEMENT OF THE BOARD OF DIRECTORS ON THE APPOINTMENT OF AN INDEPENDENT
AUDITOR TO CONDUCT AUDIT OF THE CONSOLIDATED ANNUAL FINANCIAL STATEMENTS
With this statement the Board of Directors of Ovostar Union N.V. confirms that Baker Tilly Berk
N.V., acting as the independent auditor of the Group’s consolidated financial statements for the
year ended 31 December 2015, was appointed in accordance with the legal requirements and that
the auditing company and the person conducting the audit meet all the legal requirements for is-
suing an objective and independent auditor’s opinion.
STATEMENT OF THE BOARD OF DIRECTORS ON THE INTERNAL CONTROL SYSTEM
The Board of Directors assessed the effectiveness of the internal control system at the end of
2015. During the investigation on which the assessment was based, no shortcomings were identi-
fied that might possibly have a material impact on the operational results or financial reporting of
the Group. Based on the assessment results the Board members have come to a decision that the
internal control system of the Group provides a reasonable degree of certainty that it is functioning
well. It should be noted, however, that the system of internal control cannot provide a full certain-
ty as regards the prevention of material inaccuracies in the financial reporting and the prevention
of losses and fraud. 08 April 2016
Amsterdam, the Netherlands
[signed]
Borys Bielikov
Chief Executive Officer, Executive Director
[signed]
Marc Van Campen
Head of Audit Committee, Non-executive Director
[signed]
Vitalii Veresenko
Chairman of the Board, Non-executive Director
[signed]
Sergii Karpenko
Non-executive Director

Ovostar Union N.V. Annual Report 2015 | 41
Ovostar Union N.V. Annual Report 2015 | 42
Management Report
Governance Report
FINANCIAL STATEMENTS
Other Information
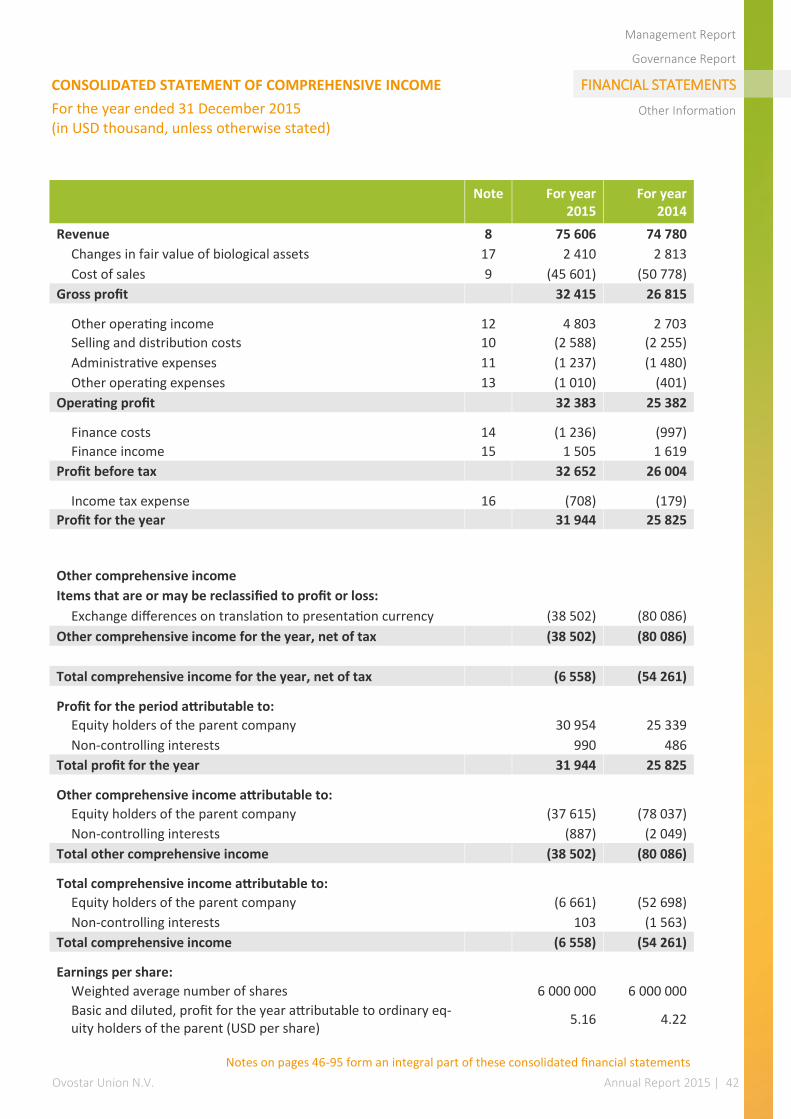
CONSOLIDATED STATEMENT OF COMPREHENSIVE INCOME
For the year ended 31 December 2015 (in USD thousand, unless otherwise stated)
Note For year
2015 For year
2014
Revenue 8 75 606 74 780
Changes in fair value of biological assets 17 2 410 2 813
Cost of sales 9 (45 601) (50 778)
Gross profit 32 415 26 815
Other operating income 12 4 803 2 703
Selling and distribution costs 10 (2 588) (2 255)
Administrative expenses 11 (1 237) (1 480)
Other operating expenses 13 (1 010) (401)
Operating profit 32 383 25 382
Finance costs 14 (1 236) (997)
Finance income 15 1 505 1 619
Profit before tax 32 652 26 004
Income tax expense 16 (708) (179)
Profit for the year 31 944 25 825
Other comprehensive income
Items that are or may be reclassified to profit or loss:
Exchange differences on translation to presentation currency (38 502) (80 086)
Other comprehensive income for the year, net of tax (38 502) (80 086)
Total comprehensive income for the year, net of tax (6 558) (54 261)
Profit for the period attributable to:
Equity holders of the parent company 30 954 25 339
Non-controlling interests 990 486
Total profit for the year 31 944 25 825
Other comprehensive income attributable to:
Equity holders of the parent company (37 615) (78 037)
Non-controlling interests (887) (2 049)
Total other comprehensive income (38 502) (80 086)
Total comprehensive income attributable to:
Equity holders of the parent company (6 661) (52 698)
Non-controlling interests 103 (1 563)
Total comprehensive income (6 558) (54 261)
Earnings per share:
Weighted average number of shares 6 000 000 6 000 000
Basic and diluted, profit for the year attributable to ordinary eq-uity holders of the parent (USD per share)
5.16 4.22
Notes on pages 46-95 form an integral part of these consolidated financial statements

Ovostar Union N.V. Annual Report 2015 | 43
Management Report
Governance Report
FINANCIAL STATEMENTS
Other Information
CONSOLIDATED STATEMENT OF FINANCIAL POSITION
As at 31 December 2015 (in USD thousand, unless otherwise stated)
Note 31 Decem-
ber 2015 31 Decem-
ber 2014
Assets Non-current assets
Biological assets 17 26 041 27 356 Property, plant and equipment and intangible assets 18 33 370 40 507 Deferred tax assets 16 145 314
Total non-current assets 59 556 68 177
Current assets Inventories 20 10 990 8 409 Biological assets 17 8 409 9 822 Trade and other receivables 21 10 355 11 892 Prepayments to suppliers 420 849 Prepayments for income tax 26 - Cash and cash equivalents 22 10 962 2 471
Total current assets 41 162 33 443
Total assets 100 718 101 620
Equity and liabilities Equity
Issued capital 23 65 73 Share premium 30 933 30 933 Foreign currency translation reserve (115 664) (78 057) Retained earnings 129 783 104 444 Result for the year 30 954 25 339
Equity attributable to equity holders of the parent 76 071 82 732 Non-controlling interests 7 2 436 2 333
Total equity 78 507 85 065
Non-current liabilities Interest-bearing loans and other financial liabilities 19 13 398 7 203 Deferred tax liability 16 850 410
Total non-current liabilities 14 248 7 613
Current liabilities Trade and other payables 24 4 184 6 356 Advances received 145 278 Interest-bearing loans and other financial liabilities 19 3 634 2 308
Total current liabilities 7 963 8 942
Total liabilities 22 211 16 555
Total equity and liabilities 100 718 101 620
Notes on pages 46-95 form an integral part of these consolidated financial statements
Ovostar Union N.V. Annual Report 2015 | 44
Management Report
Governance Report
FINANCIAL STATEMENTS
Other Information
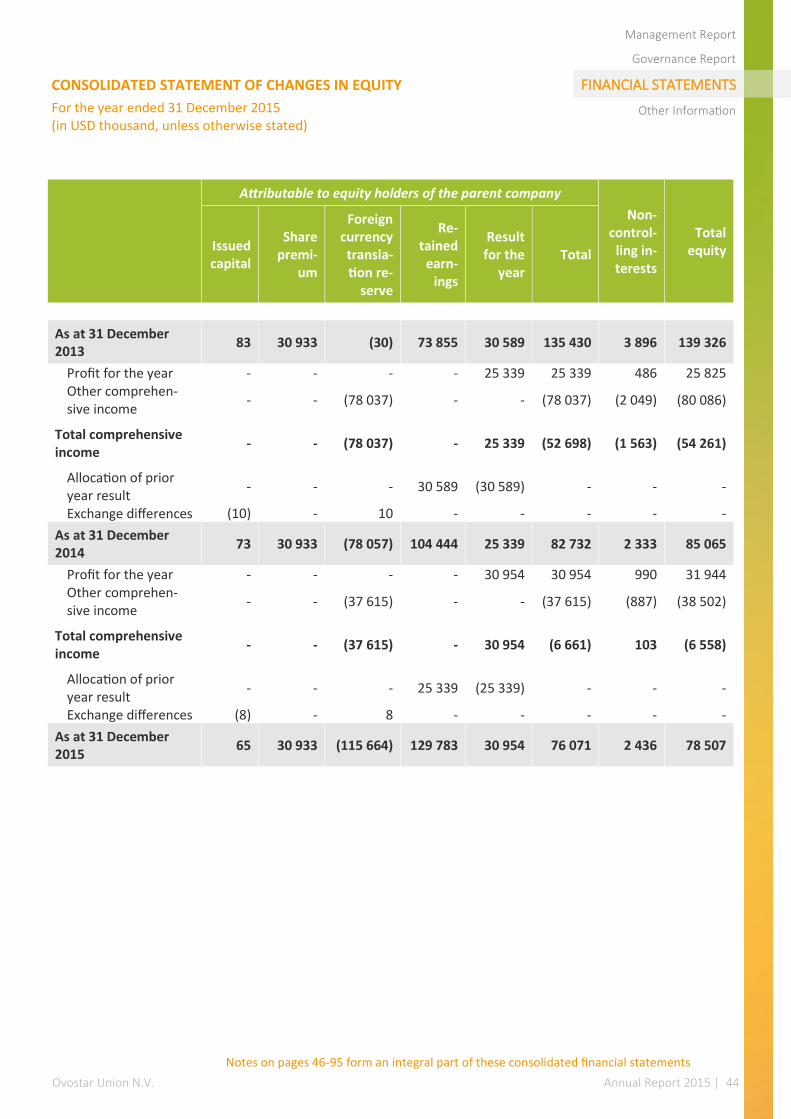
CONSOLIDATED STATEMENT OF CHANGES IN EQUITY
For the year ended 31 December 2015 (in USD thousand, unless otherwise stated)
Attributable to equity holders of the parent company
Non-control-
ling in-terests
Total equity Issued
capital
Share premi-
um
Foreign currency transla-tion re-
serve
Re-tained
earn-ings
Result for the
year Total
As at 31 December 2013
83 30 933 (30) 73 855 30 589 135 430 3 896 139 326
Profit for the year - - - - 25 339 25 339 486 25 825 Other comprehen-sive income
- - (78 037) - - (78 037) (2 049) (80 086)
Total comprehensive income
- - (78 037) - 25 339 (52 698) (1 563) (54 261)
Allocation of prior year result
- - - 30 589 (30 589) - - -
Exchange differences (10) - 10 - - - - -
As at 31 December 2014
73 30 933 (78 057) 104 444 25 339 82 732 2 333 85 065
Profit for the year - - - - 30 954 30 954 990 31 944 Other comprehen-sive income
- - (37 615) - - (37 615) (887) (38 502)
Total comprehensive income
- - (37 615) - 30 954 (6 661) 103 (6 558)
Allocation of prior year result
- - - 25 339 (25 339) - - -
Exchange differences (8) - 8 - - - - -
As at 31 December 2015
65 30 933 (115 664) 129 783 30 954 76 071 2 436 78 507
Notes on pages 46-95 form an integral part of these consolidated financial statements
Ovostar Union N.V. Annual Report 2015 | 45
Management Report
Governance Report
FINANCIAL STATEMENTS
Other Information
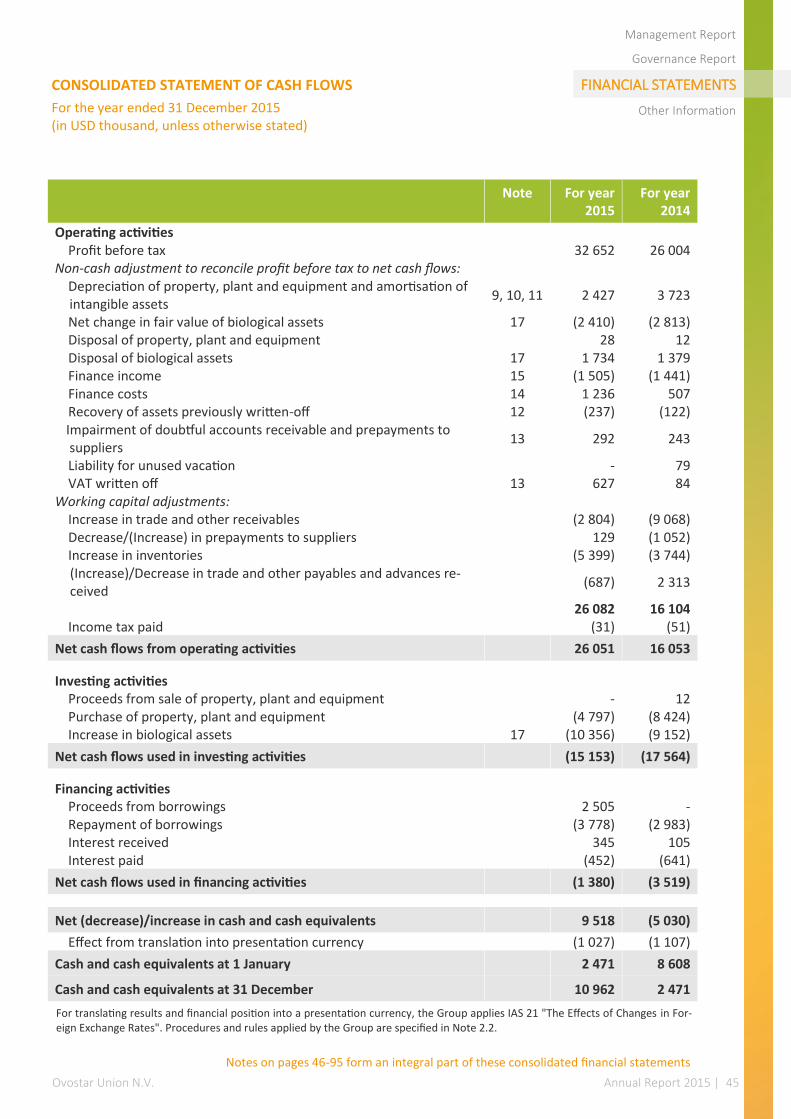
CONSOLIDATED STATEMENT OF CASH FLOWS
For the year ended 31 December 2015 (in USD thousand, unless otherwise stated)
Note For year
2015 For year
2014
Operating activities Profit before tax 32 652 26 004
Non-cash adjustment to reconcile profit before tax to net cash flows: Depreciation of property, plant and equipment and amortisation of intangible assets
9, 10, 11 2 427 3 723
Net change in fair value of biological assets 17 (2 410) (2 813) Disposal of property, plant and equipment 28 12 Disposal of biological assets 17 1 734 1 379 Finance income 15 (1 505) (1 441) Finance costs 14 1 236 507 Recovery of assets previously written-off 12 (237) (122) Impairment of doubtful accounts receivable and prepayments to suppliers
13 292 243
Liability for unused vacation - 79 VAT written off 13 627 84
Working capital adjustments: Increase in trade and other receivables (2 804) (9 068) Decrease/(Increase) in prepayments to suppliers 129 (1 052) Increase in inventories (5 399) (3 744) (Increase)/Decrease in trade and other payables and advances re-ceived
(687) 2 313
26 082 16 104 Income tax paid (31) (51)
Net cash flows from operating activities 26 051 16 053
Investing activities Proceeds from sale of property, plant and equipment - 12 Purchase of property, plant and equipment (4 797) (8 424) Increase in biological assets 17 (10 356) (9 152)
Net cash flows used in investing activities (15 153) (17 564)
Financing activities Proceeds from borrowings 2 505 - Repayment of borrowings (3 778) (2 983) Interest received 345 105 Interest paid (452) (641)
Net cash flows used in financing activities (1 380) (3 519)
Net (decrease)/increase in cash and cash equivalents 9 518 (5 030)
Effect from translation into presentation currency (1 027) (1 107)
Cash and cash equivalents at 1 January 2 471 8 608
Cash and cash equivalents at 31 December 10 962 2 471
For translating results and financial position into a presentation currency, the Group applies IAS 21 "The Effects of Changes in For-eign Exchange Rates". Procedures and rules applied by the Group are specified in Note 2.2.
Notes on pages 46-95 form an integral part of these consolidated financial statements
Ovostar Union N.V. Annual Report 2015 | 46
Management Report
Governance Report
FINANCIAL STATEMENTS
Other Information
NOTES TO CONSOLIDATED FINANCIAL STATEMENTS
(in USD thousand, unless otherwise stated)
1. Corporate information
Ovostar Union N.V. (referred to herein as the “Company”), a limited liability company registered
under the laws of the Netherlands, was incorporated on 22 March 2011 in Amsterdam. Ovostar
Union N.V. was formed to serve as the ultimate holding company of LLC “Ovostar Union” and its
subsidiaries. Hereinafter, LLC “Ovostar Union” and its subsidiaries are referred to as the “Ovostar
Union Group” or the “Group”. The registered office and principal place of business of the Compa-
ny is Jan van Goyenkade 8, 1075 HP Amsterdam.
Principal activities of the Group include egg production, distribution, egg products manufacturing
and production of sunflower oil. The largest shareholder is Prime One Capital Ltd., Cyprus. Its
principal activity is the holding of ownership interests in its subsidiary and strategic management.
The Group operates through a number of subsidiaries in Ukraine (the list of the subsidiaries is dis-
closed in Note 7) and has a concentration of its business in Ukraine, where its production facilities
are located. All subsidiary companies are registered under the laws of Ukraine. The registered
office and principal place of business of the subsidiary companies in Ukraine is 34 Petropavlivska
Street, Kyiv, Ukraine.
Information on other related party relationships of the Group is provided in Note 25.
Total number of employees of all companies of the Group constituted 1 266 employees as at 31
December 2015 and 1 336 employees as at 31 December 2014.
The company is listed on Warsaw Stock Exchange.
The Group is controlled by the Beneficial Owners – Mr. Borys Bielikov and Mr. Vitalii Veresenko
(hereinafter, the “Beneficial Owners”)
The consolidated financial statements for the year ended 31 December 2015 were authorized by
the Board of Directors on 08 April 2016.
2. Basis of preparation
2.1. Statement of compliance and basis of measurement
The consolidated financial statements are prepared in accordance with International Financial
Reporting Standards as adopted by the European Union (“IFRS EU” hereinafter).
The companies of the Group maintain their accounting records under Ukrainian Accounting
Standards (“UAS” hereinafter). UAS principles and procedures may differ from those generally
accepted under IFRS EU. Accordingly, the consolidated financial statements, which have been pre-
pared from the Group entities’ UAS records, reflect adjustments necessary for such financial
statements to be presented in accordance with IFRS EU.
Notes on pages 46-95 form an integral part of these consolidated financial statements
Ovostar Union N.V. Annual Report 2015 | 47
Management Report
Governance Report
FINANCIAL STATEMENTS
Other Information
NOTES TO CONSOLIDATED FINANCIAL STATEMENTS
(in USD thousand, unless otherwise stated)
The consolidated financial statements have been prepared on the historical cost basis except for
the following items, which are measured on an alternative basis on each reporting date.
Details of the Group accounting policies are included in Note 5.
2.2. Going concern basis
The financial statements are prepared on a going concern basis, under which assets are sold and
liabilities are repaid in the ordinary course of business. The accompanying consolidated financial
statements do not include adjustments that would need to be made in case if the Group was una-
ble to continue as a going concern.
2.3. Functional and presentation currency
The functional currency of the Company is U.S. dollar (USD). The consolidated financial state-
ments are presented in the company’s functional currency, that is, U.S. dollar (USD). The oper-
ating subsidiary have Ukrainian hryvnia (UAH) as their functional currency. All values are rounded
to the nearest thousands, except when otherwise is indicated.
The USD has been selected as the presentation currency for the Group as: (a) management of the
Group manages business risks and exposures, and measures the performance of its businesses in
the USD; (b) the USD is widely used as a presentation currency of companies engaged primarily in
agricultural; and (c) the USD is the most convenient presentation currency for non-Ukrainian us-
ers of these IFRS consolidated financial statements.
The Group translates its results and financial position into the presentation currency as the fol-
lows:
assets and liabilities for each statement of financial position presented (ie including compara-
tives) shall be translated at the closing rate at the date of that statement of financial position;
income and expenses for each statement of comprehensive income or separate income state-
ment presented (ie including comparatives) shall be translated at exchange rates at the dates
of the transactions; and
all resulting exchange differences shall be recognised in other comprehensive income.
During 2015 and 2014, the exchange rate had significant fluctuations. Consistent with IAS 21, if
exchange rates fluctuate significantly, the use of the average rate for a period is inappropriate. On
consolidation, the assets and liabilities of the Subsidiaries are translated at exchange rates pre-
vailing on the reporting date. Income and expense items are translated at the average exchange
rates for the period, unless the exchange rates fluctuate significantly during that period, in which
case the exchange rates at the dates of the transactions are used.
Items Measurement bases
Biological assets Fair value less costs to sell
Notes on pages 46-95 form an integral part of these consolidated financial statements
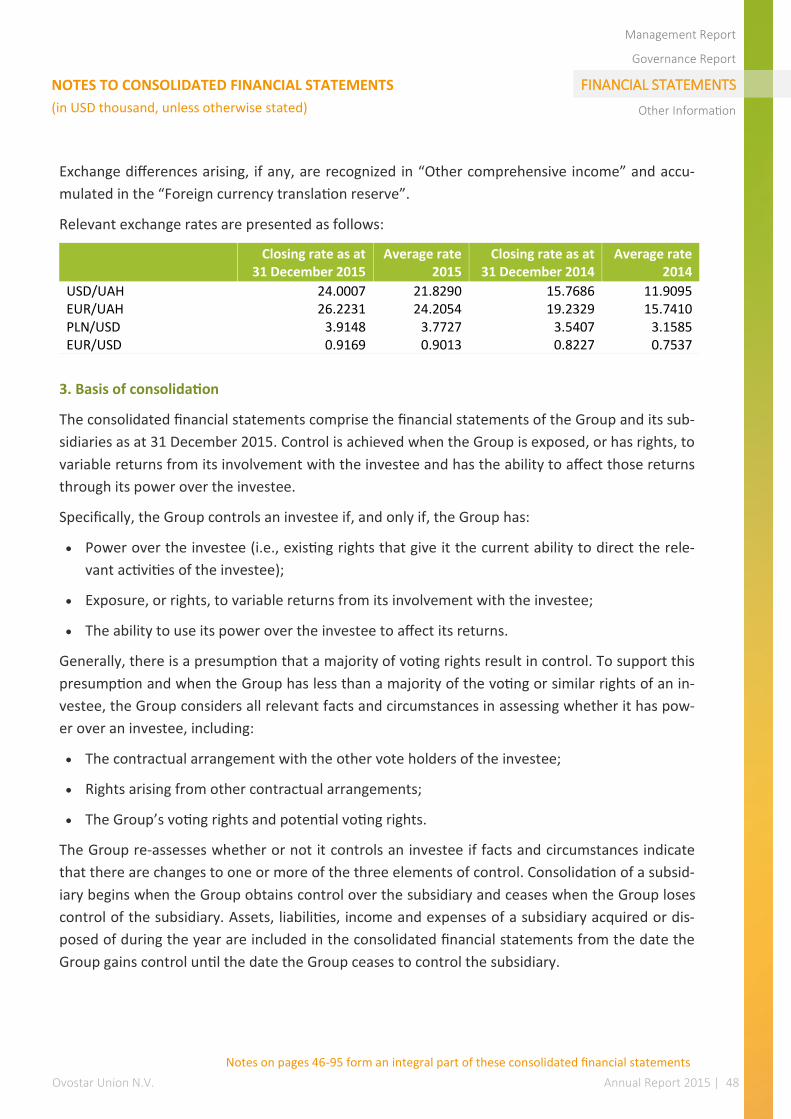
Ovostar Union N.V. Annual Report 2015 | 48
Management Report
Governance Report
FINANCIAL STATEMENTS
Other Information
NOTES TO CONSOLIDATED FINANCIAL STATEMENTS
(in USD thousand, unless otherwise stated)
Exchange differences arising, if any, are recognized in “Other comprehensive income” and accu-
mulated in the “Foreign currency translation reserve”.
Relevant exchange rates are presented as follows:
3. Basis of consolidation
The consolidated financial statements comprise the financial statements of the Group and its sub-
sidiaries as at 31 December 2015. Control is achieved when the Group is exposed, or has rights, to
variable returns from its involvement with the investee and has the ability to affect those returns
through its power over the investee.
Specifically, the Group controls an investee if, and only if, the Group has:
Power over the investee (i.e., existing rights that give it the current ability to direct the rele-
vant activities of the investee);
Exposure, or rights, to variable returns from its involvement with the investee;
The ability to use its power over the investee to affect its returns.
Generally, there is a presumption that a majority of voting rights result in control. To support this
presumption and when the Group has less than a majority of the voting or similar rights of an in-
vestee, the Group considers all relevant facts and circumstances in assessing whether it has pow-
er over an investee, including:
The contractual arrangement with the other vote holders of the investee;
Rights arising from other contractual arrangements;
The Group’s voting rights and potential voting rights.
The Group re-assesses whether or not it controls an investee if facts and circumstances indicate
that there are changes to one or more of the three elements of control. Consolidation of a subsid-
iary begins when the Group obtains control over the subsidiary and ceases when the Group loses
control of the subsidiary. Assets, liabilities, income and expenses of a subsidiary acquired or dis-
posed of during the year are included in the consolidated financial statements from the date the
Group gains control until the date the Group ceases to control the subsidiary.
Closing rate as at 31 December 2015
Average rate 2015
Closing rate as at 31 December 2014
Average rate 2014
USD/UAH 24.0007 21.8290 15.7686 11.9095 EUR/UAH 26.2231 24.2054 19.2329 15.7410 PLN/USD 3.9148 3.7727 3.5407 3.1585 EUR/USD 0.9169 0.9013 0.8227 0.7537
Notes on pages 46-95 form an integral part of these consolidated financial statements
Ovostar Union N.V. Annual Report 2015 | 49
Management Report
Governance Report
FINANCIAL STATEMENTS
Other Information
NOTES TO CONSOLIDATED FINANCIAL STATEMENTS
(in USD thousand, unless otherwise stated)
Profit or loss and each component of other comprehensive income (OCI) are attributed to the eq-
uity holders of the parent of the Group and to the non-controlling interests, even if this results in
the non-controlling interests having a deficit balance. When necessary, adjustments are made to
the financial statements of subsidiaries to bring their accounting policies into line with the
Group’s accounting policies. All intra-group assets and liabilities, equity, income, expenses and
cash flows relating to transactions between members of the Group are eliminated in full on con-
solidation.
A change in the ownership interest of a subsidiary, without a loss of control, is accounted for as
an equity transaction.
If the Group loses control over a subsidiary, it derecognises the related assets (including good-
will), liabilities, non-controlling interest and other components of equity while any resultant gain
or loss is recognised in profit or loss. Any investment retained is recognised at fair value.
4. Use of estimates and assumptions
The preparation of the financial statements requires management to make estimates and as-
sumptions that affect the reported amounts of revenues, expenses, assets and liabilities, and the
disclosure of contingent liabilities, at the end of the reporting period. However, due to uncertain-
ty about these estimates, actual results recorded in future periods may differ from such esti-
mates.
These consolidated financial statements include management's estimates regarding the value of
assets, liabilities, revenues, expenses, and recognized contractual obligations. These estimates
mainly include:
4.1. Impairment of property, plant and equipment
In accordance with IAS 36 "Impairment of Assets" the Group reviews the carrying amount of non-
current tangible assets (mainly property, plant and equipment) to identify signs of impairment of
these assets.
If there is an indication that an asset may be impaired, the Group uses a model of strategic plan-
ning in order to calculate the discounted cash flows (using the "value in use" method, as defined
in IAS 36) and, thus, assess the recoverability of the carrying amount of property, plant and equip-
ment. The model was based on budgets and forecasts approved by the management for the next
5 years.
Expected future cash flows reflect long-term production plans formed on the basis of past experi-
ence and market expectations. The plans take into account all relevant characteristics of poultry
farming, including egg production, volume of egg processing, prices for main components of
mixed fodder. Thus, the production capacity is the basis for forecasting the future production vol-
ume for each subsequent year and related production costs.
Notes on pages 46-95 form an integral part of these consolidated financial statements
Ovostar Union N.V. Annual Report 2015 | 50
Management Report
Governance Report
FINANCIAL STATEMENTS
Other Information
NOTES TO CONSOLIDATED FINANCIAL STATEMENTS
(in USD thousand, unless otherwise stated)
Levels of costs included in projected cash flows are based on current long-term production plans.
When conducting impairment testing, recent levels of costs are taken into account, as well as the
expected cost changes based on the current condition of operating activities and in accordance
with the requirements of IAS 36. IAS 36 provides a number of restrictions on future cash flows,
which may be recognized in respect of future restructuring and capital modernization expenses.
Below are the key assumptions that formed the basis for forecasting future cash flows in the
models:
prices for main components of mixed fodder are based on internal forecasts of the Group's
management;
production data (production of eggs, safety of livestock, meat production volume, production
of egg products) based on internal forecasts of the Group's management from past experi-
ence;
selling prices for eggs, egg products and poultry meat are based on forecasts of the Group's
management and market expectations.
Management believes that calculations of the recoverable amount are most sensitive to changes
in such assumptions as the price of poultry meat, price of eggs and eggs product, price of poultry
fodder and production data. Management believes that any reasonably possible change in key
assumptions on which the recoverable amount of the Group is based will not cause the excess of
carrying amount of the Group over its recoverable amount.
Application of IAS 36 requires extensive judgments by the management regarding estimates and
assumptions related to future cash flows and discount rate. Given the nature of the current global
economic environment, such assumptions and estimates have a high degree of uncertainty.
Therefore, other similar assumptions may lead to significantly different results.
4.2. Fair value of biological assets
Estimation of fair value of biological assets is based on the discounted cash flow model. The fair
value of biological assets might be affected by the fact that the actual future cash flows will differ
from the current forecast, which typically occurs as a result of significant changes in any factors or
assumptions used in the calculations.
Among such factors are:
differences between actual prices and price assumptions used in estimating net realizable val-
ue of eggs;
changes in productivity of laying hens;
unforeseen operational problems inherent in the branch specificity;
age of hens at the end of the reporting period;
changes in production costs, costs of processing and products sales, discount and inflation
rates and exchange rates that could adversely affect the fair value of biological assets.
Notes on pages 46-95 form an integral part of these consolidated financial statements
Ovostar Union N.V. Annual Report 2015 | 51
Management Report
Governance Report
FINANCIAL STATEMENTS
Other Information
NOTES TO CONSOLIDATED FINANCIAL STATEMENTS
(in USD thousand, unless otherwise stated)
The key assumptions concerning biological assets based on discounted cash flow approach are
presented as follows:
cost planning at each stage of poultry farming will remain constant in future periods;
egg production volume will not be significantly changed;
egg sale price in future periods;
long-term inflation rate of Ukrainian hryvnia in future periods;
discount rate for determining the present value of future cash flows expected from the bio-
logical assets was set at 31 December 2015: 33.47% (31 December 2014: 27.58%).
Management determined that calculations of the fair value of biological assets are the most sen-
sitive to changes in such assumptions as the volume of egg production, cost planning and prices
of eggs, eggs product and poultry meat. Management believes that any reasonably possible
change in key assumptions will not cause any significant change in the fair value of biological as-
sets.
All assets and liabilities for which fair value is measured or disclosed in the financial statements
are categorized within the fair value hierarchy, described as follows, based on the lowest level
input that is significant to the fair value measurement as a whole:
Level 1: Quoted (unadjusted) market prices in active markets for identical assets or liabilities.
Level 2: Valuation techniques for which the lowest level input that is significant to the fair val-
ue measurement is directly or indirectly observable.
Level 3: Valuation techniques for which the lowest level input that is significant to the fair val-
ue measurement is unobservable.
Although some of these assumptions are obtained from published market data, the majority of
these assumptions are estimated based on the Group’s historical and projected results.
Fair value related disclosures for financial instruments and non-financial assets that are measured
at fair value or where fair values are disclosed, are summarized in Notes 17, 28.
Fair value is the price that would be received to sell an asset or paid to transfer a liability in an
orderly transaction between market participants at the measurement date. The fair value meas-
urement is based on the presumption that the transaction to sell the asset or transfer the liability
takes place either:
In the principal market for the asset or liability
Or
In the absence of a principal market, in the most advantageous market for the asset or liabil-
ity.
Notes on pages 46-95 form an integral part of these consolidated financial statements
Ovostar Union N.V. Annual Report 2015 | 52
Management Report
Governance Report
FINANCIAL STATEMENTS
Other Information
NOTES TO CONSOLIDATED FINANCIAL STATEMENTS
(in USD thousand, unless otherwise stated)
4.3. Allowances for doubtful debts
The Group forms allowances for doubtful debts to cover any potential losses arising in case of
buyer's insolvency. In assessing the adequacy of the allowance for doubtful debts the manage-
ment takes into account overall current economy conditions, terms of balances for outstanding
receivables, the Group's experience to write-off liabilities, customers' solvency and changes in the
conditions of payment. Changes in the economy, industry or financial position of individual buyers
may cause adjustment to the amount of allowance for doubtful debts reflected in the consolidat-
ed financial statements.]
4.4. Useful lives of property, plant and equipment
The Group estimates useful lives of property, plant and equipment at least at the end of each fi-
nancial year and, if expectations differ from previous estimates, changes are recorded as changes
in accounting estimates in accordance with IAS 8 "Accounting Policies, Changes in Accounting Esti-
mates and Errors". These estimates can have a significant impact on the carrying amount of prop-
erty, plant and equipment and depreciation expenses during the period.
4.5. Deferred tax assets
Deferred tax assets are recognized for all unused tax losses to the extent that the inflow of taxa-
ble profit is possible, at the expense of which these losses may be implemented. Significant judg-
ments are required from the management in determining the amount of deferred tax assets that
can be recognized on the basis of the possible terms of receipt and the level of future taxable
profit together with the future tax planning strategy.
5. Summary of significant accounting policies
5.1. Recognition and measurement of financial instruments
Financial assets and financial liabilities are recorded in the Group's consolidated statement of fi-
nancial position when the Group becomes a contractual party regarding the corresponding finan-
cial instrument. The Group records the acquisition and sale of financial assets and financial liabili-
ties at the settlement date.
Financial assets and financial liabilities are initially measured at fair value. Transaction costs that
are directly attributable to the acquisition or issue of financial assets and financial liabilities (other
than financial assets and financial liabilities at fair value through profit or loss) are added to or
deducted from the fair value of the financial assets or financial liabilities, as appropriate, on initial
recognition. Transaction costs directly attributable to the acquisition of financial assets or finan-
cial liabilities at fair value through profit or loss are recognised immediately in profit or loss.
Notes on pages 46-95 form an integral part of these consolidated financial statements
Ovostar Union N.V. Annual Report 2015 | 53
Management Report
Governance Report
FINANCIAL STATEMENTS
Other Information
NOTES TO CONSOLIDATED FINANCIAL STATEMENTS
(in USD thousand, unless otherwise stated)
Fair value of investments that are actively traded in organized financial markets is calculated on
the basis of current market value at the close of trading on the reporting date. Regarding invest-
ments in securities for which there is no active market, fair value is calculated using other meth-
ods of valuation of financial instruments. Such valuation methods include the use of information
on recent market transactions between well informed, willing to commit such transaction, inde-
pendent parties, or data about the current market value of another similar instrument, discount-
ed cash flow analysis or other pricing models.
Accounting policy for subsequent revaluation of these items is disclosed below in the appropriate
sections of accounting policy.
5.2. Financial assets
Initial recognition and measurement
Financial assets are recognised initially at transaction costs that are attributable to the acquisition
of the financial asset.
Purchases or sales of financial assets that require delivery of assets within a time frame estab-
lished by regulation or convention in the market place (regular way trades) are recognised on the
trade date, i.e., the date that the Group commits to purchase or sell the asset
5.3. Effective interest rate method
The effective interest rate method is used to calculate the amortized cost of a financial asset and
distribute interest income during the relevant period. The effective interest rate is the rate that
enables discounting of estimated future cash receipts through the expected life of a financial as-
set or a shorter period, if applicable.
Revenues relating to debt instruments are recorded using the effective interest rate method, ex-
cept for financial assets at fair value through profit or loss.
Financial assets at fair value through profit or loss - a financial asset is classified as at fair value
through profit or loss if it is held for trading or designated at fair value through profit or loss.
A financial asset is classified as held-for-trading if it is:
purchased originally for the purpose of sale / repayment within a short period of time; or
a part of the portfolio of identified financial instruments that are managed together, and
structure of which demonstrates the intention of profit earning in the short term; or
a derivative that is not classified as a hedging instrument and is not effective for these pur-
poses.
Notes on pages 46-95 form an integral part of these consolidated financial statements
Ovostar Union N.V. Annual Report 2015 | 54
Management Report
Governance Report
FINANCIAL STATEMENTS
Other Information
NOTES TO CONSOLIDATED FINANCIAL STATEMENTS
(in USD thousand, unless otherwise stated)
A financial asset that is not a financial asset held-for-trading may be classified as a financial asset
at fair value through profit or loss at the time of recognition in the accounting records if:
application of such classification eliminates or significantly reduces discrepancies in valuation
or accounting, that otherwise might arise, or
a financial asset is a part of a group of financial assets, financial liabilities or both groups,
which are managed and controlled on the basis of fair value in accordance with a document-
ed risk or investment management strategy, and information about this group is provided in-
ternally on that basis, or
it exists in the framework of the contract containing one or more embedded derivatives, and
IAS 39 “Financial Instruments: Recognition and Measurement” permits to classify the whole
contract (asset or liability) as at fair value through profit or loss.
Financial assets at fair value through profit or loss are measured at fair value with arising gains or
losses recognized in the consolidated statement of comprehensive income. Net gains or losses
recognized in the income statement include dividends and interest received on the relevant finan-
cial asset.
Held-to-maturity investments - investments held to maturity are measured at amortized cost us-
ing the effective interest rate method, less impairment, and income is recognized using the effec-
tive yield method. During the reporting periods presented in these financial statements, the
Group had no investments of this category.
Loans and receivables - accounts receivable regarding principal activities, loans, borrowings and
other receivables with fixed or determinable payments that are not quoted in an active market
are classified as "loans and receivables". Loans and receivables are measured at amortized cost
using the effective interest rate method less impairment and uncollectible debts. Interest income
is recognized by applying the effective interest rate, except for short-term receivables for which
the amount of such interest income is insignificant.
Unquoted investments available for sale are accounted for at cost if their fair value cannot be reli-
ably measured.
5.4. Cash and cash equivalents
Cash and cash equivalents include cash on hand and cash in bank accounts.
5.5. Short-term deposits
Short-term deposits in the statement of financial position comprise short-term deposits with a
maturity of three months or less, which are subject to an insignificant risk of changes in value.
Notes on pages 46-95 form an integral part of these consolidated financial statements
Ovostar Union N.V. Annual Report 2015 | 55
Management Report
Governance Report
FINANCIAL STATEMENTS
Other Information
NOTES TO CONSOLIDATED FINANCIAL STATEMENTS
(in USD thousand, unless otherwise stated)
5.6. Impairment of financial assets
Financial assets, except for financial assets at fair value through profit or loss, at each reporting
date are assessed for signs indicating impairment. Impairment loss is recognized when there is
objective evidence of reduction of the estimated future cash flows on this asset as a result of one
or more events that occurred after the financial asset was recorded in the accounting. For finan-
cial assets at amortized cost, the amount of impairment is calculated as the difference between
the asset's carrying amount and present value of the expected future cash flows discounted using
the effective interest rate.
Impairment loss directly reduces the carrying amount of all financial assets, except for accounts
receivable on principal activities, carrying amount of which is reduced due to the allowance
formed. If the accounts receivable on principal activities are uncollectible, they are written-off
against the related allowance. Subsequently received reimbursements of amounts previously
written-off are recorded in credit of the allowance account. Changes in the carrying amount of
the allowance account are recorded in the profit and loss.
Except for equity instruments available for sale, if in a subsequent period the amount of impair-
ment loss decreases and such decrease can be objectively related to an event occurring after the
impairment was recognized, the impairment loss previously recognized is recovered by adjusting
the items in the income statement. In this case, the carrying amount of financial investments at
the date of recovery of impairment cannot exceed its amortized cost, which would be reflected in
the case, if impairment was not recognized.
In respect of equity securities available for sale, any increase in fair value after recognition of im-
pairment loss relates directly to equity.
5.7. Writing-off of financial assets
The Group writes-off a financial asset only if rights for cash flows under the corresponding con-
tract terminated the treaty or if a financial asset and corresponding risks and rewards are trans-
ferred to other organization. If the Group does not transfer or retain all the principal risks and re-
wards of ownership of the asset and continues to control the transferred asset, it shall record its
share in the asset and related liability in the amount of possible payment of corresponding
amounts. If the Group retains all the principal risks and rewards of ownership of the transferred
financial asset, it shall continue to account for the financial asset, and reflect a secured loan on
income earned.
5.8. Financial liabilities and equity instruments issued by the Group
5.8.1. Accounting as liabilities or equity
Debt and equity financial instruments are classified as liabilities or equity based on the substance
of the corresponding contractual obligations.
Notes on pages 46-95 form an integral part of these consolidated financial statements
Ovostar Union N.V. Annual Report 2015 | 56
Notes on pages 46-95 form an integral part of these consolidated financial statements
Management Report
Governance Report
FINANCIAL STATEMENTS
Other Information
NOTES TO CONSOLIDATED FINANCIAL STATEMENTS
(in USD thousand, unless otherwise stated)
5.8.2. Equity instruments
Equity instrument is any contract confirming the right for a share in the company's assets remain-
ing after deduction of all its liabilities. Equity instruments issued by the Group are recorded in the
amount of generated income net of direct expenses for their issue.
5.8.3. Liabilities under financial guarantee contracts
Liabilities under financial guarantee contracts are initially measured at fair value and subsequent-
ly recorded at the higher of:
cost of contractual obligations determined in accordance with IAS 37 “Provisions, Contingent
Liabilities and Contingent Assets”, and
cost, less, where applicable, accumulated depreciation reflected in accordance with the prin-
ciples of revenue recognition set forth below.
5.8.4. Financial liabilities
Initial recognition and measurement
Financial liabilities are classified, at initial recognition as loans and borrowings, payables.
All financial liabilities are recognised initially at fair value and, in the case of loans and borrowings
and payables, net of directly attributable transaction costs.
The Group’s financial liabilities include trade and other payables, loans and borrowings including
bank overdrafts.
A financial liability is classified as held for trading if it is:
assumed mainly to be repurchased within a short period of time; or
a part of the portfolio of identified financial instruments that are managed together, and
structure of which demonstrates the intention of profit earning in the short term; or
a derivative that is not classified as a hedging instrument and is not effective for these pur-
poses.
A financial liability that is not a financial liability held-for-trading may be classified as a financial
liability at fair value through profit or loss at the time of recognition in the accounting records if:
application of such classification eliminates or significantly reduces discrepancies in valuation
or accounting, that otherwise might arise, or
a financial liability is a part of a group of financial assets, financial liabilities or both groups,
which are managed and controlled on the basis of fair value in accordance with a document-
ed risk or investment management strategy, and information about this group is provided in-
ternally on that basis, or
it exists within the framework of the contract containing one or more embedded derivatives,
and IAS 39 “Financial Instruments: Recognition and Measurement” permits to classify the
whole contract (asset or liability) as at fair value through profit or loss.
Ovostar Union N.V. Annual Report 2015 | 57
Management Report
Governance Report
FINANCIAL STATEMENTS
Other Information
NOTES TO CONSOLIDATED FINANCIAL STATEMENTS
(in USD thousand, unless otherwise stated)
Financial liabilities at fair value through profit or loss are measured at fair value with arising gains
or losses recognized in the financial results. Net gains or losses recognized in the income state-
ment include interest paid on a financial liability.
Other financial liabilities - other financial liabilities, including borrowings, are accounted for at fair
value less transaction costs. Other financial liabilities are subsequently measured at amortized
cost using the effective interest rate method, with the recognition of interest expenses using the
effective (actual) yield.
5.8.5. Trade and other accounts payable
Trade payables are recognized when the counterparty fulfills its contractual obligations and meas-
ured at amortized cost using the effective interest rate.
5.8.6. Loans and borrowings
Loans and borrowings are initially recognized at fair value less costs incurred in the transaction.
Subsequently, loans and borrowings are stated at amortized cost; any difference between pro-
ceeds (net of transaction costs) and the amount of repayment is reflected in the income state-
ment over the period for which loans and borrowings are issued using the effective interest rate
method. Loans and borrowings are classified as current liabilities, unless the Group has an uncon-
ditional right to defer settlement of the obligation to at least one year after the date of balance
sheet preparation.
5.8.7. Writing-off of financial liabilities
The Group writes-off financial liabilities only when they are repaid, cancelled or expire.
5.9. Foreign currency transactions
Transactions in currencies other than the functional currency are initially recorded at exchange
rates set on the dates of these transactions. Monetary assets and liabilities denominated in such
currencies are translated at the rates applicable at the reporting date. All realized and unrealized
gains and losses resulting from exchange rate differences are included in profit or loss for the pe-
riod.
5.10. Biological assets
Biological assets represented by the commercial herd and herd replacements are recorded at fair
value less estimated selling and distribution expenses. Estimate of fair value of biological assets of
the Group is based on discounted cash flow models, according to which the fair value of biological
assets is calculated using present value of the expected net cash flows from biological assets dis-
counted at the appropriate rate.
The Group recognizes a biological asset only where it controls an asset as a result of past events;
it is probable that the economic benefits from the asset will flow to the Group; fair value or cost
of an asset can be estimated with reasonable certainty.
Notes on pages 46-95 form an integral part of these consolidated financial statements
Ovostar Union N.V. Annual Report 2015 | 58
Management Report
Governance Report
FINANCIAL STATEMENTS
Other Information
NOTES TO CONSOLIDATED FINANCIAL STATEMENTS
(in USD thousand, unless otherwise stated)
Profit or loss arising on initial recognition of biological assets at fair value less estimated selling
and distribution expenses is included in the consolidated income statement as incurred.
Agricultural products collected from a biological asset are measured at fair value less estimated
selling and distribution expenses. Profit or loss arising on initial recognition of agricultural prod-
ucts at fair value, less estimated selling and distribution expenses, is recognized in the consolidat-
ed statement of comprehensive income.
5.11. Inventories
Inventories consist mainly of raw materials, package and packing materials, agricultural produce
and finished goods. Inventories are valued at the lower of cost and net realisable value.
Cost of goods includes the cost of acquisition and, where appropriate, costs incurred in bringing
inventories to their present condition and location. Cost is calculated using the weighted average
method. Initial cost of inventories includes the transfer of gains and losses on qualifying cash flow
hedges, recognised in OCI, in respect to the purchases of raw materials.
Net realisable value is the estimated selling price in the ordinary course of business, less estimat-
ed costs of completion and the estimated costs necessary to make the sale.
5.12. Property, plant and equipment
Property, plant and equipment are recorded at historical cost or deemed cost, equal to fair value
at the date of transition to IFRS, less accumulated depreciation and accumulated impairment loss-
es. Historical cost of an asset of property, plant and equipment includes (a) the purchase price,
including non-recoverable import duties and taxes net of trade and other discounts; (b) any costs
directly related to bringing an asset to the location and condition, which allow its functioning in
accordance with the intentions of the Group's management; (c) initial assessment of the costs of
dismantling and removal in the asset of property, plant and equipment and restoring the occu-
pied territory; this obligation is assumed by the Company either upon the acquisition of an asset,
or as a result of its operation for a certain period of time for the purposes not related to the pro-
duction of inventories during this period. Cost of assets created in-house includes cost of materi-
als, direct labor costs and an appropriate proportion of production overheads.
Construction in progress includes costs directly related to the construction of property, plant and
equipment, including distribution of variable overheads associated with the construction and pre-
payments for the property, plant and equipment. Construction in progress is not depreciated.
These assets are depreciated from the moment when they are used in economic activity, on the
same basis as depreciation on other assets.
Subsequently capitalised costs include major expenditures for improvements and replacements
that extend the useful lives of the assets or increase their revenue generating capacity. Repairs
and maintenance expenditures that do not meet the foregoing criteria for capitalisation are
charged to the consolidated statement of comprehensive income as incurred.
Notes on pages 46-95 form an integral part of these consolidated financial statements
Ovostar Union N.V. Annual Report 2015 | 59
Notes on pages 46-95 form an integral part of these consolidated financial statements
Management Report
Governance Report
FINANCIAL STATEMENTS
Other Information
NOTES TO CONSOLIDATED FINANCIAL STATEMENTS
(in USD thousand, unless otherwise stated)
Depreciable amount is the cost of an asset of property, plant and equipment, or any other
amount, less its residual value. The residual value of an asset is the estimated amount that the
company would receive to date from the sale of an item of property, plant and equipment, less
estimated costs of disposal if the asset reached the age and condition, in which, presumably, it
will be at the end of its useful life. Assets under finance lease are depreciated over the shorter of
estimated useful life on the same basis as own assets or over the period of the relevant lease.
Depreciation is provided to write-off the depreciable amount over the useful life of an asset and is
calculated using the straight-line method. Useful lives of the groups of property, plant and equip-
ment are as follows:
The residual value, useful life and depreciation method are reviewed at the end of each financial
year. Impact of any changes arising from estimates made in prior periods is recorded as a change
in an accounting estimate.
Gains or losses arising from disposal or liquidation of an asset of property, plant and equipment,
are defined as the difference between sales proceeds and carrying amount of an asset and recog-
nized in profit or loss.
5.13. Impairment of property, plant and equipment
At the end of each reporting period the Group identifies signs of possible impairment of assets. If
any such indication exists, the Group reviews the carrying amount of its items of property, plant
and equipment to determine whether any signs of impairment exist due to depreciation. If any
such indication exists, the expected recoverable amount of an asset is estimated to determine the
amount of impairment losses, if any.
In order to determine the impairment losses, assets are grouped at the lowest levels for which it
is possible to identify separately the cash flows (cash generating unit).
The recoverable amount is the higher of fair value less selling and distribution expenses and value
of an asset in use. In assessing the value of an asset in use, the estimated future cash flows associ-
ated with the asset, are discounted to their present value using pre-tax discount rate that reflects
current market estimates of time value of money and the risks inherent in the asset.
If, according to the estimates, the recoverable amount of an asset (cash generating unit) is less
than its carrying amount, the carrying amount of an asset (cash generating unit) is reduced to the
recoverable amount. An impairment loss is recognized immediately in the income statement, ex-
cept when the asset is recorded at a revalued amount. In this case the impairment loss is consid-
ered as a revaluation decrease.
Buildings 10 - 40 years
Plant and equipment 5 - 25 years
Vehicles 3 - 10 years
Furniture and fittings 3 - 5 years
Construction in progress and uninstalled equipment No depreciation
Ovostar Union N.V. Annual Report 2015 | 60
Management Report
Governance Report
FINANCIAL STATEMENTS
Other Information
NOTES TO CONSOLIDATED FINANCIAL STATEMENTS
(in USD thousand, unless otherwise stated)
In cases where impairment losses are subsequently reversed, the carrying amount of the asset
(cash generating unit) is increased to the revised estimate of recovery amount, however, in such a
way that the increased carrying amount does not exceed the carrying amount that would be de-
termined, if an impairment loss was not recognized in respect of an asset (cash generating unit) in
previous years. Reversal of impairment loss is recognized immediately in the income statement,
except when the asset is recorded at a revalued amount. In this case, the reversal of an impair-
ment loss is considered as a revaluation increase.
5.14. Intangible assets
Intangible assets acquired separately are measured on initial recognition at cost. The cost of in-
tangible assets acquired in a business combination is its fair value as at the date of acquisition.
Following initial recognition, intangible assets are carried at cost less any accumulated amortisa-
tion and any accumulated impairment losses. Internally generated intangible assets are not capi-
talised and expenditure is reflected in the income statement in the year in which the expenditure
is incurred.
The useful lives of intangible assets are assessed as either finite or indefinite.
Intangible assets with finite lives are amortised over the useful economic life and assessed for im-
pairment whenever there is an indication that the intangible asset may be impaired. The amorti-
sation period and the amortisation method for an intangible asset with a finite useful life are re-
viewed at least at each financial year end. Changes in the expected useful life or the expected
pattern of consumption of future economic benefits embodied in the asset is accounted for by
changing the amortisation period or method, as appropriate, and are treated as changes in ac-
counting estimates. The amortisation expense on intangible assets with finite lives is recognised
in the income statement in the expense category consistent with the function of the intangible
asset.
Intangible assets with indefinite useful lives are not amortised, but are tested for impairment an-
nually, either individually or at the cash generating unit level. The assessment of indefinite life is
reviewed annually to determine whether the indefinite life continues to be supportable. If not,
the change in useful life from indefinite to finite is made on a prospective basis.
Gains or losses arising from derecognition of an intangible asset are measured as the difference
between the net disposal proceeds and the carrying amount of the asset and are recognised in
the income statement when the asset is derecognised.
Amortization is calculated on a straight line basis over the useful life of an asset, which is 10 years.
5.15. Borrowing costs
Borrowing costs directly attributable to the acquisition, construction or production of an asset
that necessarily takes a substantial period of time to get ready for its intended use or sale are cap-
italised as part of the cost of the asset. All other borrowing costs are expensed in the period in
which they occur. Notes on pages 46-95 form an integral part of these consolidated financial statements
Ovostar Union N.V. Annual Report 2015 | 61
Management Report
Governance Report
FINANCIAL STATEMENTS
Other Information
NOTES TO CONSOLIDATED FINANCIAL STATEMENTS
(in USD thousand, unless otherwise stated)
Borrowing costs consist of interest and other costs that an entity incurs in connection with the
borrowing of funds.
5.16. Leases
Leases are classified as finance leases when according to the terms of lease the lessee assumes all
principal risks and rewards incident to ownership of the leased property. Other leases are classi-
fied as operating leases. Income and expenses associated with operating leases are accrued on a
straight-line basis and recorded in the income statement over the lease term.
5.17. Group as a lessee
Finance leases, which transfer to the Group substantially all the risks and benefits incidental to
ownership of the leased item, are capitalised at the commencement of the lease at the fair value
of the leased property or, if lower, at the present value of the minimum lease payments. Lease
payments are apportioned between finance charges and reduction of the lease liability so as to
achieve a constant rate of interest on the remaining balance of the liability. Finance charges are
recognised in the statement of comprehensive income. Operating lease payments are recognized
as an expense in the income statement evenly over the lease term.
5.18. Group as a lessor
Leases where the Group does not transfer substantially all the risks and rewards of ownership of
the asset are classified as operating leases. Initial direct costs incurred in negotiating an operating
lease are added to the carrying amount of the leased asset and recognised over the lease term on
the same base as rental income. Contingent rents are recognised as revenue in the period in
which they are earned.
5.19. Contingent assets and liabilities
Contingent liabilities are not recognized in the financial statements. Such liabilities are disclosed
in the notes to the financial statements, except where the probability of outflow of resources em-
bodying economic benefits is insignificant.
Contingent assets are not recognized in the financial statements, but disclosed in the notes to the
extent that it is probable that the economic benefits will flow to the Group.
5.20. Provisions
Provisions are recognised when the Group has a present obligation (legal or constructive) as a re-
sult of a past event, it is probable that an outflow of resources embodying economic benefits will
be required to settle the obligation and a reliable estimate can be made of the obligation amount.
The amount recognized as a provision is the best estimate of compensation necessary to repay a
current liability on the reporting date, which takes into account all the risks and uncertainties in-
herent in this liability. Notes on pages 46-95 form an integral part of these consolidated financial statements
Ovostar Union N.V. Annual Report 2015 | 62
Notes on pages 46-95 form an integral part of these consolidated financial statements
Management Report
Governance Report
FINANCIAL STATEMENTS
Other Information
NOTES TO CONSOLIDATED FINANCIAL STATEMENTS
(in USD thousand, unless otherwise stated)
In cases where the amount of provision is estimated using cash flows that can be required to re-
pay current liabilities, its carrying amount represents the present value of these cash flows.
Where there is a possibility that one or all of the economic benefits necessary to recover the
amount of provision will be reimbursed by a third party, the receivables are recognized as an as-
set if there is actual assurance that such reimbursement will be received and the amount of re-
ceivables can be measured reliably.
5.21. Revenue recognition
Revenues from the sale of goods are recognized when the Group has transferred to the buyer all
significant risks and rewards of ownership of the goods, and it is probable that the economic ben-
efits associated with this transaction will flow to the Group.
Revenues from rendering of services are recognized in the reporting period in which the services
were provided, based on the level of completion of the specific transaction and only when the
amount of revenue can be reliably measured and it is probable that the economic benefits associ-
ated with this transaction will flow to the Group.
Income and expenses relating to the same transaction or event are recognized simultaneously.
Interest income is recognized using the effective interest rate method.
5.22. Income tax
Income tax is calculated in accordance with the requirements of the applicable legislation of
Ukraine. Income tax is calculated on the basis of financial results for the year adjusted to items
that are not included in taxable income or that cannot be attributed to gross expenses. It is calcu-
lated using tax rates effective at the reporting date.
Deferred tax is accounted for using the balance sheet liability method in respect of temporary
differences arising from differences between the carrying amount of assets and liabilities in the
financial statements and the corresponding tax base used to calculate taxable income. Deferred
tax liabilities are generally recognized for all taxable temporary differences and deferred tax as-
sets are recorded taking into account the degree of certainty in sufficient taxable income, which
enables to realize temporary differences related to gross expenses.
Deferred tax is calculated at tax rates, which presumably will be applied during the sale of related
assets or repayment of related liabilities.
Assets and liabilities on deferred income tax are offset when: a) the Group has a legally enforcea-
ble right to offset the recognized current income tax assets and liabilities; b) the Group intends
either to perform settlement by offsetting counterclaims, or simultaneously sell the asset and
settle the liability; c) deferred tax assets and liabilities relate to income taxes levied by the same
taxation authority in each future period in which it is intended to repay or reimburse a significant

Ovostar Union N.V. Annual Report 2015 | 63
Notes on pages 46-95 form an integral part of these consolidated financial statements
Management Report
Governance Report
FINANCIAL STATEMENTS
Other Information
NOTES TO CONSOLIDATED FINANCIAL STATEMENTS
(in USD thousand, unless otherwise stated)
amount of deferred tax liabilities and assets.
Deferred income tax is recognized in the income statement, except when it relates to items rec-
ognized directly in equity. In this case the deferred tax is also recognized in equity.
In 2015, Ukrainian corporate income tax was levied at a rate of 18% (2014: 18%)
Fixed agricultural tax: The majority of the Group companies that are involved in agricultural pro-
duction (poultry farms and other entities engaged in agricultural production) benefit substantially
from the status of an agricultural producer. These companies are exempt from income taxes and
pay the Fixed Agricultural Tax instead (Note 16).
5.23. Value Added Tax
For the year ended 31 December 2015 and 2014, VAT was levied at two rates: 20% on Ukrainian
domestic sales and imports of goods, works and services and 0% on export of goods and provision
of works or services to be used outside Ukraine. In 2015 VAT rate remains at the same level.
VAT output equals the total amount of VAT collected within a reporting period, and arises on the
earlier of the date of shipping goods to the customer or the date of receiving payment from the
customer. VAT input is the amount that a taxpayer is entitled to offset against his VAT liability in
the reporting period. According to Ukrainian legislation, rights to VAT input arise on the earlier of
the date of payment to the supplier or the date goods are received.
5.24. Government grants
Government grants are stated at fair value when there is reasonable assurance that the grant will
be received.
Ukrainian legislation provides a variety of tax benefits and subsidies for agricultural companies.
Such benefits and subsidies are approved by the Supreme Council of Ukraine, the Ministry of
Agrarian Policy, Ministry of Finance, local authorities. Under the applicable legislation, agricultural
producers are entitled to use VAT benefit regarding agricultural transactions.
VAT refunds and other government grants
The Group’s companies are subject to special tax treatment for VAT (Note 12). The Group’s enter-
prises, which qualify as agricultural producers, are entitled to retain the net VAT payable. VAT
amounts payable are not transferred to the State, but credited to the entity’s separate special
account to support the agriculture activities of the Group. Net result on VAT operations, calculat-
ed as excess of VAT liability over VAT credit is charged to profit or loss. VAT receivable exceeding
VAT liability is used as a reduction in tax liabilities of the next period.
Government grants are recognised as income over the periods necessary to match them with the
related costs, or as an offset against finance costs when received as compensation for the finance
costs for agricultural producers. To the extent the conditions attached to the grants are not met
at the reporting date, the received funds are recorded in the Group’s consolidated financial state-
ments as deferred income.
Ovostar Union N.V. Annual Report 2015 | 64
Notes on pages 46-95 form an integral part of these consolidated financial statements
Other government grants are recognised at the moment when the decision to disburse the
amounts to the Group is made. Government grants are not recognised until there is reasonable
assurance that the Group will comply with the conditions attached to them and that the grants
will be received.
5.25. Partial compensation of interest rates on loans raised by the agricultural companies
from financial institutions
The Group companies are entitled to compensation from the government of a share of interest
expenses incurred on loans which were received for agricultural purposes. The amount of interest
compensation depends on the term and purpose of the loan. Due to the fact that the payment of
interest compensations depends on the capabilities of the country's budget, they are recognized
on a cash basis as other operating income in the period of receipt.
5.26. Related party transactions
For the purposes of these consolidated financial statements, the parties are considered to be re-
lated if one of the parties has a possibility to control or considerably influence the operational and
financial decisions of the other company. While considering any relation which can be defined as
related party transactions it is necessary to take into consideration the substance of the transac-
tion not only their legal form.
5.27. Reclassification
Certain comparative information presented in the consolidated financial statements for the year
ended 31 December 2014 has been revised in order to achieve comparability with the presenta-
tion used in the consolidated financial statements for the year ended 31 December 2015. Such
reclassifications and revisions were not significant to the Group financial statements.
6. New and amended standards
6.1. Standards issued but not yet effective
The standards and interpretations that are issued, but not yet effective, up to the date of issuance
of the Group’s financial statements are disclosed below. The Group intends to adopt these stand-
ards, if applicable, when they become effective.
IFRS 9 Financial Instruments
In July 2014, the IASB issued the final version of IFRS 9 Financial Instruments which reflects all
phases of the financial instruments project and replaces IAS 39 Financial Instruments: Recognition
and Measurement and all previous versions of IFRS 9. The standard introduces new requirements
for classification and measurement, impairment, and hedge accounting. Retrospective application
is required, but comparative information is not compulsory. The adoption of IFRS 9 will have an
effect on the classification and measurement of the Group’s financial assets, but will potentially
have no impact on the classification and measurement of the Group’s financial liabilities.
Management Report
Governance Report
FINANCIAL STATEMENTS
Other Information
NOTES TO CONSOLIDATED FINANCIAL STATEMENTS
(in USD thousand, unless otherwise stated)

Ovostar Union N.V. Annual Report 2015 | 65
Management Report
Governance Report
FINANCIAL STATEMENTS
Other Information
NOTES TO CONSOLIDATED FINANCIAL STATEMENTS
(in USD thousand, unless otherwise stated)
The IASB effective date is 1 January 2018 with early adoption permitted.
IFRS 15 Revenue from Contracts with Customers
IFRS 15 was issued in May 2014 and establishes a new five-step model that will apply to revenue
arising from contracts with customers. Under IFRS 15 revenue is recognised at an amount that
reflects the consideration to which an entity expects to be entitled in exchange for transferring
goods or services to a customer. The principles in IFRS 15 provide a more structured approach to
measuring and recognising revenue.
It replaces existing revenue recognition guidance, including IAS 18 Revenue, IAS 11 Construction
Contracts and IFRIC 13 Customer Loyalty Programmes. The IASB effective date is 1 January 2018,
with early adoption permitted. The Group is currently assessing the impact of IFRS 15 and plans to
adopt the new standard on the required effective date.
IFRS 16 Leases
IFRS 16, published in January 2016, establishes a revised framework for determining whether a
lease is recognised on the (Consolidated) Statement of Financial Position. It replaces existing guid-
ance on leases, including IAS 17. The IASB effective date is 1 January 2019, with early adoption
permitted. The Group will assess the potential impact on its consolidated financial statements re-
sulting from the application of IFRS 16.
IFRS 14 Regulatory Deferral Accounts
IFRS 14 is an optional standard that allows an entity, whose activities are subject to rate-
regulation, to continue applying most of its existing accounting policies for regulatory deferral ac-
count balances upon its first-time adoption of IFRS. Entities that adopt IFRS 14 must present the
regulatory deferral accounts as separate line items on the statement of financial position and pre-
sent movements in these account balances as separate line items in the statement of profit or
loss and other comprehensive income. The standard requires disclosures on the nature of, and
risks associated with, the entity’s rate-regulation and the effects of that rate-regulation on its fi-
nancial statements. IFRS 14 has not been yet endorsed by the EU. The IASB effective date is 1 Jan-
uary 2016. Since the Group is an existing IFRS preparer, this standard would not apply.
Amendments to IFRS 10 and IAS 28 Sale or Contribution of Assets between an Investor
and its Associate or Joint Venture
The IASB has published 'Sale or Contribution of Assets between an Investor and its Associate or
Joint Venture (Amendments to IFRS 10 and IAS 28)'. The amendments address a conflict between
the requirements of IAS 28 'Investments in Associates and Joint Ventures' and IFRS 10
'Consolidated Financial Statements' and clarify that in a transaction involving an associate or joint
venture the extent of gain or loss recognition depends on whether the assets sold or contributed
constitute a business. The amendments have not been endorsed by the EU. The Group is current-
ly assessing the impact of these amendments on the financial statements.
Notes on pages 46-95 form an integral part of these consolidated financial statements
Ovostar Union N.V. Annual Report 2015 | 66
Management Report
Governance Report
FINANCIAL STATEMENTS
Other Information
NOTES TO CONSOLIDATED FINANCIAL STATEMENTS
(in USD thousand, unless otherwise stated)
Annual improvements 2012-2014 Cycle
These improvements are endorsed by the EU. The effective date is 1 January 2016. The improve-
ments are not expected to have a material impact on the Group. They include:
IFRS 5 Non-current Assets Held for Sale and Discontinued Operations
This improvement adds specific guidance in IFRS 5 for cases in which an entity reclassifies an asset
from held for sale to held for distribution or vice versa and cases in which held-for-distribution
accounting is discontinued.
IFRS 7 Financial Instruments: Disclosures (with consequential amendments to IFRS 1)
The amendment adds additional guidance to clarify whether a servicing contract is continuing in-
volvement in a transferred asset for the purpose of determining the disclosures required.
This improvement clarifies the applicability of the amendments to IFRS 7 on offsetting disclosures
to condensed interim financial statements.
IAS 19 Employee Benefits
This amendment clarifies that the high quality corporate bonds used in estimating the discount
rate for post-employment benefits should be denominated in the same currency as the benefits
to be paid (thus, the depth of the market for high quality corporate bonds should be assessed at
currency level).
IAS 34 Interim Financial Reporting
The amendment clarifies the meaning of 'elsewhere in the interim report' and requires a cross-
reference.
Amendments to IFRS 11 Joint Arrangements: Accounting for Acquisitions of Interests
The amendments to IFRS 11 require that a joint operator accounting for the acquisition of an in-
terest in a joint operation, in which the activity of the joint operation constitutes a business must
apply the relevant IFRS 3 principles for business combinations accounting. The amendments also
clarify that a previously held interest in a joint operation is not remeasured on the acquisition of
an additional interest in the same joint operation while joint control is retained. In addition, scope
exclusion has been added to IFRS 11 to specify that the amendments do not apply when the par-
ties sharing joint control, including the reporting entity, are under common control of the same
ultimate controlling party.
Amendments to IAS 16 and IAS 38: Clarification of Acceptable Methods of Depreciation
and Amortisation
The amendments clarify the principle in IAS 16 and IAS 38 that revenue reflects a pattern of eco-
nomic benefits that are generated from operating a business (of which the asset is part) rather
than the economic benefits that are consumed through use of the asset.
Notes on pages 46-95 form an integral part of these consolidated financial statements

Ovostar Union N.V. Annual Report 2015 | 67
Management Report
Governance Report
FINANCIAL STATEMENTS
Other Information
NOTES TO CONSOLIDATED FINANCIAL STATEMENTS
(in USD thousand, unless otherwise stated)
As a result, a revenue-based method cannot be used to depreciate property, plant and equipment
and may only be used in very limited circumstances to amortise intangible assets. The amend-
ments have been endorsed by the EU. The effective date is 1 January 2016. These amendments
are not expected to have any impact to the Group given that the Group has not used a revenue-
based method to depreciate its non-current assets.
Amendments to IAS 16 and IAS 41 Agriculture: Bearer Plants
The amendments change the accounting requirements for biological assets that meet the defini-
tion of bearer plants. Under the amendments, biological assets that meet the definition of bearer
plants will no longer be within the scope of IAS 41. Instead, IAS 16 will apply. After initial recogni-
tion, bearer plants will be measured under IAS 16 at accumulated cost (before maturity) and us-
ing either the cost model or revaluation model (after maturity). The amendments also require
that produce that grows on bearer plants will remain in the scope of IAS 41 measured at fair value
less costs to sell. For government grants related to bearer plants, IAS 20 Accounting for Govern-
ment Grants and Disclosure of Government Assistance will apply. These improvements have been
endorsed by the EU. The effective date is 1 January 2016. These amendments are not expected to
have any impact to the Group as the Group does not have any bearer plants.
Amendments to IAS 27: Equity Method in Separate Financial Statements
The amendments will allow entities to use the equity method to account for investments in sub-
sidiaries, joint ventures and associates in their separate financial statements. Entities already ap-
plying IFRS and electing to change to the equity method in its separate financial statements will
have to apply that change retrospectively. For first-time adopters of IFRS electing to use the equi-
ty method in its separate financial statements, they will be required to apply this method from
the date of transition to IFRS. These improvements have been endorsed by the EU. The effective
date is 1 January 2016. These amendments will not have any impact on the Group’s consolidated
financial statements.
Amendments to IAS 1 Presentation of Financial Statements: Disclosure Initiative
The amendments aim at clarifying IAS 1 to address perceived impediments to preparers exercis-
ing their judgement in presenting their financial reports. These improvements have been en-
dorsed by the EU. The effective date is 1 January 2016. These improvements are not expected to
have a material impact on the Group.
Amendments to IFRS 10, IFRS 12 and IAS 28 Investment Entities: Applying the Consolida-
tion Exception
The amendments address issues that have arisen in the context of applying the consolidation ex-
ception for investment entities. These improvements have not been endorsed by the EU. The
IASB effective date is 1 January 2016. The Group is not an investing company and therefore the
amendment has no effect.
Notes on pages 46-95 form an integral part of these consolidated financial statements
Ovostar Union N.V. Annual Report 2015 | 68
Management Report
Governance Report
FINANCIAL STATEMENTS
Other Information
NOTES TO CONSOLIDATED FINANCIAL STATEMENTS
(in USD thousand, unless otherwise stated)
The following new or amended standards are not expected to have a significant impact on consol-
idated financial statements:
— Amendments to IAS 12: Recognition of Deferred Tax Assets for Unrealised Losses (issued
on 19 January 2016);
— Amendments to IAS 7: Disclosure Initiative (issued on 29 January 2016).
Adoption of new and revised standards and interpretations
The Group has adopted the following amended IFRS and IFRIC which are effective for annual peri-
ods beginning on or after 1 January 2015:
Amendments to IAS 19 Defined Benefit Plans: Employee Contributions
IAS 19 requires an entity to consider contributions from employees or third parties when ac-
counting for defined benefit plans. Where the contributions are linked to service, they should be
attributed to periods of service as a negative benefit. These amendments clarify that, if the
amount of the contributions is independent of the number of years of service, an entity is per-
mitted to recognise such contributions as a reduction in the service cost in the period in which the
service is rendered, instead of allocating the contributions to the periods of service. This amend-
ment is effective for annual periods beginning on or after 1 February 2015. It is not expected that
this amendment would be relevant to the Group, since none of the entities within the Group has
defined benefit plans with contributions from employees or third parties.
Annual improvements 2010-2012 Cycle
These improvements are effective from 1 February 2015 and are not expected to have a material
impact on the Group, except for the potential effect on disclosures. The improvements include:
IFRS 2 Share-based Payment
This improvement is applied prospectively and clarifies various issues relating to the definitions of
performance and service conditions which are vesting conditions, including:
— A performance condition must contain a service condition
— A performance target must be met while the counterparty is rendering service
— A performance target may relate to the operations or activities of an entity, or to those
of another entity in the same group
— A performance condition may be a market or non-market condition
If the counterparty, regardless of the reason, ceases to provide service during the vesting period,
the service condition is not satisfied.
Notes on pages 46-95 form an integral part of these consolidated financial statements
Ovostar Union N.V. Annual Report 2015 | 69
Management Report
Governance Report
FINANCIAL STATEMENTS
Other Information
NOTES TO CONSOLIDATED FINANCIAL STATEMENTS
(in USD thousand, unless otherwise stated)
IFRS 3 Business Combinations
The amendment is applied prospectively and clarifies that all contingent consideration arrange-
ments classified as liabilities (or assets) arising from a business combination should be subse-
quently measured at fair value through profit or loss whether or not they fall within the scope of
IFRS 9 (or IAS 39, as applicable).
IFRS 8 Operating Segments
The amendments are applied retrospectively and clarifies that:
— An entity must disclose the judgements made by management in applying the aggrega-
tion criteria in paragraph 12 of IFRS 8, including a brief description of operating segments
that have been aggregated and the economic characteristics (e.g., sales and gross mar-
gins) used to assess whether the segments are ‘similar’
— The reconciliation of segment assets to total assets is only required to be disclosed if the
reconciliation is reported to the chief operating decision maker, similar to the required
disclosure for segment liabilities.
IFRS 13 Fair Value Measurement
(amendments to the basis of conclusions only, with consequential amendments to the bases of
conclusions of other standards)
The amendments clarifies that issuing IFRS 13 and amending IFRS 9 and IAS 39 did not remove the
ability to measure short-term receivables and payables with no stated interest rate at their in-
voice amounts without discounting if the effect of not discounting is immaterial.
IAS 16 Property, Plant and Equipment and IAS 38 Intangible Assets
The amendment is applied retrospectively and clarifies in IAS 16 and IAS 38 that the asset may be
revalued by reference to observable data on either the gross or the net carrying amount. In addi-
tion, the accumulated depreciation or amortisation is the difference between the gross and carry-
ing amounts of the asset.
IAS 24 Related Party Disclosures
The amendment is applied retrospectively and clarifies that a management entity (an entity that
provides key management personnel services) is a related party subject to the related party dis-
closures. In addition, an entity that uses a management entity is required to disclose the expenses
incurred for management services.
Annual improvements 2011-2013 Cycle
These improvements are effective from 1 February 2015 and are not expected to have a material
impact on the Group. They include:
Notes on pages 46-95 form an integral part of these consolidated financial statements
Ovostar Union N.V. Annual Report 2015 | 70
Management Report
Governance Report
FINANCIAL STATEMENTS
Other Information
NOTES TO CONSOLIDATED FINANCIAL STATEMENTS
(in USD thousand, unless otherwise stated)
IFRS 3 Business Combinations
The amendment is applied prospectively and clarifies for the scope exceptions within IFRS 3 that:
— Joint arrangements, not just joint ventures, are outside the scope of IFRS 3
— This scope exception applies only to the accounting in the financial statements of the
joint arrangement itself.
IFRS 13 Fair Value Measurement
The amendment is applied prospectively and clarifies that the portfolio exception in IFRS 13 can
be applied not only to financial assets and financial liabilities, but also to other contracts within
the scope of IFRS 9 (or IAS 39, as applicable).
IAS 40 Investment Property
The description of ancillary services in IAS 40 differentiates between investment property and
owner-occupied property (i.e., property, plant and equipment). The amendment is applied pro-
spectively and clarifies that IFRS 3, and not the description of ancillary services in IAS 40, is used
to determine if the transaction is the purchase of an asset or business combination.
7. Subsidiaries and Non-controlling interests
As at 31 December 2015 and 2014 the Group included the following subsidiaries:
Name of the company Business activities As at 31 De-
cember 2015 As at 31 De-
cember 2014
Limited Liability Company “Ovostar Union”
Strategic management of subsidiary companies in Ukraine
100.0% 100.0%
Limited Liability Company “Yasensvit”
Breeder farms, production of hatching eggs, farms for growing young laying flock and for laying flock, production and distribution of shell eggs, poultry feed production
98.0% 98.0%
Limited Liability Company “Ovostar”
Egg-products production and distribu-tion
100.0% 100.0%
Public Joint Stock Company “Poultry Farm Ukraine”
Production of shell eggs, assets holding 92.0% 92.0%
Public Joint Stock Company “Malynove”
Production of shell eggs, assets holding 94.0% 94.0%
Public Joint Stock Company “Krushynskyy Poultry Complex”
Trading company, egg trading – non operational activity
76.0% 76.0%
Limited Liability Company “Skybynskyy Fodder Plant”
In the process of liquidation 98.6% 98.6%
Notes on pages 46-95 form an integral part of these consolidated financial statements
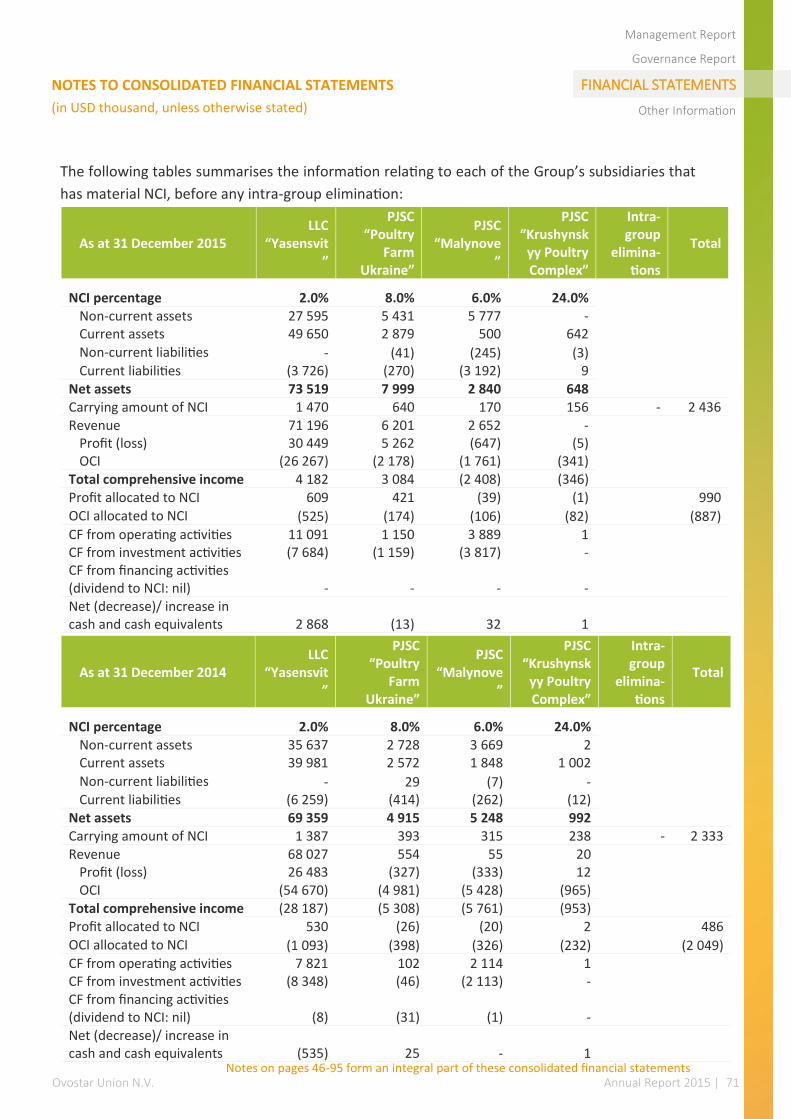
Ovostar Union N.V. Annual Report 2015 | 71
Notes on pages 46-95 form an integral part of these consolidated financial statements
Management Report
Governance Report
FINANCIAL STATEMENTS
Other Information
NOTES TO CONSOLIDATED FINANCIAL STATEMENTS
(in USD thousand, unless otherwise stated)
The following tables summarises the information relating to each of the Group’s subsidiaries that
has material NCI, before any intra-group elimination:
As at 31 December 2015 LLC
“Yasensvit”
PJSC “Poultry
Farm Ukraine”
PJSC “Malynove
”
PJSC “Krushynsk
yy Poultry Complex”
Intra-group
elimina-tions
Total
NCI percentage 2.0% 8.0% 6.0% 24.0% Non-current assets 27 595 5 431 5 777 - Current assets 49 650 2 879 500 642
Non-current liabilities - (41) (245) (3)
Current liabilities (3 726) (270) (3 192) 9 Net assets 73 519 7 999 2 840 648 Carrying amount of NCI 1 470 640 170 156 - 2 436 Revenue 71 196 6 201 2 652 -
Profit (loss) 30 449 5 262 (647) (5) OCI (26 267) (2 178) (1 761) (341)
Total comprehensive income 4 182 3 084 (2 408) (346) Profit allocated to NCI 609 421 (39) (1) 990
OCI allocated to NCI (525) (174) (106) (82) (887) CF from operating activities 11 091 1 150 3 889 1 CF from investment activities (7 684) (1 159) (3 817) - CF from financing activities (dividend to NCI: nil) - - - - Net (decrease)/ increase in cash and cash equivalents 2 868 (13) 32 1
As at 31 December 2014 LLC
“Yasensvit”
PJSC “Poultry
Farm Ukraine”
PJSC “Malynove
”
PJSC “Krushynsk
yy Poultry Complex”
Intra-group
elimina-tions
Total
NCI percentage 2.0% 8.0% 6.0% 24.0% Non-current assets 35 637 2 728 3 669 2 Current assets 39 981 2 572 1 848 1 002
Non-current liabilities - 29 (7) - Current liabilities (6 259) (414) (262) (12)
Net assets 69 359 4 915 5 248 992 Carrying amount of NCI 1 387 393 315 238 - 2 333 Revenue 68 027 554 55 20
Profit (loss) 26 483 (327) (333) 12 OCI (54 670) (4 981) (5 428) (965)
Total comprehensive income (28 187) (5 308) (5 761) (953) Profit allocated to NCI 530 (26) (20) 2 486 OCI allocated to NCI (1 093) (398) (326) (232) (2 049) CF from operating activities 7 821 102 2 114 1 CF from investment activities (8 348) (46) (2 113) - CF from financing activities (dividend to NCI: nil) (8) (31) (1) - Net (decrease)/ increase in cash and cash equivalents (535) 25 - 1

Ovostar Union N.V. Annual Report 2015 | 72
Management Report
Governance Report
FINANCIAL STATEMENTS
Other Information
NOTES TO CONSOLIDATED FINANCIAL STATEMENTS
(in USD thousand, unless otherwise stated)
8. Segment information
All of the Group’s operations are located within Ukraine.
Segment information is analyzed on the basis of the types of goods supplied by the Group’s oper-
ating divisions. The Group’s reportable segments under IFRS 8 are therefore as follows:
The accounting policies of the reportable segments are the same as the Group’s accounting poli-
cies described in Note 5. Sales between segments are mainly carried out at market prices. Oper-
ating profit before tax represents segment result. This is the measure reported to the chief oper-
ating decision maker for the purposes of resource allocation and assessment of segment perfor-
mance.
For the purposes of monitoring segment performance and allocating resources between seg-
ments:
All assets are allocated to reportable segments.
All liabilities are allocated to reportable segments.
The following table presents revenue, results of operations and certain assets and liabilities infor-
mation regarding segments for the year ended 31 December 2015 and 2014:
In 2015 and 2014 no sales were settled by barter transactions.
Egg operations segment sales of egg
sales of chicken meat
Egg products operations segment sales of egg processing products
Oilseed operations segment sales of sunflower oil, rapeseed oil and related products
For the year ended 31 December 2015
Operations segment Consolidated
Egg Egg products Oilseed
Revenue 94 354 23 001 3 427 120 782 Inter-segment revenue (38 802) (4 827) (1 547) (45 176) Revenue from external buyers 55 552 18 174 1 880 75 606
Profit before tax 28 408 4 244 - 32 652
For the year ended 31 December 2014
Operations segment Consolidated
Egg Egg products Oilseed
Revenue 75 172 24 341 5 102 104 615 Inter-segment revenue (23 807) (4 315) (1 713) (29 835) Revenue from external buyers 51 365 20 026 3 389 74 780
Profit before tax 19 829 6 175 - 26 004
Notes on pages 46-95 form an integral part of these consolidated financial statements
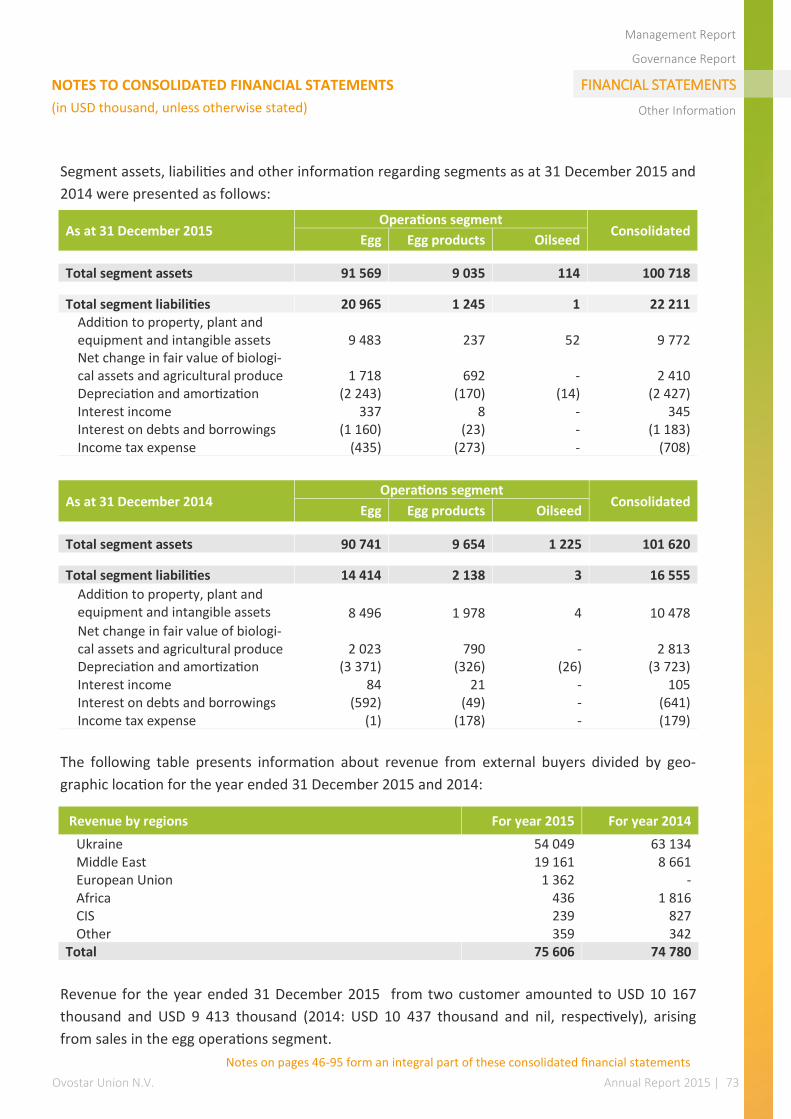
Ovostar Union N.V. Annual Report 2015 | 73
Management Report
Governance Report
FINANCIAL STATEMENTS
Other Information
NOTES TO CONSOLIDATED FINANCIAL STATEMENTS
(in USD thousand, unless otherwise stated)
Segment assets, liabilities and other information regarding segments as at 31 December 2015 and
2014 were presented as follows:
The following table presents information about revenue from external buyers divided by geo-
graphic location for the year ended 31 December 2015 and 2014:
Revenue for the year ended 31 December 2015 from two customer amounted to USD 10 167
thousand and USD 9 413 thousand (2014: USD 10 437 thousand and nil, respectively), arising
from sales in the egg operations segment.
As at 31 December 2015 Operations segment
Consolidated Egg Egg products Oilseed
Total segment assets 91 569 9 035 114 100 718
Total segment liabilities 20 965 1 245 1 22 211 Addition to property, plant and equipment and intangible assets 9 483 237 52 9 772 Net change in fair value of biologi-cal assets and agricultural produce 1 718 692 - 2 410 Depreciation and amortization (2 243) (170) (14) (2 427) Interest income 337 8 - 345 Interest on debts and borrowings (1 160) (23) - (1 183) Income tax expense (435) (273) - (708)
As at 31 December 2014 Operations segment
Consolidated Egg Egg products Oilseed
Total segment assets 90 741 9 654 1 225 101 620
Total segment liabilities 14 414 2 138 3 16 555
Addition to property, plant and equipment and intangible assets 8 496 1 978 4 10 478 Net change in fair value of biologi-cal assets and agricultural produce 2 023 790 - 2 813 Depreciation and amortization (3 371) (326) (26) (3 723) Interest income 84 21 - 105 Interest on debts and borrowings (592) (49) - (641) Income tax expense (1) (178) - (179)
Revenue by regions For year 2015 For year 2014
Ukraine 54 049 63 134 Middle East 19 161 8 661 European Union 1 362 - Africa 436 1 816 CIS 239 827 Other 359 342
Total 75 606 74 780
Notes on pages 46-95 form an integral part of these consolidated financial statements

Ovostar Union N.V. Annual Report 2015 | 74
Management Report
Governance Report
FINANCIAL STATEMENTS
Other Information
NOTES TO CONSOLIDATED FINANCIAL STATEMENTS
(in USD thousand, unless otherwise stated)
9. Cost of sales
10. Selling and distribution costs
11. Administrative expenses
12. Other operating income
Recovery of assets previously written-off mainly represents amounts of inventory surplus identi-
fied in the reporting period during the stock-taking and recovery of amounts previously recog-
nized as doubtful.
For year 2015 For year 2014
Costs of inventories recognised as an expense (35 245) (35 707) Packaging costs (4 114) (4 633) Wages, salaries and social security costs (3 015) (5 109) Amortisation, depreciation and impairment (2 273) (3 585) Other expenses (954) (1 744)
Total (45 601) (50 778)
For year 2015 For year 2014
Transportation expenses (1 452) (1 175) Wages, salaries and social security costs (256) (169) Cost of materials (205) (312) Marketing and advertising expenses (45) (144) Amortisation, depreciation and impairment (11) (17) Other expenses (619) (438)
Total (2 588) (2 255)
For year 2015 For year 2014
Wages, salaries and social security costs (402) (592)
Legal, audit and other professional fees (249) (270) Service charge expenses (253) (284) Cost of materials (100) (139) Amortisation, depreciation and impairment (143) (121) Other expenses (90) (74)
Total (1 237) (1 480)
Note For year 2015 For year 2014
Income from refund under the special legislation: Income from special VAT treatment a) 4 514 2 539
Total income from refund under the special legislation 4 514 2 539 Gain on recovery of assets previously written off 237 122 Other income 52 42
Total 4 803 2 703
Notes on pages 46-95 form an integral part of these consolidated financial statements

Ovostar Union N.V. Annual Report 2015 | 75
Management Report
Governance Report
FINANCIAL STATEMENTS
Other Information
NOTES TO CONSOLIDATED FINANCIAL STATEMENTS
(in USD thousand, unless otherwise stated)
a) Income from special VAT treatment
According to the Tax Code of Ukraine, companies that generated not less than 75% of gross reve-
nues for the previous tax year from sales of own agricultural products are entitled to retain VAT
on sales products, net of VAT paid on purchases, for use in agricultural production. In accordance
with the Tax Code, the VAT rate is currently effective at 20%.
Included in VAT refunds for the years ended 31 December 2015, 2014 were specific VAT subsidies
for the production and sale of eggs and egg products for further processing.
In accordance with the new legislation (the Law “On amending the Tax Code of Ukraine and cer-
tain legislative acts of Ukraine in terms of ensuring the balanced budget receipts in 2016” was
adopted effective 1 January 2016), agricultural producers will be entitled to retain only a portion
of VAT on agricultural operations. Producers of shell eggs, poultry and other agriculture producers
shall retain VAT in a portion of 50%.
All members of the Group qualify for the use of VAT benefits except for Limited Liability Company
“Ovostar”, Open Joint Stock Company “Krushynskyy Poultry Complex”, Limited Liability Company
“Skybynskyy Fodder Plant”, Limited Liability Company “Ovostar Union”, Public Joint Stock Compa-
ny “Malynove”.
Reconciliation of VAT refunds for the year ended 31 December 2015, 2014 was presented as fol-
lows:
13. Other operating expenses
For year 2015 For year 2014
As at 01 January 1 3 Received during the year 4 515 2 538 Released to the statement of comprehensive income (4 514) (2 539) Exchange differences (2) (1)
As at 31 December - 1 Current - 1 Non-current - -
For year 2015 For year 2014
Impairment of doubtful accounts receivable and prepayments to suppliers
(292) (243)
VAT writtеn-off (627) (84) Fines and penalties (29) (47) Loss on disposal of inventories - (4) Other expenses (62) (23)
Total (1 010) (401)
Notes on pages 46-95 form an integral part of these consolidated financial statements
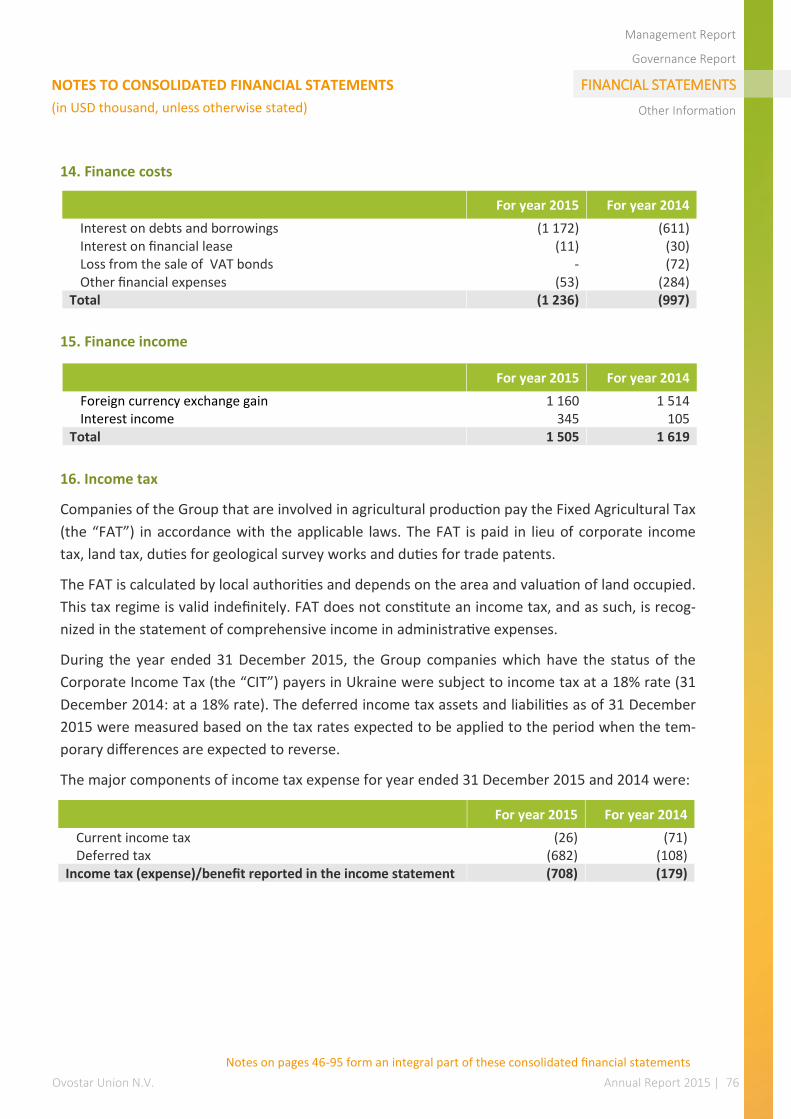
Ovostar Union N.V. Annual Report 2015 | 76
Management Report
Governance Report
FINANCIAL STATEMENTS
Other Information
NOTES TO CONSOLIDATED FINANCIAL STATEMENTS
(in USD thousand, unless otherwise stated)
14. Finance costs
15. Finance income
16. Income tax
Companies of the Group that are involved in agricultural production pay the Fixed Agricultural Tax
(the “FAT”) in accordance with the applicable laws. The FAT is paid in lieu of corporate income
tax, land tax, duties for geological survey works and duties for trade patents.
The FAT is calculated by local authorities and depends on the area and valuation of land occupied.
This tax regime is valid indefinitely. FAT does not constitute an income tax, and as such, is recog-
nized in the statement of comprehensive income in administrative expenses.
During the year ended 31 December 2015, the Group companies which have the status of the
Corporate Income Tax (the “CIT”) payers in Ukraine were subject to income tax at a 18% rate (31
December 2014: at a 18% rate). The deferred income tax assets and liabilities as of 31 December
2015 were measured based on the tax rates expected to be applied to the period when the tem-
porary differences are expected to reverse.
The major components of income tax expense for year ended 31 December 2015 and 2014 were:
For year 2015 For year 2014
Foreign currency exchange gain 1 160 1 514 Interest income 345 105
Total 1 505 1 619
For year 2015 For year 2014
Current income tax (26) (71) Deferred tax (682) (108)
Income tax (expense)/benefit reported in the income statement (708) (179)
For year 2015 For year 2014
Interest on debts and borrowings (1 172) (611) Interest on financial lease (11) (30) Loss from the sale of VAT bonds - (72) Other financial expenses (53) (284)
Total (1 236) (997)
Notes on pages 46-95 form an integral part of these consolidated financial statements
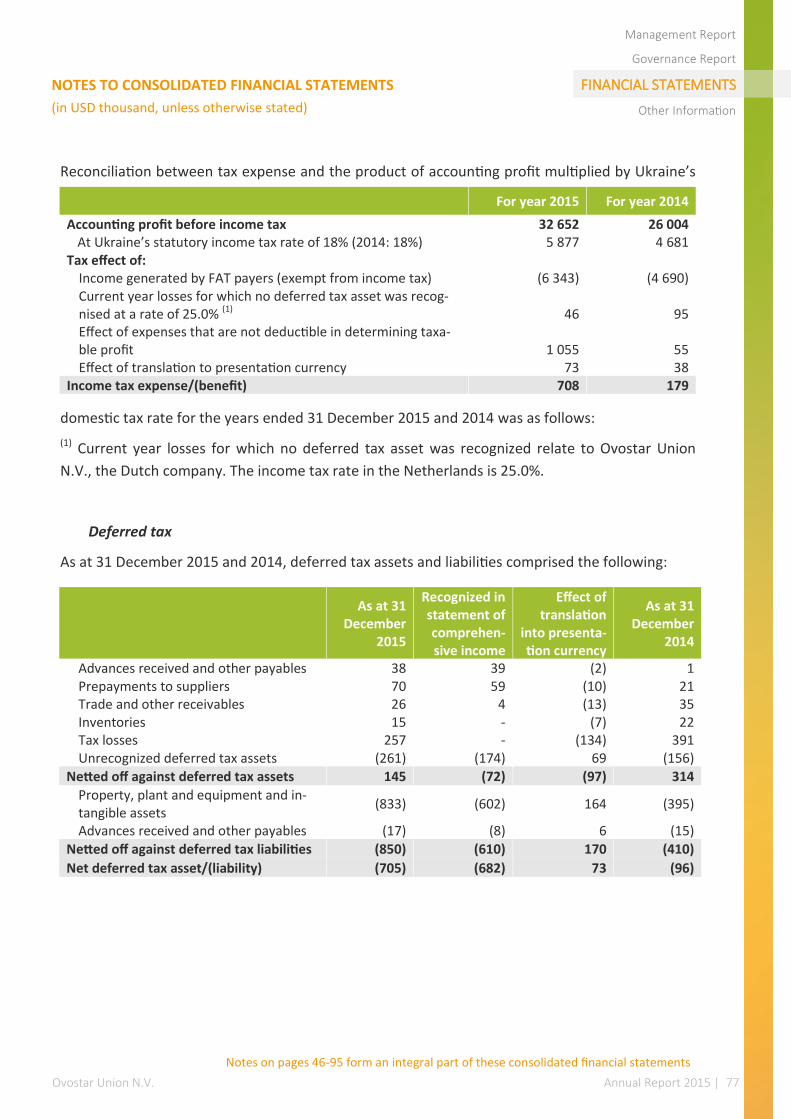
Ovostar Union N.V. Annual Report 2015 | 77
Management Report
Governance Report
FINANCIAL STATEMENTS
Other Information
NOTES TO CONSOLIDATED FINANCIAL STATEMENTS
(in USD thousand, unless otherwise stated)
Reconciliation between tax expense and the product of accounting profit multiplied by Ukraine’s
domestic tax rate for the years ended 31 December 2015 and 2014 was as follows:
(1) Current year losses for which no deferred tax asset was recognized relate to Ovostar Union
N.V., the Dutch company. The income tax rate in the Netherlands is 25.0%.
Deferred tax
As at 31 December 2015 and 2014, deferred tax assets and liabilities comprised the following:
As at 31
December 2015
Recognized in statement of comprehen-sive income
Effect of translation
into presenta-tion currency
As at 31 December
2014
Advances received and other payables 38 39 (2) 1 Prepayments to suppliers 70 59 (10) 21 Trade and other receivables 26 4 (13) 35 Inventories 15 - (7) 22 Tax losses 257 - (134) 391 Unrecognized deferred tax assets (261) (174) 69 (156)
Netted off against deferred tax assets 145 (72) (97) 314
Property, plant and equipment and in-tangible assets
(833) (602) 164 (395)
Advances received and other payables (17) (8) 6 (15) Netted off against deferred tax liabilities (850) (610) 170 (410)
Net deferred tax asset/(liability) (705) (682) 73 (96)
For year 2015 For year 2014
Accounting profit before income tax 32 652 26 004 At Ukraine’s statutory income tax rate of 18% (2014: 18%) 5 877 4 681
Tax effect of: Income generated by FAT payers (exempt from income tax) (6 343) (4 690) Current year losses for which no deferred tax asset was recog-nised at a rate of 25.0% (1) 46 95 Effect of expenses that are not deductible in determining taxa-ble profit 1 055 55 Effect of translation to presentation currency 73 38
Income tax expense/(benefit) 708 179
Notes on pages 46-95 form an integral part of these consolidated financial statements

Ovostar Union N.V. Annual Report 2015 | 78
Management Report
Governance Report
FINANCIAL STATEMENTS
Other Information
NOTES TO CONSOLIDATED FINANCIAL STATEMENTS
(in USD thousand, unless otherwise stated)
Deferred income tax assets and liabilities are offset when there is a legally enforceable right to set
off current tax assets against current tax liabilities and when the deferred income taxes relate to
the same fiscal authority. The following amounts, determined after appropriate offsetting, are
presented in the consolidated balance sheet as at 31 December 2015 and 2014:
17. Biological assets
As at 31 December 2015 and 2014 commercial and replacement poultry were presented as fol-
lows:
As at 31 Decem-
ber 2015 As at 31 De-
cember 2014 Non-current assets 145 314 Long term liabilities (850) (410)
Net deferred tax asset/(liability) (705) (96)
As at 31
December 2014
Recognized in statement of comprehen-sive income
Effect of translation
into presenta-tion currency
As at 31 December
2013
Advances received and other payables 1 (7) (5) 13 Prepayments to suppliers 21 7 (17) 31 Trade and other receivables 35 15 (26) 46 Inventories 22 (31) (37) 90 Property, plant and equipment and in-tangible assets
- (12) (7) 19
Tax losses 391 58 (353) 686 Unrecognized deferred tax assets (156) (195) 55 (16)
Netted off against deferred tax assets 314 (165) (390) 869
Property, plant and equipment and in-tangible assets
(395) 49 409 (853)
Prepayments to suppliers - 5 2 (7) Advances received and other payables (15) 3 16 (34)
Netted off against deferred tax liabilities (410) 57 427 (894)
Net deferred tax asset/(liability) (96) (108) 37 (25)
As at 31 December 2015 As at 31 December 2014
Number, thou-
sand heads Carrying
value Number, thou-
sand heads Carrying
value Non-current biological assets
Replacement poultry
Hy-line 3 947 26 041 3 262 27 356 Total non-current biological assets 3 947 26 041 3 262 27 356
Current biological assets Commercial poultry Hy-line 2 547 8 409 2 250 9 745 Hy-sex - - 95 77
Total current biological assets 2 547 8 409 2 345 9 822 Total biological assets 6 494 34 450 5 607 37 178
Notes on pages 46-95 form an integral part of these consolidated financial statements
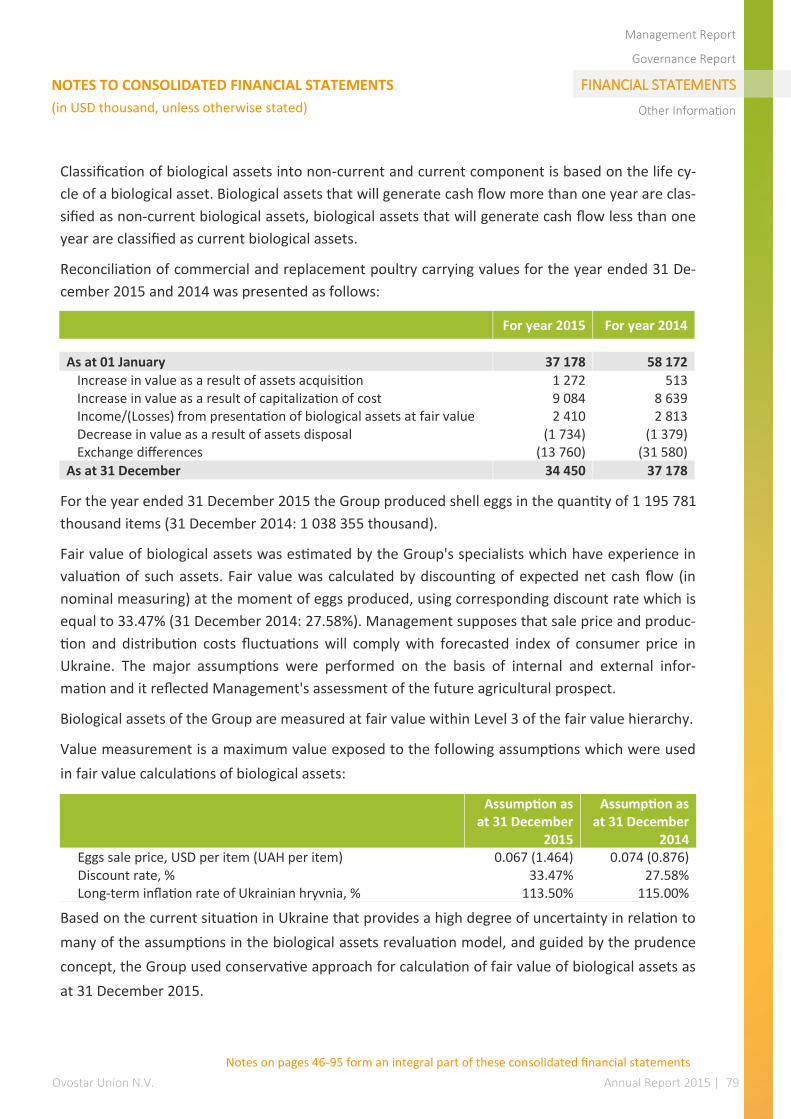
Ovostar Union N.V. Annual Report 2015 | 79
Management Report
Governance Report
FINANCIAL STATEMENTS
Other Information
NOTES TO CONSOLIDATED FINANCIAL STATEMENTS
(in USD thousand, unless otherwise stated)
Classification of biological assets into non-current and current component is based on the life cy-
cle of a biological asset. Biological assets that will generate cash flow more than one year are clas-
sified as non-current biological assets, biological assets that will generate cash flow less than one
year are classified as current biological assets.
Reconciliation of commercial and replacement poultry carrying values for the year ended 31 De-
cember 2015 and 2014 was presented as follows:
For the year ended 31 December 2015 the Group produced shell eggs in the quantity of 1 195 781
thousand items (31 December 2014: 1 038 355 thousand).
Fair value of biological assets was estimated by the Group's specialists which have experience in
valuation of such assets. Fair value was calculated by discounting of expected net cash flow (in
nominal measuring) at the moment of eggs produced, using corresponding discount rate which is
equal to 33.47% (31 December 2014: 27.58%). Management supposes that sale price and produc-
tion and distribution costs fluctuations will comply with forecasted index of consumer price in
Ukraine. The major assumptions were performed on the basis of internal and external infor-
mation and it reflected Management's assessment of the future agricultural prospect.
Biological assets of the Group are measured at fair value within Level 3 of the fair value hierarchy.
Value measurement is a maximum value exposed to the following assumptions which were used
in fair value calculations of biological assets:
Based on the current situation in Ukraine that provides a high degree of uncertainty in relation to
many of the assumptions in the biological assets revaluation model, and guided by the prudence
concept, the Group used conservative approach for calculation of fair value of biological assets as
at 31 December 2015.
For year 2015 For year 2014
As at 01 January 37 178 58 172
Increase in value as a result of assets acquisition 1 272 513 Increase in value as a result of capitalization of cost 9 084 8 639 Income/(Losses) from presentation of biological assets at fair value 2 410 2 813 Decrease in value as a result of assets disposal (1 734) (1 379) Exchange differences (13 760) (31 580)
As at 31 December 34 450 37 178
Assumption as
at 31 December 2015
Assumption as at 31 December
2014 Eggs sale price, USD per item (UAH per item) 0.067 (1.464) 0.074 (0.876) Discount rate, % 33.47% 27.58% Long-term inflation rate of Ukrainian hryvnia, % 113.50% 115.00%
Notes on pages 46-95 form an integral part of these consolidated financial statements
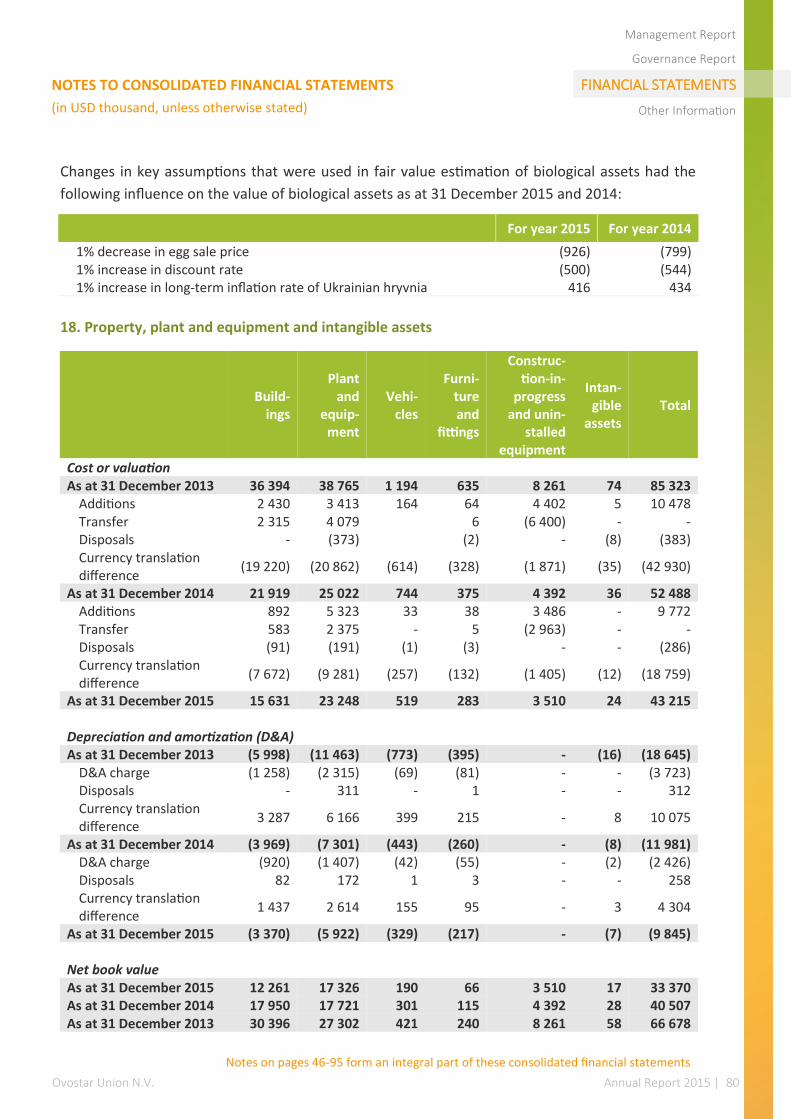
Ovostar Union N.V. Annual Report 2015 | 80
Management Report
Governance Report
FINANCIAL STATEMENTS
Other Information
NOTES TO CONSOLIDATED FINANCIAL STATEMENTS
(in USD thousand, unless otherwise stated)
Changes in key assumptions that were used in fair value estimation of biological assets had the
following influence on the value of biological assets as at 31 December 2015 and 2014:
18. Property, plant and equipment and intangible assets
For year 2015 For year 2014
1% decrease in egg sale price (926) (799) 1% increase in discount rate (500) (544) 1% increase in long-term inflation rate of Ukrainian hryvnia 416 434
Build-
ings
Plant and
equip-ment
Vehi-cles
Furni-ture and
fittings
Construc-tion-in-
progress and unin-
stalled equipment
Intan-gible
assets Total
Cost or valuation As at 31 December 2013 36 394 38 765 1 194 635 8 261 74 85 323
Additions 2 430 3 413 164 64 4 402 5 10 478 Transfer 2 315 4 079 6 (6 400) - - Disposals - (373) (2) - (8) (383) Currency translation difference
(19 220) (20 862) (614) (328) (1 871) (35) (42 930)
As at 31 December 2014 21 919 25 022 744 375 4 392 36 52 488 Additions 892 5 323 33 38 3 486 - 9 772 Transfer 583 2 375 - 5 (2 963) - - Disposals (91) (191) (1) (3) - - (286) Currency translation difference
(7 672) (9 281) (257) (132) (1 405) (12) (18 759)
As at 31 December 2015 15 631 23 248 519 283 3 510 24 43 215
Depreciation and amortization (D&A) As at 31 December 2013 (5 998) (11 463) (773) (395) - (16) (18 645)
D&A charge (1 258) (2 315) (69) (81) - - (3 723) Disposals - 311 - 1 - - 312 Currency translation difference
3 287 6 166 399 215 - 8 10 075
As at 31 December 2014 (3 969) (7 301) (443) (260) - (8) (11 981) D&A charge (920) (1 407) (42) (55) - (2) (2 426) Disposals 82 172 1 3 - - 258 Currency translation difference
1 437 2 614 155 95 - 3 4 304
As at 31 December 2015 (3 370) (5 922) (329) (217) - (7) (9 845)
Net book value As at 31 December 2015 12 261 17 326 190 66 3 510 17 33 370 As at 31 December 2014 17 950 17 721 301 115 4 392 28 40 507 As at 31 December 2013 30 396 27 302 421 240 8 261 58 66 678
Notes on pages 46-95 form an integral part of these consolidated financial statements
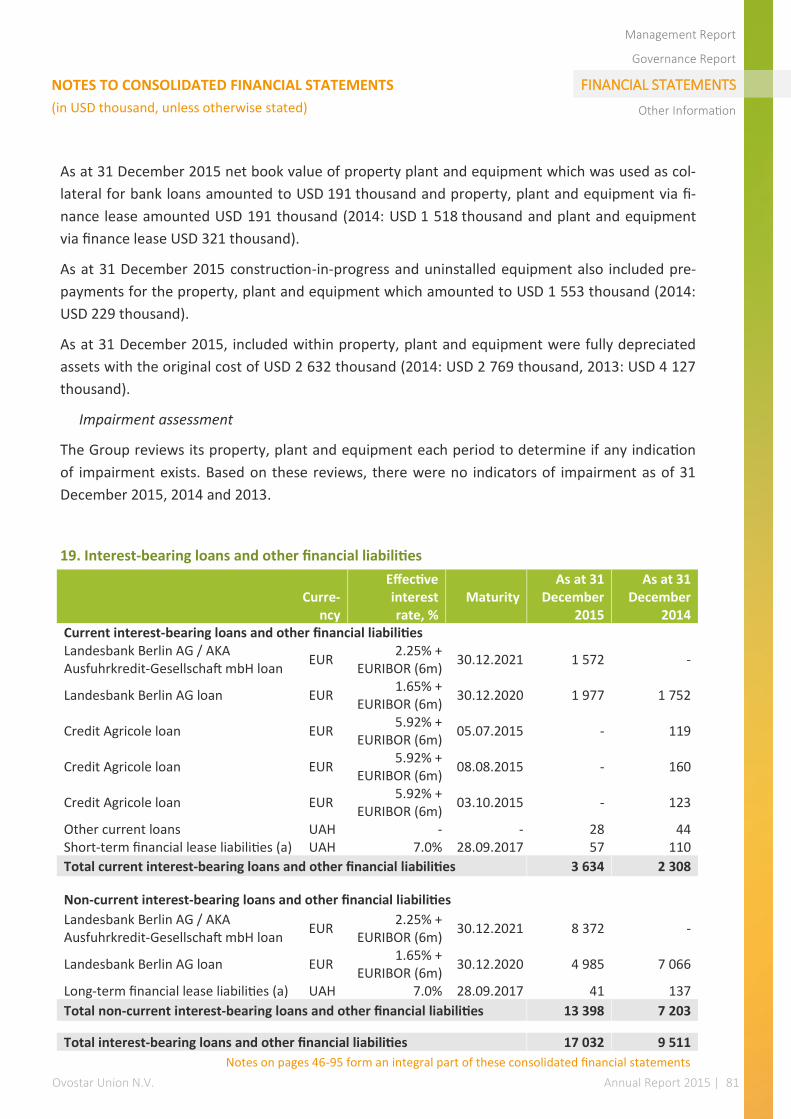
Ovostar Union N.V. Annual Report 2015 | 81
Management Report
Governance Report
FINANCIAL STATEMENTS
Other Information
NOTES TO CONSOLIDATED FINANCIAL STATEMENTS
(in USD thousand, unless otherwise stated)
As at 31 December 2015 net book value of property plant and equipment which was used as col-
lateral for bank loans amounted to USD 191 thousand and property, plant and equipment via fi-
nance lease amounted USD 191 thousand (2014: USD 1 518 thousand and plant and equipment
via finance lease USD 321 thousand).
As at 31 December 2015 construction-in-progress and uninstalled equipment also included pre-
payments for the property, plant and equipment which amounted to USD 1 553 thousand (2014:
USD 229 thousand).
As at 31 December 2015, included within property, plant and equipment were fully depreciated
assets with the original cost of USD 2 632 thousand (2014: USD 2 769 thousand, 2013: USD 4 127
thousand).
Impairment assessment
The Group reviews its property, plant and equipment each period to determine if any indication
of impairment exists. Based on these reviews, there were no indicators of impairment as of 31
December 2015, 2014 and 2013.
19. Interest-bearing loans and other financial liabilities
Curre-
ncy
Effective interest rate, %
Maturity As at 31
December 2015
As at 31 December
2014 Current interest-bearing loans and other financial liabilities Landesbank Berlin AG / AKA Ausfuhrkredit-Gesellschaft mbH loan
EUR 2.25% +
EURIBOR (6m) 30.12.2021 1 572 -
Landesbank Berlin AG loan EUR 1.65% +
EURIBOR (6m) 30.12.2020 1 977 1 752
Credit Agricole loan EUR 5.92% +
EURIBOR (6m) 05.07.2015 - 119
Credit Agricole loan EUR 5.92% +
EURIBOR (6m) 08.08.2015 - 160
Credit Agricole loan EUR 5.92% +
EURIBOR (6m) 03.10.2015 - 123
Other current loans UAH - - 28 44 Short-term financial lease liabilities (a) UAH 7.0% 28.09.2017 57 110
Total current interest-bearing loans and other financial liabilities 3 634 2 308
Non-current interest-bearing loans and other financial liabilities
Landesbank Berlin AG / AKA Ausfuhrkredit-Gesellschaft mbH loan
EUR 2.25% +
EURIBOR (6m) 30.12.2021 8 372 -
Landesbank Berlin AG loan EUR 1.65% +
EURIBOR (6m) 30.12.2020 4 985 7 066
Long-term financial lease liabilities (a) UAH 7.0% 28.09.2017 41 137
Total non-current interest-bearing loans and other financial liabilities 13 398 7 203
Total interest-bearing loans and other financial liabilities 17 032 9 511
Notes on pages 46-95 form an integral part of these consolidated financial statements
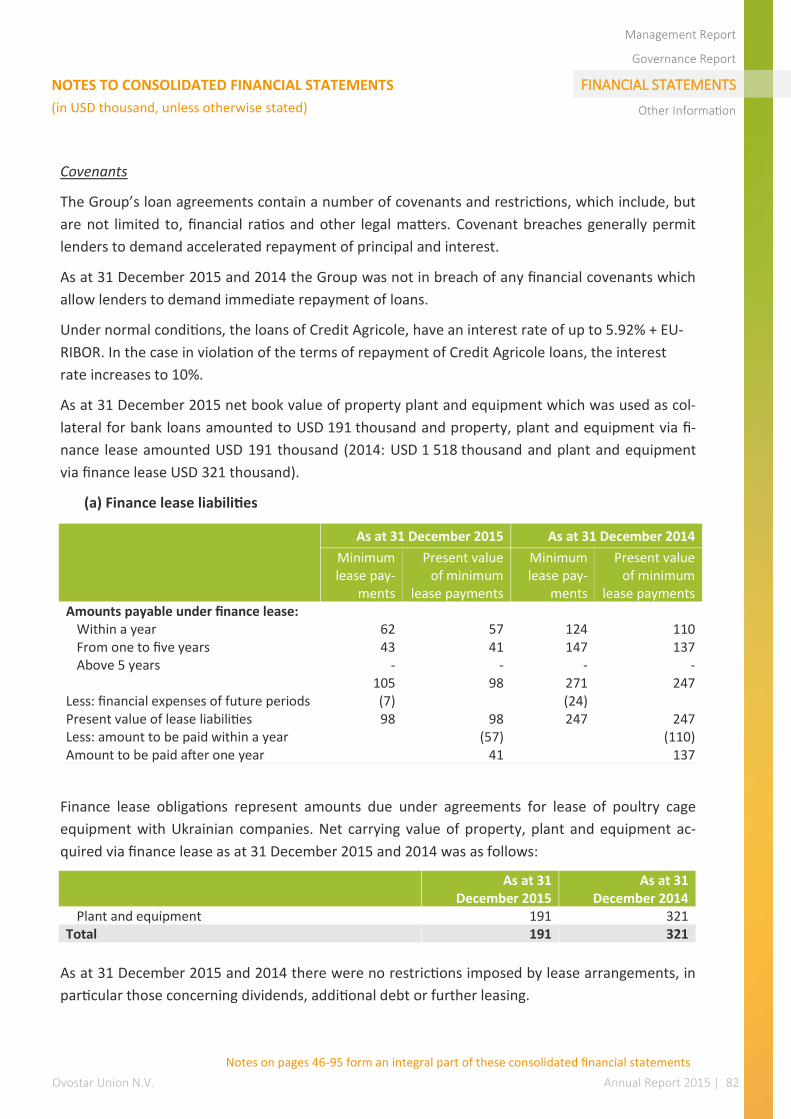
Ovostar Union N.V. Annual Report 2015 | 82
Management Report
Governance Report
FINANCIAL STATEMENTS
Other Information
NOTES TO CONSOLIDATED FINANCIAL STATEMENTS
(in USD thousand, unless otherwise stated)
Covenants
The Group’s loan agreements contain a number of covenants and restrictions, which include, but
are not limited to, financial ratios and other legal matters. Covenant breaches generally permit
lenders to demand accelerated repayment of principal and interest.
As at 31 December 2015 and 2014 the Group was not in breach of any financial covenants which
allow lenders to demand immediate repayment of loans.
Under normal conditions, the loans of Credit Agricole, have an interest rate of up to 5.92% + EU-
RIBOR. In the case in violation of the terms of repayment of Credit Agricole loans, the interest
rate increases to 10%.
As at 31 December 2015 net book value of property plant and equipment which was used as col-
lateral for bank loans amounted to USD 191 thousand and property, plant and equipment via fi-
nance lease amounted USD 191 thousand (2014: USD 1 518 thousand and plant and equipment
via finance lease USD 321 thousand).
(a) Finance lease liabilities
Finance lease obligations represent amounts due under agreements for lease of poultry cage
equipment with Ukrainian companies. Net carrying value of property, plant and equipment ac-
quired via finance lease as at 31 December 2015 and 2014 was as follows:
As at 31 December 2015 and 2014 there were no restrictions imposed by lease arrangements, in
particular those concerning dividends, additional debt or further leasing.
As at 31 December 2015 As at 31 December 2014
Minimum lease pay-
ments
Present value of minimum
lease payments
Minimum lease pay-
ments
Present value of minimum
lease payments Amounts payable under finance lease:
Within a year 62 57 124 110 From one to five years 43 41 147 137 Above 5 years - - - -
105 98 271 247 Less: financial expenses of future periods (7) (24) Present value of lease liabilities 98 98 247 247 Less: amount to be paid within a year (57) (110) Amount to be paid after one year 41 137
As at 31
December 2015 As at 31
December 2014 Plant and equipment 191 321
Total 191 321
Notes on pages 46-95 form an integral part of these consolidated financial statements
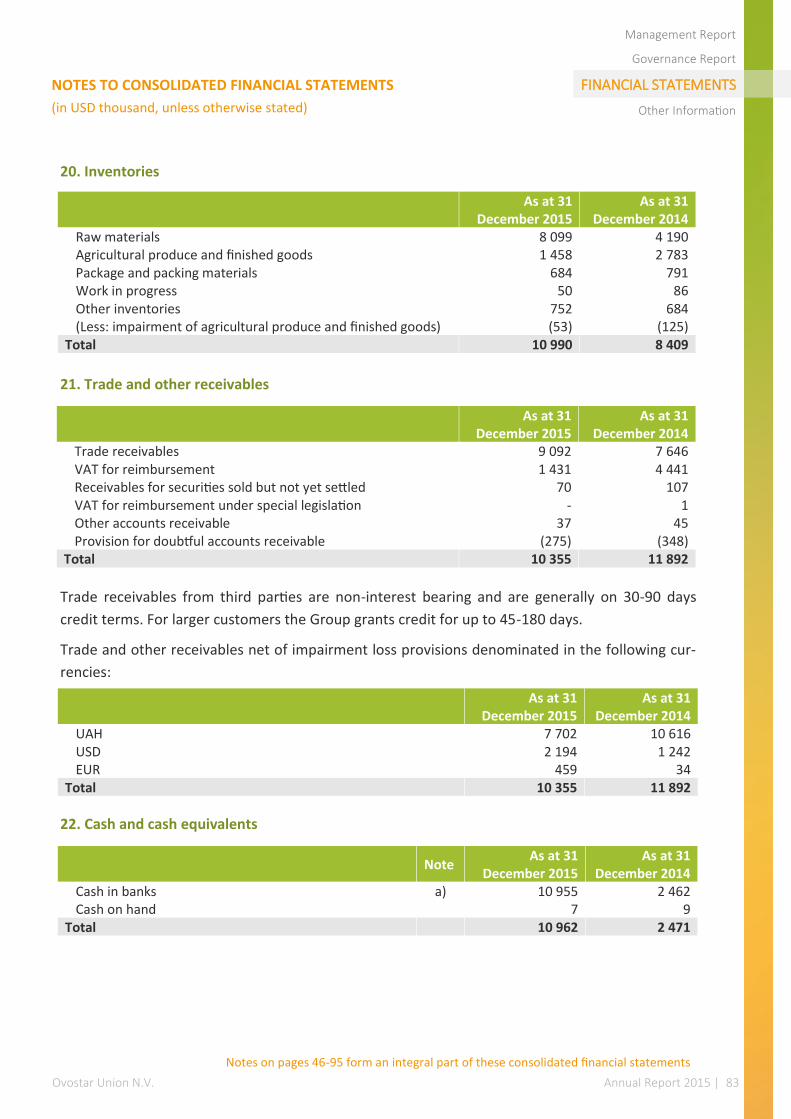
Ovostar Union N.V. Annual Report 2015 | 83
Management Report
Governance Report
FINANCIAL STATEMENTS
Other Information
NOTES TO CONSOLIDATED FINANCIAL STATEMENTS
(in USD thousand, unless otherwise stated)
20. Inventories
21. Trade and other receivables
Trade receivables from third parties are non-interest bearing and are generally on 30-90 days
credit terms. For larger customers the Group grants credit for up to 45-180 days.
Trade and other receivables net of impairment loss provisions denominated in the following cur-
rencies:
22. Cash and cash equivalents
As at 31
December 2015 As at 31
December 2014 Raw materials 8 099 4 190 Agricultural produce and finished goods 1 458 2 783 Package and packing materials 684 791 Work in progress 50 86 Other inventories 752 684 (Less: impairment of agricultural produce and finished goods) (53) (125)
Total 10 990 8 409
As at 31
December 2015 As at 31
December 2014 Trade receivables 9 092 7 646 VAT for reimbursement 1 431 4 441 Receivables for securities sold but not yet settled 70 107 VAT for reimbursement under special legislation - 1 Other accounts receivable 37 45 Provision for doubtful accounts receivable (275) (348)
Total 10 355 11 892
As at 31
December 2015 As at 31
December 2014 UAH 7 702 10 616 USD 2 194 1 242 EUR 459 34
Total 10 355 11 892
Note As at 31
December 2015 As at 31
December 2014 Cash in banks a) 10 955 2 462 Cash on hand 7 9
Total 10 962 2 471
Notes on pages 46-95 form an integral part of these consolidated financial statements
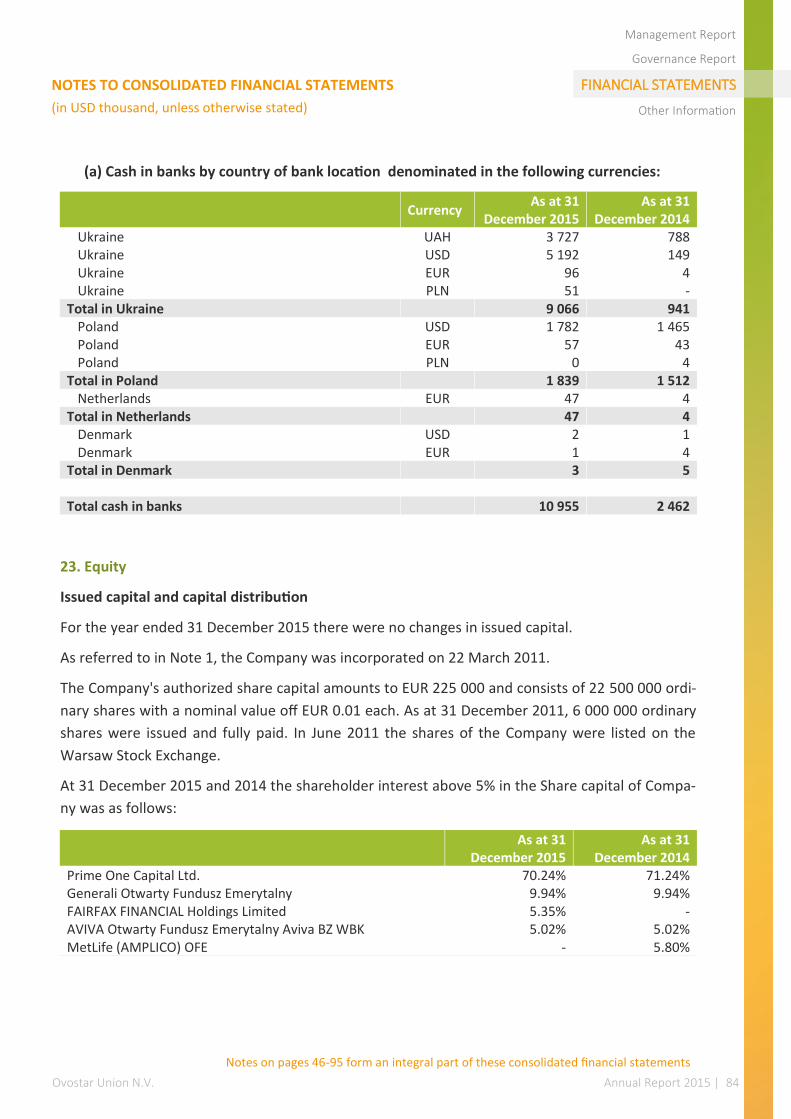
Ovostar Union N.V. Annual Report 2015 | 84
Management Report
Governance Report
FINANCIAL STATEMENTS
Other Information
NOTES TO CONSOLIDATED FINANCIAL STATEMENTS
(in USD thousand, unless otherwise stated)
(a) Cash in banks by country of bank location denominated in the following currencies:
23. Equity
Issued capital and capital distribution
For the year ended 31 December 2015 there were no changes in issued capital.
As referred to in Note 1, the Company was incorporated on 22 March 2011.
The Company's authorized share capital amounts to EUR 225 000 and consists of 22 500 000 ordi-
nary shares with a nominal value off EUR 0.01 each. As at 31 December 2011, 6 000 000 ordinary
shares were issued and fully paid. In June 2011 the shares of the Company were listed on the
Warsaw Stock Exchange.
At 31 December 2015 and 2014 the shareholder interest above 5% in the Share capital of Compa-
ny was as follows:
Currency As at 31
December 2015 As at 31
December 2014 Ukraine UAH 3 727 788 Ukraine USD 5 192 149 Ukraine EUR 96 4 Ukraine PLN 51 -
Total in Ukraine 9 066 941 Poland USD 1 782 1 465 Poland EUR 57 43 Poland PLN 0 4
Total in Poland 1 839 1 512 Netherlands EUR 47 4
Total in Netherlands 47 4 Denmark USD 2 1 Denmark EUR 1 4
Total in Denmark 3 5
Total cash in banks 10 955 2 462
As at 31
December 2015 As at 31
December 2014 Prime One Capital Ltd. 70.24% 71.24% Generali Otwarty Fundusz Emerytalny 9.94% 9.94% FAIRFAX FINANCIAL Holdings Limited 5.35% - AVIVA Otwarty Fundusz Emerytalny Aviva BZ WBK 5.02% 5.02% MetLife (AMPLICO) OFE - 5.80%
Notes on pages 46-95 form an integral part of these consolidated financial statements
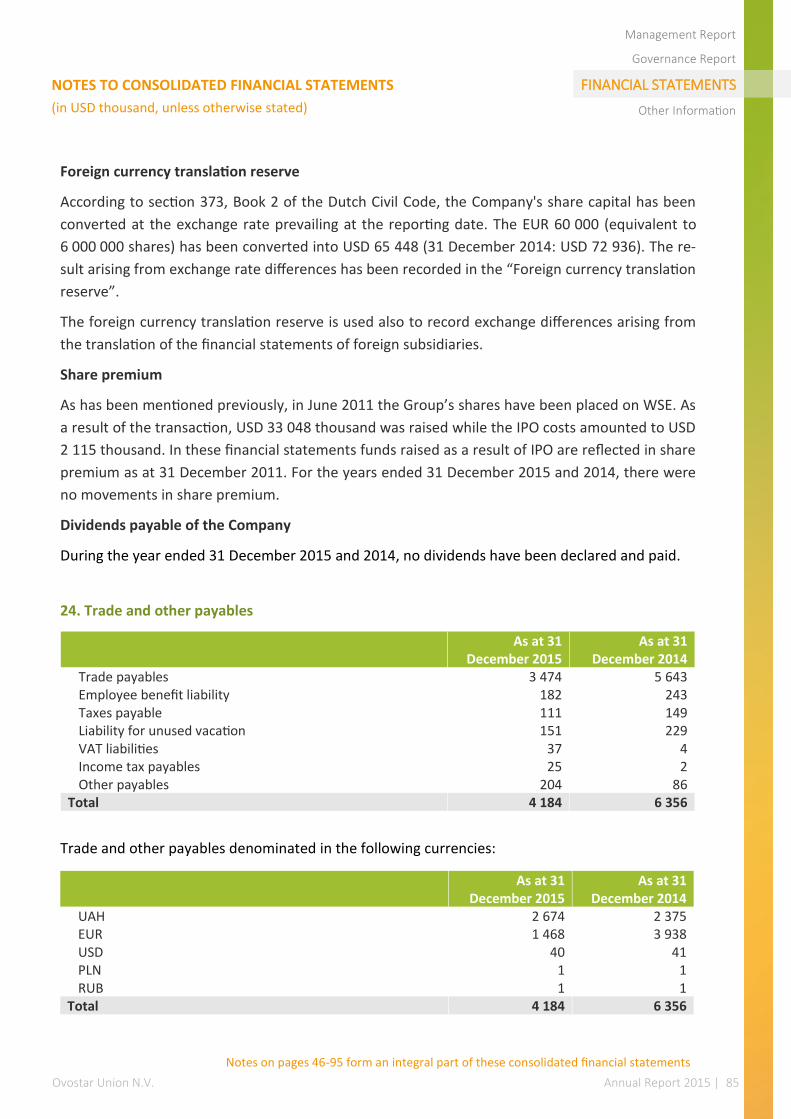
Ovostar Union N.V. Annual Report 2015 | 85
Management Report
Governance Report
FINANCIAL STATEMENTS
Other Information
NOTES TO CONSOLIDATED FINANCIAL STATEMENTS
(in USD thousand, unless otherwise stated)
Foreign currency translation reserve
According to section 373, Book 2 of the Dutch Civil Code, the Company's share capital has been
converted at the exchange rate prevailing at the reporting date. The EUR 60 000 (equivalent to
6 000 000 shares) has been converted into USD 65 448 (31 December 2014: USD 72 936). The re-
sult arising from exchange rate differences has been recorded in the “Foreign currency translation
reserve”.
The foreign currency translation reserve is used also to record exchange differences arising from
the translation of the financial statements of foreign subsidiaries.
Share premium
As has been mentioned previously, in June 2011 the Group’s shares have been placed on WSE. As
a result of the transaction, USD 33 048 thousand was raised while the IPO costs amounted to USD
2 115 thousand. In these financial statements funds raised as a result of IPO are reflected in share
premium as at 31 December 2011. For the years ended 31 December 2015 and 2014, there were
no movements in share premium.
Dividends payable of the Company
During the year ended 31 December 2015 and 2014, no dividends have been declared and paid.
24. Trade and other payables
Trade and other payables denominated in the following currencies:
As at 31
December 2015 As at 31
December 2014 Trade payables 3 474 5 643 Employee benefit liability 182 243 Taxes payable 111 149 Liability for unused vacation 151 229 VAT liabilities 37 4 Income tax payables 25 2 Other payables 204 86
Total 4 184 6 356
As at 31
December 2015 As at 31
December 2014 UAH 2 674 2 375 EUR 1 468 3 938 USD 40 41 PLN 1 1 RUB 1 1
Total 4 184 6 356
Notes on pages 46-95 form an integral part of these consolidated financial statements
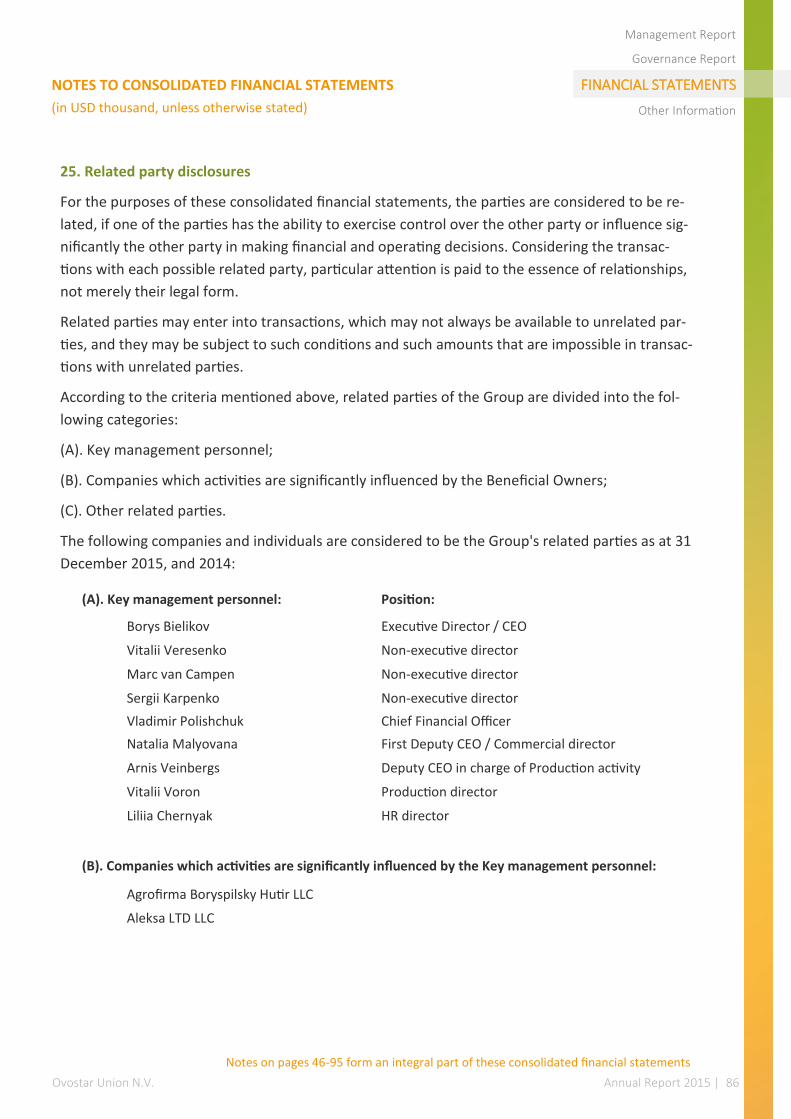
Ovostar Union N.V. Annual Report 2015 | 86
Management Report
Governance Report
FINANCIAL STATEMENTS
Other Information
NOTES TO CONSOLIDATED FINANCIAL STATEMENTS
(in USD thousand, unless otherwise stated)
25. Related party disclosures
For the purposes of these consolidated financial statements, the parties are considered to be re-
lated, if one of the parties has the ability to exercise control over the other party or influence sig-
nificantly the other party in making financial and operating decisions. Considering the transac-
tions with each possible related party, particular attention is paid to the essence of relationships,
not merely their legal form.
Related parties may enter into transactions, which may not always be available to unrelated par-
ties, and they may be subject to such conditions and such amounts that are impossible in transac-
tions with unrelated parties.
According to the criteria mentioned above, related parties of the Group are divided into the fol-
lowing categories:
(A). Key management personnel;
(B). Companies which activities are significantly influenced by the Beneficial Owners;
(C). Other related parties.
The following companies and individuals are considered to be the Group's related parties as at 31
December 2015, and 2014:
(A). Key management personnel: Position:
Borys Bielikov Executive Director / CEO
Vitalii Veresenko Non-executive director
Marc van Campen Non-executive director
Sergii Karpenko Non-executive director
Vladimir Polishchuk Chief Financial Officer
Natalia Malyovana First Deputy CEO / Commercial director
Arnis Veinbergs Deputy CEO in charge of Production activity
Vitalii Voron Production director
Liliia Chernyak HR director
(B). Companies which activities are significantly influenced by the Key management personnel:
Agrofirma Boryspilsky Hutir LLC
Aleksa LTD LLC
Notes on pages 46-95 form an integral part of these consolidated financial statements
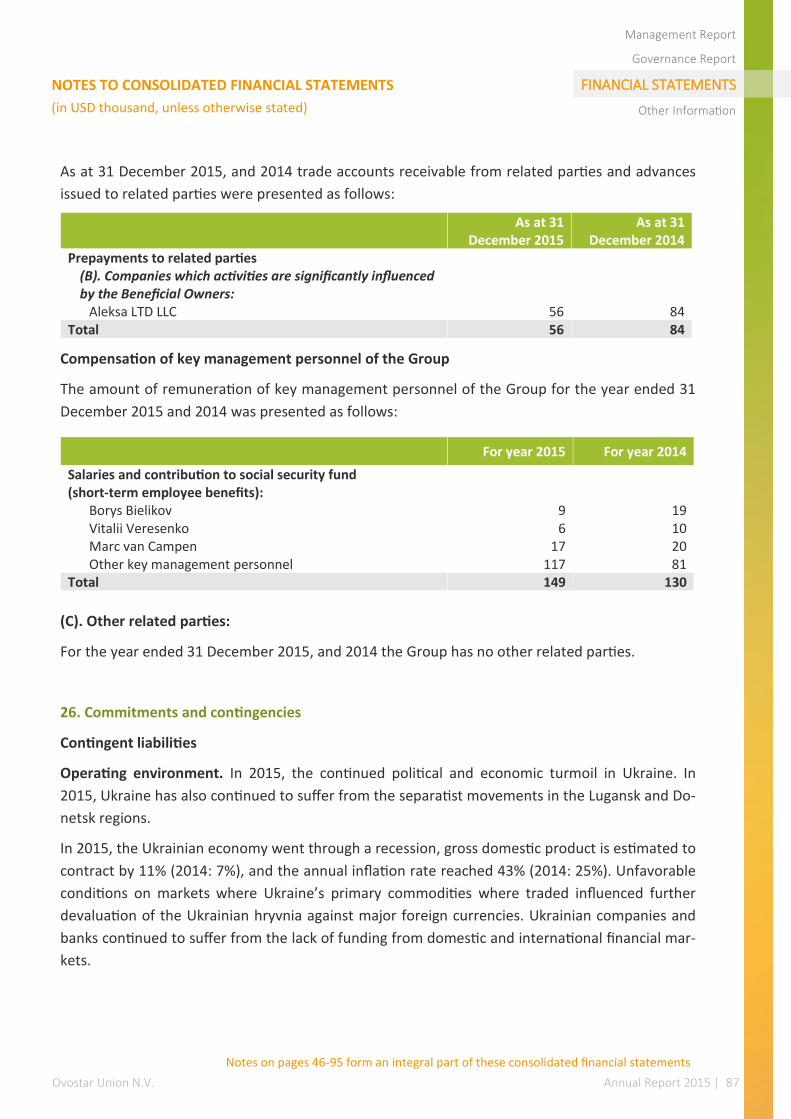
Ovostar Union N.V. Annual Report 2015 | 87
Management Report
Governance Report
FINANCIAL STATEMENTS
Other Information
NOTES TO CONSOLIDATED FINANCIAL STATEMENTS
(in USD thousand, unless otherwise stated)
As at 31 December 2015, and 2014 trade accounts receivable from related parties and advances
issued to related parties were presented as follows:
Compensation of key management personnel of the Group
The amount of remuneration of key management personnel of the Group for the year ended 31
December 2015 and 2014 was presented as follows:
(C). Other related parties:
For the year ended 31 December 2015, and 2014 the Group has no other related parties.
26. Commitments and contingencies
Contingent liabilities
Operating environment. In 2015, the continued political and economic turmoil in Ukraine. In
2015, Ukraine has also continued to suffer from the separatist movements in the Lugansk and Do-
netsk regions.
In 2015, the Ukrainian economy went through a recession, gross domestic product is estimated to
contract by 11% (2014: 7%), and the annual inflation rate reached 43% (2014: 25%). Unfavorable
conditions on markets where Ukraine’s primary commodities where traded influenced further
devaluation of the Ukrainian hryvnia against major foreign currencies. Ukrainian companies and
banks continued to suffer from the lack of funding from domestic and international financial mar-
kets.
As at 31
December 2015 As at 31
December 2014 Prepayments to related parties
(B). Companies which activities are significantly influenced by the Beneficial Owners:
Aleksa LTD LLC 56 84 Total 56 84
For year 2015 For year 2014
Salaries and contribution to social security fund (short-term employee benefits):
Borys Bielikov 9 19 Vitalii Veresenko 6 10 Marc van Campen 17 20 Other key management personnel 117 81
Total 149 130
Notes on pages 46-95 form an integral part of these consolidated financial statements
Ovostar Union N.V. Annual Report 2015 | 88
Management Report
Governance Report
FINANCIAL STATEMENTS
Other Information
NOTES TO CONSOLIDATED FINANCIAL STATEMENTS
(in USD thousand, unless otherwise stated)
In early 2015, the Government of Ukraine agreed with the IMF on a four-year program for a USD
17.5 billion loan aimed at supporting the economic stabilization of Ukraine. The program defines
economic reforms that must be undertaken by the Government of Ukraine to reinstate sustaina-
ble economic growth in the mid-term. Significant external financing is required to support eco-
nomic stabilization and the political situation depends, to a large extent, upon success of the
Ukrainian government’s efforts; yet further economic and political developments are currently
difficult to predict and an adverse effect on the Ukrainian economy may continue. The Group
does not have any assets in Crimea, Donetsk or Luhansk regions.
In 2015, political and economic relationships between Ukraine and the Russian Federation re-
mained strained, leading to a significant reduction in trade and economic cooperation. On 1 Janu-
ary 2016, the free-trade section of Ukraine’s Association Agreement with the European Union
came into force. In late 2015, the Russian Federation denounced its free trade agreement with
Ukraine and further trade restrictions were announced by both countries.
Taxation. Ukrainian tax authorities are increasingly directing their attention to the business com-
munity as a result of the overall Ukrainian economic environment. In respect of this, the local and
national tax environment in Ukraine is constantly changing and subject to inconsistent applica-
tion, interpretation and enforcement. Non-compliance with Ukrainian laws and regulations can
lead to the imposition of severe penalties and interest. Future tax examinations could raise issues
or assessments which are contrary to the Group companies’ tax filings. Such assessments could
include taxes, penalties and interest, and these amounts could be material. While the Group be-
lieves it has complied with local tax legislation, there have been many new tax and foreign curren-
cy laws and related regulations introduced in recent years which are not always clearly written.
From 1 January 2016 Tax Code of Ukraine was changed in part which regulates the privileged VAT
regime for agricultural companies. New procedure provides redistribution of special VAT liabilities
for agrarian companies:
— on transactions with grain and industrial crops – 85% is paying to the State budget, 15 %
is transferring to the entity’s special bank account and can be used to make payments
relating to the agricultural activities;
— for operations with animal products - 20% to the State budget, 80% to the special bank
account;
— other transactions of agricultural goods / services – 50% to the State budget, 50% to the
special bank account.
In 2015 agricultural companies did not remitted special VAT liabilities to the State budget, but
used for their agricultural activities.
The Group is currently estimating the impact of these new changes but does not expect these to
result in a significant change in the Group’s effective tax rate.
Notes on pages 46-95 form an integral part of these consolidated financial statements
Ovostar Union N.V. Annual Report 2015 | 89
Management Report
Governance Report
FINANCIAL STATEMENTS
Other Information
NOTES TO CONSOLIDATED FINANCIAL STATEMENTS
(in USD thousand, unless otherwise stated)
Starting from 1 September 2013, the Tax Code of Ukraine introduced new rules, based on OECD
transfer pricing guidelines, for determining and applying fair market prices, which significantly
changed transfer pricing regulations in Ukraine. The Group exports goods and services, which may
potentially fall under the scope of the new Ukrainian transfer pricing regulations. The Group sub-
mitted a controlled transaction report within the required deadline. Management believes that
the Group is in compliance with transfer pricing regulation requirements.
Given its current economic and political issues, the Government is considering implementing cer-
tain reforms in the tax system of Ukraine by adopting the Law of Ukraine ‘On Amending the Tax
Code of Ukraine and Certain Laws of Ukraine’, which is effective from 1 January 2015, except for
certain provisions that will take effect at a later date. Management believes that the Group has
been in compliance with all requirements of effective tax legislation and currently is assessing the
possible impact of the introduced amendments.
Legal issues. As at 31 December 2015 and 2014 the Group is involved in litigations and other
claims that are in the ordinary course of its business activities. Management believes that the res-
olution of such matters will not have a material impact on its financial position or operating re-
sults
Capital commitments. As at 31 December 2015 the Group had contract liabilities for acquisition
of property, plant and equipment equal to USD 28 thousand (2014: USD nil).
27. Financial risk management
The Group manages its capital to ensure that entities in the Group will be able to continue as a
going concern while maximizing the return to shareholders through a combination of debt and
equity capital. The management of the Group reviews the capital structure on a regular basis.
Based on the results of this review, the Group takes steps to balance its overall capital structure
through the issue of new debt or the redemption of existing debt.
The capital structure of the Group consists of debt, which includes the borrowings and cash and
cash equivalents disclosed in Notes 19 and 22 respectively, and equity attributable to the equity
holders of the parent, comprising issued capital, share premium, reserves and retained earnings.
Gearing ratio
The Group’s management reviews quarterly the capital structure of the Group. As part of this re-
view, the management considers the cost of capital and the risks associated with each class of
capital.
Notes on pages 46-95 form an integral part of these consolidated financial statements
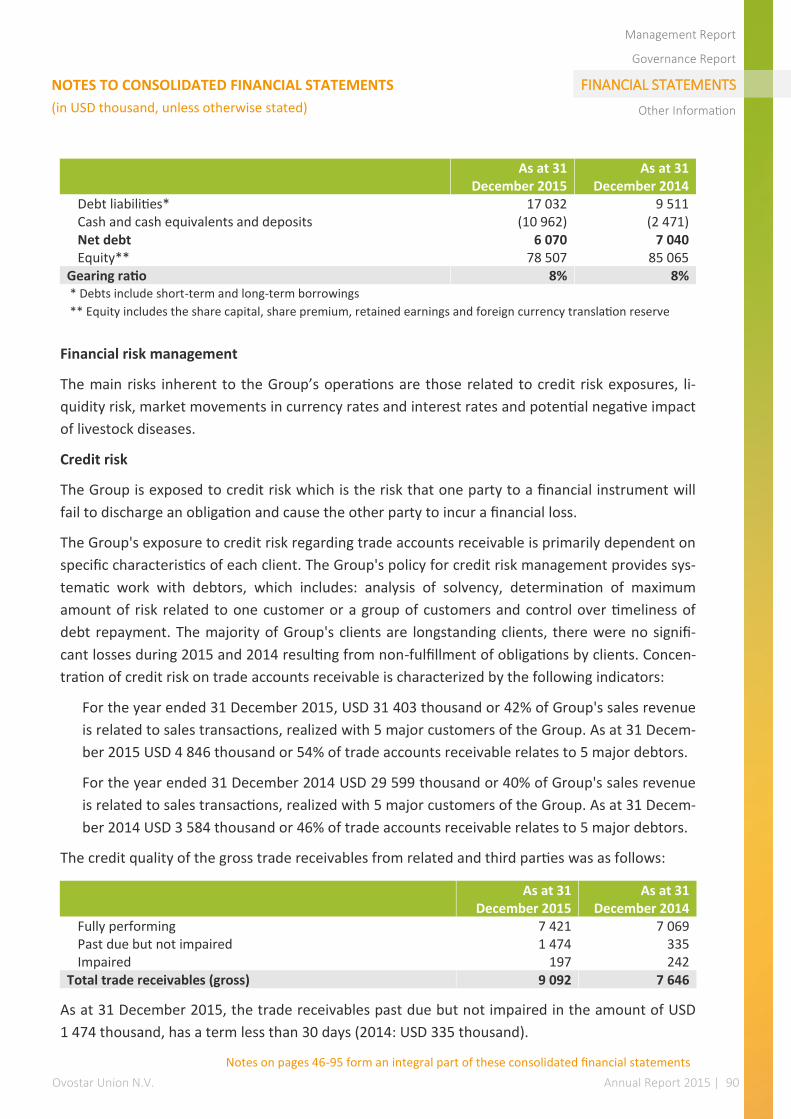
Ovostar Union N.V. Annual Report 2015 | 90
Management Report
Governance Report
FINANCIAL STATEMENTS
Other Information
NOTES TO CONSOLIDATED FINANCIAL STATEMENTS
(in USD thousand, unless otherwise stated)
Financial risk management
The main risks inherent to the Group’s operations are those related to credit risk exposures, li-
quidity risk, market movements in currency rates and interest rates and potential negative impact
of livestock diseases.
Credit risk
The Group is exposed to credit risk which is the risk that one party to a financial instrument will
fail to discharge an obligation and cause the other party to incur a financial loss.
The Group's exposure to credit risk regarding trade accounts receivable is primarily dependent on
specific characteristics of each client. The Group's policy for credit risk management provides sys-
tematic work with debtors, which includes: analysis of solvency, determination of maximum
amount of risk related to one customer or a group of customers and control over timeliness of
debt repayment. The majority of Group's clients are longstanding clients, there were no signifi-
cant losses during 2015 and 2014 resulting from non-fulfillment of obligations by clients. Concen-
tration of credit risk on trade accounts receivable is characterized by the following indicators:
For the year ended 31 December 2015, USD 31 403 thousand or 42% of Group's sales revenue
is related to sales transactions, realized with 5 major customers of the Group. As at 31 Decem-
ber 2015 USD 4 846 thousand or 54% of trade accounts receivable relates to 5 major debtors.
For the year ended 31 December 2014 USD 29 599 thousand or 40% of Group's sales revenue
is related to sales transactions, realized with 5 major customers of the Group. As at 31 Decem-
ber 2014 USD 3 584 thousand or 46% of trade accounts receivable relates to 5 major debtors.
The credit quality of the gross trade receivables from related and third parties was as follows:
As at 31 December 2015, the trade receivables past due but not impaired in the amount of USD
1 474 thousand, has a term less than 30 days (2014: USD 335 thousand).
As at 31
December 2015 As at 31
December 2014 Debt liabilities* 17 032 9 511 Cash and cash equivalents and deposits (10 962) (2 471) Net debt 6 070 7 040 Equity** 78 507 85 065
Gearing ratio 8% 8% * Debts include short-term and long-term borrowings
** Equity includes the share capital, share premium, retained earnings and foreign currency translation reserve
As at 31
December 2015 As at 31
December 2014 Fully performing 7 421 7 069 Past due but not impaired 1 474 335 Impaired 197 242
Total trade receivables (gross) 9 092 7 646
Notes on pages 46-95 form an integral part of these consolidated financial statements
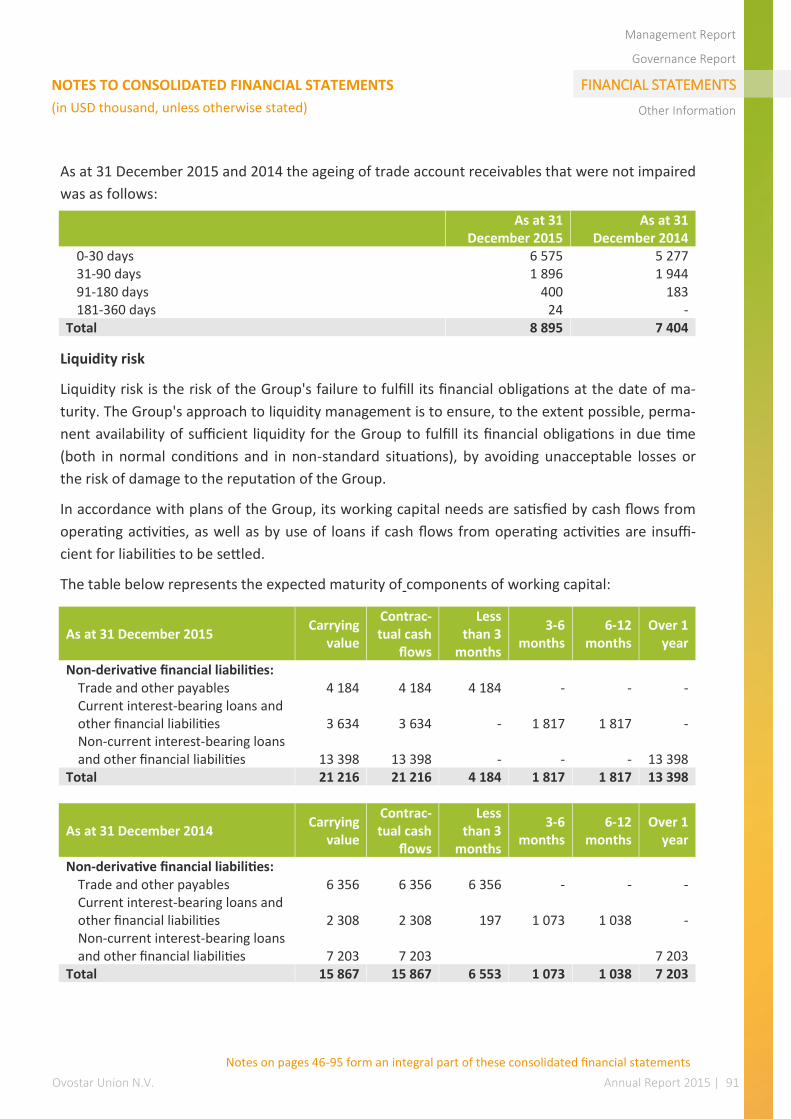
Ovostar Union N.V. Annual Report 2015 | 91
Management Report
Governance Report
FINANCIAL STATEMENTS
Other Information
NOTES TO CONSOLIDATED FINANCIAL STATEMENTS
(in USD thousand, unless otherwise stated)
As at 31 December 2015 and 2014 the ageing of trade account receivables that were not impaired
was as follows:
Liquidity risk
Liquidity risk is the risk of the Group's failure to fulfill its financial obligations at the date of ma-
turity. The Group's approach to liquidity management is to ensure, to the extent possible, perma-
nent availability of sufficient liquidity for the Group to fulfill its financial obligations in due time
(both in normal conditions and in non-standard situations), by avoiding unacceptable losses or
the risk of damage to the reputation of the Group.
In accordance with plans of the Group, its working capital needs are satisfied by cash flows from
operating activities, as well as by use of loans if cash flows from operating activities are insuffi-
cient for liabilities to be settled.
The table below represents the expected maturity of components of working capital:
As at 31
December 2015 As at 31
December 2014 0-30 days 6 575 5 277 31-90 days 1 896 1 944 91-180 days 400 183 181-360 days 24 -
Total 8 895 7 404
As at 31 December 2015 Carrying
value
Contrac-tual cash
flows
Less than 3
months
3-6 months
6-12 months
Over 1 year
Non-derivative financial liabilities: Trade and other payables 4 184 4 184 4 184 - - - Current interest-bearing loans and other financial liabilities 3 634 3 634 - 1 817 1 817 - Non-current interest-bearing loans and other financial liabilities 13 398 13 398 - - - 13 398
Total 21 216 21 216 4 184 1 817 1 817 13 398
As at 31 December 2014 Carrying
value
Contrac-tual cash
flows
Less than 3
months
3-6 months
6-12 months
Over 1 year
Non-derivative financial liabilities: Trade and other payables 6 356 6 356 6 356 - - - Current interest-bearing loans and other financial liabilities 2 308 2 308 197 1 073 1 038 - Non-current interest-bearing loans and other financial liabilities 7 203 7 203 7 203
Total 15 867 15 867 6 553 1 073 1 038 7 203
Notes on pages 46-95 form an integral part of these consolidated financial statements

Ovostar Union N.V. Annual Report 2015 | 92
Management Report
Governance Report
FINANCIAL STATEMENTS
Other Information
NOTES TO CONSOLIDATED FINANCIAL STATEMENTS
(in USD thousand, unless otherwise stated)
Currency risk
Currency risk – Currency risk is the risk that the value of a financial instrument will fluctuate due
to changes in foreign exchange rates. The Group undertakes certain transactions denominated in
foreign currencies. The Group does not use any derivatives to manage foreign currency risk expo-
sure, at the same time the management of the Group sets limits on the level of exposure by cur-
rencies.
Exposure to foreign currency risk
The carrying amounts of the Group’s foreign currency denominated monetary assets and liabili-
ties as of 31 December 2015 and 2014 were as follows:
This sensitivity rate represents the management’s assessment of the reasonably possible change
in foreign exchange rates. The sensitivity analysis includes only outstanding foreign currency de-
nominated monetary items and adjusts their translation at the period end for expected change in
foreign currency rates.
As at 31 December 2015 PLN RUB USD EUR UAH Total
(in conversion to USD thousand) Assets
Cash and cash equivalents 51 - 6 976 200 3 735 10 962 Trade receivables - - 2 194 459 6 094 8 747
Liabilities Current interest-bearing loans and other financial liabilities - - - (3 549) (85) (3 634) Non-current interest-bearing loans and other financial liabilities - - - (13 357) (41) (13 398) Trade accounts payable - (1) (3) (1 440) (2 030) (3 474) Other payables (1) - (36) (28) (139) (204)
Net exposure to foreign currency risk 50 (1) 9 131 (17 715) 7 534 (1 001)
As at 31 December 2014 PLN RUB USD EUR UAH Total
(in conversion to USD thousand) Assets
Cash and cash equivalents 4 - 1 467 52 948 2 471 Trade receivables - - 1 242 34 6 022 7 298
Liabilities Current interest-bearing loans and other financial liabilities - - - (2 154) (154) (2 308) Non-current interest-bearing loans and other financial liabilities - - - (7 066) (137) (7 203) Trade accounts payable (1) (1) (5) (3 910) (1 726) (5 643) Other payables - - (36) (28) (22) (86)
Total 3 (1) 2 668 (13 072) 4 931 (5 471)
Notes on pages 46-95 form an integral part of these consolidated financial statements
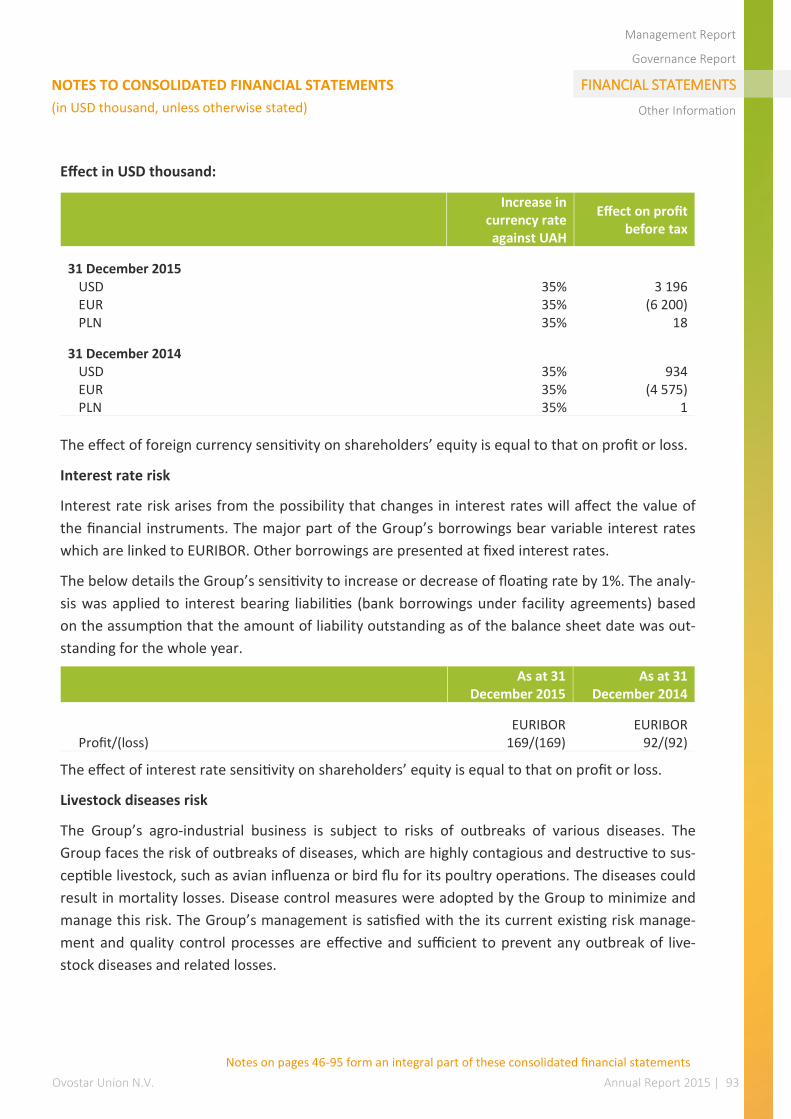
Ovostar Union N.V. Annual Report 2015 | 93
Management Report
Governance Report
FINANCIAL STATEMENTS
Other Information
NOTES TO CONSOLIDATED FINANCIAL STATEMENTS
(in USD thousand, unless otherwise stated)
Effect in USD thousand:
The effect of foreign currency sensitivity on shareholders’ equity is equal to that on profit or loss.
Interest rate risk
Interest rate risk arises from the possibility that changes in interest rates will affect the value of
the financial instruments. The major part of the Group’s borrowings bear variable interest rates
which are linked to EURIBOR. Other borrowings are presented at fixed interest rates.
The below details the Group’s sensitivity to increase or decrease of floating rate by 1%. The analy-
sis was applied to interest bearing liabilities (bank borrowings under facility agreements) based
on the assumption that the amount of liability outstanding as of the balance sheet date was out-
standing for the whole year.
The effect of interest rate sensitivity on shareholders’ equity is equal to that on profit or loss.
Livestock diseases risk
The Group’s agro-industrial business is subject to risks of outbreaks of various diseases. The
Group faces the risk of outbreaks of diseases, which are highly contagious and destructive to sus-
ceptible livestock, such as avian influenza or bird flu for its poultry operations. The diseases could
result in mortality losses. Disease control measures were adopted by the Group to minimize and
manage this risk. The Group’s management is satisfied with the its current existing risk manage-
ment and quality control processes are effective and sufficient to prevent any outbreak of live-
stock diseases and related losses.
Increase in
currency rate against UAH
Effect on profit before tax
31 December 2015 USD 35% 3 196 EUR 35% (6 200) PLN 35% 18
31 December 2014 USD 35% 934 EUR 35% (4 575) PLN 35% 1
As at 31
December 2015 As at 31
December 2014
EURIBOR EURIBOR Profit/(loss) 169/(169) 92/(92)
Notes on pages 46-95 form an integral part of these consolidated financial statements
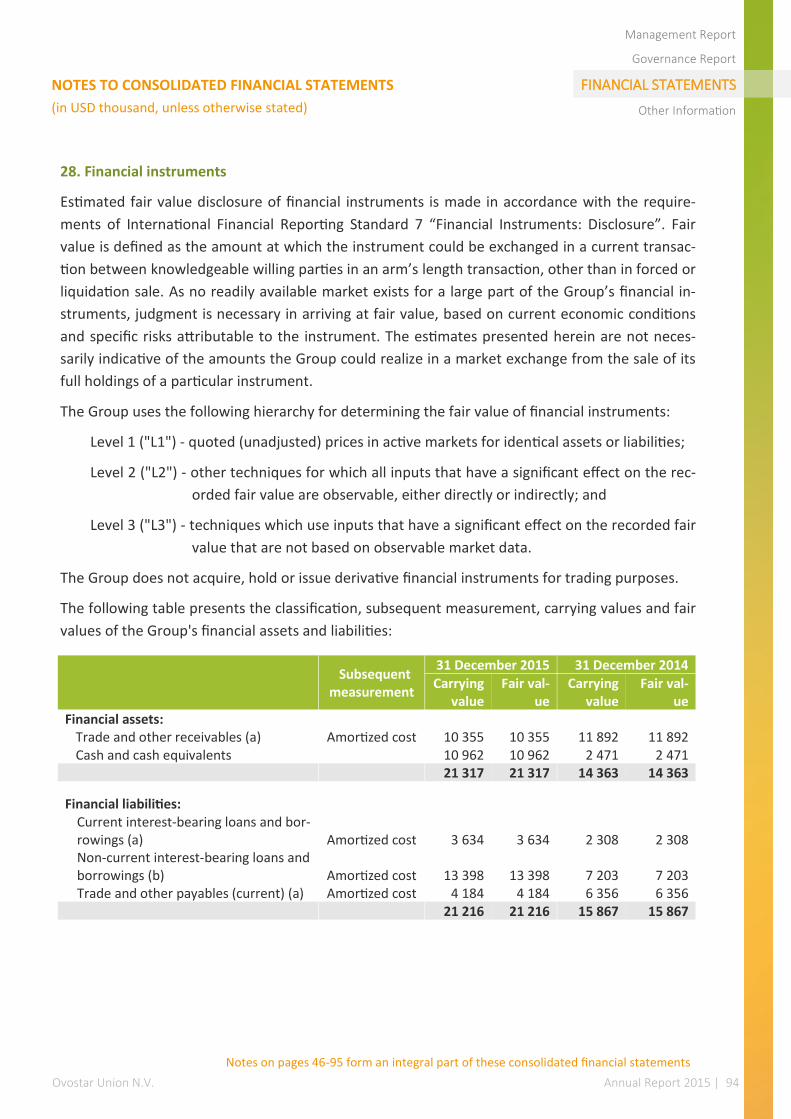
Ovostar Union N.V. Annual Report 2015 | 94
Management Report
Governance Report
FINANCIAL STATEMENTS
Other Information
NOTES TO CONSOLIDATED FINANCIAL STATEMENTS
(in USD thousand, unless otherwise stated)
28. Financial instruments
Estimated fair value disclosure of financial instruments is made in accordance with the require-
ments of International Financial Reporting Standard 7 “Financial Instruments: Disclosure”. Fair
value is defined as the amount at which the instrument could be exchanged in a current transac-
tion between knowledgeable willing parties in an arm’s length transaction, other than in forced or
liquidation sale. As no readily available market exists for a large part of the Group’s financial in-
struments, judgment is necessary in arriving at fair value, based on current economic conditions
and specific risks attributable to the instrument. The estimates presented herein are not neces-
sarily indicative of the amounts the Group could realize in a market exchange from the sale of its
full holdings of a particular instrument.
The Group uses the following hierarchy for determining the fair value of financial instruments:
Level 1 ("L1") - quoted (unadjusted) prices in active markets for identical assets or liabilities;
Level 2 ("L2") - other techniques for which all inputs that have a significant effect on the rec-
orded fair value are observable, either directly or indirectly; and
Level 3 ("L3") - techniques which use inputs that have a significant effect on the recorded fair
value that are not based on observable market data.
The Group does not acquire, hold or issue derivative financial instruments for trading purposes.
The following table presents the classification, subsequent measurement, carrying values and fair
values of the Group's financial assets and liabilities:
31 December 2015 31 December 2014
Subsequent measurement
Carrying value
Fair val-ue
Carrying value
Fair val-ue
Financial assets: Trade and other receivables (a) Amortized cost 10 355 10 355 11 892 11 892 Cash and cash equivalents 10 962 10 962 2 471 2 471
21 317 21 317 14 363 14 363
Financial liabilities: Current interest-bearing loans and bor-rowings (a) Amortized cost 3 634 3 634 2 308 2 308 Non-current interest-bearing loans and borrowings (b) Amortized cost 13 398 13 398 7 203 7 203 Trade and other payables (current) (a) Amortized cost 4 184 4 184 6 356 6 356
21 216 21 216 15 867 15 867
Notes on pages 46-95 form an integral part of these consolidated financial statements
Ovostar Union N.V. Annual Report 2015 | 95
Management Report
Governance Report
FINANCIAL STATEMENTS
Other Information
NOTES TO CONSOLIDATED FINANCIAL STATEMENTS
(in USD thousand, unless otherwise stated)
The following methods and assumptions were used to estimate the fair values:
a) The Group's short-term financial instruments, comprising trade and other receivables,
current interest-bearing loans and borrowings, trade and other payables are carried at
amortized cost which, due to their short term nature, approximates their fair value.
b) The fair values of other financial assets and financial liabilities (excluding those described
above) are determined in accordance with generally accepted pricing models based on
discounted cash flow analysis.
c) Fair value of available-for-sale financial assets is derived from quoted market prices in
active markets, if available.
d) Fair value of unquoted available-for-sale financial assets is estimated using appropriate
valuation techniques.
29. Subsequent events
After the reporting date, Ovostar Union N.V. signed a contract with “Big Dutchman International
GmbH” for the purchase of laying hens equipment for the amount of EUR 13 650 thousand.
In January 2016 the Group received equipment for poultry house for the amount USD 1 558 thou-
sand under contract concluded with SALMET INTERNATIONAL GMBH as part of current invest-
ment program.
Notes on pages 46-95 form an integral part of these consolidated financial statements

Ovostar Union N.V. Annual Report 2015 | 96
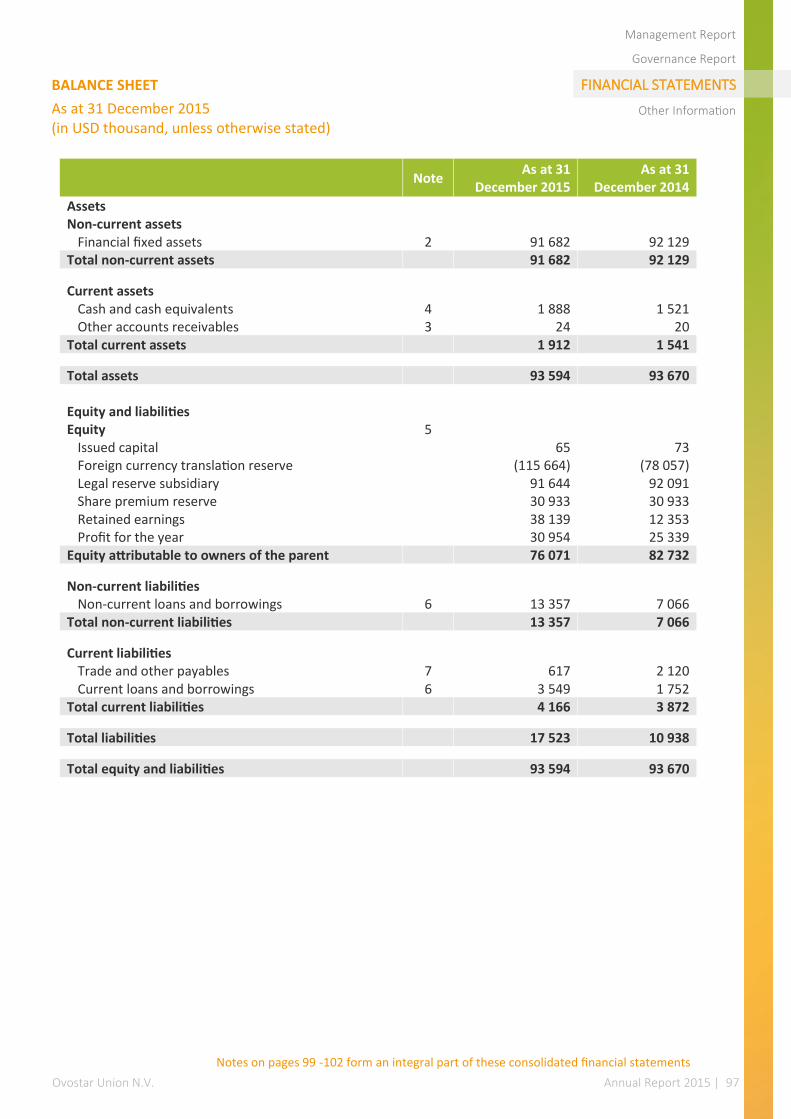
Ovostar Union N.V. Annual Report 2015 | 97
Management Report
Governance Report
FINANCIAL STATEMENTS
Other Information
BALANCE SHEET
As at 31 December 2015 (in USD thousand, unless otherwise stated)
Note As at 31
December 2015 As at 31
December 2014
Assets Non-current assets
Financial fixed assets 2 91 682 92 129 Total non-current assets 91 682 92 129
Current assets Cash and cash equivalents 4 1 888 1 521 Other accounts receivables 3 24 20
Total current assets 1 912 1 541
Total assets 93 594 93 670
Equity and liabilities Equity 5
Issued capital 65 73 Foreign currency translation reserve (115 664) (78 057) Legal reserve subsidiary 91 644 92 091 Share premium reserve 30 933 30 933 Retained earnings 38 139 12 353 Profit for the year 30 954 25 339
Equity attributable to owners of the parent 76 071 82 732
Non-current liabilities Non-current loans and borrowings 6 13 357 7 066
Total non-current liabilities 13 357 7 066
Current liabilities Trade and other payables 7 617 2 120 Current loans and borrowings 6 3 549 1 752
Total current liabilities 4 166 3 872
Total liabilities 17 523 10 938
Total equity and liabilities 93 594 93 670
Notes on pages 99 -102 form an integral part of these consolidated financial statements
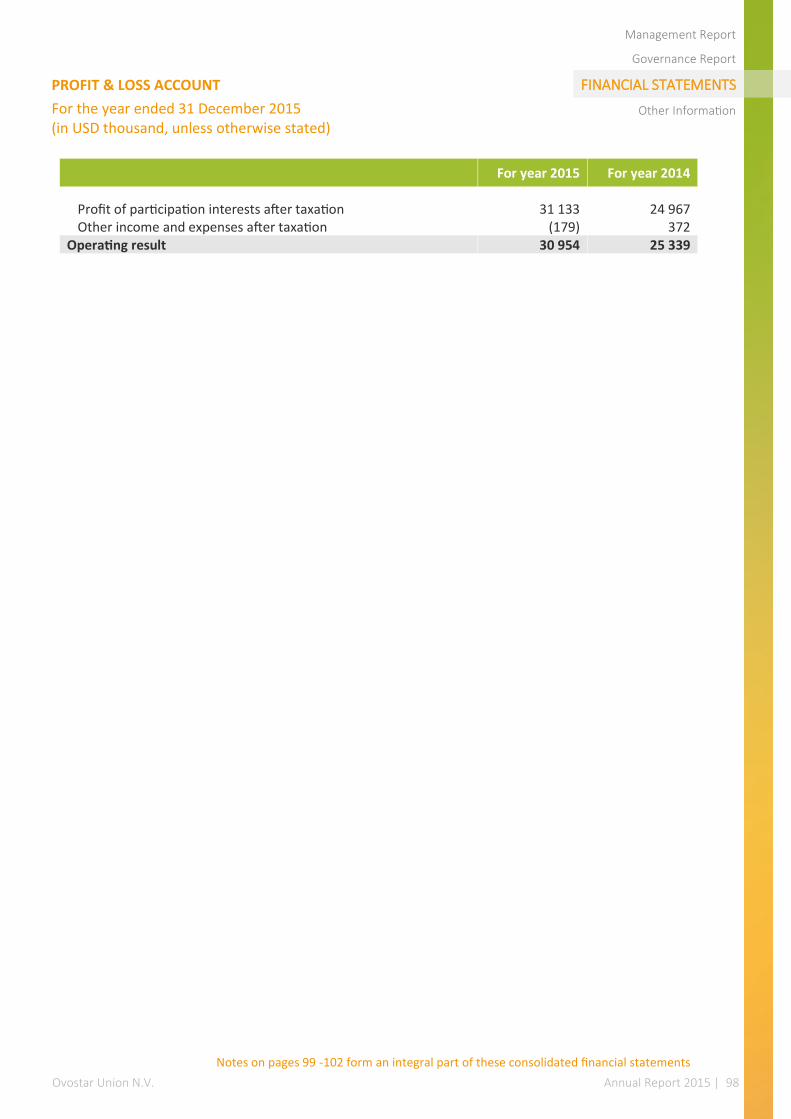
Ovostar Union N.V. Annual Report 2015 | 98
Management Report
Governance Report
FINANCIAL STATEMENTS
Other Information
PROFIT & LOSS ACCOUNT
For the year ended 31 December 2015 (in USD thousand, unless otherwise stated)
For year 2015 For year 2014
Profit of participation interests after taxation 31 133 24 967 Other income and expenses after taxation (179) 372
Operating result 30 954 25 339
Notes on pages 99 -102 form an integral part of these consolidated financial statements
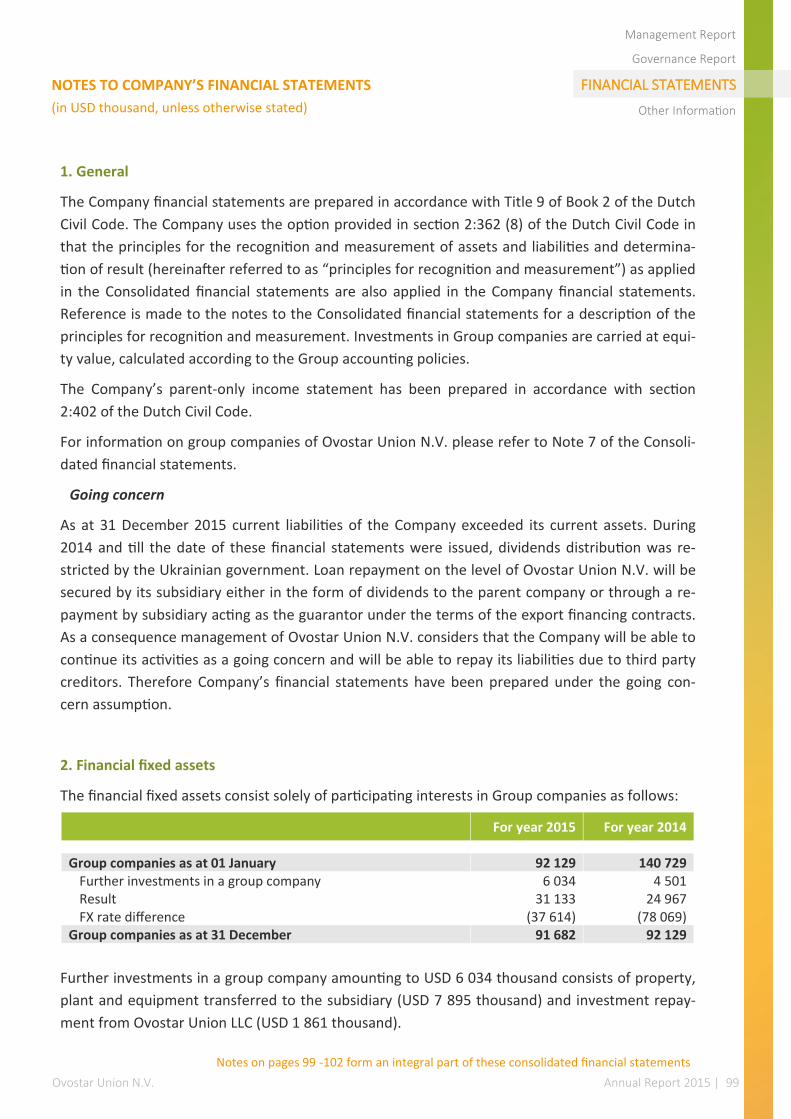
Ovostar Union N.V. Annual Report 2015 | 99
Management Report
Governance Report
FINANCIAL STATEMENTS
Other Information
NOTES TO COMPANY’S FINANCIAL STATEMENTS
(in USD thousand, unless otherwise stated)
1. General
The Company financial statements are prepared in accordance with Title 9 of Book 2 of the Dutch
Civil Code. The Company uses the option provided in section 2:362 (8) of the Dutch Civil Code in
that the principles for the recognition and measurement of assets and liabilities and determina-
tion of result (hereinafter referred to as “principles for recognition and measurement”) as applied
in the Consolidated financial statements are also applied in the Company financial statements.
Reference is made to the notes to the Consolidated financial statements for a description of the
principles for recognition and measurement. Investments in Group companies are carried at equi-
ty value, calculated according to the Group accounting policies.
The Company’s parent-only income statement has been prepared in accordance with section
2:402 of the Dutch Civil Code.
For information on group companies of Ovostar Union N.V. please refer to Note 7 of the Consoli-
dated financial statements.
Going concern
As at 31 December 2015 current liabilities of the Company exceeded its current assets. During
2014 and till the date of these financial statements were issued, dividends distribution was re-
stricted by the Ukrainian government. Loan repayment on the level of Ovostar Union N.V. will be
secured by its subsidiary either in the form of dividends to the parent company or through a re-
payment by subsidiary acting as the guarantor under the terms of the export financing contracts.
As a consequence management of Ovostar Union N.V. considers that the Company will be able to
continue its activities as a going concern and will be able to repay its liabilities due to third party
creditors. Therefore Company’s financial statements have been prepared under the going con-
cern assumption.
2. Financial fixed assets
The financial fixed assets consist solely of participating interests in Group companies as follows:
Further investments in a group company amounting to USD 6 034 thousand consists of property,
plant and equipment transferred to the subsidiary (USD 7 895 thousand) and investment repay-
ment from Ovostar Union LLC (USD 1 861 thousand).
For year 2015 For year 2014
Group companies as at 01 January 92 129 140 729 Further investments in a group company 6 034 4 501 Result 31 133 24 967 FX rate difference (37 614) (78 069)
Group companies as at 31 December 91 682 92 129
Notes on pages 99 -102 form an integral part of these consolidated financial statements
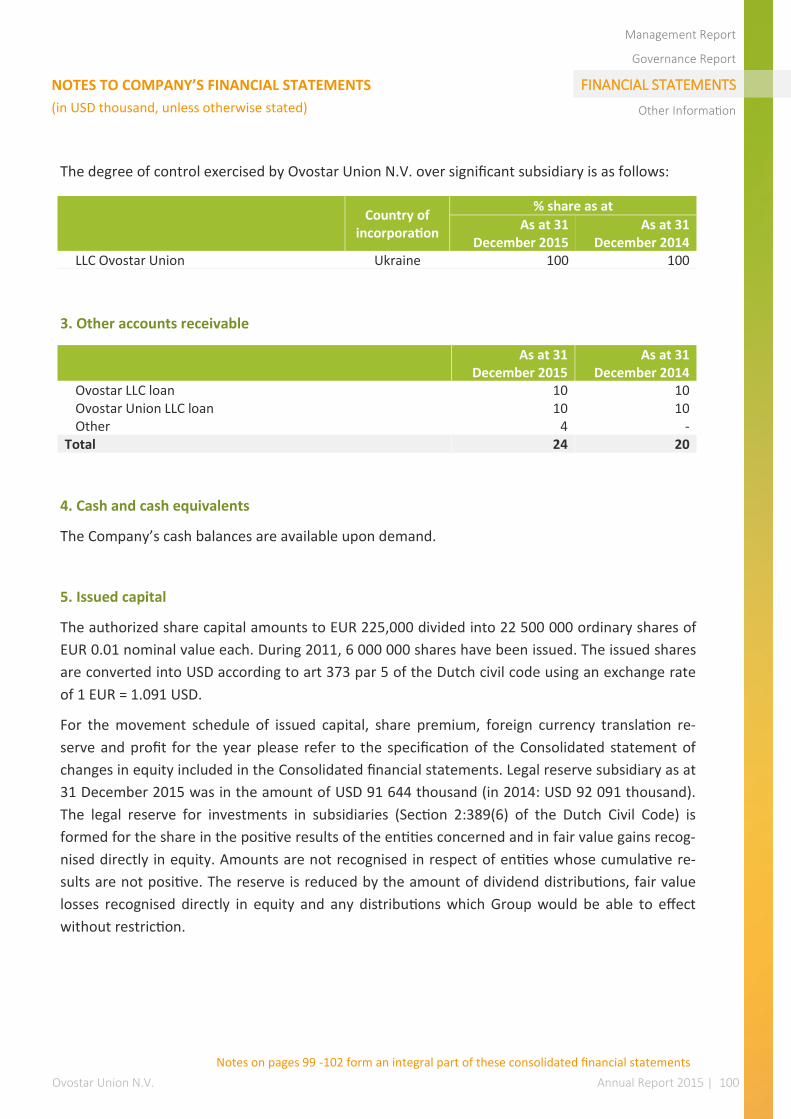
Ovostar Union N.V. Annual Report 2015 | 100
Management Report
Governance Report
FINANCIAL STATEMENTS
Other Information
NOTES TO COMPANY’S FINANCIAL STATEMENTS
(in USD thousand, unless otherwise stated)
The degree of control exercised by Ovostar Union N.V. over significant subsidiary is as follows:
3. Other accounts receivable
4. Cash and cash equivalents
The Company’s cash balances are available upon demand.
5. Issued capital
The authorized share capital amounts to EUR 225,000 divided into 22 500 000 ordinary shares of
EUR 0.01 nominal value each. During 2011, 6 000 000 shares have been issued. The issued shares
are converted into USD according to art 373 par 5 of the Dutch civil code using an exchange rate
of 1 EUR = 1.091 USD.
For the movement schedule of issued capital, share premium, foreign currency translation re-
serve and profit for the year please refer to the specification of the Consolidated statement of
changes in equity included in the Consolidated financial statements. Legal reserve subsidiary as at
31 December 2015 was in the amount of USD 91 644 thousand (in 2014: USD 92 091 thousand).
The legal reserve for investments in subsidiaries (Section 2:389(6) of the Dutch Civil Code) is
formed for the share in the positive results of the entities concerned and in fair value gains recog-
nised directly in equity. Amounts are not recognised in respect of entities whose cumulative re-
sults are not positive. The reserve is reduced by the amount of dividend distributions, fair value
losses recognised directly in equity and any distributions which Group would be able to effect
without restriction.
Country of
incorporation
% share as at
As at 31 December 2015
As at 31 December 2014
LLC Ovostar Union Ukraine 100 100
As at 31
December 2015 As at 31
December 2014 Ovostar LLC loan 10 10 Ovostar Union LLC loan 10 10 Other 4 -
Total 24 20
Notes on pages 99 -102 form an integral part of these consolidated financial statements
Ovostar Union N.V. Annual Report 2015 | 101
Management Report
Governance Report
FINANCIAL STATEMENTS
Other Information
NOTES TO COMPANY’S FINANCIAL STATEMENTS
(in USD thousand, unless otherwise stated)
6. Loans and borrowings
As at 31 December 2015 and 2014 loan and borrowings comprised loans received from Landes-
bank Berlin AG and AKA Ausfuhrkredit-Gesellschaft mbH. Landesbank Berlin AG and AKA
Ausfuhrkredit-Gesellschaft mbH loan are guaranteed by subsidiaries. For detail information about
loans and borrowings refer to Note 19 in the Consolidated financial statements.
7. Trade and other payables
Trade and other payables included payables from third parties and payables to supplier for prop-
erty, plant and equipment in the amount of USD 552 thousand (in 2014: USD 2 054 thousand).
8. Employees
The Company has no employees other than directors.
9. Directors
The Company is managed by the Board of Directors which consists of four members: one Execu-
tive Director and three Non-Executive directors.
The Board of Directors as at 31 December 2015 comprised:
Changes in the Board of Directors of Ovostar Union N.V.
In June 2015 on the Annual General Meeting of Shareholders Board has approved (re)
appointment of the members of the Board. All members of the Board have been (re)appointed
for a period of 4 years. The Meeting approved Mr. Sergii Karpenko for the position of non-
executive Board member.
Name Position
V. Veresenko Chairman of the Board, Non-Executive Director (non-independent)
B. Bielikov Chief Executive Officer, (non-independent)
M. van Campen Non-Executive Director
S. Karpenko Non-Executive Director
Notes on pages 99 -102 form an integral part of these consolidated financial statements

Ovostar Union N.V. Annual Report 2015 | 102
Management Report
Governance Report
FINANCIAL STATEMENTS
Other Information
NOTES TO COMPANY’S FINANCIAL STATEMENTS
(in USD thousand, unless otherwise stated)
10. Audit fee
Fees paid to the Group’s auditor for 2015 and 2014 can be broken down into the following:
Audit fees of financial statements include the fees for professional services rendered by Baker Til-
ly Berk N.V. and Baker Tilly Ukraine and relate to the audit of the Company’s Consolidated and
Company’s financial statements and its subsidiary.
Amsterdam, 08 April 2016
[signed]
Borys Bielikov
Chief Executive Officer, Executive Director
[signed]
Marc Van Campen
Head of Audit Committee, Non-executive Director
[signed]
Vitalii Veresenko
Chairman of the Board, Non-executive Director
[signed]
Sergii Karpenko
Non-executive Director
For year 2015 For year 2014
Baker Tilly Ukraine: Audit and review of financial statements 27 35
Baker Tilly Berk N.V. Audit fees 33 28
Total 60 63
Notes on pages 99 -102 form an integral part of these consolidated financial statements

Ovostar Union N.V. Annual Report 2015 | 103
Other information
Profit appropriation according to the Articles of Association
The salient points of Article 24 of the Articles of Association governing the appropriation of profit
are:
Distribution of profits shall be made following the adoption of the annual accounts which show
that such distribution is allowed.
The company may only make distributions to shareholders and other persons entitled to distribut-
able profits to the extent that its equity exceeds the aggregate amount of the issued share capital
and the reserves which must be maintained pursuant to the law.
Proposed appropriation of result
The board of directors proposes to add the profit to the general reserves. The proposal is not re-
flected in the financial statements.
Post balance sheet events
As of the date of publication of this report, the Company signed a contract with “Big Dutchman
International GmbH” for the purchase of laying hens equipment for the amount of EUR 13 650
thousand.
Management Report
Governance Report
FINANCIAL STATEMENTS
Other Information
Ovostar Union N.V. Annual Report 2015 | 104
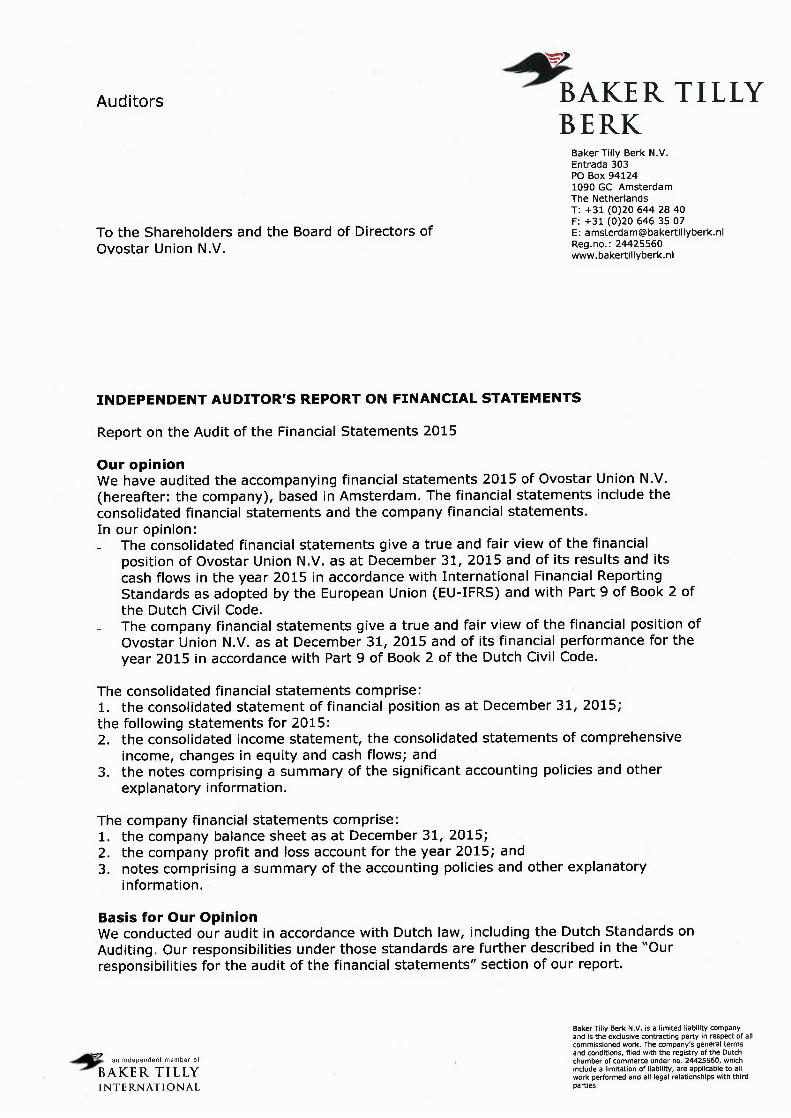
Auditors ~AKER TILLYBERK
To the Shareholders and the Board of Directors ofOvostar Union N.V.
Baker Tilly Berk N.V.Entrada 303PO Box 941241090 GC AmsterdamThe NetherlandsT: +31 (0)20 644 28 40F: +31 (0)20 646 35 07E: [email protected]. : 24425560www.bakertillyberk.nl
INDEPENDENT AUDITOR'S REPORT ON FINANCIAL STATEMENTS
Report on the Audit of the Financial Statements 2015
Our opinionWe have audited the accompanying financial statements 2015 of Ovostar Union N.V.(hereafter: the company), based in Amsterdam. The financial statements include theconsolidated financial statements and the company financial statements.In our opinion:
The consolidated financial statements give a true and fair view of the financialposition of Ovostar Union N.V. as at December 31, 2015 and of its results and itscash flows in the year 2015 in accordance with International Financial ReportingStandards as adopted by the European Union (EU-IFRS) and with Part 9 of Book 2 ofthe Dutch Civil Code.The company financial statements give a true and fair view of the financial position ofOvostar Union N.V. as at December 31, 2015 and of its flnanclal performance for theyear 2015 in accordance with Part 9 of Book 2 of the Dutch Civil Code.
The consolidated financial statements comprise:1. the consolidated statement of financial position as at December 31, 2015;the following statements for 2015:2. the consolidated income statement, the consolidated statements of comprehensive
income, changes in equity and cash flows; and3. the notes comprising a summary of the significant accounting policies and other
explanatory information.
The company financial statements comprise:1. the company balance sheet as at December 31, 2015;2. the company profit and loss account for the year 2015; and3. notes comprising a summary of the accounting policies and other explanatory
information.
Basis for Our OpinionWe conducted our audit in accordance with Dutch law, including the Dutch Standards onAuditing. Our responsibilities under those standards are further described in the "Ourresponsibilities for the audit of the financial statements" section of our report.
• an independent member of
BAKER TILLYINTERNATIONAL
Baker Tilly Berk N.V. is a limited liability companyand is the exclusive contracting party in respect of allcommissioned work. The company's general termsand conditions, filed with the registry of the Dutchchamber of commerce under no. 24425560, whichinclude a limitation of liability, are applicable to allwork performed and all legal relationships with thirdparties.

Auditors ~AKER TILLYBERK
We are independent of Ovostar Union N.V. in accordance with the "Verordening inzakede Onafhankelijkheid van accountants bij assurance-opdrachten" (Via) and otherrelevant independence regulations in the Netherlands. Furthermore we have compliedwith the Verordening gedrags- en beroepsregels accountants (VGBA).We believe the audit evidence we have obtained is sufficient and appropriate to providea basis for our opinion.
MaterialityMisstatements can arise from fraud or error and will be considered material if,individually or in the aggregate, they could reasonably be expected to influence theeconomic decisions of users taken on the basis of these financial statements. Themateriality affects the nature, timing and extent of our audit procedures and theevaluation of the effect of identified misstatements on our opinion.Based on our professional judgement we determined the materiality for the financialstatements as a whole at USD 1 million. The materiality is based on 1.5% of turnover.We have also taken into account misstatements and/or possible misstatements that inour opinion are material for the users of the financial statements for qualitative reasons.We agreed with the Board of Directors that misstatements in excess of USD 0.050million which are identified during the audit, would be reported to them, as well assmaller misstatements that in our view must be reported on qualitative grounds.
Scope of the Group AuditOvostar Union N.V. is at the head of a group of entities. The financial information of thisgroup is included in the consolidated financial statements of Ovostar Union N.V.Because we are ultimately responsible for the opinion, we are also responsible fordirecting, supervising and performing the group audit. In this respect we havedetermined the nature and extent of the audit procedures to be carried out for groupentities. Decisive were, the size and/or risk profile of the group entities or operations. Onthis basis, we selected group entities for which an audit or review had to be carried outon the complete set of financial statements or specific items.
The group audit mainly focused on covering group's activities in Ukraine(llC "Ovostar Union" and its subsidiaries) and also included audit procedures at Dutchholding level (Ovostar Union N.V.)
We have performed audit procedures ourselves at Dutch holding level. When auditingllC "Ovostar Union" and its subsidiaries, we have used the work of other auditors. Asrequired by our professional rules and standards we have issued audit instructions andreviewed the work performed by the local auditors. By performing the proceduresmentioned above at group entities, together with additional procedures at group level,we have been able to obtain sufficient and appropriate audit evidence about the group'sfinancial information to provide an opinion about the consolidated financial statements.
Our Key Audit MattersKey audit matters are those matters that, in our professional judgment, were of mostsignificance in our audit of the financial statements. We have communicated the keyaudit matters to the Board of Directors. The key audit matters are not a comprehensivereflection of all matters discussed.
~ an independent member ol
BAKER TILLYINTERNATIONAL 106/110
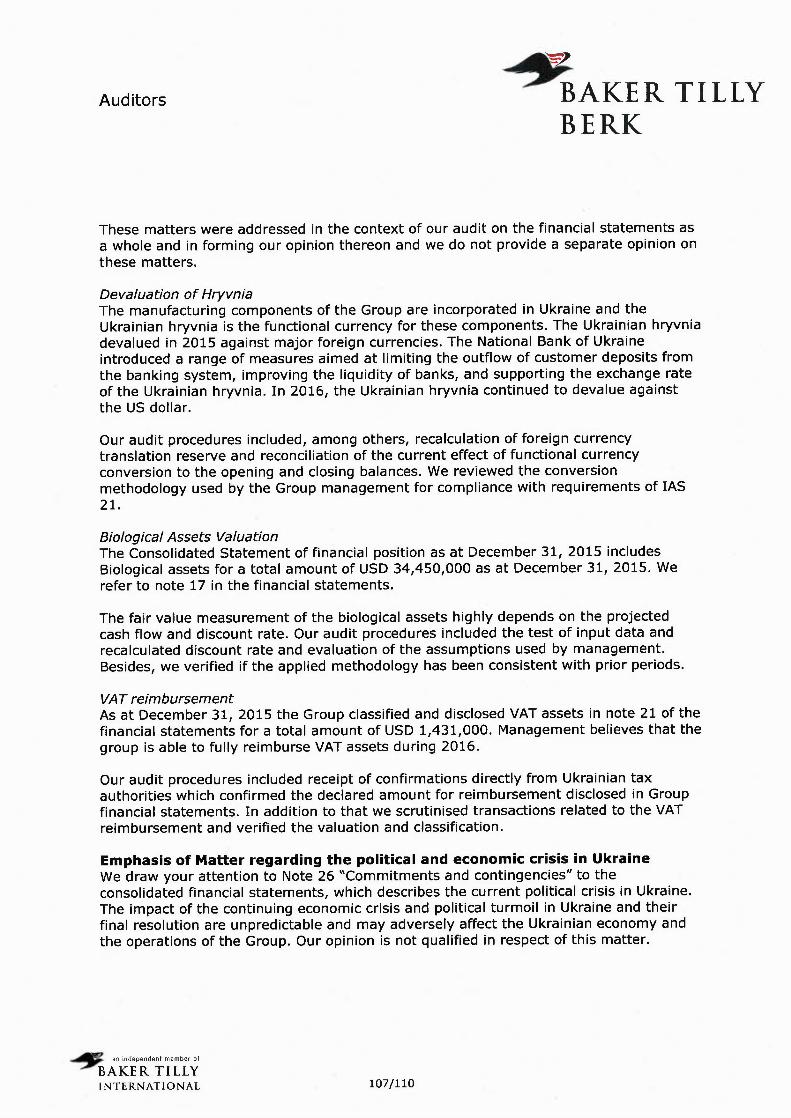
Auditors ~AKER TILLYBERK
These matters were addressed in the context of our audit on the financial statements asa whole and in forming our opinion thereon and we do not provide a separate opinion onthese matters.
Devaluation of HryvniaThe manufacturing components of the Group are incorporated in Ukraine and theUkrainian hryvnia is the functional currency for these components. The Ukrainian hryvniadevalued in 2015 against major foreign currencies. The National Bank of Ukraineintroduced a range of measures aimed at limiting the outflow of customer deposits fromthe banking system, improving the liquidity of banks, and supporting the exchange rateof the Ukrainian hryvnia. In 2016, the Ukrainian hryvnia continued to devalue againstthe US dollar.
Our audit procedures included, among others, recalculation of foreign currencytranslation reserve and reconciliation of the current effect of functional currencyconversion to the opening and closing balances. We reviewed the conversionmethodology used by the Group management for compliance with requirements of lAS21.
Biological Assets ValuationThe Consolidated Statement of financial position as at December 31, 2015 includesBiological assets for a total amount of USD 34,450,000 as at December 31, 2015. Werefer to note 17 in the financial statements.
The fair value measurement of the biological assets highly depends on the projectedcash flow and discount rate. Our audit procedures included the test of input data andrecalculated discount rate and evaluation of the assumptions used by management.Besides, we verified if the applied methodology has been consistent with prior periods.
VAT reimbursementAs at December 31, 2015 the Group classified and disclosed VAT assets in note 21 of thefinancial statements for a total amount of USD 1,431,000. Management believes that thegroup is able to fully reimburse VAT assets during 2016.
Our audit procedures included receipt of confirmations directly from Ukrainian taxauthorities which confirmed the declared amount for reimbursement disclosed in Groupfinancial statements. In addition to that we scrutinised transactions related to the VATreimbursement and verified the valuation and classification.
Emphasis of Matter regarding the political and economic crisis in UkraineWe draw your attention to Note 26 "Commitments and contingencies" to theconsolidated financial statements, which describes the current political crisis in Ukraine.The impact of the continuing economic crisis and political turmoil in Ukraine and theirfinal resolution are unpredictable and may adversely affect the Ukrainian economy andthe operations of the Group. Our opinion is not qualified in respect of this matter.
~ an independent member of
BAKER TILLYINTERNATIONAL 107/110

Auditors ~AKER TILLYBERK
Responsibilities of Management and the Board of Directors for the FinancialStatementsManagement is responsible for the preparation and fair presentation of the financialstatements in accordance with EU-IFRSand Part 9 of Book 2 of the Dutch Civil Code, andfor the preparation of the management board report in accordance with Part 9 of Book 2of the Dutch Civil Code. Furthermore, management is responsible for such internalcontrol as management determines is necessary to enable the preparation of financialstatements that are free from material misstatement, whether due to fraud or error.In preparing the financial statements, management is responsible for assessing thecompany's ability to continue as a going concern. Based on the financial reportingframeworks mentioned, management should prepare the financial statements using thegoing concern basis of accounting unless management either intends to liquidate thecompany or to cease operations, or has no realistic alternative but to do so.Management should disclose events and circumstances that may cast significant doubton the company's ability to continue as a going concern.The Board of Directors is responsible for overseeing the company's financial reportingprocess.
Our Responsibilities for the Audit of the Financial StatementsOur objective is to plan and perform the audit assignment in a manner that allows us toobtain sufficient and appropriate audit evidence for our opinion. Our audit has beenperformed with a high, but not absolute, level of assurance, which means we may nothave detected all errors and fraud.
We have exercised professional judgment and have maintained professional scepticismthroughout the audit, in accordance with Dutch Standards on Auditing, ethicalrequirements and independence requirements.Our audit included e.g.:
identifying and assessing the risks of material misstatement of the financialstatements, whether due to fraud or error, designing and performing auditprocedures responsive to those risks, and obtaining audit evidence that is sufficientand appropriate to provide a basis for our opinion. The risk of not detecting amaterial misstatement resulting from fraud is higher than for one resulting fromerror, as fraud may involve collusion, forgery, intentional omissions,misrepresentations, or the override of internal control;obtaining an understanding of internal control relevant to the audit in order to designaudit procedures that are appropriate in the circumstances, but not for the purposeof expressing an opinion on the effectiveness of the company's internal control;evaluating the appropriateness of accounting policies usedand the reasonableness ofaccounting estimates and related disclosures made by management;concluding on the appropriateness of management's use of the going concern basisof accounting, and based on the audit evidence obtained, whether a materialuncertainty exists related to events or conditions that may cast significant doubt onthe company's ability to continue as a going concern. If we conclude that a materialuncertainty exists, we are required to draw attention in our auditor's report to therelated disclosures in the financial statements or, if such disclosures are inadequate,to modify our opinion. Our conclusions are based on the audit evidence obtained upto the date of our auditor's report. However, future events or conditions may causean the company to cease to continue as a going concern;
• an independent merneer of
BAKER TILLYINTERNATIONAL 108/110
Auditors ~AKER TILLYBERK
evaluating the overall presentation, structure and content of the financial statements,including the disclosures; andevaluating whether the financial statements represent the underlying transactionsand events in a manner that achieves fair presentation.
We communicate with the Board of Directors regarding, among other matters, theplanned scope and timing of the audit and significant audit findings, including anysignificant findings in internal control that we identify during our audit.We provide the Board of Directors with a statement that we have complied with relevantethical requirements regarding independence, and to communicate with them allrelationships and other matters that may reasonably be thought to bear on ourindependence, and where applicable, related safeguards.From the matters communicated with the Board of Directors, we determine thosematters that were of most significance in the audit of the financial statements of thecurrent period and are therefore the key audit matters. We describe these matters in ourauditor's report unless law or regulation precludes public disclosure about the matter orwhen, in extremely rare circumstances, not communicating the matter is in the publicinterest.
Report on Other Legal and Regulatory RequirementsReport on the management board report and the other informationPursuant to legal requirements of Part 9 of Book 2 of the Dutch Civil Code 393 sub 5 at eand f of the Dutch Civil Code (concerning our obligation to report about the managementboard report and other data), we declare that:
We have no deficiencies to report as a result of our examination whether themanagement board report, to the extent we can assess, has been prepared inaccordance with Part 9 of Book 2 of this Code, and whether the information asrequired under Section 2:392 sub 1 at b-h has been annexed.Further we report that the management board report, to the extent we can assess, isconsistent with the financial statements as required by Section 2:391 sub 4 of theDutch Civil Code.
EngagementWe were engaged by the Board of Directors as auditor of Ovostar Union N.V. onOctober 4, 2011, as of the audit for the year 2011 and have operated as statutoryauditor ever since that date.
Amsterdam, April 8, 2016
Baker Tilly Berk N.V.
signed by
J.H.J. Spiekker RAAudit Partner
• an independent member of
BAKER TILLYINTERNATIONAL 109/110

Ovostar Union N.V. Annual Report 2015 | 110
Contact information and list of addresses
OVOSTAR UNION GROUP
Correspondence address:
34 Petropavlivska street, 04086 Kyiv, Ukraine
Legal address:
Ovostar Union N.V.
8 Jan van Goyenkade, 1075 HP Amsterdam, the Netherlands
Number in Trade Register: 52331008
For investor relations inquiries please contact:
Viktoriia Grygorenko
Investor Relations Department
Cell: +38 050 439 05 05
Landline: +38 044 354 29 60
FORWARD-LOOKING STATEMENTS NOTICE
All forward-looking statements contained in this annual report with respect to our future financial and operational performance
and position are, unless otherwise stated, based on the beliefs, expectations, projections and the estimates of our management
representing their judgment as at the dates on which the statements have been made. Forward-looking statements are generally
identifiable by the use of the words “may”, “will”, “should”, “plan”, “forecast”, “expect”, “anticipate”, “estimate”, “believe”,
“intend”, “project”, “goal” or “target” or the negative of these words or other variations on these words or comparable terminolo-
gy. Our actual operational and financial results or the same of our industry involve a number of known and unknown risks, uncer-
tainties and other factors and they are not guaranteed to be similar to the forward-looking statements, although our management
makes all effort to make forward-looking statements as accurate as possible. We do not undertake publicly to update or revise any
forward-looking statement that may be made herein, whether as a result of new information, future events or otherwise.
Management Report
Governance Report
Financial Statements
OTHER INFORMATION